
8
Adolescent Transitions to Adulthood in Reform-Era China
Emily Hannum and Jihong Liu
This chapter traces evidence about adolescents’ pathways into adulthood in China over the past two decades of market reforms, focusing on the realms of education, work, family, and health. We draw together information from policy documents, reports, secondary research, and aggregate and individual-level data from a variety of sources. Evidence shows that on average, the market reform period has benefited many aspects of adolescent and young adult life. Education has increased and adolescent labor has decreased in the reform period. The average age at marriage is high, and rose in the 1990s, enough that marriage is unlikely to compete directly with educational opportunities except at the highest levels of education. Low fertility rates suggest that women’s childrearing responsibilities may compete less with other opportunities in China than in many less developed countries.
The benefits of improved standards of living have been shared across social groups, but social and economic inequalities continue to mark the youth life course. While wealthier urban youth are beginning to experience problems with overnutrition, some rural youth still face nutritional deprivation. Suicide rates are dramatically higher among rural youth and young adults, especially young rural women. Wealthier adolescents and those in urban areas are more likely to be in school than their poor rural counterparts, and thus enjoy significant advantages in a labor market that increasingly rewards credentials. The mark of rural poverty is clear in the elevated likelihood of rural youth participating in the labor force, in the high percentage of working youth employed in agriculture, and in the large-scale youth and young adult migration into urban settings. Finally, social changes
in the reform period raise important concerns about behavioral health issues, especially sexual health and smoking.
THE CHANGING CONTEXT OF ADOLESCENCE IN CHINA
The transition to markets in China in the late 1970s marked the beginning of a political focus on promoting economic modernization and growth. In rural areas, the transition meant decollectivization of agriculture and implementation of the household responsibility system, in which farmland and resources were contracted to individual households whose earnings were linked to output.1 In urban settings, the privatization of state-owned enterprises and the emergence of a labor market were important elements of growth-promoting reforms. Reforms brought unprecedented growth and poverty reduction, but also rising economic inequality and a deteriorating social safety net.2 Reforms in the education and health sectors decentralized administration and finance, increasing the diversity of services and the costs to individuals. Layoffs and unemployment heightened the economic insecurity of urban residents in the wake of labor reforms. Rural residents faced rising costs for education and health in the context of new pressures for self-sufficiency in agriculture.
These changes have dramatically modified the context of adolescence over the past two decades. For many of China’s youth, the market reform period has improved living standards and increased life choices in education, work, and family formation. However, adolescents and young adults face new risks as a result of diversified choices, and disadvantaged groups continue to experience problems characteristic of youth in developing countries, such as difficulty obtaining access to basic nutrition, health, and education. The experiences of China’s youth are significant in the global context, as 18 percent of the world’s 15- to 24-year-old youth reside in China, as do 21 percent of the total youth population in developing countries (see Table 8-1).
This chapter outlines major reform-era patterns and trends in adolescents’ pathways into adulthood, focusing on the realms of education, work, family, and health. The chapter is structured as follows: after briefly intro-
TABLE 8-1 Population of 15- to 24-Year-Olds, 2002
ducing data sources, we discuss educational policies and the changing educational opportunities available to adolescents. Next, we discuss youth employment and the changing economic backdrop in which employment occurs. We then provide an overview of family formation changes, considering marriage and childbearing. Finally, we consider persisting and new health issues facing adolescents. We close the chapter by synthesizing patterns and trends in each of these domains, placing them in the context of broader social changes in reform-era China.
DATA SOURCES
We draw on a variety of sources of information. To document policies, we employ reports and policy documents issued by Chinese government offices and a variety of secondary sources, including English- and Chinese-language analyses of economic and social policy problems in the reform era. To trace patterns and changes empirically, we draw on several sources of aggregate data, including census data from the National Statistical Bureau of China, demographic data from the U.S. Census Bureau International Data Base, education data from the United Nations Educational, Scientific, and Cultural Organization (UNESCO) Institute for Statistics, and education, marriage, and health data from the United Nations Millennium Indicators and the United Nations Common Database. To investigate attitudes about sexuality, we employ tabulated survey data from the 1997 National Reproductive Health Survey (Jiang, 2000). Finally, where possible, we complement aggregate data with our own tabulations of individual-level data on education, employment, and marriage from adolescent and young adult cohorts in the 1989 and 1997 waves of the China Health and Nutrition Survey (CHNS), a multipurpose panel survey conducted by the Chinese Academy of Preventive Medicine and the Institute of Nutrition
and Food Hygiene, in collaboration with the Carolina Population Center at the University of North Carolina.3
EDUCATION
For adolescents, some of the most fundamental shifts in the reform period have occurred in the realm of education. On the eve of market transition in the late 1970s, China’s education system was oriented around the political goal of eliminating class differences in society. With the transition to markets in the late 1970s and early 1980s, the focus shifted to economic modernization, and this new orientation was clearly reflected in educational reforms aimed at efficiently producing an appropriately skilled labor force.4 A complex hierarchy of programs varying in length, quality, curriculum, and financial base supplanted the egalitarian structure of the Cultural Revolution education system. Classrooms moved away from a focus on egalitarianism and class struggle, instead emphasizing quality, competition, individual talents, and the mastery of concepts and skills important in the development of science and technology (Broaded, 1983; Kwong, 1985; Lin, 1993). Vocational education was reinstated, with the intention of making education provide labor market skills and skills relevant to rural living circumstances (Tsang, 2000; UNESCO, 1998). Higher education, shut down completely for 6 years at the start of the Cultural Revolution, was reinvigorated due to recognition of its critical role in supplying the high-level personnel and scientific expertise needed for national development (Tsang, 2000).
Most recently, attention has turned to molding the education system to better stimulate critical thinking and creativity perceived to be necessary for the new economy. Learner-centered teaching approaches and the so-called “quality education” (suzhi jiaoyu) reforms are intended to develop the abilities of the
|
3 |
The CHNS used a multistage, random cluster process to draw a sample from eight geographically diverse provinces, which differ by level of economic development, public resources, and |health indicators. The provinces covered were Liaoning, Jiangsu, Shandong, Henan, Hubei, Hunan, Guangxi, and Guizhou in 1989. Liaoning was replaced by Heilongjiang in 1997. Counties in each of these eight provinces were stratified by income level and randomly selected based on a weighted sampling scheme. In addition, the provincial capital and a lower income city were selected. Villages and townships within the counties and urban and suburban neighborhoods within the cities were selected randomly. Overall, the sample consisted of 32 urban neighborhoods, 30 suburban neighborhoods, 32 towns, and 96 villages. For more details, see http://www.cpc.unc.edu/projects/china/. In this study, we excluded Liaoning (in 1989) and Heilongjiang (in 1997) from the analysis. |
|
4 |
Education laws continue to exhibit this orientation. The Education Law of 1995 and the Education Plan for the 21st Century of 1999 confirmed the priority placed on education as a strategic area for social and economic development (UNESCO, 1998; Ministry of Education, 1999). |
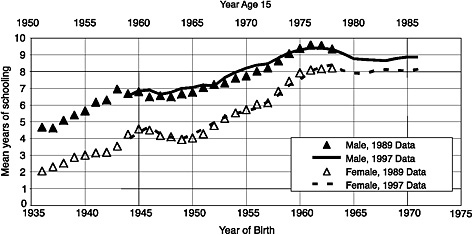
FIGURE 8-1 Mean years of schooling by birth year, 25- to 54-year-olds, China Health and Nutrition Survey, 1989 and 1997.
whole child, and to stimulate critical learning (Tsang, 2000). Additional reforms designed to develop locally relevant curriculum are also under way.
Educational opportunities have increased dramatically in the years since the establishment of the People’s Republic in 1949. Using data from the 1989 and 1997 China Health and Nutrition Surveys, Figure 8-1 shows mean years of education by birth year for men and women ages 25 to 54 in both years.5 The year that each cohort would have reached age 15 is also labeled on the graph. The figure shows dramatic increases in mean years of schooling for men and women reaching age 15 through the latter years of the Cultural Revolution in the mid- to late 1970s. For example, mean years of schooling for women rose from about 2 years for women age 15 in 1951 to more than 8 years for those age 15 in 1978. Cohorts coming of age in the early years of market transition experienced slight dropoffs in years of schooling. This downturn is not fully understood, but often attributed to some combination of push factors—shutdowns of low-quality rural junior high schools as part of the upgrading that occurred in the early reform years and rising educational costs—and pull factors—the new economic opportunities that followed agricultural decollectivization in the reform period (see Hannum, 1999a and 1999b, for discussion).
Following the downturn in the early 1980s, the reform period has seen an expansion of educational access. Table 8-2 shows aggregate educational
indicators that extend further into the reform period. Panel A shows gross enrollment ratios, or total enrollment in a level of education, regardless of age, expressed as a percentage of children in the officially-designated age range corresponding to that level of education in a given school year. At the primary level, gross enrollment ratios are over 100 throughout the reform period for girls and boys. At the secondary level, enrollment ratios were around 54 for boys and 37 for girls in 1980, around the time of the start of reforms. Consistent with Figure 8-1, ratios dropped through the mid-1980s. However, by the mid-1980s, the downturn ended. By 1997, enrollment ratios were 74 percent for boys and 66 percent for girls. Tertiary enrollment ratios have expanded since 1980, from 2.5 percent for boys and 0.8 percent for girls in 1980, to 7.3 percent for boys and 3.9 percent for girls in 1996.
Although gross enrollment ratios are useful for temporal and gender comparisons, they do not have clear implications regarding levels of education, because of the lack of consistence of numerators and denominators.6 Other measures not plagued by this problem similarly show rising access to education for adolescents after the mid-1980s. From 1988 to 1995, primary to secondary transition ratios rose from 62 percent to 88 percent, with girls only about 3 to 4 percentage points behind boys (see Table 8-2, Panel B). In 1987, only 3 percent of male youth ages 15 to 24 were illiterate, compared to nearly 1 in 10 female youth. By 2001, only 0.8 percent of male youth and 3.3 percent of female youth remained illiterate (see Table 8-2, Panel C).
Data from the China Health and Nutrition Survey also indicate improvements in the 1990s in adolescents’ access to schooling. Focusing on CHNS adolescents, among those who were 12 to 18 years old in 1989, 61.0 percent of males and 55.9 percent of females were enrolled in school (see Table 8-3). By 1997, the figures were 74.6 percent for males and 74.2 percent for females. Average years of school completed were also greater in the 1997 sample cohorts than in the 1989 sample cohorts (see Table 8-4). In 1989, mean years completed were 7.0 for boys and 6.8 for girls. By 1997, corresponding figures were 8.0 and 8.0.
While the long-term trend has been expansion of access, certain concerns have arisen about social disparities in access, especially to a
TABLE 8-2 Selected National Education Indicators, 1980-2001
|
Year |
A. Gross Enrollment Ratiosa |
B. Transition Ratiosa |
|||||||
|
Primary |
Secondary |
Tertiary |
Primary-Secondary |
||||||
|
Male |
Fem. |
Male |
Fem. |
Male |
Fem. |
Tot. |
Male |
Fem. |
|
|
1980 |
121.0 |
103.7 |
53.9 |
37.4 |
2.5 |
0.8 |
— |
— |
— |
|
1981 |
122.5 |
102.4 |
46.7 |
31.7 |
2.7 |
0.9 |
— |
— |
— |
|
1982 |
124.2 |
102.5 |
42.7 |
29.3 |
— |
— |
— |
— |
— |
|
1983 |
125.6 |
103.9 |
41.9 |
29.1 |
2.7 |
1.0 |
— |
— |
— |
|
1984 |
130.8 |
108.5 |
43.6 |
30.9 |
3.2 |
1.3 |
— |
— |
— |
|
1985 |
132.0 |
113.9 |
46.3 |
32.6 |
3.9 |
1.7 |
— |
— |
— |
|
1986 |
134.0 |
117.5 |
48.8 |
35.9 |
4.1 |
1.9 |
— |
— |
— |
|
1987 |
134.0 |
118.9 |
51.3 |
37.9 |
4.0 |
2.0 |
— |
— |
— |
|
1988 |
133.3 |
119.8 |
52.0 |
38.8 |
3.9 |
2.0 |
62.3 |
— |
— |
|
1989 |
132.2 |
120.7 |
52.8 |
39.0 |
3.9 |
2.0 |
67.8 |
— |
— |
|
1990 |
129.6 |
120.3 |
55.3 |
41.7 |
3.9 |
2.0 |
70.2 |
— |
— |
|
1991 |
125.7 |
118.5 |
58.1 |
45.2 |
3.8 |
2.0 |
75.3 |
— |
— |
|
1992 |
121.9 |
115.8 |
61.1 |
48.5 |
4.0 |
2.1 |
74.2 |
— |
— |
|
1993 |
119.1 |
114.5 |
61.6 |
51.7 |
5.0 |
2.6 |
78.8 |
80.4 |
76.9 |
|
1994 |
118.3 |
115.2 |
65.2 |
56.4 |
— |
— |
87.6 |
89.0 |
86.0 |
|
1995 |
118.3 |
116.6 |
69.5 |
61.8 |
— |
— |
87.9 |
89.4 |
86.3 |
|
1996 |
120.0 |
119.6 |
72.5 |
65.1 |
7.3 |
3.9 |
— |
— |
— |
|
1997 |
122.5 |
123.0 |
73.7 |
66.2 |
— |
— |
— |
— |
— |
|
1998 |
— |
— |
— |
— |
— |
— |
— |
— |
— |
|
1999 |
— |
— |
— |
— |
— |
— |
— |
— |
— |
|
2000 |
— |
— |
— |
— |
— |
— |
— |
— |
— |
|
2001 |
— |
— |
— |
— |
— |
— |
— |
— |
— |
|
aUNESCO, Institute of Statistics (2002). bUnited Nations Millennium Indicators (2002). cUNESCO, Institute of Statistics (2002). |
|||||||||
high-quality education. These concerns are in large part attributable to changes in education finance in the reform period. Major components of reform era education policy were the decentralization of the administration and finance of primary, secondary, and tertiary education and the privatization of costs (Lofstedt, 1990; Tsang, 2000). Currently, the central government runs and finances certain institutions of higher education; more typically, provincial, county, township, and village governments respectively take responsibility for schools at the tertiary, upper secondary, lower secondary, and primary levels (Tsang, 2000, p. 13). This finance structure has increased the regional disparities in funding
|
C. Literacy Ratesb |
|
D. Program Typec |
||||||
|
Ages 15-24 |
Secondary: % in: |
Tertiary: % in: |
||||||
|
Male |
Fem. |
Gen. Educ. |
Educ. |
Humanities |
Soc. Sci. |
Nat. Sci. |
Med. Sci. |
Other |
|
— |
— |
97.0 |
29.3 |
5.7 |
3.7 |
48.2 |
12.3 |
0.8 |
|
— |
— |
96.9 |
24.9 |
6.0 |
4.5 |
51.2 |
12.4 |
0.9 |
|
— |
— |
96.3 |
24.6 |
5.8 |
6.1 |
48.5 |
14.2 |
0.8 |
|
— |
— |
93.8 |
25.4 |
6.2 |
7.4 |
48.6 |
11.6 |
0.8 |
|
— |
— |
92.5 |
25.1 |
7.0 |
8.8 |
48.0 |
10.3 |
0.8 |
|
— |
— |
91.1 |
23.8 |
8.2 |
10.6 |
46.7 |
9.3 |
1.4 |
|
— |
— |
90.4 |
24.4 |
7.7 |
11.2 |
46.8 |
9.2 |
0.7 |
|
97.0 |
90.2 |
89.9 |
24.7 |
6.7 |
11.2 |
47.3 |
9.4 |
0.7 |
|
97.2 |
90.8 |
88.8 |
24.6 |
6.4 |
12.0 |
46.9 |
9.4 |
0.7 |
|
97.3 |
91.3 |
87.9 |
24.6 |
6.1 |
12.4 |
46.5 |
9.7 |
0.7 |
|
97.4 |
91.9 |
87.5 |
24.3 |
5.8 |
12.6 |
46.8 |
9.9 |
0.7 |
|
97.6 |
92.4 |
87.2 |
24.5 |
5.6 |
12.5 |
46.8 |
10.0 |
0.6 |
|
97.8 |
92.9 |
86.6 |
24.2 |
5.7 |
13.1 |
46.6 |
9.8 |
0.6 |
|
98.0 |
93.4 |
85.3 |
22.8 |
7.5 |
25.1 |
36.9 |
7.1 |
0.6 |
|
98.2 |
94.0 |
84.5 |
16.4 |
6.4 |
9.4 |
53.2 |
8.9 |
5.6 |
|
98.4 |
94.5 |
84.2 |
— |
— |
— |
— |
— |
— |
|
98.5 |
94.9 |
84.1 |
— |
— |
— |
— |
— |
— |
|
98.7 |
95.3 |
83.7 |
— |
— |
— |
— |
— |
— |
|
98.8 |
95.7 |
— |
— |
— |
— |
— |
— |
— |
|
99.0 |
96.1 |
— |
— |
— |
— |
— |
— |
— |
|
99.1 |
96.5 |
— |
— |
— |
— |
— |
— |
— |
|
99.2 |
96.7 |
— |
— |
— |
— |
— |
— |
— |
for schools, and has increased family educational expenditures needed even for compulsory education.7
Government concerns about these problems are evident in equity-oriented policies instigated throughout the reform period. For example, although implementation was tied to regional economic development levels, the Law on Compulsory Education of 1986 designated 9 years of education—6 years of primary
TABLE 8-3 Enrollment Rates,a Youth Ages 12-18
|
Characteristic |
1989 |
1997 |
||||||
|
N |
Male |
Female |
P-Value |
N |
Male |
Female |
P-Value |
|
|
Total |
1,991 |
61.0 |
55.9 |
0.02 |
1,494 |
74.6 |
74.2 |
NS |
|
Age |
|
|||||||
|
12-13 |
522 |
93.1 |
92.7 |
NS |
413 |
96.2 |
96.0 |
NS |
|
14-15 |
582 |
77.4 |
68.9 |
0.02 |
442 |
85.9 |
83.5 |
NS |
|
16-17 |
581 |
38.3 |
31.3 |
NS |
407 |
64.7 |
58.9 |
NS |
|
18 |
306 |
17.2 |
16.1 |
NS |
232 |
33.9 |
42.9 |
NS |
|
P-value |
|
0.00 |
0.00 |
|
|
0.00 |
0.00 |
|
|
Urban-rural residence |
|
|||||||
|
Urban |
465 |
68.5 |
62.6 |
NS |
406 |
84.1 |
82.8 |
NS |
|
Rural |
1,525 |
58.7 |
53.9 |
NS |
1,088 |
71.0 |
71.1 |
NS |
|
P-value |
|
0.01 |
0.02 |
|
|
0.00 |
0.00 |
NS |
|
Household head’s education |
|
|||||||
|
None |
374 |
51.1 |
43.6 |
NS |
134 |
63.4 |
59.6 |
NS |
|
Primary |
940 |
58.5 |
55.2 |
NS |
511 |
70.6 |
68.2 |
NS |
|
Junior high |
509 |
67.9 |
61.1 |
NS |
544 |
75.8 |
78.4 |
NS |
|
Senior high+ |
160 |
74.7 |
75.4 |
NS |
285 |
88.7 |
83.3 |
NS |
|
P-value |
|
0.00 |
0.00 |
|
|
0.00 |
0.00 |
|
|
Number of consumer items ownedb |
|
|||||||
|
Missing |
54 |
83.3 |
58.3 |
0.04 |
40 |
88.0 |
80.0 |
NS |
|
Lowest quartile |
409 |
54.4 |
49.7 |
NS |
338 |
69.1 |
60.5 |
NS |
|
2nd quartile |
665 |
56.7 |
50.2 |
NS |
480 |
70.6 |
69.4 |
NS |
|
3rd quartile |
588 |
64.8 |
60.6 |
NS |
281 |
74.8 |
81.5 |
NS |
|
Highest quartile |
275 |
70.3 |
67.2 |
NS |
355 |
83.3 |
87.2 |
NS |
|
P-value |
|
0.00 |
0.00 |
|
|
0.01 |
0.00 |
|
|
School-age children in householdc |
|
|||||||
|
One |
361 |
44.4 |
48.7 |
NS |
468 |
71.4 |
74.5 |
NS |
|
Two |
795 |
65.0 |
54.9 |
0.004 |
654 |
76.0 |
74.2 |
NS |
|
Three or more |
835 |
65.5 |
59.3 |
NS |
372 |
77.1 |
73.9 |
NS |
|
P-value |
|
0.00 |
NS |
|
|
NS |
NS |
|
|
Province |
|
|||||||
|
Jiangsu |
205 |
62.8 |
61.3 |
NS |
145 |
75.0 |
81.5 |
NS |
|
Shandong |
218 |
63.1 |
51.3 |
NS |
185 |
81.4 |
68.2 |
0.04 |
|
Henan |
321 |
58.7 |
45.6 |
0.02 |
202 |
67.6 |
77.3 |
NS |
|
Hubei |
249 |
67.7 |
52.8 |
0.02 |
231 |
71.8 |
72.9 |
NS |
|
Hunan |
249 |
62.9 |
66.7 |
NS |
232 |
77.9 |
75.2 |
NS |
|
Guangxi |
310 |
55.9 |
55.0 |
NS |
264 |
75.7 |
74.2 |
NS |
|
Guizhou |
438 |
59.8 |
59.8 |
NS |
235 |
73.2 |
72.2 |
NS |
|
P-value |
|
NS |
0.01 |
|
|
NS |
NS |
|
|
Relationship to household head |
|
|||||||
|
Own child |
1,858 |
60.9 |
55.7 |
0.02 |
1,382 |
73.7 |
73.8 |
NS |
|
Otherd |
133 |
62.9 |
59.2 |
NS |
106 |
86.4 |
80.9 |
NS |
|
P-value |
|
NS |
NS |
|
|
0.03 |
NS |
|
|
aCalculations were based on the question, “Are you currently in school?” bBoth the 1989 and 1997 surveys asked, “Does your household or do any household members own the following electrical appliances or other goods?” To reflect economic changes over time in China, several new items were added in the 1997 survey. Regardless of small differences in the lists of consumer items in the two waves, we summed up the ownership of all items for each household, then grouped all households into quartiles. cThis refers to the number of children who are under 18 years old at survey date in each household. dOthers include grandchildren, siblings, other relatives, and other nonrelatives (one “spouse” was included in 1989). NOTE: NS: P-values are not significant at 0.05 level. P-values are results from chi-squared tests of independence. P-values listed to the right of enrollment rates result from tests of gender by enrollment (within categories of the listed characteristic, if applicable). P-values listed below enrollment rates are within-gender chi-square tests of enrollment by the listed characteristic. SOURCE: China Health and Nutrition Survey. |
||||||||
TABLE 8-4 Average Years of School Completed,a Youth Ages 12-18
|
Characteristic |
1989 |
1997 |
||||||||
|
Male |
Female |
Male |
Female |
|||||||
|
Mean |
SD |
Mean |
SD |
P-Value |
Mean |
SD |
Mean |
SD |
P-Value |
|
|
Total |
7.0 |
2.2 |
6.8 |
2.6 |
0.01 |
8.0 |
2.2 |
8.0 |
2.2 |
NS |
|
Age |
|
|||||||||
|
12-13 |
5.4 |
1.6 |
5.6 |
1.7 |
NS |
6.2 |
1.4 |
6.3 |
1.4 |
NS |
|
14-15 |
7.1 |
1.7 |
6.6 |
2.5 |
0.01 |
8.1 |
1.4 |
7.9 |
1.7 |
NS |
|
16-17 |
7.9 |
2.2 |
7.6 |
2.5 |
NS |
9.1 |
1.9 |
9.0 |
1.9 |
NS |
|
18 |
7.9 |
2.5 |
7.4 |
3.2 |
NS |
9.3 |
2.7 |
9.4 |
2.4 |
NS |
|
P-value |
|
0.00 |
|
0.00 |
|
|
0.00 |
|
0.00 |
|
|
Urban-rural residence |
|
|||||||||
|
Urban |
7.9 |
2.1 |
8.2 |
2.1 |
NS |
8.4 |
2.3 |
8.7 |
2.2 |
NS |
|
Rural |
6.7 |
2.1 |
6.3 |
2.5 |
0.00 |
7.9 |
2.2 |
7.8 |
2.1 |
NS |
|
P-value |
|
0.00 |
|
0.00 |
|
|
0.00 |
|
0.00 |
|
|
Household head’s education |
|
|||||||||
|
None |
6.5 |
2.4 |
6.2 |
2.9 |
NS |
7.6 |
2.7 |
7.2 |
2.5 |
NS |
|
Primary |
6.8 |
2.1 |
6.6 |
2.4 |
NS |
8.0 |
2.1 |
7.8 |
2.2 |
NS |
|
Junior high |
7.3 |
2.0 |
6.9 |
2.5 |
NS |
8.0 |
2.2 |
8.2 |
2.0 |
NS |
|
Senior high+ |
8.3 |
2.1 |
8.2 |
2.3 |
NS |
8.3 |
2.1 |
8.5 |
2.1 |
NS |
|
P-value |
|
0.00 |
|
0.00 |
|
|
NS |
|
0.00 |
|
|
Number of consumer items owned |
|
|||||||||
|
Missing |
6.8 |
2.3 |
6.4 |
2.2 |
NS |
7.2 |
2.2 |
8.7 |
3.3 |
NS |
|
Lowest quartile |
6.2 |
2.2 |
5.2 |
2.7 |
0.00 |
7.4 |
2.3 |
6.9 |
2.1 |
NS |
|
2nd quartile |
6.8 |
2.0 |
6.3 |
2.5 |
0.00 |
7.9 |
2.1 |
7.8 |
2.0 |
NS |
|
3rd quartile |
7.5 |
2.0 |
7.5 |
2.2 |
NS |
8.3 |
2.0 |
8.5 |
2.0 |
NS |
|
Highest quartile |
8.2 |
2.1 |
8.3 |
2.0 |
NS |
8.7 |
2.3 |
8.9 |
1.9 |
NS |
|
P-value |
|
0.00 |
|
0.00 |
|
|
0.00 |
|
0.00 |
|
and 6 years of lower secondary—as compulsory for all children (Ministry of Education, 1986). The 1999 Action Plan for Revitalizing Education in the 21st Century confirmed a commitment to implementing compulsory education across the country (Ministry of Education, 1999). A more recent campaign to pour development money into the western interior part of the country, where poverty is concentrated, took education as an important element (State Council, 2000).
What does evidence suggest about the effectiveness of reform-era policies designed to help education reach disadvantaged members of society? On the one hand, the rising enrollments and increasing rates of primary-secondary transition presented in Table 8-2 suggest, with the exception of the early 1980s, an overall trend of increasing inclusiveness. However, certain caveats to this conclusion exist. Earlier research indicates that significant gaps in access to schooling persisted through the early 1990s across lines of socioeconomic status, gender, and urban-rural residence status (Hannum, 1999a, 2002a, 2002b, 2003).
More recent data from the China Health and Nutrition Survey suggest that some of these disparities persisted through the 1990s, while others narrowed. For example, while enrollment rates have risen for both urban and rural residents, the premium on urban residence persists. Urban-rural differences in enrollment were statistically significant in both years: in 1989, 53.9 percent of rural girls were enrolled, compared to 62.6 percent of urban girls. In 1997, figures were 71.1 and 82.8 (see Table 8-3). For boys, the rural enrollment rate in 1989 was 58.7 percent, compared to 68.5 percent for urban boys; in 1997, rural and urban enrollment rates were 71.0 and 84.1 percent. Bivariate tests also showed significant urban-rural differences in average years of schooling in both years (see Table 8-4). Multivariate analyses controlling for demographic and family background factors and province of residence confirm the premium on urban residence for enrollment in both years (see Table 8-5). Multivariate analyses indicated no change in the enrollment advantage associated with urban residence, but offered evidence of a diminished years-of-schooling advantage for urban residents, once other socioeconomic background characteristics were taken into account.
Socioeconomic differences in enrollment are striking. Tables 8-3 and 8-4 illustrate socioeconomic gaps with a possession index and with parent’s level of education.8 For boys, the possession index measure shows differ-
TABLE 8-5 Logistic Regressions of Enrollment and Linear Regressions of Years of Education, China Health and Nutrition Survey, 1989 and 1997 Samples
|
|
Enrollment |
Years of Education |
||||
|
1989 |
1997 |
Combined |
1989 |
1997 |
Combined |
|
|
Age, in years |
−1.452 (2.24)a |
−0.871 (1.11) |
−1.381 (2.69)b |
3.136 (7.90)b |
3.546 (9.43)b |
3.394 (12.21)b |
|
Age squared |
0.020 (0.96) |
0.004 (0.16) |
0.019 (1.14) |
−0.090 (6.72)b |
−0.098 (7.67)b |
−0.096 (10.22)b |
|
Year indicator (ref.: 1989) 1997 |
|
|
0.460 (1.35) |
|
|
1.203 (4.35)b |
|
Female (ref.: male) |
−0.299 (2.51)a |
−0.056 (0.36) |
−0.295 (2.55)a |
−0.262 (2.78)b |
0.065 (0.78) |
−0.263 (2.77)b |
|
Year female |
|
|
0.213 (1.08) |
|
|
0.318 (2.50)a |
|
Urban (ref.: rural) |
0.458 (2.48)a |
0.507 (2.60)b |
0.388 (2.25)a |
0.795 (6.15)b |
0.186 (1.77) |
0.731 (5.77)b |
|
Year urban |
|
|
0.179 (0.70) |
|
|
−0.533 (3.28)b |
|
Household head’s education (ref.: none) |
|
|||||
|
Primary |
0.329 (1.88) |
0.649 (2.24)a |
0.366 (2.14)a |
0.437 (2.75)b |
0.499 (2.22)a |
0.499 (3.11)b |
|
Junior high |
0.628 (2.95)b |
0.782 (2.58)b |
0.647 (3.11)b |
0.722 (4.12)b |
0.793 (3.46)b |
0.810 (4.60)b |
|
Senior high+ |
1.132 (4.04)b |
1.178 (3.50)b |
1.137 (4.13)b |
1.089 (5.23)b |
0.828 (3.51)b |
1.159 (5.56)b |
|
|
Enrollment |
Years of Education |
||||
|
1989 |
1997 |
Combined |
1989 |
1997 |
Combined |
|
|
Interaction terms between year and household head’s education |
|
|||||
|
Year primary |
|
|
0.168 (0.52) |
|
|
−0.120 (0.47) |
|
Year junior high |
|
|
−0.001 (0.00) |
|
|
−0.194 (0.73) |
|
Year senior high |
|
|
−0.102 |
|
|
−0.499 |
|
Number of consumer items owned (ref.: lowest quartile) |
|
|
(0.24) |
|
|
(1.70) |
|
Second quartile |
0.104 (0.53) |
0.462 (2.21)a |
0.122 (0.65) |
0.551 (3.47)b |
0.554 (3.57)b |
0.532 (3.32)b |
|
Third quartile |
0.517 (2.41)a |
0.810 (3.25)b |
0.529 (2.57)a |
1.210 (7.15)b |
0.915 (5.70)b |
1.200 (7.10)b |
|
Highest quartile |
0.785 (2.88)b |
1.183 (4.30)b |
0.755 (2.87)b |
1.685 (8.48)b |
1.125 (6.56)b |
1.633 (8.33)b |
|
Interaction terms between year and number of consumer items owned |
|
|||||
|
Year second |
|
|
0.316 (1.17) |
|
|
0.042 (0.20) |
|
Year third |
|
|
0.277 (0.90) |
|
|
−0.254 (1.16) |
|
Year highest |
|
|
0.471 (1.33) |
|
|
−0.430 (1.77) |
|
School−age children in household (ref.: one) |
|
|||||
|
Two |
0.172 (1.01) |
−0.094 (0.52) |
0.029 (0.24) |
−0.001 (0.01) |
−0.361 (3.17)b |
−0.189 (2.10)a |
|
Three or more |
0.276 (1.47) |
−0.065 (0.27) |
0.116 (0.80) |
−0.405 (2.54)a |
−0.641 (4.24)b |
−0.540 (4.79)b |
|
Relationship to household head (ref.: other) |
|
|||||
|
Own child |
0.095 (0.36) |
−0.479 (1.24) |
−0.094 (0.44) |
0.093 (0.53) |
−0.400 (2.21)a |
−0.088 (0.66) |
|
Province (ref.: Jiangsu) |
|
|||||
|
Shandong |
−0.407 (1.50) |
−0.367 (1.07) |
−0.359 (1.72) |
−0.707 (2.98)b |
0.242 (1.10) |
−0.280 (1.59) |
|
Henan |
−0.378 (1.66) |
−0.588 (1.84) |
−0.446 (2.44)a |
−0.284 (1.43) |
0.273 (1.28) |
−0.079 (0.51) |
|
Hubei |
−0.221 (0.88) |
−0.463 (1.47) |
−0.304 (1.57) |
−0.143 (0.72) |
0.397 (1.90) |
0.097 (0.63) |
|
Hunan |
0.015 (0.06) |
−0.521 (1.70) |
−0.197 (1.04) |
−0.008 (0.04) |
0.307 (1.47) |
0.108 (0.72) |
|
Guangxi |
−0.362 (1.46) |
−0.818 (2.54)a |
−0.533 (2.75)b |
−0.161 (0.75) |
−0.254 (1.32) |
−0.245 (1.58) |
|
Guizhou |
−0.049 (0.21) |
−0.093 (0.28) |
−0.062 (0.32) |
−0.547 (2.65)b |
−0.199 (0.85) |
−0.405 (2.41)a |
|
Constant |
17.125 (3.44)b |
13.282 (2.18)a |
16.688 (4.19)b |
−20.540 (7.06)b |
−23.487 (8.45)b |
−22.895 (11.14)b |
|
Observations |
1,929 |
1,428 |
3,357 |
1,924 |
1,488 |
3,412 |
|
R−square |
|
0.32 |
0.45 |
0.40 |
||
|
ap < 0.05. bp < 0.01. NOTE: Z-statistics in parentheses. |
||||||
ences in enrollment rates between those in the bottom and top quartiles of about 16 percentage points in 1989 and 14 points in 1997. For girls, the difference was about 18 percent in 1989 and about 27 percentage points in 1997. Similarly striking were enrollment gaps between children of parents with a high school or better educational attainment and children of parents with less than a primary school educational attainment. For boys, these gaps were 24 percent in 1989 and 25 percent in 1997; for girls, corresponding figures were 32 percent and 24 percent. The gap between wealthiest and poorest youth in mean years of schooling is also highly significant in both waves of the survey, with a gap between lowest and highest quartiles of 1.3 years for boys and a full 2 years for girls in 1997. Differences in mean years of schooling by parental education were significant for both genders in 1989 and for girls in 1997.
Multivariate analyses indicate that both socioeconomic status measures significantly predict enrollment and years of school completed in both survey years, net of other child and family background factors and provincial controls (see Tables 8-4 and 8-5). A lack of significant interactions between the possession index and time, or the parental education variables and time, suggests that there was not a marked weakening of the relationship between socioeconomic status and enrollment or years of schooling between 1989 and 1997.9
Finally, an overall male advantage in enrollment and years of schooling, significant for youth cohorts in 1989, was insignificant among youth cohorts in 1997 (see Tables 8-3 and 8-4). Multivariate analyses confirm these results (see Table 8-5). Specifically, for enrollment and years of schooling, models using 1989 data alone showed gender differences, while the model using 1997 data alone failed to show significant gender effects. The combined model testing interactions between gender and time indicated a significant narrowing of the gender gap for years of schooling; in the enrollment models, the coefficient marking the interaction of gender and time was in the same direction, but failed to achieve significance.
In interpreting these results, it is important to recognize that past studies using nationally representative samples have suggested that gender inequalities in access to schooling are tied to region and poverty in China, and thus the CHNS data cannot be regarded as fully representative of the scope of gender disparities in China as a whole. Lack of coverage of the impoverished and culturally distinct northwest may influence the portrait of gender
disparities. However, the declining gender gap is consistent with the national data presented in Table 8-2 and with other national data showing rising female participation in primary, secondary, and tertiary education, and a long-term decline in the gender gap, especially after the mid-1980s (Hannum, 1999b, 2002b).
It is important to note that although access is improving as more youth enter secondary school, they face an increasingly diverse mix of experiences within the school system. One reason is rising quality differences associated with the new diversity in finance discussed above. However, diversification has emerged in other ways. For example, at the secondary level, vocationalization is evident in the declining proportion of secondary students in general education, from 97 percent of secondary students in 1980 to 84 percent of secondary students in 1997 (see Table 8-2, Panel D). The current rounds of curriculum reforms, aimed at making curriculum more locally relevant and stimulating discussion and critical thinking in the classroom, are likely to further diversify the experiences of children in the classroom, albeit in ways that are difficult to empirically evaluate (Cheng, 2003).
For those youth who make it to the tertiary level, some aspects of opportunity have remained stable, at least through the mid-1990s.10 In terms of the broad fields of study, students are most likely to enroll in natural sciences (53.2 percent of tertiary students in 1994), followed by education (16.4 percent of tertiary students in 1994); the predominance of these two fields has not changed over the course of the reform period (see Table 8-2, Panel D). Social sciences, which were reinstated only in the reform period, have attracted increasing numbers of students in recent years.
However, opportunity structures in higher education are changing in ways that parallel the discussion above for secondary schooling. On the one hand, overall access to higher education is expanding (see Table 8-2, Panel A). This expansion can be attributed in part to government policies expanding public university slots, and in part to the proliferation of private tertiary-level institutions (Cheng, 2003; Lin, 2003). Yet, although overall access is rising, it is likely that the social composition of those who can avail themselves of higher education is changing. Increasing private costs associated with higher education, in both the public and growing private sectors, give an increasing edge at the margins to those who can pay. Furthermore, the diversification of higher education finance also implies increasing diversity of educational quality among tertiary-level students. This issue is present even within the public sector, where recent policy initiatives have targeted a
select few leading universities in China for dramatic increases in funding,11 with an eye to creating world-class universities (Cheng, 2003).
Overall, adolescents and youth in China have seen a general increase in educational opportunity since the mid-1980s. Evidence suggests that all social groups are benefiting from educational expansions, though important social differences in access persist. At the same time, new qualitative differences in the school system mean that experiences in school, and their implications for labor market opportunities, are increasingly diverging.12
ECONOMY AND LABOR
Linked to educational changes are changes in youth labor force participation. Little information is available about the nature of youth labor force participation prior to market transition. However, it is clear that many economic policies associated with market transition have direct implications for the choices that adolescents make about economic activities. First, market reforms themselves dramatically changed the economic context in which youth function. In rural areas, widespread adoption of the household responsibility system in the early 1980s improved the wealth of the agricultural population. Similarly, privatization of state-owned enterprises, the rise of township and village enterprises, and the emergence of private enterprise have contributed to a reduction in poverty.
Yet, the new economic opportunities that contributed to poverty reduction were also thought to compete with education, as youth and their families faced higher direct and opportunity costs for schooling in the 1980s. In the 1990s, several regulations were passed that specified regulations on minors and the special protections to be afforded them in the workforce (Regulations on Ending the Use of Child Labor, 1991; Communiqué, 1994; Rules and Regulations Related to the Protection of Children, n.d.).13 Most notably, child labor was mentioned in China’s
National Labor Law, which went into effect in 1995 (SCENPC, 1995, Article 15). The law prohibits employers from hiring workers under 16 years of age and specifies sanctions such as fines and revocation of business licenses for those businesses that hire minors. Laborers between the ages 16 and 18 are barred from engaging in certain forms of physical work, including labor in mines. Ironically, with the abolishment of the job placement system for college graduates in the early 1990s, the gradual emergence of a labor market, the large-scale layoffs that have accompanied market reforms, and the underemployment of the rural workforce, policies that have emerged to protect against the employment of underage youth have coincided with rising government concerns about providing enough employment for working-age adolescents and young adults.
Changes in youth and young adult employment in the 1990s are the mirror image of changes in education. Focusing on respondents ages 16 to 25, employment rates for CHNS cohorts dropped from about 81 percent for males and females in 1989 to about 69 percent for males and 72 percent for females in 1997 (see Table 8-6). Gender differences in the overall rate of employment were not significant in either year. In 1989, employment rates were higher among rural youth and among poorer households. In 1997, significant urban-rural differences were present for males, but not females. Socioeconomic disparities remained stark. For example, in 1989, about 16 percentage points separated the employment rates of girls in the lowest and highest possession index quartiles. By 1997, the gap was nearly 22 percentage points.14
The broad categories of work in which youth and young adults were involved did not change dramatically over time, at least through the early reform years (see Table 8-7). Many of the educational improvements appear to have contributed to credential upgrading within broad occupational categories, rather than to major shifts in the youth and young adult labor force across broad occupational categories. For example, census data from 1982 indicate that the majority of youth who were working in the early years of reform were doing so in agricultural occupations. Nearly 82 percent of 15- to 19-year-old workers, 66 percent of 20- to 24-year-old workers, and 68 percent of 25- to 29-year-old workers were in agricultural jobs. In 1990, percentages were similar. Labor was the second most common type of work. In 1982, 14 percent of 15- to 19-year-old workers were laborers, compared to 23 percent of 20- to 24-year-olds and 20 percent of
TABLE 8-6 Employment Rates,a Ages 16 to 25
25- to 29-year-olds; percentages were similar in 1990. However, proportionally, sales workers increased between the censuses, from 2 percent to nearly 4 percent of 25- to 29-year-olds.
Of course, there may be significant shifts in the structure of labor within these broad categories. Furthermore, we note that the stability shown here has emerged together with several important labor changes. First, the criteria for obtaining and keeping jobs and for being rewarded within the
workplace are different for youth entering the labor force now, compared to earlier cohorts. Studies of career mobility and income determination trends suggest that human capital, as a marker of abilities, is becoming increasingly important for these aspects of the occupational attainment process (e.g., Zhang and Zhao, 2003; Zhao and Zhou, 2003; Maurer-Fazio, 2003; De Brauw and Rozelle, 2003; see Bian, 2002, for a review). Scholars attribute these changes to the emergence of labor markets and to new incentives in the workplace for productivity.
A second important change lies in the welfare implications of securing a job. Work units traditionally have provided a broad variety of social welfare services. However, this pattern is rapidly dissipating. For example, work units have been a primary provider of urban residents’ housing, but waves of reforms starting from the late 1980s have raised rents, detached housing from work units, and commodified and privatized housing (Bian, 2002, p. 101; Wu, 2002).15 Furthermore, emerging private-sector jobs may offer high incomes, but do not typically offer the other benefits historically associated with state-sector jobs. Finally, jobs in either sector are much more unstable under market reforms, placing incumbents at higher risk of losing whatever benefits are associated with those jobs. Compared to their earlier counterparts, youth entering the workplace now enjoy higher incomes, on average, but they face fewer benefits and reduced job security.
Finally, an important trend that is not easily traceable in available statistics on youth labor in China is the rise in population movement, and especially the “floating population” or unregistered, temporary labor migrants. Enabled by a convergence of different reform-era policies,16 the floating population is largely a new phenomenon in China. Floaters largely consist of rural laborers moving from central and western regions to east coast regions for work in township and village enterprises and unskilled urban jobs (Goodkind and West, 2002). Estimates of the size of China’s floating population vary widely, but recent official estimates indicate that the population has increased steadily from the early 1980s and is projected to increase to 160 million, or more than 10 percent of China’s entire
TABLE 8-7 Occupational Distribution of Economically Active Youth by Gender and Census Year
population, by 2010 (Liang, 2001; Goodkind and West, 2002, p. 2242). The floating population is young, tends to be more male than female, and tends to be either single or married but without accompanying spouses (Poston and Duan, 1999; Goodkind and West, 2002; Roberts, 2002; Wang, 2002). In some ways analogous to undocumented workers in the United States, floaters in China enjoy few labor rights and limited access to social services (Goodkind and West, 2002; Wu, 2002). Youth among this population are vulnerable to exploitation and labor abuses, but the scope of such problems is unclear.
|
Sales Workers |
Agriculture, Animal Husbandry, Forestry, Fishing and Hunting |
Production and Related, Transport Equipment, and Laborers |
Service Workers |
Unknown |
|
1.21 |
81.64 |
13.89 |
1.28 |
0.16 |
|
2.26 |
66.17 |
22.93 |
2.12 |
0.16 |
|
2.00 |
68.01 |
20.15 |
1.94 |
0.08 |
|
1.05 |
79.81 |
15.74 |
1.30 |
0.18 |
|
1.89 |
63.27 |
26.19 |
1.84 |
0.17 |
|
1.83 |
63.60 |
24.29 |
1.66 |
0.08 |
|
1.36 |
83.36 |
12.16 |
1.26 |
0.15 |
|
2.68 |
69.37 |
19.33 |
2.42 |
0.14 |
|
2.21 |
73.24 |
15.24 |
2.27 |
0.08 |
|
1.39 |
81.69 |
13.49 |
1.61 |
0.08 |
|
2.62 |
70.51 |
18.78 |
2.03 |
0.10 |
|
3.91 |
64.71 |
19.23 |
2.22 |
0.05 |
|
1.26 |
80.93 |
14.56 |
1.37 |
0.09 |
|
2.42 |
67.44 |
22.17 |
1.76 |
0.12 |
|
3.74 |
60.20 |
23.34 |
1.84 |
0.04 |
|
1.52 |
82.42 |
12.47 |
1.83 |
0.06 |
|
2.84 |
73.83 |
15.12 |
2.32 |
0.08 |
|
4.10 |
69.82 |
14.56 |
2.65 |
0.06 |
In summary, as can be anticipated from rising rates of educational attainment described in the previous section, youth are joining the workforce at increasingly late ages. Those who do enter the workforce, especially those who enter in their teens, are overwhelmingly likely to be working in rural, agricultural jobs. This finding reflects the concentration of the population in rural areas, and the persisting educational disadvantage of rural youth. Rising numbers of these rural youth are moving in search of employment in cities, and are at risk of exploitation in the work-
place. More broadly, the jobs that youth obtain offer greater economic remuneration than in the past, but fewer benefits and less security, and access to good jobs is increasingly conditioned by education.
FAMILY, MARRIAGE, AND CHILDBEARING
Beyond education and the transition into the workforce, family formation is an activity crucial to the transition to adulthood. From the inception of the People’s Republic of China, the marriage and childbearing choices of adolescents and young adults have been constrained by explicit laws. The Marriage Law of 1950 specified that the minimum legal age for marriage was 20 for males and 18 for females; these ages were revised upward by the new Marriage Law (1980), to 22 for males and 20 for females (Zeng, 2002). The 1950 and 1980 Marriage Laws advocated legal marriage based on the free choice of marriage partners, monogamy, and equal rights for both sexes and outlawed arranged marriage (Arnold and Liu, 1986). Under the influence of such decrees and other social and economic changes, a major shift away from arranged marriage has occurred in China over the past four decades (see Xu and Whyte, 1990, for evidence in Chengdu; see Riley, 1994, for evidence in six provinces of China). Family planning policies have also had important implications for the family formation. China initiated its first official national family planning policy, the wan-xi-shao (later-longer-fewer) policy, in 1970 (Tien, 1980). The later-longer-fewer policy advocated later marriage and childbearing, longer birth intervals, and fewer births. Although no unified standard existed, the lower limits on age at marriage were set as high as the mid-20s for females and late 20s for males in parts of China (Zeng, 2002). The later-longer-fewer policy also slowed the pace of childbearing by promoting a two-child norm and recommending at least 3 years of spacing between births. Signaling a dramatic change in the lives of reproductive-aged women, the policy coincided with a drop in total fertility rates from 5.8 in 1970 to 2.2 in 1980 (Zhang, 2000).
Around the time of market reforms, in 1979, the Chinese government issued the more restrictive one-child policy. Banister (1987) summarized the new policy as promoting late marriage, late childbearing, and few and healthy children, and encouraging one child per family. However, it met strong resistance and many violations took place. In 1984, the policy was revised to allow exemptions for having a second child for rural couples under certain circumstances.17 In the late 1980s, policy loosened further
and took son preference into greater account (Zeng, 1989). In most rural areas, daughter-only families were allowed a second child (Croll, 2000, p. 22 ).18
In the early 1990s, the Chinese government introduced the family planning responsibility system19 to strengthen political and financial support from leaders at all levels (Xie, 2000). Overall, instead of enforcing a single state-derived, one-child policy, local governments were allowed to adapt national policy to take local socioeconomic circumstances, culture, and ethnic composition into consideration. Croll (2000, p. 22) observes that by the late 1990s “rigorous application” of the one-child rule occurred almost exclusively among urban residents, and then only very stringently in a select group of municipalities and high-population density provinces. According to Croll (2000, p. 22), in many provinces, general regulations now allow a second child for couples whose first child is a daughter, and some allow two children in most rural areas, regardless of the gender of the first child.
Furthermore, since the mid-1990s, new strategies for implementation have emerged, with particular relevance to adolescents. These strategies put more emphasis on quality of care, on informed contraceptive choices, on integrating family planning programs with economic activities, and on the improvement of women’s status. It is important to note that because family planning services had long been organized to serve married women, unmarried adolescents were not always able to access services (Gu, Xie, and Hardee, 1998). The new service-oriented approaches have started to target reproductive health issues for adolescents. Examples of youth-oriented initiatives include offering new sex education programs in schools and communities,20 increasing the retail sales of condoms, and addressing problems of unwanted pregnancies among adolescents, especially college students, in urban areas.
What are the trends in family formation in the reform period? Evidence indicates that rates of marriage are high in China, but the age at marriage is also high, with few adolescents among the married. Table 8-8 shows estimates of the singulate mean age at marriage (SMAM) and marital status for cohorts ages 15 to 19 years, 20 to 24 years, and 25 to 29 years for select years. The SMAM is a proxy for the mean age at marriage calculated from
TABLE 8-8 Singulate Mean Age at Marriage and Percentage Married Among 15- to 29-Year-Olds, Select Years
|
|
1982 |
1987 |
||
|
M |
F |
M |
F |
|
|
N |
|
|||
|
15-19 years |
63,705,558 |
61,462,900 |
65,186,200 |
62,885,400 |
|
20-24 years |
37,800,462 |
36,403,280 |
60,813,900 |
60,700,100 |
|
25-29 years |
47,676,631 |
44,750,195 |
38,036,500 |
36,328,000 |
|
Percentage that are: |
|
|||
|
Single |
|
|||
|
15-19 years |
99.1 |
95.6 |
98.6 |
95.8 |
|
20-24 years |
72.0 |
46.5 |
61.0 |
39.9 |
|
25-29 years |
23.6 |
5.3 |
17.3 |
4.1 |
|
Married |
|
|||
|
15-19 years |
0.9 |
4.3 |
1.4 |
4.2 |
|
20-24 years |
27.8 |
53.3 |
38.7 |
59.8 |
|
25-29 years |
75.7 |
94.3 |
81.9 |
95.4 |
|
Divorced |
|
|||
|
15-19 years |
0.0 |
0.0 |
0.0 |
0.0 |
|
20-24 years |
0.2 |
0.2 |
0.2 |
0.2 |
|
25-29 years |
0.5 |
0.2 |
0.5 |
0.3 |
|
Widowed |
|
|||
|
15-19 years |
0.0 |
0.0 |
0.0 |
0.0 |
|
20-24 years |
0.0 |
0.1 |
0.1 |
0.1 |
|
25-29 years |
0.2 |
0.2 |
0.2 |
0.2 |
|
SMAMa |
24.9 |
22.4 |
23.9 |
22.0 |
|
aSingulate mean age at marriage (SMAM) is the average number of years lived in the single state by those who marry prior to 50 years. For 1982, data for ages 50 to 54 were not available. Reported SMAM substitutes 1987 data for percentage married at ages 50 to 54. The United Nations Common Database (code 1030) offers ready-made estimates of SMAM for the census years 1982 and 1990 from WESTAT. For 1982, estimates were 25.1 for men and 22.4 for women. For 1990, estimates were 23.8 for men and 22.1 for women. |
||||
current status data, and represents the average number of years lived in the single state by those who marry prior to age 50.
Rates of singlehood were stable and nearly universal among teenagers, ranging between 98.2 and 99.5 percent among males and between 95.3 and 98.4 percent for females for the years for which data are available. However, between 1982 and 1987, the singulate mean age at marriage dropped from 24.9 to 23.9 for men and from 22.4 to 22.0 for women. In the 1990s, the age rose again to 24.5 for men and 22.8 for women. Similarly, marital status data for youth and young adult cohorts reveal that rates of singlehood among 20- to 30-year-old cohorts of men and women dropped in the 1980s, then rose thereafter (see Coale, Feng, Riley, and Lin, 1991 and
|
1990 |
1996 |
1997 |
|||
|
M |
F |
M |
F |
M |
F |
|
61,650,589 |
58,507,832 |
46,193,000 |
43,330,000 |
47,912,000 |
43,829,000 |
|
64,233,023 |
61,528,151 |
51,449,000 |
52,289,000 |
47,711,000 |
48,643,000 |
|
53,512,983 |
50,754,542 |
63,325,000 |
64,106,000 |
64,203,000 |
64,597,000 |
|
98.2 |
95.3 |
99.5 |
98.4 |
99.0 |
98.3 |
|
62.5 |
41.4 |
71.3 |
49.6 |
72.4 |
50.8 |
|
16.7 |
4.3 |
20.3 |
6.8 |
20.9 |
7.4 |
|
1.8 |
4.6 |
0.5 |
1.6 |
0.9 |
1.7 |
|
37.3 |
58.3 |
28.4 |
50.1 |
27.2 |
48.8 |
|
82.4 |
95.1 |
78.5 |
92.4 |
77.9 |
91.8 |
|
0.0 |
0.0 |
0.0 |
0.0 |
0.0 |
0.0 |
|
0.2 |
0.2 |
0.0 |
0.1 |
0.3 |
0.3 |
|
0.6 |
0.5 |
0.3 |
0.2 |
0.9 |
0.6 |
|
|
|
0.0 |
0.0 |
|
|
|
0.0 |
0.0 |
0.0 |
0.0 |
0.0 |
0.0 |
|
0.1 |
0.1 |
0.2 |
0.3 |
0.1 |
0.1 |
|
0.2 |
0.2 |
0.9 |
0.6 |
0.3 |
0.2 |
|
23.8 |
22.1 |
24.5 |
22.8 |
24.5 |
22.8 |
|
SOURCE: United Nations (2002). |
|||||
Zeng, 2002, for confirmatory evidence on the drop in age at marriage in the early 1980s, and Zeng, 2002, for rising trends in the 1990s). In Figure 8-2, the percentage married among 15- to 29-year-old cohorts in the CHNS confirm a substantial delaying tendency between 1989 and 1997.
The drop in age at marriage in the 1980s is commonly attributed to the 1980 Marriage Law, which in theory lifted the national legal age at marriage, but in fact loosened the age restrictions that had been in practice in some regions during the 1970s as part of the wan-xi-shao family planning policy (Zeng, 2002, p. 94). Zeng (2002, p. 95) credits rapid economic development with contributing to the more recent recovery in age at first marriage: With the emergence of the labor market and new employment
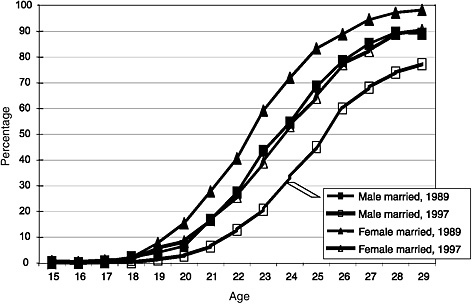
FIGURE 8-2 Marriage rates, 15- to 29-year-olds, China Health and Nutrition Survey, 1989 and 1997.
opportunities in cities, many young people delayed marriage. A strong population program that advocated late marriage may also have contributed to this delay. Finally, increased market access to contraceptives has allowed young people to engage in sexual activity with less worry about unwanted pregnancy, further delaying incentives for marriage.21
Given low marriage rates at young ages, and low rates of out-of-wedlock childbearing in China, it is not surprising that adolescent fertility rates are also low. Figure 8-3 shows total fertility rates and age-specific fertility rates for cohorts of young adults ages 15 to 19, 20 to 24, and 25 to 29. The total fertility rate is very low in China, having dropped from 2.2 in 1990 to about 1.8 by 1992 and 1.7 by 2000, where it remained stable through 2003. Age-specific fertility rates dropped for each of the three youth and young adult cohorts,22 suggesting a shift toward later childbearing.
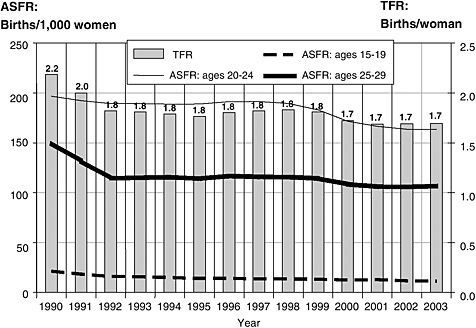
FIGURE 8-3 Total fertility rates and youth age-specific fertility rates.
NOTE: ASFR = age-specific fertility rate; TFR = total fertility rate.
SOURCE: Calculated from U.S. Bureau of the Census (2002), Table 028. International Database. Available: http://www.census.gov/ipc/www/idbnew.html.
HEALTH
In China, many of the reform-era changes in the education sector have parallels in the health-sector reforms. On the eve of market reforms, health care access was widespread, if not high quality. Public health institutions were financed by the government, and public health services were provided to users at no cost (Liu and Mills, 2002). Hsiao and colleagues (1997) state that by 1975, insurance coverage provided by the government and state enterprises and the rural cooperative medical system had reached nearly to 90 percent of the population. This coverage included nearly all of the urban population and 85 percent of the rural population. It provided access to cost-effective preventive and curative health care services (Hsiao et al., 1997, pp. 1-2).
As we discussed in the context of education, beginning in 1978, the Chinese government introduced radical economic policy shifts that moved China away from a centrally planned economy and toward a competitive market system (Hsiao et al., 1997). In the health-sector, fiscal decentralization and the diminishing role of rural collectives resulted in an increasing private share in health expenditures and growing inequities in access to
health services (Bloom and Gu, 1997; Yu, Cao, and Lucas, 1997). Beginning in the early 1980s, public health institutions were no longer seen as pure welfare entities, but rather as economic bodies, and charges were introduced as an important source of income (Liu and Mills, 2002). Government spending on health increased during the early reform years, but private health spending increased even faster, transforming the financial base of health care (Hsiao et al., 1997).
The most dramatic change in health financing in the early reform years was the decline of the rural cooperative medical system; the financing gap that resulted was filled mainly by private out-of-pocket spending (Hsiao et al., 1997). Even within urban areas, however, some evidence suggests increases in out-of-pocket payments and a decline in the population covered by government insurance (Gao et al., 2001). Overall, out-of-pocket payments rose from 20 percent of the health-sector’s revenue in 1978, to 26 percent in 1986, to 42 percent in 1993 (Hsiao et al., 1997). In the 1990s, some evidence suggests that preventive health care services declined as costs for those services rose. For example, immunization rates appear to have dropped as fees for immunizations have increased (Gu et al., 1995; Hsiao et al., 1997; UNMI, 2002). Evidence suggests that access to health insurance among children and youth was extremely limited through the 1990s. For example, just 16 to 17 percent of children under age 16 in the 1989, 1993, or 1997 waves of the CHNS had access to health insurance (Adams and Hannum, 2005).
Against a backdrop of rising disparities in availability of high-quality services, China faces the challenge of new health problems common to developed countries and persistent problems more characteristic of those facing developing countries. One general problem facing children and youth in China is nutrition, as a dual pattern of overnutrition and nutritional deprivation is emerging (Hesketh, Ding, and Tomkins, 2002). Child malnutrition declined in rural areas in the late 1980s and early 1990s, but dramatic regional variations exist and physical stunting remains common in some poor rural areas (Chen, 2002; Park and Zhang, 2000). Using longitudinal data from the China Health and Nutrition Survey in 1991 and 1993, Wang, Popkin, and Zhai (1998) found that among children ages 10 to 18, the prevalence of stunting declined from 23 percent in 1991 to 19 percent in 1993, but that undernutrition was still a problem among 13 percent of adolescents.
Wang et al. (1998) note that overweight status is emerging as a problem associated with high-income and urban adolescents, though the overall prevalence is low, at 4 percent.23 Other studies focusing on urban popula-
tions have similarly begun to track an emerging problem of obesity among urban youth (Hesketh, Ding, and Tomkins, 2002). Wang and colleagues’ (1998) review of smaller studies suggests that the prevalence of overweight status may have reached 6 to 9 percent in several coastal provinces and in north China by the early 1990s. Although problems of overnutrition have yet to reach the proportions seen in the United States,24 they illustrate new health issues emerging as a direct result of the wealth brought by market reforms.
Another adolescent health issue that the market reform era may have exacerbated is smoking. Although smoking is a major health problem in China across age groups, the majority of smokers begin as adolescents (Cheng, 1999). A national prevalence survey conducted in 1996 showed that the steepest rise in smoking occurs between the ages of 15 and 20, and that the majority of teen smokers and nonsmokers were unaware of the health risks of smoking (Cheng, 1999, pp. 608-611). Two studies conducted in Beijing, in 1991 and 1997, found that the prevalence of teenage smoking ranged from 15 percent to 25 percent (Li, Fang, and Stanton, 1996, 1999). Hesketh, Ding, and Tomkins’ (2001) survey of 6,674 13- to 18-year-old students in Zhejiang province indicated that 25.7 percent of boys and 5.4 percent of girls has ever smoked. Among ever-smokers, 41.9 percent had smoked before age 10, and 7.9 percent before age 5.25
Furthermore, the problem appears to be growing. Analysis of a national survey of smoking prevalence conducted in 1996 suggested that the age of smoking initiation fell by approximately 3 years for both men and women between 1984 and 1996 (Yang et al., 1999). Beyond long-term health implications, smoking among Chinese adolescents is associated with poor school performance and problem behaviors such as truancy from school, running away from home, destructiveness, and fighting (Li et al., 1996, 1999). A tobacco advertising ban was enacted in 1995, and through the 1990s, smoking bans were passed in some cities and some school-based campaigns emerged. However, the scope of implementation of these strategies remains unclear (Cheng, 1999; Unger et al., 2001).
A third health concern that is looming large for adolescents in the reform period is reproductive health. Recent delays in the age at marriage
and an increasingly early age of menarche26 leave young adults with a long period of sexual maturity before marriage. Concerns have been raised about premarital sex, lack of knowledge of and access to contraceptives (Gao, Tu, and Yuan, 1997; Zhang, 1997), a rise in abortions due to unwanted pregnancies (Luo et al., 1995; Wu et al., 1992), and increasing vulnerability to HIV and other sexually transmitted diseases among adolescents (Xiao, 1996; Qi and Tang, 2000).
Empirical estimates of trends in premarital sex are difficult to come by, due to the still-sensitive nature of the topic. Wang and Yang (1996) indirectly examined the incidence of premarital sex using data from the 1988 China’s Two-Per-Thousand Fertility and Birth Control Survey. The authors defined premarital conceptions as intervals of 8 months or less between the date of first marriage and first birth. They found that premarital conceptions rose from 1.5 percent in the 1950s, to 3.0 percent in the late 1970s, to 5.0 percent in the mid-1980s. The percentages of premarital conception were twice as high for urban residents as rural residents (5 percent versus 2.5 percent). There was no significant difference by ethnicity, but women with secondary schooling or more had higher percentages of premarital conceptions (4.4 percent) than women who were illiterate or semiliterate (1.4 percent). Professional couples were more likely, and farming couples less likely, to have a premarital conception. These findings suggest that the incidence of premarital sex has increased over time, and increases with higher social status. However, these figures are likely to underrepresent actual premarital sexual activities due to the rising availability of contraceptives and the use of abortions to prevent unwanted births.
National studies of abortion are unavailable, but smaller scale studies suggest that nontrivial numbers of young, single women do experience abortion. For example, one study of five districts in Shanghai indicated that the abortion rate among single women in 1988 was 56 abortions per 1,000 15- to 19-year-olds, 159 per 1,000 20- to 24-year-olds, and 94 per 1,000 25- to 29-year-olds (Wu et al., 1992). The figure for 15- to 19-year-olds represented a dramatic increase from 5 per 1,000 in 1982. In the same period of time, abortion rates increased nearly fourfold for single women ages 20 to 24 and 30 to 34, and more than doubled among women ages 25 to 29. Furthermore, the proportion of abortions obtained by single women increased from 14 percent in 1982 to 28 percent in 1986, then decreased slightly to 25 percent in 1988 (Wu et al., 1992, p. 51). A study of abortions conducted between August and November 1999 in four hospitals in Beijing indicated that 40 percent of the procedures were for unmarried women (no
author, 2001). A survey of 457 unmarried women undergoing first-trimester abortions in six Sichuan counties between July 1990 and June 1991 found that 28.2 percent of them were under 20 years old and 64.8 percent were 20 to 24 years of age. The vast majority (92.6 percent) were not using any form of contraception when the pregnancy occurred, and 35 percent reported at least one previous abortion (Luo et al., 1995).
The use of abortion by young women is itself a significant health issue, but it also suggests that methods other than indirect estimation from first birth intervals are needed to determine the sexual activity of adolescents. The National Reproductive Health Survey, conducted in 1997, inquired indirectly among reproductive-aged women about premarital sex, asking, “To your knowledge, among the people you know, are there any people having sex before their marriage? If yes, how widespread is this behavior?” (see Table 8-9). Overall, about 30.9 percent of respondents stated that premarital sex was nonexistent among those around them, 35.1 percent said there were occasional or some cases, and 14.5 percent said it was relatively widespread.27 Interestingly, the youngest cohorts—15 to 19 and 20 to 24—were less likely to perceive widespread premarital sex than their older counterparts. Perceptions of widespread premarital sex were greatest among women in the middle of the reproductive-age range. Less educated women respondents perceived less widespread premarital sex than more educated women, and rural women were less likely to perceive widespread premarital sex than urban women.
The current prevalence of premarital sex is linked in the popular press to more permissive social attitudes. However, evidence about trends in attitudes is hard to come by. The 1997 National Reproductive Health Survey suggests that the vast majority of people continue to express attitudes unfavorable to premarital sex (see Table 8-10). The survey asked a relatively conservative question: “Nowadays some people think, as long as two people plan to get married, they can have sex before marriage. Do you agree with this view?” Overall, 80.3 percent of people disagreed with this statement; only 12.6 percent agreed. For young age cohorts, ages 15 to 19, rates of agreement were even lower, at 6.2 percent. The rate of agreement rises with the 20- and 30-year-old cohorts, then drops among the oldest cohorts. The highest agreement rates emerged among urban women ages 20 to 34, where 17 to 20 percent of women agreed. The least educated women tended to have somewhat lower agreement rates.
TABLE 8-9 Distribution of Responses to the Questions: “To your knowledge, among the people you know, are there any people having sex before marriage? If yes, how widespread is this behavior?”
|
|
N |
No |
Occasional Cases |
Some Cases |
Relatively Widespread |
Don’t Know |
Refuse to Answer |
|
Total |
15,213 |
30.87 |
23.42 |
11.73 |
14.50 |
19.25 |
0.24 |
|
By age |
All women |
|
|||||
|
N |
15,213 |
|
|||||
|
15-19 |
1,620 |
37.90 |
19.94 |
8.83 |
4.38 |
28.40 |
0.56 |
|
20-24 |
1,944 |
30.71 |
27.73 |
13.43 |
12.29 |
15.53 |
0.31 |
|
25-29 |
2,881 |
27.91 |
25.27 |
13.16 |
17.49 |
16.00 |
0.17 |
|
30-34 |
2,776 |
29.90 |
21.90 |
12.21 |
17.44 |
18.37 |
0.18 |
|
35-39 |
1,840 |
29.40 |
22.55 |
11.74 |
15.43 |
20.76 |
0.11 |
|
40-44 |
2,223 |
30.95 |
23.48 |
10.93 |
15.38 |
19.03 |
0.22 |
|
45-49 |
1,929 |
32.24 |
22.19 |
10.52 |
14.62 |
20.22 |
0.21 |
|
|
Rural women |
|
|||||
|
N |
11,668 |
|
|||||
|
15-19 |
1,284 |
40.50 |
19.00 |
8.18 |
4.28 |
27.49 |
0.55 |
|
20-24 |
1,498 |
34.78 |
27.70 |
11.82 |
9.81 |
15.55 |
0.33 |
|
25-29 |
2,253 |
33.07 |
25.83 |
10.52 |
13.76 |
16.69 |
0.13 |
|
30-34 |
2,184 |
34.80 |
21.89 |
10.44 |
14.10 |
18.64 |
0.14 |
|
35-39 |
1,316 |
35.18 |
22.11 |
9.73 |
12.54 |
20.36 |
0.08 |
|
40-44 |
1,652 |
37.23 |
22.82 |
9.26 |
11.92 |
18.58 |
0.18 |
|
45-49 |
1,481 |
37.00 |
22.15 |
9.12 |
11.34 |
20.12 |
0.27 |
|
|
Urban women |
|
|||||
|
N |
3,545 |
|
|||||
|
15-19 |
336 |
27.98 |
23.51 |
11.31 |
4.76 |
31.85 |
0.60 |
|
20-24 |
446 |
17.04 |
27.80 |
18.83 |
20.63 |
15.47 |
0.22 |
|
25-29 |
628 |
9.39 |
23.25 |
22.61 |
30.89 |
13.54 |
0.32 |
|
30-34 |
592 |
11.82 |
21.96 |
18.75 |
29.73 |
17.40 |
0.34 |
|
35-39 |
524 |
14.89 |
23.66 |
16.79 |
22.71 |
21.76 |
0.19 |
|
40-44 |
571 |
12.78 |
25.39 |
15.76 |
25.39 |
20.32 |
0.35 |
|
45-49 |
448 |
16.52 |
22.32 |
15.18 |
25.45 |
20.54 |
0.00 |
|
By education |
All women |
|
|||||
|
N |
15,213 |
|
|||||
|
Illiterate and semiliterate |
3,249 |
39.52 |
20.62 |
8.59 |
8.65 |
22.19 |
0.43 |
|
Primary schooling |
4,546 |
36.67 |
22.64 |
10.49 |
12.41 |
17.64 |
0.15 |
|
Junior middle schooling |
4,892 |
27.27 |
24.61 |
12.53 |
16.54 |
18.85 |
0.20 |
|
Senior middle schooling |
1,434 |
17.64 |
24.62 |
14.09 |
23.64 |
19.80 |
0.21 |
|
Secondary technical schooling |
539 |
18.00 |
28.20 |
16.88 |
19.29 |
17.63 |
0.00 |
|
College and over |
553 |
11.03 |
28.03 |
22.06 |
19.71 |
18.81 |
0.36 |
|
|
Rural women |
|
|||||
|
N |
11,668 |
|
|||||
|
Illiterate and semiliterate |
3,121 |
40.31 |
20.60 |
8.39 |
8.20 |
22.08 |
0.42 |
|
Primary schooling |
4,207 |
38.10 |
22.75 |
9.77 |
11.58 |
17.66 |
0.14 |
|
Junior middle schooling |
3,624 |
31.29 |
25.06 |
11.31 |
13.58 |
18.57 |
0.19 |
|
Senior middle schooling |
556 |
25.00 |
28.06 |
10.43 |
16.91 |
19.60 |
0.00 |
|
Secondary technical schooling |
139 |
25.18 |
28.06 |
15.11 |
13.67 |
17.99 |
0.00 |
|
College and over |
21 |
14.29 |
57.14 |
4.76 |
9.52 |
14.29 |
0.00 |
|
|
Urban women |
|
|||||
|
N |
3,545 |
|
|||||
|
Illiterate and semiliterate |
128 |
20.31 |
21.09 |
13.28 |
19.53 |
25.00 |
0.78 |
|
Primary schooling |
339 |
18.88 |
21.24 |
19.47 |
22.71 |
17.40 |
0.29 |
|
Junior middle schooling |
1,268 |
15.77 |
23.34 |
16.01 |
25.00 |
19.64 |
0.24 |
|
Senior middle schooling |
878 |
12.98 |
22.44 |
16.40 |
27.90 |
19.93 |
0.34 |
|
Secondary technical schooling |
400 |
15.50 |
28.25 |
17.50 |
21.25 |
17.50 |
0.00 |
|
College and over |
532 |
10.90 |
26.88 |
22.74 |
20.11 |
18.98 |
0.38 |
|
SOURCE: Jiang (2000). |
|||||||
TABLE 8-10 Distribution of Responses to the Questions: “Nowadays some people think, as long as two people plan to get married, they can have sex before marriage. Do you agree with this view?”
|
|
N |
Agree |
Disagree |
Don’t Know |
Refuse to Answer |
|
Total |
15,213 |
12.61 |
80.30 |
6.43 |
0.66 |
|
By age |
All women |
|
|||
|
N |
15,213 |
|
|||
|
15-19 |
1,620 |
6.17 |
82.35 |
9.69 |
1.79 |
|
20-24 |
1,944 |
13.07 |
79.32 |
6.89 |
0.72 |
|
25-29 |
2,881 |
15.41 |
76.92 |
7.08 |
0.59 |
|
30-34 |
2,776 |
16.17 |
78.06 |
5.44 |
0.32 |
|
35-39 |
1,840 |
12.39 |
81.25 |
5.87 |
0.49 |
|
40-44 |
2,223 |
11.11 |
83.67 |
4.59 |
0.63 |
|
45-49 |
1,929 |
10.16 |
83.05 |
6.32 |
0.47 |
|
|
Rural women |
|
|||
|
N |
11,668 |
|
|||
|
15-19 |
1,284 |
6.15 |
81.78 |
10.20 |
1.87 |
|
20-24 |
1,498 |
11.88 |
80.91 |
6.34 |
0.87 |
|
25-29 |
2,253 |
14.25 |
79.23 |
5.99 |
0.53 |
|
30-34 |
2,184 |
15.34 |
79.40 |
4.99 |
0.27 |
|
35-39 |
1,316 |
12.31 |
81.31 |
6.16 |
0.23 |
|
40-44 |
1,652 |
10.96 |
84.56 |
4.12 |
0.36 |
|
45-49 |
1,481 |
10.20 |
82.31 |
6.89 |
0.61 |
|
|
Urban women |
|
|||
|
N |
3,545 |
|
|||
|
15-19 |
336 |
6.25 |
84.52 |
7.74 |
1.49 |
|
20-24 |
446 |
17.04 |
73.99 |
8.74 |
0.22 |
|
25-29 |
628 |
19.59 |
68.63 |
10.99 |
0.80 |
|
30-34 |
592 |
19.26 |
73.14 |
7.09 |
0.51 |
|
35-39 |
524 |
12.60 |
81.11 |
5.15 |
1.15 |
|
40-44 |
571 |
11.56 |
81.09 |
5.95 |
1.40 |
|
45-49 |
448 |
10.04 |
85.49 |
4.46 |
0.00 |
|
By education |
All women |
|
|||
|
N |
15,213 |
|
|||
|
Illiterate and semiliterate |
3,249 |
10.80 |
80.39 |
7.94 |
0.86 |
|
Primary schooling |
4,546 |
12.65 |
80.55 |
6.25 |
0.55 |
|
Junior middle schooling |
4,892 |
13.41 |
80.78 |
5.19 |
0.61 |
|
Senior middle schooling |
1,434 |
12.97 |
79.85 |
6.35 |
0.84 |
|
Secondary technical schooling |
539 |
12.06 |
79.59 |
7.98 |
0.37 |
|
College and over |
553 |
15.37 |
75.23 |
8.68 |
0.72 |
|
|
Rural women |
|
|||
|
N |
11,668 |
|
|||
|
Illiterate and semiliterate |
3,121 |
10.99 |
80.26 |
7.88 |
0.87 |
|
Primary schooling |
4,207 |
12.79 |
80.48 |
6.16 |
0.57 |
|
Junior middle schooling |
3,624 |
12.06 |
82.53 |
4.86 |
0.55 |
|
Senior middle schooling |
556 |
12.77 |
82.01 |
5.04 |
0.18 |
|
Secondary technical schooling |
139 |
11.51 |
79.86 |
7.91 |
0.72 |
|
College and over |
21 |
9.52 |
85.71 |
4.76 |
0.00 |
|
|
Urban women |
|
|||
|
N |
3,545 |
|
|||
|
Illiterate and semiliterate |
128 |
6.25 |
83.59 |
9.38 |
0.78 |
|
Primary schooling |
339 |
10.91 |
81.42 |
7.37 |
0.29 |
|
Junior middle schooling |
1,268 |
17.27 |
75.79 |
6.15 |
0.79 |
|
Senior middle schooling |
878 |
13.10 |
78.47 |
7.18 |
1.25 |
|
Secondary technical schooling |
400 |
12.25 |
79.50 |
8.00 |
0.25 |
|
College and over |
532 |
15.60 |
74.81 |
8.83 |
0.75 |
|
SOURCE: Jiang (2000). |
|||||
These patterns provide some hints of likely trajectories of change, though they do not speak directly to change. The fact that agreement rates tend to be higher in urban areas and among the somewhat better educated suggests that the segments of society that have greatest exposure to the forces of development are also those with more permissive attitudes, and those perceiving more sexual activity outside of the context of marriage.
Indications of rising premarital sexual activity, in the context of increases in the age at marriage (except in the early 1980s), suggest the possibility that what is changing may not be youth sexual behaviors per se, but the link between these behaviors and marriage. Yet, adolescent and young adult nonmarital sexual activity carries numerous public health concerns not implied by sexual activity within the context of marriage. Importantly, public health concerns about the prevalence of premarital sex in China are made urgent by the rapid increase in HIV prevalence. Overall estimates of the impact of HIV in China are regularly shifted upward, with recent estimates suggesting that more than a million people carry HIV (United Nations Theme Group on HIV/AIDS in China, 2002). Trend data for youth are not available. However, among youth ages 15 to 24, United Nations estimates for 2001 suggest that the prevalence is between 0.11 percent and 0.2 percent for males and between 0.06 percent and 0.11 percent for females (United Nations Millennium Indicators, 2002). In a recent speech, the Minister of the State Population and Family Planning Commission suggested that more than 60 percent of China’s HIV cases were among people ages 15 to 29 (Zhang, 2003).28
Knowledge of AIDS remains limited. A Centers for Disease Control and Prevention report on a survey of 7,000 randomly selected individuals ages 15 to 49 in seven counties showed that nearly 17 percent had never heard of AIDS, and more than half did not know the cause of the disease (CDC, 2002). Among those who had heard about AIDS, about 90 percent knew that it could be transmitted person to person, but 85 percent were unaware it could be passed from mother to child. Eighty-one percent did not know it could be acquired by sharing needles, and 52 percent were unaware that it could be transmitted by unsafe blood transfusions. More than 75 percent were unaware that proper use of condoms could prevent infection (Brown, 2002).
Adolescent sexual behavior is a concern that the public health system is struggling to address, despite China’s extensive family planning system and its recent shifts toward a reproductive health services orientation (Gu, 2000; Simmons et al., 2000). To address concerns about adolescents, in recent years, numerous reproductive health programs have been implemented that target reproductive health services for youth and adolescents.29 Adolescent
reproductive health issues are recognized as being an important element in the mid- to long-term plan for AIDS control in China (Zhang, 2003). The challenges are exacerbated by ever-increasing numbers of unattached youth and young adults migrating to cities for work; these youth often remain excluded from urban welfare services, such as reproductive health services.
A fourth public health problem facing adolescents and young adults that has gained considerable public attention in recent years is suicide. Table 8-11 shows two recently published estimates of adolescent and young-adult suicide rates.30 Panel A shows national urban and rural estimates of suicide rates and the percentage of all deaths from suicide for women and men, for ages 15 to 34 and for all ages. These estimates show that, overall, suicide rates among rural residents were much higher than those of urban residents—about three times as high. Women’s rates were higher than men’s, but the disadvantage faced by women was concentrated in rural areas. Furthermore, among rural populations, the excess suicide among women is larger among the young population than among the whole population. For rural women ages 15 to 34, fully 31 percent of all deaths were attributable to suicide. The rate of suicide for rural women in this age group, at 37.8 per 100,000, was 1.7 times the rate of rural men, 3.5 times the rate of urban women, and 4 times the rate of urban men. The 2001 World Health Report lists suicide as the leading cause of death in 1998 among rural women ages 15 to 34 in China (World Health Organization, 2001, Figure 2.5). Data from 1988, 1990, and 1992 (Panel B) suggest that the peak of rural young women’s suicide rates occurs in the 20- to 24-year-old age range.
The most common technique is pesticide ingestion, which accounts for 34.3 to 66.6 percent of all suicides (Ji et al., 2001, pp. 3, 4; Phillips, Li, and Zhang, 2002). Ji and colleagues (2001) observe that this technique is extremely effective because rural health care systems are not equipped to handle pesticide poisoning. The ready availability of pesticides, and the inability of health systems to counteract their effects, may play a role in the excess suicide mortality for young women.31 Contradictory evidence exists about the degree to which depression is a significant risk factor for suicide.
TABLE 8-11 Select Published Estimates of Suicide Rates in China for the 1980s and 1990s
|
Panel A: Mean Annual Rates of Suicide (1/100,000) and Percentage of All Deaths Due to Suicide, 1995-1999 |
||||
|
Age |
15-34 |
All Ages |
||
|
Population Group |
Suicide Rate |
% of all Deaths Due to Suicide |
Suicide Rate |
% of all Deaths Due to Suicide |
|
Rural |
30.3 |
20.4 |
27.1 |
4.0 |
|
Urban |
10.2 |
10.3 |
8.3 |
1.5 |
|
Women |
32.1 |
29.0 |
25.9 |
4.4 |
|
Men |
20.0 |
12.1 |
20.7 |
2.9 |
|
Rural women |
37.8 |
31.0 |
30.5 |
4.9 |
|
Rural men |
22.8 |
13.1 |
23.9 |
3.3 |
|
Urban women |
10.8 |
15.8 |
8.3 |
1.7 |
|
Urban men |
9.5 |
7.4 |
8.3 |
1.3 |
|
Panel B: Rural Suicide Rates in 1988, 1990, and 1992 (1/100,000) |
||||
|
Age |
15-19 |
20-24 |
25-29 |
30-34 |
|
Population Group |
|
|||
|
Women |
|
|||
|
1988 |
31.7 |
67.1 |
34.6 |
28.3 |
|
1990 |
23.3 |
47.6 |
37.3 |
25.9 |
|
1992 |
18.2 |
46.3 |
38.6 |
27.9 |
|
Men |
|
|||
|
1988 |
14.1 |
38.2 |
23.6 |
22.8 |
|
1990 |
10.4 |
22.5 |
20.3 |
17.1 |
|
1992 |
9.8 |
28.4 |
23.0 |
19.8 |
|
SOURCES: Panel A: Section reproduced from Phillips, Li, and Zhang (2002a, Table 1). Panel B: Section reproduced from Ji (1999, Table 2). |
||||
Ji and colleagues’ (2001) review suggests that serious depression is not a primary precipitant of suicide, while Phillips and colleagues’ (2002b) national case-control study indicates that a high depression symptom score did significantly raise the risk of suicide. However, scholars agree that social stressors significantly raise the risk of suicide (Ji et al., 2001; Phillips et al., 2002b). Research on call-ins to mental health hotlines suggests that significant stressors, especially for women, include marital problems, pressures of extramarital or premarital affairs, family pressures, and education and employment pressures (Ji, 1999; Ji et al., 2001).
Trend data remain sketchy, but certain evidence suggests a decline in suicide rates. Ji’s estimates for rural residents in the late 1980s and early 1990s (Tabel 8-11, Panel B) suggest that suicide rates are declining across time, as 1992 figures were somewhat lower for most age cohorts than 1988 figures. Consistent with this result, a World Health Organization report (2001, Figure 2.4) indicates that age-standardized suicide rates in China dropped by 17.2 percent in the most recent three years for which data were available. However, Phillips, Li, and Zhang (2002a) indicate that an earlier study using comparable Ministry of Health mortality data from 1987 suggests that both the level and the age pattern of suicide were stable, compared with their own results for 1995 to 1999.
Regardless of the trend, the scope of suicide in recent years has brought recognition of suicide as a major public health problem. The Ministry of Health, in collaboration with the World Health Organization, held a workshop on suicide prevention in March 2000 that took the first steps toward developing a national suicide prevention program (Phillips, Li, and Zhang, 2002a).
Some of the health problems described here—overnutrition, sexual health, and to some degree, smoking—are problems enabled by the rising wealth in China. Other problems, including persisting undernutrition faced by children and youth in poor rural areas and the high suicide rates of young people in these areas, especially women, reflect older issues such as poverty and the social pressures facing young women.
SUMMARY
The evidence presented here indicates that changes were taking place in the 1990s. Most significantly, youth were delaying transitions into adulthood across major domains of the life course. Figures 8-4a and 8-4b illustrate this point, combining rates of nonenrollment, employment, and marriage by age for females (8-4a) and males (8-4b) ages 11 to 29 in the 1989 and 1997 CHNS samples. These figures illustrate that cohorts coming of age in the latter year transitioned more slowly out of education, into work, and into marriage. Consistent with this story, fertility data also suggest a shift to later childbearing. These shifts can be characterized as favorable, from the perspectives of improving the educational composition of the population, reducing child labor, and promoting slower population growth.
However, improved standards of living and norms of social openness associated with market reforms have raised the significance of behavioral health issues, such as smoking and premarital sexual activity. Furthermore, while available evidence suggests that many favorable changes have been shared across social groups, some noteworthy social and economic inequalities continued to mark adolescents’ lives. For example, youth in ur-
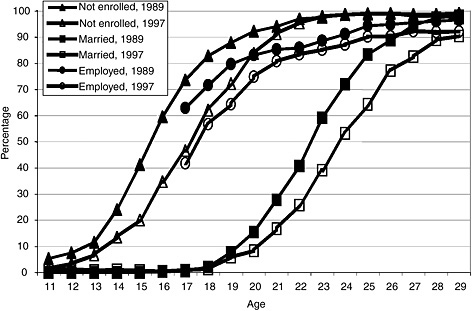
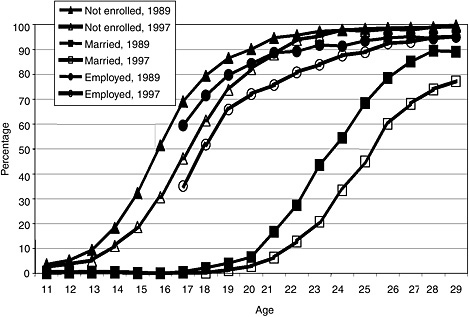
ban areas remained more likely to be in school, and thus to enjoy the benefits of education in a labor market that increasingly rewards credentials. The mirror image of this phenomenon is reflected in the elevated likelihood of rural youth to be in the labor force, in the high percentage of working youth employed in agricultural pursuits, and in the rise in youth migration into urban settings. Similar signs of disparity mark education and employment status along socioeconomic lines.
Urban-rural and socioeconomic splits are also glaringly evident in the health problems facing China’s adolescents, with youth in some poor rural areas continuing to face basic health problems such as lack of adequate nutrition, while wealthier urban youth are beginning to face health problems associated with youth culture in more affluent settings. The lines of inequality are nowhere more painfully clear than in suicide rates, which are three times higher in the rural youth population, probably reflecting a combination of the poverty-related stressors that poor rural adolescents must cope with on a daily basis and their easy access to potent poisons. For reasons that remain murky, the toll is highest for young rural women.
DISCUSSION AND CONCLUSIONS
China’s socialist past was characterized by an unusually high degree of policy involvement, using means that were sometimes harsh, to achieve state goals regarding education, job placement, marriage, fertility, and women’s roles. China’s more recent experience of rapid economic development has built on some of the hard-won achievements of these earlier policies to yield many patterns of adolescent transition that are favorable. Youth stay in school longer, and start work later, as time passes. The average age at marriage is high enough that marriage is unlikely to compete directly with educational opportunities, except at the highest levels of education. Low fertility rates, especially at young ages, suggest that women’s childrearing responsibilities compete less with other opportunities than in many less developed countries. Strikingly, in the 1990s, many of these favorable patterns were markedly enhanced.
Yet, the institutional legacies of socialism are not always suited to addressing the current problems of adolescents. For example, the traditional system of family planning, oriented toward strict regulation of marital fertility, is working to offer a more service-oriented approach, and to address issues of nonmarital sexual activity among increasingly mobile youth.
Nor are the implications of market reforms exclusively favorable. Wealth and the opening of society have led to new concerns about adolescent welfare. Improved standards of living and norms of social openness associated with market reforms have raised the significance of overnutri-
tion, sexual health, and to some degree, smoking as adolescent and young adult health problems. Among the new problems facing youth, AIDS has the potential to become a staggering social problem if not successfully addressed in a timely manner. In the area of work, adolescents enjoy much greater chances of achieving high incomes than in the past, but they also face a harshly competitive environment in which the rewards associated with work are more narrowly economic and the tenure of any job obtained is less secure. Further complicating the picture is evidence that, while opportunities have improved across social groups, socioeconomically disadvantaged youth face disproportionate barriers to successful transitions into adulthood.32
In short, successes in improving the lives of many adolescents have brought new challenges, as China’s youth policy makers now serve populations that face increasingly divergent problems. Decision makers in education, labor, family planning, and health now need to adapt services to the needs of urban adolescents and impoverished young rural-urban migrants, while dealing effectively with the older problems facing the rural poor. Their degree of success in this endeavor will bear crucial ramifications for the future welfare of China’s youth and adult populations.
REFERENCES
Adams, J., and Hannum, E. (2005, March). Trends in children’s social welfare in China: Access to health insurance and education. China Quarterly, 181, 100-121.
Arnold, F., and Liu, Z. (1986). Sex preference, fertility, and family planning in China. Population and Development Review, 12(2), 221-246.
Banister, J. (1987). China’s changing population. Stanford, CA: Stanford University Press.
Bian, Y. (2002). Chinese social stratification and social mobility. Annual Review of Sociology, 28, 91-116.
Bloom, G., and Gu, X.Y. (1997). Introduction to health-sector reform in China. IDS Bulletin, 28(1), 1-23.
Broaded, M.C. (1983). Higher education policy changes and stratification in China. China Quarterly, 93, 125-141.
Brown, D. (2002, July 9). Survey finds China’s AIDS awareness is lacking. Medicine scarce in India, conference is also told. Available: http://www.thebody.com/cdc/news_updates_archive/july11_02/china_aids.html [accessed October 21, 2003].
Carter, C.A. (1997). The urban-rural income gap in China: Implications for global food markets. American Journal of Agricultural Economics, 79, 1410-1418.
Centers for Disease Control and Prevention. (2002, July 11). Emerging epidemics in China and Russia. Press release. Available: http://www.cdc.gov/od/oc/media/pressrel/r020711.htm [accessed August 11, 2002].
Chen, C. (2002). Fat intake and nutritional status of children in China. American Journal of Clinical Nutrition, 72(Suppl.), 1368-1372.
Cheng, K. (2003). China’s education reform: Priorities and implications. In E. Hannum and A. Park (Eds.), Education and reform in China. Cambridge, MA: Harvard University Press
Cheng, T. (1999). Teenage smoking in China. Journal of Adolescence, 22, 607-620.
China Family Planning Association. (2001). UNFPA/CFPA adolescent reproductive health pilot project final evaluation. (UNFPA RH/FP project CPR/98/P01.) Available: http://www.unescobkk.org/ips/arh-web/arhnews/pdf/unfpa_cfpa.pdf [accessed October 13, 2002].
Coale, A.J., Feng, W., Riley, N.E., and Lin, F.D. (1991). Recent trends in fertility and nuptiality in China. Science, 251(4992), 389-393.
Communiqué on Promulgating Regulations on the Special Protection of Minor Workers. (1994). Available: http://www.molss.gov.cn/correlate/lbf1994498.htm [accessed June 5, 2002].
Croll, E. (2000). Endangered daughters: Discrimination and development in Asia. New York: Routledge.
De Brauw, A., and Rozelle, S. (2003). Returns to education in rural China. In E. Hannum and A. Park (Eds.), Education and reform in China. Cambridge, MA: Harvard University Press.
Gao, E., Tu, X., and Yuan, W. (1997). Shanghai premarital adolescent use of contraceptive methods and analysis of influencing factors. Chinese Journal of Population Science, 9(4), 375-388.
Gao, J., Tang, S., Tolhurst, R., and Rao, K. (2001). Changing access to health services in urban China: Implications for equity. Health Policy and Planning, 16(3), 302-312.
Goodkind, D., and West, L.A. (2002). China’s floating population: Definitions, data and recent findings. Urban Studies, 39(12), 2237-2250.
Gu, B., Xie, Z., and Hardee, K. (1998). The effect of family planning on women’s lives: The case of the People’s Republic of China. Research Triangle Park, NC: Family Health International.
Gu, B.C. (2000, March). Reorienting China’s family planning program: An experiment on quality of care since 1995. Paper presented at the annual meeting of the Population Association of America, Los Angeles, CA.
Gu, X.Y., Bloom, G., Tang, S.L., and Lucas, H. (1995). Financing health services in poor rural China: A strategy for health-sector reform. (Institute of Development Studies Working Paper No. 17.) Shanghai, China: Shanghai Medical University Collaborative Research Program.
Hannum, E. (1999a). Political change and the urban-rural gap in education in China, 1949-1990. Comparative Education Review, 43(2), 193-211.
Hannum, E. (1999b). Poverty and basic-level schooling in the People’s Republic of China: Equity issues in the 1990s. Prospects: The Quarterly Journal of Comparative Education, 29(4), 561-577.
Hannum, E. (2002a). Educational stratification by ethnicity in China: Enrollment and attainment in the early reform years. Demography, 39(1), 95-117.
Hannum, E. (2002b). Market transition, educational disparities, and family strategies in rural China: New evidence on gender stratification and development. Demography, 42(2), 275-299.
Hannum, E. (2003). Poverty and basic education in rural China: Communities, households, and girls’ and boys’ enrollment. Comparative Education Review, 47(2), 141-159.
Hannum, E., and Park, A. (2002). Educating China’s rural children in the 21st century. Harvard China Review, 3(2), 8-14.
Hesketh, T., Ding, Q.J., and Tomkins, A.M. (2001). Smoking among youths in China. American Journal of Public Health, 91(10), 1653-1655.
Hesketh, T., Ding, Q.J., and Tomkins, A.M. (2002). Disparities in economic development in Eastern China: Impact on nutritional status of adolescents. Public Health Nutrition, 5(2), 313-318.
Hsiao, W., Jamison, D.T., McGreevey, W.P., and Yip, W. (1997). Financing health care: Issues and options for China. (World Bank Report No. 17091.) Washington, DC: World Bank.
Ji, J. (1999, June). Committed suicide in the Chinese rural areas. Updates on Global Mental and Social Health, 3(1).
Ji, J., Kleinman, A., and Becker, A.E. (2001). Suicide in contemporary China: A review of China’s distinctive suicide demographics in their sociocultural context. Harvard Review of Psychiatry, 9(1), 1-12.
Jiang, Z. (Ed.). (2000). Data collection of the 1997 National Population and Reproductive Health Survey. Beijing, China: China Population Publishing House.
Khan, A.R., and Riskin, C. (1998). Income and inequality in China: Composition, distribution and growth of household income, 1988 to 1995. China Quarterly, 154, 221-253.
Kwong, J. (1985). Changing political culture and changing curriculum: An analysis of language textbooks in the People’s Republic of China. Comparative Education, 21, 197-208.
Li, X.M., Fang, X., and Stanton, B. (1996). Cigarette smoking among Chinese adolescents and its association with demographic characteristics, social activities, and problem behaviors. Substance Use and Misuse, 31(5), 545-563.
Li, X.M., Fang, X., and Stanton, B. (1999). Cigarette smoking among schoolboys in Beijing, China. Journal of Adolescence, 22, 621-625.
Liang, Z. (2001). The age of migration in China. Population and Development Review, 27(3), 499-524.
Lin, J. (1993). Education in post-Mao China. Westport, CT: Praeger.
Lin, J. (2003). Emergence of private schools in China: Context, characteristics, and implications. In E. Hannum and A. Park (Eds.), Education and reform in China. Cambridge, MA: Harvard University Press.
Lin, J.Y. (1988). The household responsibility system in China’s agricultural reform: A theoretical and empirical study. Economic Development and Cultural Change, 36, S199-S204.
Liu, X., and Mills, A. (2002). Financing reforms of public health services in China: Lessons for other nations. Social Science and Medicine, 54(11), 1691-1698.
Lofstedt, J.-I. (1990). Human resources in Chinese development: Needs and supply of competencies. (IIEP Research Report No. 80.) Paris, France: International Institute for Educational Planning.
Luo, L., Wu, S.Z., Chen, X.Q., Li, M.X., and Pullum, T.W. (1995). Induced abortion among unmarried women in Sichuan Province, China. Contraception, 51(1), 59-63.
Maurer-Fazio, M. (2003). Education as a determinant of lay-off, re-employment, and earnings in China’s transitional labor market. In E. Hannum and A. Park (Eds.), Education and reform in China. Cambridge, MA: Harvard University Press.
Ministry of Education. (1986). People’s Republic of China law on compulsory education. Beijing, China: Ministry of Education.
Ministry of Education. (1999). Action plan for revitalizing education for the 21st century. Beijing, China: Ministry of Education.
Park, A., and Zhang, L.X. (2000). Mother’s education and child health in China’s poor areas. Ann Arbor, MI: University of Michigan Department of Economics.
Phillips, M.R., Li, X., and Zhang, Y. (2002a). Suicide rates in China, 1995-99. Lancet, 359, 835-840.
Phillips, M.R., Yang, G., Zhang, Y., Wang, L., Ji, H., and Zhou, M. (2002b). Risk factors for suicide in China: A national case-control psychological autopsy study. Lancet, 360, 1728-1736.
Popkin, B.M., and Udry, J.R. (1998). Adolescent obesity increases significantly in second and third generation U.S. immigrants: The National Longitudinal Study of Adolescent Health. Journal of Nutrition, 128(4), 701-706.
Poston, D.L., Jr., and Duan, C. (1999, March 25). The floating population in Beijing, China: New evidence and insights from the 1997 census of Beijing’s floating population. Paper presented at the annual meeting of the Population Association of America, New York.
Powell, S.G. (1992). Agricultural reform in China: From communes to commodity economy, 1978-1990. New York: Manchester University Press.
Qi, Y., and Tang, W. (2000). Needs of Chinese youths for reproductive health. China Population Today, 17(4), 11-13.
Regulations on ending the use of child labor (in Chinese). (1991). Available: http://www.molss.gov.cn/correlate/gl9181.htm [accessed June 23, 2002].
Riley, N.E. (1994). Interwoven lives: Parents, marriage, and guanxi in China. Journal of Marriage and the Family, 56(4), 791-803.
Roberts, K. (2002). Female labor migrants to Shanghai: Temporary “floaters” or potential settlers? International Migration Review, 36(2), 492-520.
Rules and regulations related to the protection of children under 16 and the special employment protections of minors (in Chinese). (n.d.). Available: http://www.molss.gov.cn/column/ldbzfz/tgzc.htm [accessed June 15, 2002].
Short, S.E., and Zhai, F. (1998). Looking locally at China’s one-child policy. Studies in Family Planning, 29(4), 373-387.
Simmons, R.S., Gu, B.C., Zhang, E.L., Xie, X.M., and Ward, S. (2000, March). Initiating a quality of care transition in China. Paper presented at the annual meeting of the Population Association of America, Los Angeles, CA.
Small survey of abortion shocked: Forty percent of abortions are among unmarried persons. (2001, March 12). In Beijing Morning Post (in Chinese). Available: http://www.cpirc.org.cn/new0312-1.htm [accessed June 10, 2002].
Some of Changsha’s schools start a population and spiritual health curriculum. (2002, March 13). In China Youth Post (in Chinese). Available: http://www.cpirc.org.cn/new20010813-1.htm [accessed June 10, 2002].
Standing Committee of the Eighth National People’s Congress (SCENPC). (1995). Labor law of the People’s Republic of China. Available: http://ce.cei.gov.cn/frame_2.htm [accessed July 08, 2002].
State Council. (2000, October). Circular of the State Council on Policies and Measures Pertaining to the Development of the Western Region. Available: http://ce.cei.gov.cn/elaw/r_west.htm [accessed April 29, 2002].
Tien, H.Y. (Ed.). (1980). Population theory in China. New York: M.E. Sharpe.
Tsang, M.C. (2000). Education and national development in China since 1949: Oscillating policies and enduring dilemmas. Available: http://www.tc.columbia.edu/centers/coce/publications.htm [accessed May 20, 2002].
UNESCO. (1998). World data on education. Geneva, Switzerland: UNESCO; IBE Documentation and Information Unit.
UNESCO, Institute for Statistics. (2002). World Education Indicators. Geneva, Switzerland: UNESCO. Available: http://www.uis.unesco.org/en/stats/statistics/indicators/indic().htm [accessed May 20, 2004].
Unger, J.B., Yan, L., Chen, X., Jiang, H., Azen, S., Qian, G., Tan, S., Jie, G., Sun, P., Chunhong, L., Chou, C.–P., Zheng, H., and Johnson, C.A. (2001). Adolescent smoking in Wuhan, China: Baseline data from the Wuhan smoking prevention trial. American Journal of Preventive Medicine, 21(3), 162-169.
United Nations. (2002). United Nations Common Database. Marital status of population by sex, age group, urban, and rural (code 14880). Available: http://unstats.un.org [accessed March 12, 2005].
United Nations Millennium Indicators. (2002). China country profiles. Available: http://millenniumindicators.un.org/unsd/mi/mi.asp and http://millenniumindicators.un.org/unsd/mi/mi_results.asp?crID=156 [accessed August 17, 2002].
United Nations Theme Group on HIV/AIDS in China. (2002). HIV/AIDS: China’s titanic peril. (Report prepared by UN Theme Group for the UN Country Team.) Available: http://www.casy.org/engdocs/China’s%20Titanic%20Peril.pdf [accessed April 11, 2005].
U.S. Bureau of the Census. (2002). International database. Age-specific fertility rates and selected derived measures, China 1990-2000. Available: http://www.census.gov/ipc/www/idbnew.html [accessed August 5, 2004].
Wang, F. (2002). Rural migrants in Shanghai: Living under the shadow of socialism. International Migration Review, 36(2), 520-546.
Wang, F., and Yang, Q.H. (1996). Age at marriage and the first birth interval: The emerging change in sexual behavior among young couples in China. Population and Development Review, 22(2), 299-320.
Wang, Y., Popkin, B., and Zhai, F. (1998). The nutritional status and dietary pattern of Chinese adolescents, 1991 and 1993. European Journal of Clinical Nutrition, 52(12), 908-916.
World Bank. (1997). Social crises in East Asia. Available: http://www.worldbank.org/poverty/eacrisis/indicat/index.htm [accessed February 19, 2002].
World Health Organization. (2001). Mental health: New understanding, new hope. World Health Report 2001. Available: http://www.who.int/whr/2001 [accessed May 1, 2002].
Wu, J.Q., Gao, E. S., and Zhang, B. (2000). Analysis on menarche of Chinese reproductive-age women (in Chinese). Reproduction and Contraception, 11(1-2), 86-97.
Wu, W. (2002). Migrant housing in urban China: Choices and constraints. Urban Affairs Review, 38(1), 90-119.
Wu, Z.C., Gao, E.S., Ku, X.Y., Lu, S.Y., Wang, M.J., Hong, W.C., and Chow, L.P. (1992). Induced abortion among unmarried women in Shanghai, China. International Family Planning Perspectives, 18(2), 51-53, 65.
Xiao, B. (1996). Reproductive health in the People’s Republic of China. Advances in Contraception, 12(4), 257-263.
Xie, Z. (2000). Population policy and the family planning programme. In X. Peng (Ed.), The changing population of China (pp. 51-63). Oxford, England: Blackwell.
Xu, X., and Whyte, M.K. (1990). Love matches and arranged marriages: A Chinese replication. Journal of Marriage and the Family, 52(3), 709-722.
Yang, G.H., Fan, L.X., Tan, J., Qi, G.M., Zhang, Y., Samet, J.M., Taylor, C.E., Becker, K., and Xu, J. (1999). Smoking in China: Findings of the 1996 National Prevalence Survey. Journal of the American Medical Association, 282(13), 1247-1253.
Yip, P.S., Callanan, C., and Yuen, H.P. (2000). Urban/rural and gender differentials in suicide rates: East and West. Journal of Affective Disorders, 57(1-3), 99-106.
Yu, H., Cao, S.H., and Lucas, H. (1997). Equity in the utilization of medical services: A survey of poor in rural China. IDS Bulletin, 28(1), 16-23.
Zeng, Y. (1989). Is the Chinese family planning program “Tightening Up?” Population and Development Review, 15(2), 333-337.
Zeng, Y. (2002). Marriage patterns in contemporary China. In X. Peng and Z. Guo (Eds.), The changing population of China (pp. 91-100). Oxford, England: Blackwell Publishers Ltd.
Zeng, Y., and Wu, D. (2000). Regional analysis of divorce in China since 1980. Demography, 37(2), 215-219.
Zhang, C. (2000). Evolution of Chinese population policies. In X. Yu and Z. Xie (Eds.), China’s population and development: Review and prospect (pp. 1-26) (in Chinese). Beijing, China: People’s Publishing House.
Zhang, J., and Zhao, Y. (2003). Returns to education in the 1990s. In E. Hannum and A. Park (Eds.), Education and reform in China. Cambridge, MA: Harvard University Press.
Zhang, W. (2003, July 11). Pay special attention to adolescent sex and reproductive health and rights. Speech by Zhang Weiqing, Minister of the State Population and Family Planning Commission, to mark World Population Day. Available: http://www.cpirc.org.cn/en/enews20030721.htm [accessed June 23, 2004].
Zhang, Z. (1997). Sex education vital for Chinese adolescents (in Chinese). China Population Today, 14(1), 13-14.
Zhao, W., and Zhou, X. (2003). Returns to education in China’s transitional economy: Reassessment and reconceptualization. In E. Hannum and A. Park (Eds.), Education and reform in China. Cambridge, MA: Harvard University Press.


