
5
PI-Led Mission Performance: Cost, Schedule, and Science
COST AND SCHEDULE
The committee’s task included assessing the cost and schedule growth in PI-led missions and the factors contributing to such growth.1 Its approach was to obtain the detailed cost estimates (Phases A through E) and launch date at the time of confirmation and compare them with the actual mission and launch costs. With this information, the committee had planned to analyze the sources of cost growth on PI-led missions and also identify growth that was attributed to the PI nature of the mission versus the growth that was beyond the PI’s control (e.g., increased cost of the launch vehicle or for use of the Deep Space Network (DSN)). For example, was cost growth experienced on the spacecraft bus, or on instruments or software development? Or did it come from increases in scope (additional NASA requirements) of the mission? This approach would have enabled the committee to provide lessons learned in these areas as well as recommendations for technology development investments that would benefit PI-led missions.
Unfortunately, the committee was not able to obtain detailed cost data at the spacecraft, instrument, or subsystem levels, owing to concerns about the proprietary nature of such data for each PI-led mission. The committee was unable to learn whether increases in cost were due to changes in NASA requirements for the project, although it was able to obtain data on life-cycle costs2 and on schedule at major milestones in PI-led missions (e.g., confirmation review, critical design review, and launch). This lack of data necessarily limited the depth of analysis and diagnostics that the committee could conduct on the factors contributing to cost and schedule growth in PI-led missions. The committee also referred to the study prepared by the National Academy of Public Administration (NAPA), which focused more specifically on cost growth and factors that would contribute to it in PI-led missions.3 The analysis portion of that report is excerpted in
Appendix I. The committee compared the data NASA provided to the committee with the cost growth on other recent non-PI-led NASA missions and the data in a recent Congressional Budget Office (CBO) study.4
The five successful PI-led Discovery missions that have been launched to date (Lunar Prospector, Stardust, Genesis, MESSENGER, and Deep Impact) had average life-cycle cost growth of 13.7 percent and development cost growth of 12.4 percent based on the project’s confirmation acceptance review (CAR) (see Table 5.1). Cost growth for the most recent Discovery missions (Genesis, MESSENGER, and Deep Impact) appears to be due to a combination of factors, including ambitious technical expectations and the increased oversight and management requirements following the Mars mission failures of the late 1990s.
The committee also examined five Explorer missions (RHESSI, Swift, IMAGE, GALEX, and WMAP) (Table 5.2); on average, their development cost increased 30.8 percent. Two of the missions, Swift and GALEX, showed particularly large increases in development costs, 68.8 percent and 52.8 percent, respectively, over their selection cost caps. Both Swift and GALEX encountered problems related to immature technology, which probably contributed to the cost and schedule overruns (see, also, Chapter 6). One specific problem for Swift involved the Burst Alert Telescope (BAT), which ultimately cost more than had been estimated and contributed to a delay on the order of 17 months. Intense schedule pressure during development caused the BAT flight detector array to be built before prototype testing was complete. This attempt to save schedule led to further delays and cost increases. (One key delay occurred when parts showed unexpected susceptibility to radiation, necessitating the complete disassembly of the 256 BAT detector array modules to replace the susceptible parts.)5 GALEX faced a number of extraordinarily challenging technical developments in the fabrication of exceptionally large detectors—for example, they included the largest sealed-tube microchannel plate detectors ever flown, the first-ever dichroic beam splitters, and the largest UV grism ever fabricated. In the end these new hardware developments succeeded, but schedule delays and cost overruns could be directly attributed to them. One result was that resources taken from other planned (and needed) project activities contributed to several serious problems with other less challenging systems in the mission that had impacts on the cost and schedule.6
The RHESSI case shows how factors beyond the PI’s control contributed to cost growth of 22.8 percent (see Table 5.2). RHESSI suffered severe damage during vibration testing at JPL. The project, which was within budget and on schedule before the testing, was not held accountable for the accident or the resulting damage. It was provided with additional funds to repair the damage caused by the testing equipment. In addition, the slip in launch date for RHESSI was attributable to factors related to the Pegasus launch vehicle and not to the RHESSI project itself.7
When evaluated against a set of recent core NASA missions (Table 5.3), the Discovery Program compares favorably (average life-cycle costs growth of 13.7 percent versus 18.3 percent for the other recent missions). In the case of the Explorer Program, the comparison is not quite as favorable. The average increase in development costs for PI-led Explorers is 30.8 percent compared with the 18.3 percent for the other recent missions, though just two cases—Swift and GALEX—are the cause of the high average (see Table 5.2).
The CBO report estimated that cost growth in 72 programs since 1977 averaged 45 percent when adjusted for inflation.8 The CBO analysis suggests that “NASA’s more expensive, and possibly more complex,
|
4 |
Congressional Budget Office, 2004, A Budgetary Analysis of NASA’s New Vision for Space Exploration, Washington, D.C. |
|
5 |
Neil Gehrels, principal investigator, GSFC, “The Swift GRB MIDEX mission,” presentation to the committee on September 2, 2004. |
|
6 |
Chris Martin, principal investigator, Caltech, “GALEX lessons learned: PI perspective,” presentation to the committee on February 1, 2005. |
|
7 |
Justin Ray, 2002, “The Saga of HESSI,” Spaceflight Now. Available at <spaceflightnow.com/pegasus/hessi/020203preview.html>. Accessed on September 23, 2005. |
|
8 |
Congressional Budget Office, 2004, A Budgetary Analysis of NASA’s New Vision for Space Exploration, Washington, D.C., p. xii-xiii. |
TABLE 5.1 Cost Growth for Discovery Missions (million $)
TABLE 5.2 Cost Growth for Selected Explorer Missions (million $)
TABLE 5.3 Cost Growth for Selected NASA Core Missions (million $)
|
Mission |
Life-Cycle Costa |
Development Cost |
Launch Date |
Comments |
|||||
|
CAR |
Current |
% Change |
CAR |
Current |
% Change |
CAR |
Actual |
||
|
Mars Global Surveyor |
231.3 |
298.8 |
29.2 |
132.3 |
132.3 |
0.0 |
11/96 |
11/96 |
Increase in life-cycle cost due to additional MO&DA. |
|
Mars Climate Orbiter |
353.3 |
276.2 |
–21.8 |
193.1 |
193.1 |
0.0 |
12/98 |
12/98 |
Lost on arrival in September 1999. |
|
Mars Odyssey |
418.8 |
438.2 |
4.6 |
287.9 |
309.3 |
7.4 |
4/01 |
4/01 |
Increased funding to meet launch date. |
|
Mars Exploration Rovers |
646.4 |
809.9 |
25.3 |
449.6 |
606.8 |
35.0 |
6/03 |
6/03 |
Increased funding to meet launch date, additional MO&DA. |
|
Spitzer Space Telescope |
797.6 |
1,233.2 |
54.6 |
392.8 |
635.9 |
61.9 |
12/01 |
8/03 |
Cost growth due to 21-month launch slip due to instrument and software delays as well as conflicts with other launches. |
|
TIMED |
198.1 |
233.4 |
17.8 |
129.3 |
162.3 |
25.5 |
5/00 |
12/01 |
Cost growth due to technical problems and launch delays. |
|
NOTE: CAR, confirmation acceptance review; MO&DA, mission operations and data analysis; TIMED, Thermosphere, Ionosphere, Mesosphere Energetics and Dynamics. aPhase A/B costs not included. SOURCE: NASA Headquarters, Science Mission Directorate. |
|||||||||
programs tend to experience greater cost growth than less expensive ones.”9 Using the CBO data, the committee looked at programs in which the initial estimated costs were less than $300 million, roughly comparable to the Explorer and Discovery mission sets. From 1990 to 2000, the average increase in costs for these missions was 28 percent.10 In contrast, for missions between $300 million and $1 billion, the average cost growth was 49 percent, according to the CBO.
While the cost growth in PI-led missions does not seem out of line with those of other similar core missions, particularly when compared to the CBO report, there is one disturbing trend. Recent missions in both the Discovery and Explorer programs appear to be experiencing greater cost overruns than the earlier PI-led missions. Without financial data on individual instruments, the spacecraft bus, software development, and other elements that make up the development cost, the committee has not been able to identify the factors actually contributing to cost growth, at what stage in the project problems occurred, or whether the cost growth was within the PI’s control. Moreover, the data NASA provided to the committee were often inconsistent. NASA does not appear to have established procedures for summary cost record keeping and documentation in either the Explorer or the Discovery programs, as evidenced by the lack of agreement among numbers from different source documents (e.g., preliminary design reviews, critical design reviews, project plans, program operating plans).
Despite the paucity of actual financial data, the committee notes several factors that may contribute to cost and schedule problems. In particular, recent missions are more technically challenging, which may signify that cost cap levels need to be reexamined as mission complexity increases. For example, the Deep Impact mission was the first to probe beneath the surface of a comet and so required a complex delivery system; the MESSENGER mission included a challenging thermal design. While NASA has increased the cost caps on both the Explorer Program and the Discovery Program, these increases may not be sufficient to support the ambitious missions being proposed. Other known sources of mission cost growth in recent years are rising launch vehicle costs (Figure 5.1), implementation of full-cost accounting at NASA, reduced risk tolerance, the increased number of NASA-required reviews, and general economic inflation (Figure 5.2).
SCIENCE
PI-led mission AOs require the proposer to describe how the science investigations are to be analyzed (Phase E). This analysis must pass the scrutiny of the original selection review panel (see Chapter 3). The concept of a science floor, embodied in “minimum science requirements” or a “performance floor,” is required for the Explorer and Discovery programs. When the resources required to meet these minimum science requirements exceed the resources available, termination reviews and cancellations are triggered, although these reviews rarely end in termination. However, science floors are usually specified in terms of data to be delivered and not science to be achieved. Quantitative metrics of scientific return are many, varied, and sometimes contradictory. Peer-reviewed publications from PI-led missions (see Appendix F), NASA’s Performance and Accountability Reports,11 and Annual Performance Goals,12 as well as senior reviews for extension of mission operations beyond the baseline, are all attempts to somehow measure
|
9 |
Ibid., p. 35. |
|
10 |
The CBO cost growth figure did not break down costs that were beyond the PI’s control (e.g., increases in launch vehicle costs, use of DSN). |
|
11 |
NASA’s FY 2004 Performance and Accountability Report is available at <www.nasa.gov/about/budget/>. |
|
12 |
NASA’s 2005 document The New Age of Exploration: NASA’s Direction for 2005 and Beyond, includes the agency’s national guiding objectives and its strategic objectives. |
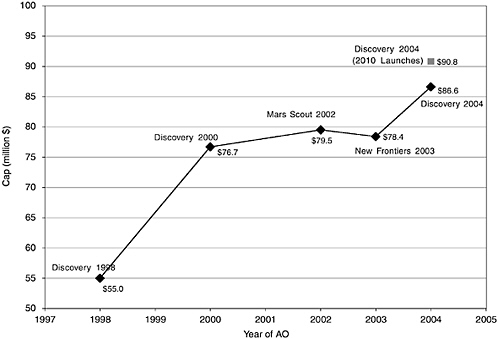
FIGURE 5.1 The Delta 2925H launch vehicle used for Discovery, Mars Scout, and New Frontiers missions from 1998 to 2004 increased in cost by 57 percent over the 6-year period. The Discovery 2004 AO allowed for a 2009 or 2010 launch and the two different prices are shown. SOURCES: Discovery 1998, KSC letters of endorsement for Deep Impact and INSIDE Jupiter; Discovery 2000, KSC letters of endorsement for Dawn and INSIDE Jupiter; Mars Scout 2002, KSC letter of endorsement for SCIM; New Frontier 2003, New Frontiers AO ELV Launch Services Information Summary, dated 10/09/03, found in the New Frontiers Program Library; and Discovery 2004, Discovery AO ELV Launch Services Information Summary, dated April 19, 2004.
science productivity.13 One study14 suggests that large missions have twice as much impact as smaller ones, and another, by Mosher et al.,15 suggests that the faster-better-cheaper missions, which include the PI-led mission lines, are approximately 57 percent more cost-effective than core missions based on the authors’ instrument-months-of-operation metric.
|
13 |
NASA’s senior review process considers whether to provide funding to extend mission operations and data analysis for any of the operating space science missions beyond their planned mission lifetimes. The senior review process prioritizes those missions that should be extended, based on their scientific value and return, within NASA’s available funds. Senior reviews are available at <science.hq.nasa.gov/universe/docs/SenRev04.pdf>, <science.hq.nasa.gov/universe/docs/SenRev02.pdf>, <science.hq.nasa.gov/universe/docs/SenRev00.pdf>, and <science.hq.nasa.gov/universe/docs/SenRev98.pdf>. |
|
14 |
The Science News metric asserts that “An analysis of 1990-1999 data by this metric (performed in January 2000) indicated that OSS’s large missions had twice the science productivity per dollar as smaller missions, and if anything, the past three years have seen an even higher contribution from large observatories.” For further details on the Science News metric, see <opostaff.stsci.edu/~carolc/reports/2002SciNews.pdf>. |
|
15 |
Todd Mosher et al., 1999, Evaluating Small Satellites: Is the Risk Worth It?, 13th Annual AIAA Conference on Small Satellites, pp. 1-13. |
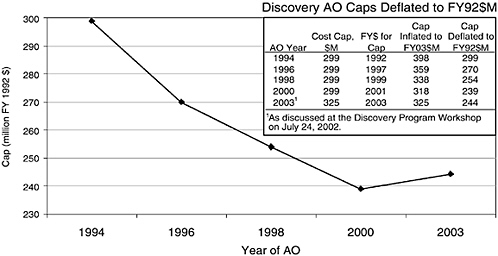
FIGURE 5.2 Impact of inflation on Discovery AO cost caps. This chart was taken from a cost study done by the Earth and Space Sciences Support Office (ESSSO) in 2002 and resulted in Headquarters raising the cost cap in Discovery AOs in 2004.
Science productivity, in any case, is difficult to measure. In addition, a mission may be completely successful from a technical standpoint but fall short of exploiting the science results for budgetary or management reasons. Tables 5.4 and 5.5 provide a partial overview of the science activities (Phase E) for recent Explorer and Discovery missions16 (one example of an activity is a guest investigator (GI) program).
The science activities noted in Tables 5.4 and 5.5 represent commitments to and investments in the mission science on the part of both the PI and NASA. PIs make the decisions on what portion of the cost cap to allocate to Phase E. The missions in Tables 5.4 and 5.5 allocate approximately 10 percent to Phase E activities. The exceptions, Stardust and Genesis, invest nearly a quarter of their mission caps to cover the extra costs of analyzing and curating returned samples. The relative amounts of Phase E funds invested in mission operations (MO) as opposed to data analysis (DA) were unavailable. All Explorer and Discovery missions have an open data policy, and data are deposited in a public data archive at the earliest practical opportunity. As in all missions, the bulk of the data analysis and interpretation is done by community scientists who are not project team members through competitive proposals to the supporting research and technology (SR&T) program and data analysis programs (DAPs), such as the Discovery DAP, which are separate (budgetarily and, in the case of SR&T, programmatically) from the PI mission lines. In at least one case (e.g., RHESSI), the PI budgeted funds for a dedicated GI program that was administered by NASA Headquarters. The source of the funds will determine when these GI and/or DAP funds become available and who may apply for them. A study of the effectiveness of these approaches to exploiting the science achievements of PI-led (or other) space science missions is beyond the scope of this report. However, the
TABLE 5.4 Science Activities (Phase E) of Selected Explorer Missions
|
Mission |
Mission Cost (million $) |
% of Mission Cost for Phase Ea |
Comments + Any Science Activities Other Than Putting Data in the Archive |
|
IMAGE |
152.1 |
15 |
Launched in March 2000 for a 2-year prime mission. Approved for extended mission in the 2001 Senior Review. Data analysis software made available. |
|
WMAP |
161.8 |
9.5 |
Does not include DSN services; does not include archiving. Neither were required in the AO beforefull-cost accounting. Extended twice through Senior Reviews. |
|
RHESSI |
93.6 |
14 |
Supposed to launch in July 2000 for a 2-year prime mission. Actually launched in February 2002. Approved for extended mission in 2003 Senior Review. Funds a GI program. |
|
GALEX |
108.2 |
Proposed, 10; Actual, 14 |
Original Phase E funding used to supplement Phase C/D. Additional Phase E money granted through 2004 Senior Review. Phase E underestimated by about $10 million. |
|
Swift |
241.3 |
6 |
This is projected cost (Swift prime mission runs through 2006). Proposed and selected Phase E was for 3 years. One year was reprogrammed into Phase C/D. This is the full cost (includes GSFC manpower). |
|
NOTE: DSN, Deep Space Network; GI, guest investigator; GSFC, Goddard Space Flight Center. The senior review evaluates operating space science missions against one another and creates a priorities list for funding extended science activities and mission operations. aIncludes MO&DA. SOURCE: NASA Headquarters and mission Web sites. |
|||
TABLE 5.5 Science Activities (Phase E) of Selected Discovery Missions
|
Mission |
Mission Cost (million $) |
% of Mission Cost for Phase E |
Comments + Any Science Activities Other Than Putting Data in the Archive |
|
Lunar Prospector |
69.4 |
11 |
|
|
Stardust |
209.1 |
26 |
Projected costs. Will provide returned samples to the community. |
|
Genesis |
272.3 |
24 |
Does not include additional funding for hard impact recovery. Will provide returned samples to community. |
|
SOURCE: Mission Web sites and NASA Headquarters. |
|||
good standing of PI-led missions in recent senior reviews and decadal surveys17 and their inclusion in recent NASA roadmaps and strategic plans18 suggests that PI-led missions are broadly viewed as scientifically valuable and productive ways of carrying out space science missions.
The committee learned from its interviews that the science results from PI-led missions are most affected by the presence of a PI in the implementation phase. Specifically, in several cases the PIs played a role in preventing a decision that would have reduced the science output of their mission or even terminated the mission. PIs have found creative solutions to prevent descoping of one or more instruments when cost or schedule growth raised the specter of forced descopes or termination. For example, both the IMAGE and MESSENGER missions faced threatened descopes of science instruments, which they were able to avoid by
|
17 |
See Appendix D. |
|
18 |
NASA, 2003, Space Science Enterprise Strategy, NP-2003-10-317-HQ, Washington, D.C. |
reconsidering instrument details and/or changing other budgeted activities. Similarly, the PI can apply management solutions to ward off threats to his or her project science goals. The Dawn mission was able to maintain both of its targeted destinations in part through a PI-driven management change, which brought with it a different approach to implementation. The PIs sometimes convince the program and NASA Headquarters that additional investment beyond the original cost cap is warranted by the potential science return (e.g., as in the case of Swift, where the PI preserved the detector area, or GALEX, where the mission proceeded to launch in spite of large technology-development-related cost and schedule overruns).
The science return is in fact much broader than just the new knowledge about space science enabled by a specific mission, and the PI-led programs play a particularly important role in these crucial, ancillary aspects: (1) training the next generation of scientists and engineers, (2) strengthening the scientific and technical infrastructure, including instrument and spacecraft developers, launch services, and the institutions that manage this complex enterprise, and (3) generating excitement in the science and larger communities via the PI-led project team’s enthusiastic promotion of the mission.
EXAMPLES OF SCIENTIFIC ACHIEVEMENTS
Figures 5.3 through 5.7 show a sample of scientific accomplishments from PI-led missions.
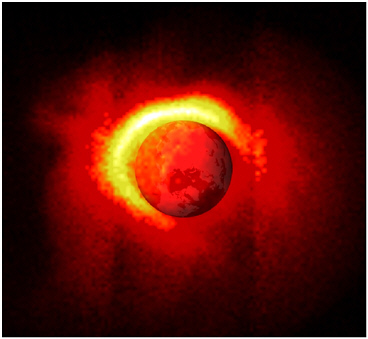
FIGURE 5.3 The Imager for Magnetopause-to-Aurora Global Exploration (IMAGE) Explorer mission (PI James L. Burch, SWRI) obtained the first global images of Earth’s plasmasphere, a region of magnetically confined plasma that corotates with Earth. These images, taken in ultraviolet emissions excited by exposure of the plasma to sunlight, allow studying the response of the near-Earth space environment to solar disturbances, a part of our space weather. Shown is an ultraviolet image from IMAGE, with Earth in the center obscuring part of the glowing dayside plasmasphere. Available at <image.gsfc.nasa.gov/press_release/>.
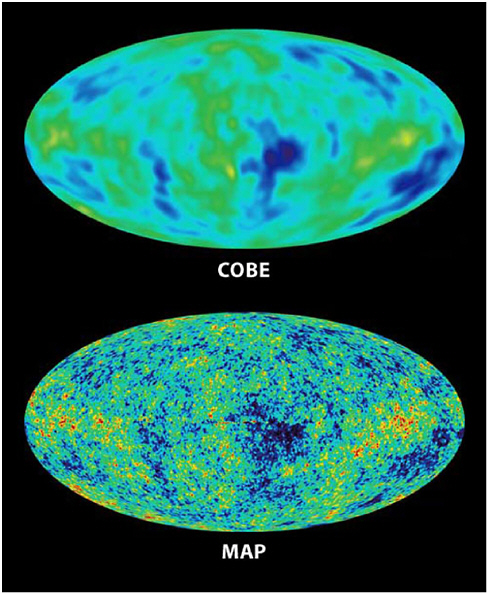
FIGURE 5.4 The Wilkinson Microwave Anisotropy Probe (WMAP), an Explorer mission (PI Charles Bennett, Johns Hopkins University (formerly GSFC)), revealed new detail of the cosmic microwave background (CMB), better constraining the age of the Universe (at 13.7 byr) and the early onset of star formation (within ~200 Myr of the big bang). Shown are all-sky images of the microwave intensity comparing earlier Cosmic Background Explorer (COBE) mission results (top), with the higher (35×) spatial resolution WMAP images (bottom). Available at <www.nasa.gov/centers/goddard/news/topstory/2003/0206mapresults.html>.
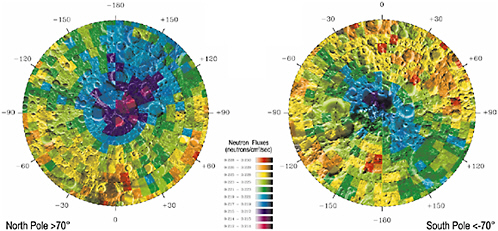
FIGURE 5.5 Lunar Prospector, an early Discovery mission (PI Alan Binder, Lunar Research Institute), obtained data on the rate of ~0.25 to 10 eV (electron volts) energy neutron emission from the lunar surface. The dark blue and purple areas on the maps indicate low counting rates. These low rates support the idea of hydrogen-rich deposits covered by regolith. These data were used to produce the two-color coded maps, which show evidence for water ice at the north (left) and south (right) lunar poles. Available from <lunar.lanl.gov/pages/water.html>.
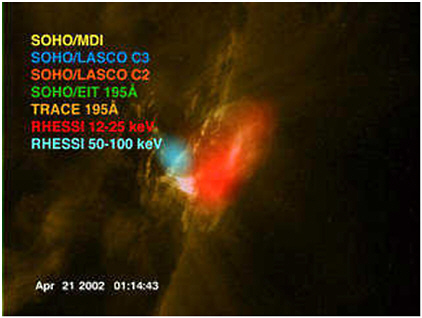
FIGURE 5.6 The Ramaty High Energy Solar Spectroscopic Imager (RHESSI) Explorer mission (PI Robert Lin, University of California, Berkeley) captures images of the hard (>10 keV) x-ray emitting regions in solar flares. Shown are sample RHESSI x-ray images in two energy or wavelength ranges (red and cyan), superposed on coronal ultraviolet and white light images obtained by instruments—the Large Angle and Spectrometric Coronagraph (LASCO) and the Extreme ultraviolet Imaging Telescope (EIT)—on the Solar and Heliospheric Observatory (SOHO) spacecraft and the more prominent extreme ultraviolet (EUV) image from the Transition Region and Coronal Explorer (TRACE) spacecraft. SOHO Michelson Doppler Imager (MDI) magnetograph information is also included at the photosphere for context. The flare shown occurred on April 21, 2002, in a solar active region much larger than Earth. In the composite image, the limb or edge of the Sun is clearly seen beneath an arcade of loops that look bright at the TRACE EUV wavelengths. Images like this locate the sites of energetic particle acceleration in the low corona and in so doing help to solve the long-standing problem of the flare energization process. SOURCE: Available at <cse.ssl.berkeley.edu/hessi%5Fepo/html/rhessi_gallery_main.html>.
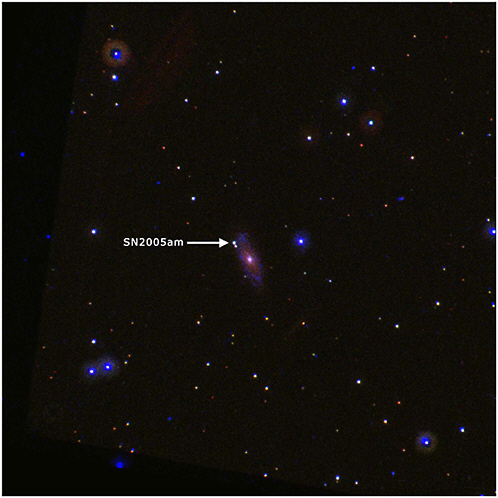
FIGURE 5.7 The Swift Explorer mission caught a supernova in action in March 2005. The ultraviolet image shows it as a bright point on the edge of the galaxy NGC2811. This is one of the first detailed observations of a developing supernova in ultraviolet light. The time history of its brightness can be used to calibrate the use of supernovas to measure distance in observations of galaxies. Available at <heasarc.gsfc.nasa.gov/docs/swift/results/releases/images/SN2005am/SN2005am.html>.


