
3
Benchmarking Results: Assessment of U.S. Leadership in Chemical Engineering at Large
Chapters 3 and 4 present the results of the benchmarking exercise that the Panel undertook in assessing the international competitiveness of U.S. research in chemical engineering. Chapter 3 summarizes the results for chemical engineering at large, while Chapter 4 presents the results for each subarea of chemical engineering. The approach that the Panel followed for the benchmarking exercise was outlined in Section 2.2.
The presentation of results in this chapter is structured as follows: Section 3.1 describes the composition of the Virtual World Congress (VWC) for each subarea of chemical engineering and draws conclusions on the leadership of U.S. chemical engineering research at large. The detailed analysis of the VWC composition for each subarea is given in Chapter 4. Section 3.2 summarizes the analysis of chemical engineering publications and citations, while Section 3.3 presents the results of a patent analysis. Section 3.4 examines the distribution of prizes, awards, and other recognitions, and Section 3.5 summarizes the Panel’s assessment of the current health of U.S. research in chemical engineering at large.
3.1
VIRTUAL WORLD CONGRESS
Table 3.1 summarizes the results of the Virtual World Congress for all subareas of chemical engineering. The table has three parts (from left to right):
-
The third column of the table presents the total and the relative numbers of U.S. and non-U.S. experts for each subarea.
TABLE 3.1 Data for the Virtual World Congress of Chemical Engineering
|
Area |
Subarea |
|
Engineering Science of Physical Processes |
Transport processes Thermodynamics Rheology Separation Solid particles technology |
|
Engineering Science of Chemical Processes |
Catalysis Kinetics and reaction eng. Polymerization reaction eng. Electrochemical processes |
|
Engineering Science of Biological Processes |
Biocatalysis and protein eng. Cellular and metabolic eng. Bioprocess engineering Systems, computational, and synthetic biology |
|
Molecular and Interfacial Science and Engineering Materials: Molecular Design, Morphology, Processing |
Molecular and Supramolecular Assemblies, Micro-Nanopatterned Surfaces and Thin Films Polymers Inorganic & ceramic materials Composite Nanostructured materials |
|
Biomedical Products, Bio-inspired materials, Biomaterials and Biohybrids Energy |
Drug targeting and delivery systems Biomaterials Materials for cell and tissue engineering Fossil energy extraction and processing Fossil fuel utilization Non-fossil energy |
|
Environmental Impact and Management: Safety and Health |
Air pollution Water pollution Green engineering Aerosol S&E |
|
Process Systems Development and Engineering |
Process development and design Dynamics, control, and operational optimization Safety and operability of chemical plants Computational tools and information technology |
|
TOTAL |
|
|
Organizers of Virtual World Congress |
Virtual World Congress Speakers (including duplications in nominations) |
Virtual World Congress Speakers (excluding duplications in nominations) |
|||||||||
|
No. of Experts Polled |
U.S. |
Non-U.S. |
% U.S. |
No. of Nominations |
U.S. |
Non-U.S. |
% U.S. |
No. of Unique Speakers Proposed |
U.S. |
Non-U.S. |
% |
|
7 |
5 |
2 |
71 |
113 |
92 |
21 |
81 |
65 |
50 |
15 |
77 |
|
11 |
11 |
0 |
100 |
217 |
148 |
69 |
68 |
114 |
70 |
44 |
61 |
|
8 |
6 |
2 |
75 |
113 |
70 |
43 |
62 |
66 |
34 |
32 |
52 |
|
9 |
9 |
0 |
100 |
158 |
116 |
42 |
73 |
63 |
41 |
22 |
65 |
|
6 |
5 |
1 |
83 |
113 |
65 |
48 |
58 |
70 |
36 |
34 |
51 |
|
7 |
7 |
0 |
100 |
144 |
81 |
63 |
56 |
66 |
33 |
33 |
50 |
|
8 |
7 |
1 |
88 |
142 |
98 |
44 |
69 |
81 |
51 |
30 |
63 |
|
11 |
10 |
1 |
91 |
165 |
80 |
85 |
48 |
89 |
39 |
50 |
44 |
|
5 |
3 |
2 |
60 |
67 |
38 |
29 |
57 |
52 |
26 |
26 |
50 |
|
7 |
6 |
1 |
86 |
130 |
70 |
60 |
54 |
72 |
30 |
42 |
42 |
|
8 |
6 |
2 |
75 |
123 |
92 |
31 |
75 |
57 |
43 |
14 |
75 |
|
7 |
5 |
2 |
71 |
153 |
105 |
48 |
69 |
104 |
65 |
39 |
63 |
|
9 |
9 |
0 |
100 |
145 |
115 |
30 |
79 |
83 |
65 |
18 |
78 |
|
15 |
14 |
1 |
93 |
268 |
186 |
82 |
69 |
166 |
105 |
61 |
63 |
|
20 |
19 |
1 |
95 |
341 |
254 |
87 |
74 |
151 |
102 |
49 |
68 |
|
14 |
12 |
2 |
86 |
269 |
184 |
85 |
68 |
169 |
106 |
63 |
63 |
|
10 |
9 |
1 |
90 |
141 |
107 |
34 |
76 |
113 |
79 |
34 |
70 |
|
14 |
13 |
1 |
93 |
247 |
183 |
64 |
74 |
134 |
88 |
46 |
66 |
|
11 |
8 |
3 |
73 |
187 |
126 |
61 |
67 |
94 |
60 |
34 |
64 |
|
10 |
8 |
2 |
80 |
170 |
134 |
36 |
79 |
77 |
62 |
15 |
81 |
|
6 |
6 |
0 |
100 |
116 |
91 |
25 |
78 |
73 |
55 |
18 |
75 |
|
4 |
4 |
0 |
100 |
58 |
42 |
16 |
72 |
58 |
42 |
16 |
72 |
|
8 |
6 |
2 |
75 |
113 |
60 |
53 |
53 |
116 |
65 |
51 |
56 |
|
6 |
4 |
2 |
67 |
90 |
43 |
47 |
48 |
87 |
43 |
44 |
49 |
|
7 |
6 |
1 |
86 |
120 |
68 |
52 |
57 |
114 |
65 |
49 |
57 |
|
7 |
7 |
0 |
100 |
118 |
95 |
23 |
81 |
93 |
78 |
15 |
84 |
|
10 |
6 |
4 |
60 |
146 |
83 |
63 |
57 |
110 |
74 |
36 |
67 |
|
5 |
3 |
2 |
60 |
117 |
67 |
50 |
57 |
96 |
57 |
39 |
59 |
|
16 |
10 |
6 |
63 |
258 |
148 |
110 |
57 |
124 |
73 |
51 |
59 |
|
12 |
8 |
4 |
67 |
212 |
122 |
90 |
58 |
75 |
49 |
26 |
65 |
|
11 |
10 |
1 |
91 |
179 |
137 |
42 |
77 |
102 |
70 |
32 |
69 |
|
7 |
5 |
2 |
71 |
118 |
74 |
44 |
63 |
63 |
41 |
22 |
65 |
|
296 |
247 |
49 |
83 |
5051 |
3374 |
1677 |
67 |
2997 |
1897 |
1100 |
63 |
-
The fourth column shows the total number and the percentages of U.S. and non-U.S. participants (speakers) in the VWC for each subarea. These numbers include duplications, i.e., if a specific person was recommended by two experts for the same congress, the entry in the totals is 2.
-
The fifth column is based on the same information as the middle section, but each participant has been counted once, even if he/she was proposed by several experts.
A total of 296 experts in various areas of chemical engineering were engaged to organize the VWC (see Appendix 3A at the end of this chapter): 83% from the United States and 17% from other countries. For the various subareas the percentage of U.S. organizers ranged from 60% (electrochemical processes; green engineering) to 100% (thermodynamics; separation; catalysis; systems, computational, and synthetic biology; materials for cell and tissue engineering; fossil energy extraction and processing; water pollution), depending on the specific subarea. The preponderance of U.S. names is not surprising given the historical strength of chemical engineering in the United States.
The composition of the resulting Virtual World Congresses, overall and for the various subareas, is the outcome of significance for this benchmarking exercise. As Table 3.1 indicates, 2,997 researchers were recommended for inclusion in the VWC: 1,897 (63%) from the United States and 1,100 (37%) from other countries. The 63% overall U.S. representation in the VWC is in line with the fractional U.S. representation in the list of most-cited publications for 2000-2006 (74%, see Table 3.3), which is a metric that also denotes relative quality and impact. Consequently, the overall composition of the VWC suggests that U.S. chemical engineering research, at large, is “Dominant, at the Forefront” of developments in the discipline.
When we examine the U.S. fractional representation in the VWC for each subarea, we notice that it varies from 42% (biocatalysis and protein engineering) to 77% (transport processes) of all participants, suggesting that U.S. research in every subarea of chemical engineering is either “Dominant, at the Forefront” (65% or more of participants) or “Among World Leaders” (42% to 65% of participants).
In Chapter 4, the specific numbers of Table 3.1 for each subarea are analyzed in conjunction with other information, in order to draw conclusions on the relative position of U.S. chemical engineering research in the corresponding subarea.
3.2
JOURNAL PUBLICATIONS
In this section we will discuss the macroscopic trends, on a worldwide basis, of the publications and citations data collected for five time periods from 1980 to 2006 for the field of chemical engineering at large. Appendix 3B lists all the journals that were considered. They were grouped in the following three categories:
-
journals with broad coverage of chemical engineering research
-
journals with broad coverage of sciences and engineering disciplines, in which chemical engineers publish
-
leading journals for each subarea of chemical engineering
The total number of papers published was found by searching the Web of Science (http://portal.isiknowledge.com/portal.cgi) for all publications during the corresponding period, with the requirement that a co-author had a chemical engineering affiliation in the address field. For the United States, a chemical engineering affiliation is a good indicator that a researcher is involved in chemical engineering research. Recent changes in the affiliation of academic researchers from chemical engineering departments to biological engineering or biomedical engineering departments have been taken into account; biological and biomedical engineering departments populated recently by the transfer of chemical engineers were included in the search and the lists were pruned by eliminating the faculty members in these departments who did not hold a Ph.D. in chemical engineering.. However, for non-U.S. researchers with research activities within the scope of chemical engineering as understood in the United States, the corresponding affiliation is not a very good indicator. Many such researchers are affiliated with departments that do not contain “chemical engineering” in their name. Particular attention on select very active universities in Europe and Japan (e.g. ETH-Zurich and Kyoto University, respectively), was given to include the contributions of the non-U.S. researchers who would qualify as chemical engineers, but the numbers of papers by non-U.S. chemical engineering researchers should be viewed as lower bounds.
3.2.a
Summary of the Macro Trends
Analysis of publications and citations by chemical engineers in all three groups of journals has revealed the following trends:
-
Trend 1: The relative volume of the U.S.-originated journal publications by chemical engineers, as a fraction of the worldwide total, has been halved over the past 20 years.
-
Trend 2: U.S. publications in chemical engineering continue to exercise academic leadership with strong scientific and technological impact worldwide. The relative degree of leadership has been decreasing over the past 10 years.
-
Trend 3: The relative volume (as a fraction of the total) of U.S.-originated publications in broadly based chemical engineering journals has been reduced by 25%-30% over the past 10-15 years.
-
Trend 4: The fraction of U.S.-originated contributions, in broadly based chemical engineering journals, with research subjects in the classical coreareas of transport processes, thermodynamics, kinetics and reaction engineering, and process systems engineering, has been reduced by more than the overall fraction in Trend-3, i.e., 50%-60% versus 25%-30% reductions.
-
Trend 5: The fraction of the top-cited (in the top 100 most-cited papers) U.S.-originated publications in broadly based chemical engineering journals has been reduced by one-third over the past 10-15 years.
-
Trend 6: The fraction of chemical engineering contributions in broadly based scientific journals, e.g., Science, Nature, Proceedings of the National Academy of Sciences, has roughly doubled in the past 5-10 years. Among such contributions U.S.-originated publications represent about 90% of the total.
Taken together, the implications from the above trends are clear:
-
Implication 1: The volume of research in chemical engineering around the world, especially in the European Union and Asia has been increasing at a higher (European Union) and frantic (Asia) rate compared to that in the United States, but the quality and impact still trail appreciably that in the United States.
-
Implication 2: Research in U.S. chemical engineering has been driven away from the historical core of chemical engineering toward the periphery, where it meets and overlaps with a variety of other sciences (primarily) and engineering disciplines (secondarily).
-
Implication 3: While the quality and impact of U.S. research in chemical engineering is still dominant and at the forefront of developments, this leadership position has been weakened over the past 10-15 years, especially in the core areas of the discipline.
In the following paragraphs we will present the details of the data analysis that led to the formation of the above trends and implications.
3.2.b
Analysis of Publications and Citations from All Journals
The number of papers from U.S. chemical engineering researchers has dominated the world output over the past 20 years, as Table 3.2 and Figure 3.1 indicate. However, although the number of U.S.-originated publications has increased by a factor of 3.7, its relative contribution to the world total during the past 20 years has been roughly halved from 71% in the period 1980-1984 to 37% in the period 2000-2006 (Trend 1). This is due to a significantly faster growth in the number of publications from chemical engineering researchers across the world. For example, the factor of growth between the 1980-1984 and 2000-2006 periods for various geographic regions is as follows:
-
Asia (China, Korea, Taiwan, India): 35
-
Central and South America: 23
-
European Union (25 countries): 15
-
Japan: 4
The 3.7-fold increase in the volume of U.S. publications is primarily the result of an impressive growth in productivity of U.S. researchers, given the fact that the yearly rate of growth in the number of researchers has not increased by a similar factor (see Chapter 5 for trends in numbers of PhD graduates). In contrast, most of the gains in the growth of Asian and European Union publications have come as a result of a significant yearly rate of growth in the number of researchers.
While the relative volume of U.S.-originated chemical engineering publications, as fraction of the world total, has been halved, the academic impact and leadership of the U.S. chemical engineering output has remained at fairly high levels (Trend 2). For example:
TABLE 3.2 Number of Published Papers Originated from Researchers with Chemical Engineering Affiliation at Various Geographic Regions
|
|
1980-1984 |
1985-1989 |
1990-1994 |
1995-1999 |
2000-2006 |
|
United States |
8,933 |
14,230 |
17,528 |
21,334 |
32,899 |
|
European Union |
890 |
1,715 |
3,470 |
7,015 |
13,442 |
|
Japan |
1,647 |
2,386 |
3,209 |
4,022 |
6,978 |
|
Canada |
1,182 |
1,617 |
2,234 |
2,605 |
4,246 |
|
South America |
81 |
121 |
271 |
651 |
1,863 |
|
Asia (China, Korea, Taiwan, India) |
958 |
1,837 |
3,907 |
9,930 |
33,124 |
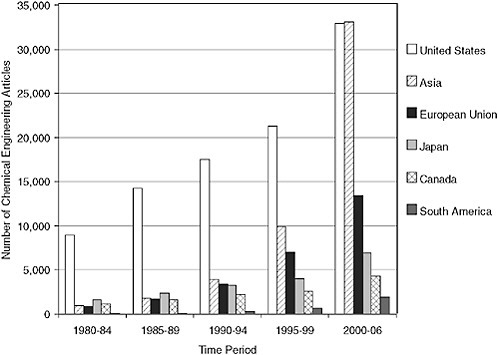
FIGURE 3.1 Number of published papers in chemical engineering from various geographic regions.
NOTE: Asia comprises China, Korea, Taiwan, and India, and the European Union is 25 countries.
-
Table 3.3 shows that U.S.-originated publications completely dominated the list of the 100 most-cited publications when the analysis was carried out for the period 1985-1990: 86 of the top 100, 46 of the top 50, 19 of the top 20, and 10 of the top 10. The analysis for the period 2000-2006 indicates a continued but weaker dominance of U.S. publications in the list of the 100 most cited: 73 of the top 100, 37 of the top 50, 13 of the top 20, and 6 of the top 10. It is worth noting that of the 86 most-cited U.S. publications with U.S. chemical engineers as co-authors (period, 1985-1990), 73 had a chemical engineer as the corresponding author, while 13 had a U.S. nonchemical engineer as the corresponding author. In the period 2000-2006, of the 74 most-cited U.S. papers, the corresponding numbers are 50 with a chemical engineer as the corresponding author and 24 with a nonchemical engineer as the corresponding author, indicating an appreciable expansion in interdisciplinary research collaboration. This feature of substantial interdisciplinarity will become more evident later on in this report in Chapter 4. It is also noteworthy that in the period 2000-2006, no
TABLE 3.3 Most-Cited Papers by Researchers with Chemical Engineering Affiliation (1985-1990 and 2000-2006)
|
|
1985-1990 |
|
2000-2006 |
||||||||
|
U.S. |
EU |
Canada |
Japan |
Australia |
U.S. |
EU |
Canada |
Switzerland |
Asia |
||
|
Top 100 |
86 |
2 |
5 |
5 |
2 |
Top 100 |
73 |
10 |
3 |
1 |
13 |
|
Top 10 |
10 |
0 |
0 |
0 |
0 |
Top 10 |
6 |
3 |
|
1 |
|
|
Top 20 |
19 |
0 |
1 |
0 |
0 |
Top 20 |
13 |
4 |
|
1 |
2 |
|
Top 30 |
28 |
0 |
1 |
1 |
0 |
Top 30 |
20 |
4 |
2 |
1 |
3 |
|
Top 50 |
46 |
1 |
1 |
1 |
1 |
Top 50 |
37 |
6 |
2 |
1 |
4 |
-
Japanese contributions were in the top 100 and Asian contributions came from Korea and China.
-
Table 3.4 shows the distribution of the most-cited papers among the various subareas, used to characterize chemical engineering for the purposes of this report, thus underlining the shifts in research emphasis during the past 15-20 years. From the entries of the table it is very clear how the research emphasis has shifted from Area-1 to Areas- 3, 5, and 6. Clearly, numbers of citations vary significantly among the various subareas and may cause uncertainty on the validity of the observed trends. However, these trends will be confirmed with additional data in subsequent paragraphs.
-
It is also interesting to see in what journals the most-cited papers were published. Table 3.5 shows the distribution of the most-cited papers among different groups of papers. These trends will be confirmed with additional data in subsequent paragraphs.
-
The graphs in Figures 3.2 and 3.3 show the evolution of the percentages of published papers from each geographic region with more than 200 and 100 citations, respectively, during the last 20 years. The graph of Figure 3.4, percentage of papers with more than 10 citations, shows a relative parity among the various regions, but this is the group of publications of lesser impact. Note: The numbers in Figures 3.2, 3.3, and 3.4 are percentages of the total number of papers from a given geographic area that satisfy the corresponding citations thresholds.
Clearly, the U.S. dominance in academic impact and leadership, demonstrated by the tables and figures is partly due to historical reasons, that is, to the earlier activity of U.S. researchers compared to that of their Asian and EU counterparts. One would expect that as non-U.S. contributions to archival journals increase, their relative impact will increase as well. Indeed, it noteworthy that of the top 100 most-cited papers, 13 have come from
TABLE 3.4 Distribution of 100 Most-Cited Papers Among the Areas of Chemical Engineering Considered in This Report
|
Area |
|
Subarea |
1985-1990 100 Most-Cited Papers |
2000-2006 100 Most-Cited Papers |
|
Engineering Science of Physical Processes |
1a |
Transport processes |
14 |
2 |
|
1b |
Thermodynamics |
24 |
10 |
|
|
1c |
Rheology |
7 |
5 |
|
|
1d |
Separation |
10 |
5 |
|
|
1e |
Solid particles technology |
2 |
0 |
|
|
Engineering Science of Chemical Processes |
2a |
Catalysis |
12 |
11 |
|
2b |
Kinetics and reaction eng. |
9 |
4 |
|
|
2c |
Polymerization reaction eng. |
2 |
6 |
|
|
2d |
Electrochemical processes |
0 |
0 |
|
|
Engineering Science of Biological Processes |
3a |
Biocatalysis and protein eng. |
1 |
3 |
|
3b |
Cellular and metabolic eng. |
0 |
6 |
|
|
3c |
Biochemical engineering |
3 |
0 |
|
|
3d |
Systems, computational, and synthetic biology |
0 |
2 |
|
|
Molecular and Interfacial |
4a |
10 |
12 |
|
|
Science and Engineering Materials |
5a |
Polymers |
13 |
7 |
|
5b |
Inorganic and ceramic materials |
3 |
19 |
|
|
5d |
Composite |
2 |
4 |
|
|
5e |
Nanostructured materials |
1 |
11 |
|
|
Biomedical Products and Biomaterials |
6a |
Drug targeting and delivery systems |
3 |
3 |
|
6b |
Biomaterials |
1 |
5 |
|
|
6c |
Materials for cell and tissue engineering |
1 |
7 |
|
|
Energy |
7a |
Fossil energy extraction and processing |
0 |
0 |
|
7b |
Fossil fuel utilization |
1 |
3 |
|
|
7d |
Non-fossil energy |
0 |
1 |
|
|
Environmental Impact and Management |
8a |
Air pollution |
0 |
0 |
|
8b |
Water pollution |
1 |
0 |
|
|
8c |
Aerosol science and technology |
0 |
1 |
|
|
8d |
Green engineering |
0 |
1 |
|
|
Process Systems Development and Engineering |
9a |
Process development and design |
0 |
0 |
|
9b |
Dynamics, control, operational optimization |
2 |
1 |
|
|
9c |
Safety and operability of chemical plants |
0 |
0 |
|
|
9d |
Computational tools and information technology |
0 |
0 |
|
|
TOTAL |
122 |
129 |
||
|
OVERLAPa |
|
|
22 |
29 |
|
a The overlap results from accounting the same paper as separate entry in more than one area/subarea. |
||||
TABLE 3.5 Distribution of Most-Cited Papers for 1985-1990 and 2000-2006 by Groups of Journals, Indicating Shifts in Direction and Emphasis for Various Subareas of Chemical Engineering
|
Journals |
1985-1990 |
2000-2006 |
|
AIChE J., I&EC Research, Chemical Engineering Science |
10 |
4 |
|
Science, Nature, PNAS |
9 |
18 |
|
J. Chemical Physics, J. Physical Chemistry, Physical Review Letters, Physical Chemistry-Chemical Physics |
13 |
8 |
|
Journal of the American Chemical Society, Accounts of Chem Res. |
3 |
10 |
|
Analytical Chem., J. Electron Microscopy, J. Optical Society of America |
5 |
0 |
|
Chemical Reviews, Molecular Physics, Fluid Phase Equilibria |
5 |
3 |
|
Phys. Reviews Letters, J. Applied Physics, Applied Physics Letters |
0 |
6 |
|
J. Catalysis, Advances in Catalysis, Surface Science, Catalysis Reviews, J. of Solid State Chemistry |
6 |
2 |
|
Macromolecules, Polymer, J. Polymer Science, Polymer Science and Eng. |
12 |
12 |
|
J. Fluid Mechanics, Annual Reviews of Fluid Mechanics, J. Rheology |
6 |
0 |
|
Langmuir, J. Colloids and Interfacial Science |
4 |
2 |
|
Cancer Research, J. National Cancer Institute |
5 |
0 |
|
Biotechnology and Bioengineering |
2 |
0 |
|
Nature Biotechnology |
0 |
4 |
|
Advanced Materials, Chemistry of Materials |
0 |
5 |
|
Biomaterials, Biomacromolecules |
0 |
3 |
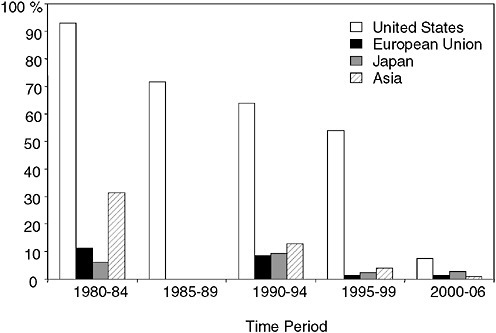
FIGURE 3.2 Percentage of journal articles with 200 or more citations, by region (e.g., 93% of all U.S. publications and 12% of all EU publications during 1980-1984 received more than 200 citations).
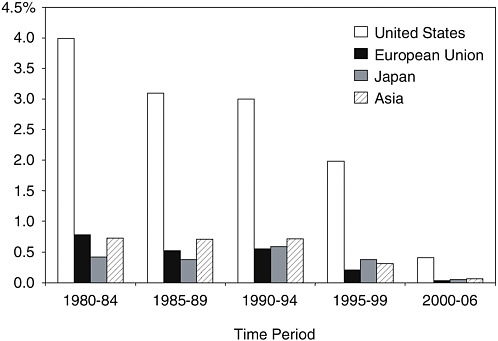
FIGURE 3.3 Percentage of journal articles with 100 or more citations, by region (e.g., 4% of all U.S. and 0.7% of all EU publications during 1980-1984 received more than 100 citations).
the four Asian countries with a relatively brief presence in the international chemical engineering arena.
3.2.c
Analysis of Publications and Citations from Journals with Broad Coverage of Chemical Engineering Themes
Three journals have become the main depositories of archival research contributions from a broad spectrum of chemical engineering activities across the world:
-
AIChE Journal, with a 2005 Impact Factor (IF)1 = 2.036
-
Chemical Engineering Science, with an Impact Factor = 1.735
-
Industrial and Engineering Chemistry Research, with an Impact Factor = 1.504
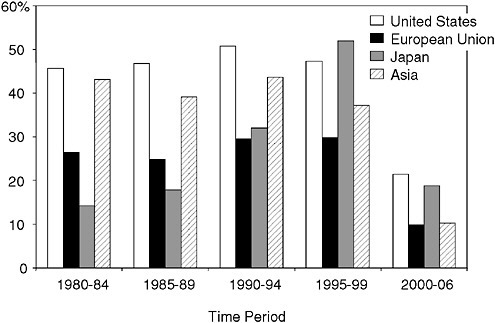
FIGURE 3.4 Percentage of journal articles with 10 or more citations, by region. (e.g., 47% of all U.S. and 43% of all Asian publications during 1980-1984 received more than 10 citations).
Three others, Chemical Engineering Research and Design (IF = 0.792), Chemie Ingenieur Technik (IF = 0.392), and Canadian Journal of Chemical Engineering (IF = 0.574), have a more geographically limited pool of contributions and significantly lesser impact on the leading developments in chemical engineering research. Consequently, our analysis of broadly based trends in research contributions that span the full range of chemical engineering interests were based on data from the first three journals and can be summarized as follows:
-
The number of papers contributed from U.S.-based researchers represents a decreasing fraction of all papers published in the three broad chemical engineering journals.
-
The fractions of papers contributed from European Union and Asian researchers have been increasing at an appreciable rate.
-
Although the U.S. still maintains a very healthy leadership position, the preeminence enjoyed by U.S. contributions during the 1980s (as depicted by the fraction of U.S. papers in the top 100 most-cited papers in each of the three journals) has been eroded.
-
Asian contributions are increasing in number and quality, closing the historical gaps quickly.
In the following paragraphs we present the detailed data for the three journals:
-
AIChE Journal: From Table 3.6 we note that the percentage contribution of published papers originating from researchers in U.S. institutions has been decreasing over the past 20 years, with contributions from the European Union and Asia taking up the difference. However, the U.S. maintains a strong leadership position when one examines the fractions of the top 100 most-cited papers generated by each region (Table 3.7). While the percentage of most-cited papers from the United States has been decreasing, the corresponding percentages of European Union and Asian (China, India, Korea, Taiwan) contributions have been increasing appreciably.
-
Chemical Engineering Science: Analogous trends are revealed by the analysis of the publications in Chemical Engineering Science:
-
The percentage of papers from U.S. authors has decreased over the past 20 years, the contributions from the European Union have
-
TABLE 3.6 Papers Published in AIChE Journal
|
|
1990-1994 |
1995-1999 |
2000-2006 |
|||
|
No. of Papers |
% |
No. of Papers |
% |
No. of Papers |
% |
|
|
United States |
666 |
63 |
786 |
52 |
799 |
43 |
|
European Union |
132 |
13 |
306 |
20 |
515 |
28 |
|
Asia |
86 |
8 |
182 |
12 |
312 |
17 |
|
Japan |
32 |
3 |
68 |
4 |
79 |
4 |
|
Canada |
59 |
6 |
86 |
6 |
73 |
4 |
|
South America |
10 |
1 |
26 |
2 |
57 |
3 |
|
Other |
67 |
6 |
67 |
4 |
36 |
2 |
|
Total Papers Published |
1,052 |
|
1,521 |
|
1,871 |
|
TABLE 3.7 Distribution of the 100 Most-Cited Papers in AIChE Journal
|
|
1990-1994 |
1995-1999 |
2000-2006 |
|
United States |
78 |
61 |
57 |
|
European Union |
9 |
22 |
21 |
|
Asia |
2 |
5 |
9 |
|
Japan |
4 |
2 |
5 |
|
Canada |
3 |
6 |
2 |
TABLE 3.8 Number of Papers Published in Chemical Engineering Science
|
|
1990-1994 |
1995-1999 |
2000-2006 |
|||
|
No. of Papers |
% |
No. of Papers |
% |
No. of Papers |
% |
|
|
United States |
608 |
30 |
570 |
23 |
670 |
19 |
|
European Union |
703 |
35 |
975 |
40 |
1,306 |
38 |
|
Asia |
237 |
12 |
383 |
16 |
771 |
22 |
|
Japan |
54 |
3 |
97 |
4 |
183 |
5 |
|
Canada |
142 |
7 |
157 |
6 |
228 |
7 |
|
South America |
45 |
2 |
71 |
3 |
126 |
4 |
|
Other |
230 |
11 |
207 |
8 |
160 |
5 |
|
Total Papers Published |
2,019 |
|
2,460 |
|
3,444 |
|
-
-
remained the same level, and the number of papers from Asia has exhibited a marked increase (Table 3.8).
-
-
The U.S. percentage of the 100 most-cited papers (Figure 3.5) has decreased while the European Union percentage has remained at about the same level. However, citations for Asian papers have increased appreciably.
-
I&EC Research: The data from I&EC Research (Table 3.9 and Figure 3.6) reveal a similar picture:
-
The percentage of papers from the United States has been decreasing, while the percentages of contributions from the European Union and Asia have been increasing.
-
The percentages of most-cited papers from the United States has been on the decline, but it still maintains a very healthy leadership position. However, the gap is being closed by an increase in the percentages of most-cited papers from the European Union and Asia.
-
As the percentage of U.S. contributions to the mainstream chemical engineering journals has been decreasing over the past 20 years, certain core areas of chemical engineering have been affected especially hard. For example, if we define
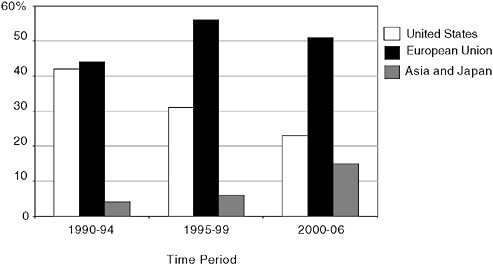
FIGURE 3.5 Distribution of the top 100 most-cited papers in Chemical Engineering Science.
TABLE 3.9 Number of Papers Published in I&EC Research
|
|
1990-1994 |
1995-1999 |
2000-2006 |
|||
|
No. of Papers |
% |
No. of Papers |
% |
No. of Papers |
% |
|
|
United States |
860 |
47 |
1,139 |
39 |
1,705 |
32 |
|
European Union |
359 |
20 |
707 |
24 |
1,448 |
27 |
|
Asia |
291 |
16 |
497 |
17 |
1,183 |
22 |
|
Japan |
136 |
7 |
168 |
6 |
299 |
6 |
|
Canada |
93 |
5 |
193 |
7 |
318 |
6 |
|
South America |
38 |
2 |
92 |
3 |
279 |
5 |
|
Other |
49 |
3 |
99 |
4 |
41 |
2 |
|
Total Papers Published |
1,829 |
|
2,895 |
|
5,273 |
|
then analysis of the data from the three journals indicates that
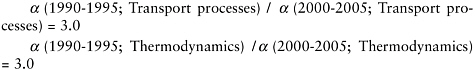
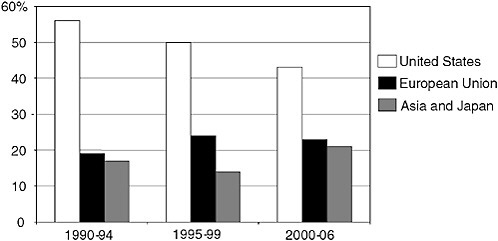
FIGURE 3.6 Distribution of the top 100 most-cited papers in I&EC Research.
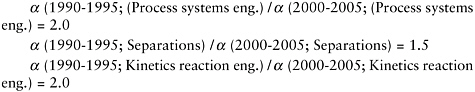
In other words, the representation of U.S. contributions in the above five core areas has been reduced over the past 10 years by a relative factor between 1.5 and 3.0.
3.2.d
Analysis of Publications and Citations from Journals with Contributions from Several Disciplines
While the percentage of U.S. research contributions in broadly based chemical engineering journals has been decreasing and European Union and Asian contributions take up a larger share, chemical engineering researchers in the United States have been increasing their presence in scientific journals with contributions from many disciplines, such as Science, Nature, and Proceedings of the National Academy of Sciences. These are journals with significantly higher impact factors, indicating that U.S. researchers are expanding their reach into areas of science and engineering of increasingly multidisciplinary interest.
In the following paragraphs we present the results of the analysis of data from these three journals:
-
SCIENCE: Table 3.10 indicates that contributions from chemical engineers worldwide have increased by a factor of nearly 2, from the 1990-1994 to the 2000-2006 period. A closer look at the number of chemical engineering contributions during the past 5 to 6 years (Figure 3.7) indicates that the doubling of contributions actually occurred during this period. This surge has been led by U.S. chemical engineering researchers, who have contributed 95% of these papers. This is a very strong indicator that the U.S.
TABLE 3.10 Number of Research Papers (Articles) Published in Science
|
|
1990-1994 |
1995-1999 |
2000-2006 |
|||
|
No. of Papers |
% |
No. of Papers |
% |
No. of Papers |
% |
|
|
Total No. of Papers |
4,711 |
|
4,985 |
|
5,831 |
|
|
Total No. of Chem. Eng. Papers |
51 |
1 |
72 |
1 |
106 |
2 |
|
U.S., Chem. Eng. |
48 |
95 |
68 |
94 |
101 |
95 |
|
EU, Chem. Eng. |
6 |
11 |
9 |
13 |
19 |
18 |
|
Asia, Chem. Eng. |
0 |
0 |
3 |
4 |
11 |
10 |
|
Canada, Chem. Eng. |
0 |
0 |
1 |
1 |
1 |
1 |
|
S. America, Chem. Eng. |
0 |
0 |
2 |
3 |
2 |
2 |
|
Internationalization (overlap) |
|
5 |
|
15 |
|
26 |
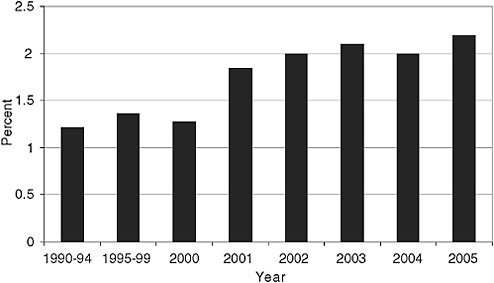
FIGURE 3.7 Percentage of papers in Science with chemical engineering co-authorship.
-
chemical engineering researchers have been leading the exploration of new frontiers and opportunities at the interface with other disciplines. While the percentage of papers that originated from chemical engineering researchers is still low (about 2%), it is nevertheless quite remarkable, given the tremendous competition from other disciplines and the relatively smaller number of chemical engineering researchers.
-
PNAS: The trends in the Proceedings of the National Academy of Sciences publications (Tables 3.11 and 3.12) are similar to those observed in Science, namely an increasing fractional representation of chemical engineering contributions, with a dominant percentage of those contributions coming from the United States.
TABLE 3.11 Number of Papers Published in the Proceedings of the National Academy of Sciences
|
|
1990-1994 |
1995-1999 |
2000-2006 |
|||
|
No. of Papers |
% |
No. of Papers |
% |
No. of Papers |
% |
|
|
Total No. of Papers |
11,814 |
|
13,053 |
|
18,100 |
|
|
Total No. of Chem. Eng. Papers |
46 |
0.39 |
82 |
1 |
181 |
1 |
|
U.S., Chem. Eng. |
46 |
100 |
79 |
96 |
175 |
97 |
|
EU, Chem. Eng. |
1 |
2 |
4 |
5 |
17 |
9 |
|
Asia, Chem. Eng. |
1 |
2 |
3 |
4 |
12 |
7 |
|
Canada, Chem. Eng. |
1 |
2 |
2 |
2 |
3 |
2 |
|
S. America, Chem. Eng. |
0 |
0 |
0 |
0 |
2 |
10 |
|
Internationalization (overlap) |
|
7 |
|
7 |
|
15 |
TABLE 3.12 Number of Papers Published in the Proceedings of the National Academy of Sciences during the Past 6 Years
|
|
2000 |
2001 |
2002 |
2003 |
2004 |
2005 |
|
Total No. of Papers |
2,484 |
2,468 |
2,680 |
2,803 |
2,909 |
2,847 |
|
Total No. of U.S. Papers |
1,868 |
1,872 |
2,007 |
2,166 |
2,170 |
2,172 |
|
% of U.S. Papers |
75.20 |
75.85 |
74.89 |
77.27 |
74.60 |
76.29 |
|
Total No. of Chemical Eng. Papers |
11 |
23 |
19 |
29 |
31 |
35 |
|
% of Chemical Eng. Papers |
0.44 |
0.93 |
0.71 |
1.03 |
1.07 |
1.23 |
|
Total No. of U.S. Chemical Eng. Papers |
10 |
22 |
19 |
28 |
31 |
34 |
|
% of U.S. Papers Among Chemical Eng. Papers |
90.91 |
95.65 |
100.00 |
96.55 |
100.00 |
97.14 |
-
Nature: Chemical engineering contributions during the past 10 years have doubled in number (from 25 in 1990-1994 to nearly 50 in 2000-2006) but their fraction of the total has increased only a little (51% in 1990-1994 to 68% in 2000-2006). More than 90% of the chemical engineering contributions come from U.S. researchers.
3.2.e
Analysis of Publications and Citations in Area-Specific Journals
U.S. chemical engineering researchers have been publishing in a long list of journals spanning a very broad range of specific subjects. Depending on the specific area of interest, the contributions of U.S. chemical engineers have varied from 1% (for subareas such as control) to 20% (for subareas such as transport, thermodynamics, catalysis) of the papers published in area-specific journals. Tables 3.13 and 3.14 provide a partial view of the present situation (Appendix 3B lists all the subarea-specific journals whose publications were analyzed). We will not draw any conclusions here from
TABLE 3.13 Chemical Engineering Contributions in Area-Specific Journals (numbers are percentages of papers contributed from chemical engineering researchers in the corresponding journal)
|
Journal |
1990-1994 |
1995-1999 |
2000-2006 |
|||
|
Total Chem. Eng. |
U.S. Chem. Eng. |
Total Chem. Eng. |
U.S. Chem. Eng. |
Total Chem. Eng. |
U.S. Chem. Eng. |
|
|
Fluid Mechanics; Physics of Fluids |
7.9 |
6.9 |
8.3 |
7.1 |
7.8 |
5.8 |
|
Fluid Phase Equilibria; J. Chemical Thermodynamics |
27.9 |
11.2 |
29.5 |
9.9 |
28.8 |
6.8 |
|
Molecular Simulation |
14.9 |
8.5 |
8.6 |
6.4 |
16.4 |
15.7 |
|
J. of Chemical Physics; and J. Physical Chemistry B |
7.3 |
7.0 |
5.6 |
5.0 |
3.8 |
3.2 |
|
J. Catalysis; Applied Catalysis-A and B |
21.0 |
8.4 |
25.5 |
12.6 |
29.5 |
17.8 |
|
Polymer |
16.5 |
5.9 |
14.5 |
5.3 |
10.3 |
6.2 |
|
Progress in Polymer Science |
5.5 |
1.7 |
3.4 |
1.3 |
5.3 |
0.8 |
|
Macromolecules |
16.6 |
10.9 |
13.5 |
10.1 |
11.3 |
9.3 |
|
Metabolic Engineering (2002-06) |
|
|
|
|
36.7 |
29.1 |
|
Enzyme and Microbial Technology |
16.0 |
1.9 |
15.8 |
1.8 |
14.1 |
6.2 |
|
AUTOMATICA |
3.5 |
1.7 |
4.1 |
1.9 |
|
|
|
IEEE Transaction on Automatic Control |
0.8 |
0.5 |
1.2 |
1.0 |
1.2 |
1 |
TABLE 3.14 Chemical Engineering Contributions in Area-Specific Journals (partial list)
|
Journal |
1995-2006 |
|
|
Chem. Eng. (% of published papers) |
U.S. Chem. Eng. (% of published papers) |
|
|
J. of Rheology |
30-50 |
15-20 |
|
J. Non-Newtonian Fluid Mechanics |
20-30 |
9-12 |
|
Rheological Acta |
25-35 |
10-12 |
|
International Journal of Multiphase Flow |
10-12 |
3-5 |
|
Powder Technology |
25-30 |
8-10 |
|
Catalysis Today |
15-25 |
3-5 |
|
J. Applied Electrochemistry |
15-20 |
2-3 |
|
Proteins: Structure, Function and Bioinformatics |
1-2 |
0.90-1.4 |
|
Protein Science |
2-4 |
~ (2-4) |
|
Langmuir |
15-20 |
5-10 |
|
J. Colloid and Interface Science |
15-20 |
10-15 |
|
Advanced Materials |
5-15 |
5-10 |
|
Chemistry of Materials |
5-10 |
6-8 |
|
J. American Ceramic Society |
2-6 |
2-5 |
|
Polymer Composites |
10-20 |
5-10 |
|
Nano Letters |
6-8 |
~ (6-8) |
|
J. Controlled Release |
8-10 |
7.5-9.5 |
|
Advanced Drug Delivery Reviews |
3-5 |
~ (3-5) |
|
Pharmaceutical Research |
2-5 |
~ (2-5) |
|
J. Biomaterials Science: Polymer Edition |
15-25 |
8-12 |
|
Biomacromolecules |
8-10 |
7-9 |
|
J. Biomedical Materials Research |
7-10 |
5-9 |
|
Lab-on-a-Chip |
7-9 |
6.5-8.5 |
|
Combustion and Flame |
5-10 |
2-3 |
|
Fuel |
20-25 |
3-5 |
|
Combustion Science and Technology |
3-8 |
2-4 |
|
Combustion Theory and Modeling |
4-8 |
2-4 |
|
Environmental Science and Technology |
5-8 |
3-4 |
|
J. Environmental Engineering |
4-10 |
2-6 |
|
Aerosol Science and Technology |
10-20 |
7-15 |
|
J. Aerosol Science |
5-12 |
2-6 |
|
SIAM Journal on Optimization |
~ 1 |
~ 1 |
|
SIAM Journal on Scientific Computing |
1-2 |
1-2 |
|
Optimization and Engineering |
5-15 |
4.8-14.5 |
|
Mathematical Programming |
0.8-1.0 |
0.9-1.0 |
|
J. Optimization Theory and Applications |
0.5 |
0.5 |
|
J. Global Optimization |
3.5-4.0 |
3.4-3.9 |
|
INFORMS J. on Computing |
0.5 |
0.5 |
|
Annals of Operations Research |
1 |
1 |
these data, because the sections in Chapter 4 will provide a more detailed analysis of the publication trends in specific subareas and will describe the relative position of U.S. contributions versus those of other geographic regions.
3.3
PATENT PUBLICATION ANALYSIS
Chemical sciences and engineering have resulted in the most enabling science/technology combination to underpin technology development in every industrial sector, as a study sponsored by the Council for Chemical Research (CCR) has revealed.2 Indeed, as the U.S. Patent and Trademark Office data in the CCR report indicate, each industry builds on chemical technology as prior art. Furthermore, the CCR study has found that chemical companies with highly cited patents have stronger financial performance than companies with lower impact patents; their stock prices, operating revenues, and profits are 35%-60% higher, on average. Additionally, companies that invest in high-quality technology that continues to influence the technological directions of the chemical industry have the most favorable financial performance.
All of the above observations have a direct linkage with the capacity of the U.S. chemical engineering research enterprise to deliver scientific results for high-quality patents and produce first-rate human resources. In this section we will examine the competitiveness of U.S. chemical engineering research in producing technological knowledge for patents with high impact.
Clearly, a complete and authoritative study linking U.S. research in chemical engineering to high-impact patents, where impact is measured by the financial performance of the chemical companies driven by these patents, is an overwhelming task and beyond the charge of this panel. Most of the necessary information for such study cannot be disaggregated from financial results, which in their raw form are not available to the general public. Therefore, the Panel opted to generate indirect evidence by asking the following questions:
-
What is the productivity of U.S. chemical engineering departments in generating patents and how does it compare to the productivity of non-U.S. research institutions?
-
What is the impact of U.S. academic chemical engineering research in the formation of industrial patents? How does it compare to the impact of non-U.S. chemical engineering research?
-
What is the competitiveness of the U.S. industrial research in generating high-impact patents?
By themselves, the answers to these questions are of little significance, but when taken together with the other metrics used in this study, e.g., publications, citations, and the VWC, they can contribute to a better-rounded overall assessment of the U.S. competitiveness in chemical engineering research.
3.3.a
Patent Productivity of U.S. Chemical Engineering Departments
In 2003 approximately twice as many patents (3,259) in all fields were awarded to all U.S. universities and colleges as in 1994 (1,783).3 The total for the 10-year period is 27,594 (16,545 to public and 10,321 to private institutions). Similar trends have been observed in chemical engineering.
Data from five U.S. chemical engineering departments, with significant numbers of patents awarded, indicate that they produced from 2 to 7.5 patents per active research faculty over a period of 20 years, leading to an index of 0.1 to 0.38 patents per active research faculty per year. These numbers indicate that the following:
-
Patent productivity of active chemical engineering departments is comparable to that in chemistry (0.25 patents per faculty per year; data from three high-ranking chemistry departments) and materials science and engineering (0.35 patents per faculty per year; data from three high-ranking departments).
-
Before 1995-2000, patent productivity of non-U.S. chemical engineering departments had been very low, due to a lack of well-organized Technology Licensing Offices (TLO) within non-U.S. universities. Since 2000 the number of non-U.S. universities with well-organized and purposeful TLOs has increased substantially, especially in Japan and Western Europe. A sample of two European Union and two Japanese chemical engineering departments, all with excellent reputations for academic research, indicated that the corresponding index values are 0.05 to 0.1 patents per faculty per year, significantly lower than that of the active U.S. departments.
3.3.b
Impact of Academic U.S. Chemical Engineering Research on Industrial Patents
To study the impact of academic chemical engineering research on industrial patents, the Panel collected the following data:
-
references of prior art in all of the patents of two major U.S. chemical companies for the years 1995, 2000, and 2005
-
references of prior art in a sample of 500 patents from five chemical companies (three from the United States, one from Europe and one from Japan) awarded by the U.S. Patent Office during the period 1995-2003
The set of seven companies represented commodity production and specialty chemicals and materials production. No pharmaceutical companies were included in the set. The groups of patents examined covered both material structure and process patents.
The results from the analysis of the data are as follows:
-
The percentage of patents with at least one reference to a publication in a scientific journal (i.e., an indication of linkage to academic research) varied from 12% to 60%, with the higher percentage indicating a patent with higher scientific linkage.
-
The percentage of references to scientific journals over the total number of references to prior art varied from 12% to 20%.
-
The percentage of references to published chemical engineering papers over the total number of scientific references varied from 4% to 11%.
-
The percentage of references to U.S.-originated chemical engineering publications over the total number of references to all chemical engineering publications varied from 45% to 70%.
The limited size of the analyzed set of patents notwithstanding, the above numbers suggest the following conclusions:
-
Publications of academic chemical engineering research appear with a frequency of 1 in 9 to 1 in 25 scientific references of the industrial patents examined.
-
The dominance of U.S. chemical engineering publications, among all chemical engineering publications, in shaping industrial patents is quite clear; 1 in 2 to 2 in 3 references are for U.S.-originated publications. This is in agreement with the strong presence of U.S. publications in the lists of the most-cited papers, discussed in Section 3.2.
We should clearly recognize that the above analysis has been based on sets of patents awarded by the U.S. Patent Office and as such the results will undoubtedly be somewhat biased. Patents issued by, for example, the Japanese Patent Office may show a different picture. However, most of the high-impact patents filed and awarded by patent offices around the world
are also filed in the United States through patent, trademark, and copyright mechanisms. Therefore, the above results are quite credible as representative of existing trends.
3.3.c
Competitiveness of U.S. Industrial Research in Generating High-Impact Patents
It is not the purpose of this paragraph to provide a detailed account of the U.S. competitive patent position across the various segments of the chemical industry. Instead, the panel wanted to examine whether the significant strength of the U.S. academic chemical engineering research enterprise (e.g., composition of the VWC, publications, and citations) was reflected in the strength of U.S. industrial research, manifested by strong and differentiating intellectual property position.
First, we note that data on patents in the CCR study, “Measure for Measure: Chemical R&D Powers the U.S. Innovation Engine,” indicate that the impact of U.S.-invented chemical technology patenting (number of citations) has risen steadily, in contrast to the declining impact of Japanese-invented chemical technology patents and the steady but relatively lower impact of German-invented chemical patents.
Second, data were collected for the geographic origins of inventors of patents awarded by the U.S. Patent Office during the period 1985-2005 for a few selected areas of chemical engineering related technological research. The percentages of U.S.-invented patents are shown in Table 3.15.
From the table below it is clear that U.S. companies are in a leadership position in generating intellectual property, but it is also clear that there has been a worrisome decline in the U.S. percentage of generated patents over the past 20 years. U.S. chemical companies have recognized this development and are stepping up their efforts in intellectual property generation.
Furthermore, Table 3.16 summarizes the percentages of U.S. patents awarded to U.S., European, and Asian companies in the areas of industrial
TABLE 3.15 Percentages of U.S.-Invented Patents, Awarded by the U.S. Patent Office, in Various Areas of Research
|
Area of Research |
1985-1989 |
1990-1994 |
1995-1999 |
2000-2005 |
|
Heterogeneous Catalysts |
80 |
60 |
45 |
40 |
|
Homogeneous Catalysts |
55 |
60 |
50 |
45 |
|
Polymerization |
55 |
50 |
41 |
51 |
|
Fluid Flow Related |
80 |
62 |
46 |
42 |
|
Fermentations |
60 |
52 |
55 |
53 |
TABLE 3.16 Percentages of Patents, Awarded by the U.S. Patent Office, to U.S., EU, and Asian Assignees in Three Areas of Chemical Industry for the Years 1995, 2000, and 2005
|
Area of Technology |
1995 |
2000 |
2004 |
||||||
|
U.S. |
EU |
Asia |
U.S. |
EU |
Asia |
U.S. |
EU |
Asia |
|
|
Industrial Separations |
55 |
31 |
14 |
53 |
29 |
18 |
56 |
26 |
19 |
|
Composites |
60 |
13 |
27 |
53 |
18 |
30 |
54 |
18 |
28 |
|
Ceramics |
51 |
22 |
27 |
48 |
22 |
30 |
49 |
18 |
33 |
separations, composites, and ceramic materials. These data show a strong U.S. intellectual property position in all three areas of technology.
3.4
PRIZES, AWARDS, AND RECOGNITIONS
There are no international prizes or awards, which recognize research contributions in chemical engineering at large, akin to the Nobel Prize in Chemistry. Therefore, we cannot use this metric for a direct comparison of U.S. versus non-U.S. contributions in chemical engineering.
However, there is a series of international awards and prizes recognizing research contributions in specific subareas of chemical engineering. In addition, there are national awards open to foreign contestants from several disciplines. The Panel has collected data on the winners for a number of such awards in an effort to assess U.S. leadership in specific subareas of chemical engineering research across disciplines and across geographic regions.
The data suggest the following conclusions:
-
U.S. chemical engineering researchers have received a significant number of prestigious awards with international competition over a broad range of research subareas; fluid mechanics, catalysis, controlled drug release, bioprocesses, aerosol science and engineering, rheology, reaction engineering, combustion, and materials. These awards seem to confirm earlier observations that breadth and depth (quality) co-exist in U.S. chemical engineering research.
-
U.S. chemical engineering researchers have been very competitive with researchers from other disciplines, drawing a significant number of U.S. awards in all subareas of chemical engineering from various disciplinary organizations. Again this information confirms earlier observations on the interdisciplinary competitiveness of U.S. chemical engineering researchers.
3.5
SUMMARY
The analyses in the previous sections has largely been confined to macroscopic trends and assessment of U.S. research in chemical engineering at large. In Chapter 4 each subarea of chemical engineering research is assessed separately, using the same metrics.
Using the results of the overall assessment, discussed in earlier sections of this chapter, as well as the summary overview for all subareas, given in Table 4.45 and discussed in detail in Chapter 4, we can draw the following conclusions regarding the state of U.S. chemical engineering research at large:
-
Conclusion 1: It has enjoyed a preeminent position for the past 50 years and is still at the “Forefront” or “Among the World Leaders” in every subarea of chemical engineering research.
-
Conclusion 2: For the last 10 years it has been facing increased competition from European Union and Asian countries, both in terms of volume of research output as well as quality and impact. Although the percentage of U.S. publications has decreased substantially, the quality and impact still remain very high. It is anticipated that competition will further increase in the future due to globalization and growth of competing economies.
-
Conclusion 3: It has been losing ground in the core areas of chemical engineering (transport processes, thermodynamics, kinetics and reaction engineering, and process systems engineering), which raises concern for its capacity to maintain a sufficient number of highly skilled researchers in these areas.
-
Conclusion 4: It has been moving away from the core research areas of the discipline and is increasingly focusing its attention on subjects of interdisciplinary interest at the interface with applied sciences (physics, chemistry, biology, mathematics) and other engineering disciplines. Within the scope of these interdisciplinary research activities, it is clearly at the “Forefront,” leading the output (volume and quality) of worldwide chemical engineering research.
-
Conclusion 5: It has been generating an increasing number of patents with continuously increasing commercial impact. Patent productivity of U.S. academic chemical engineering researchers is significantly higher than that of researchers in other countries, and has reached rough parity with that of U.S. chemistry and materials science and engineering. Also, its relative impact on industrial patents has increased.
APPENDIX 3A
Experts Who Organized the Virtual World Congress by Nominating Its Keynote Speakers
|
EXPERT (VWC Organizer) |
AFFILIATION |
|
Agassant, Jean-Francois |
ENSMP (France) |
|
Agrawal, Rakesh |
Purdue University |
|
Aizenberg, Joanna |
Alcatel-Lucent Technologies |
|
Allen, David |
University of Texas-Austin |
|
Anseth, Kristi |
University of Colorado |
|
Arastopour, Hamid |
Illinois Institute of Technology |
|
Arendt, Steve |
ABS Consulting |
|
Arkin, Adam |
LBNL/UC Berkeley |
|
Arnold, Frances |
California Institute of Technology |
|
Athanassiou, Kyriacos |
Rice University |
|
Avidan, Amos |
Bechtel, USA |
|
Azapagic, Adisa |
University of Surrey (UK) |
|
Baer, Eric |
Case Western Reserve University |
|
Bakshi, Bhavik |
Ohio State University |
|
Barteau, Mark |
University of Delaware |
|
Basaran, Osman |
Purdue University |
|
Bashir, Rashid |
Purdue University |
|
Bates, Frank |
University of Minnesota |
|
Baxter, Larry |
Brigham Young University |
|
Beer, Janos |
MIT |
|
Bell, Alexis T. |
UC Berkeley |
|
Berger, Scott |
AIChE |
|
Betenbaugh, Michael |
Johns Hopkins University |
|
Bizios, Rena |
University of Texas-San Antonio |
|
Blanch, Harvey |
UC Berkeley |
|
Blankschtein, Daniel |
MIT |
|
Blau, Gary |
Purdue University |
|
Blum, Frank |
University of Missouri-Rolla |
|
Bonvin, Dominique |
EPF Lausanne |
|
Bowman, Chris |
University of Colorado |
|
Brannon-Peppas, Lisa |
University of Texas-Austin |
|
Brinker, Jeffrey |
Sandia National Labs |
|
Buttrey, Douglas |
University of Delaware |
|
Cairns, Elton |
LBNL/UC Berkeley |
|
Caram, Hugo |
Lehigh University |
|
Carberry, John |
Dupont |
|
Chakraborty, Arup |
MIT |
|
Chen, Bingzhen |
Tsinghua University |
|
Chmelka, Bradley |
UC Santa Barbara |
|
Chornet, Esteban |
Usherbrooke (Canada) |
|
Chum, Stepen |
Dow Chemical |
|
Clift, Roland |
Surrey University, UK |
|
EXPERT (VWC Organizer) |
AFFILIATION |
|
Coates, Geoff |
Cornell University |
|
Cohen, Yoram |
UCLA |
|
Cooper, Stuart |
Ohio State University |
|
Coppens, Marc-Olivier |
Technische Universiteit Delft |
|
Corn, John |
Ohio State University |
|
Couvreur, Patrick |
University of Paris |
|
Crowl, Dan Michigan |
Technological University |
|
Dal Pont, Jean-Pierre |
ESPCI (France) |
|
D’Alessio, Antonio |
University of Naples |
|
Dam-Johansen, Kim |
DTU (Denmark) |
|
Davis, Mark |
California Institute of Technology |
|
Dealy, John |
McGill University (Canada) |
|
Debenedetti, Pablo |
Princeton University |
|
Denn, Morton |
City College of New York |
|
dePablo, Juan |
University of Wisconsin |
|
deSmedt, Stefaan |
University of Ghent |
|
DiSalvo, Frank |
Cornell University |
|
Dixit, Ravi |
Engineering and Process Sciences |
|
Doherty, Michael |
UC Santa Barbara |
|
Dordick, Jonathan |
RPI |
|
Drzal, Lawrence |
Michigan State University |
|
Dudukovic, Michael |
Washington University |
|
Dumesic, James |
University of Wisconsin |
|
Eckert, Charles |
Georgia Tech |
|
Edgar, Thomas |
University of Texas-Austin |
|
Edwards, David |
Harvard University |
|
Eldridge, Bruce |
University of Texas-Austin |
|
Fan, L.S. |
Ohio State University |
|
Feinberg, Martin |
Ohio State University |
|
Floudas, Christodoulos |
Princeton University |
|
Flytzani-Stephanopoulos, Miretta |
Tufts University |
|
Forrest, Stephen |
University of Michigan |
|
Francis, Lorraine |
University of Minnesota |
|
Frank, Timothy |
Dow Chemical |
|
Fredrickson, Glenn |
UC Santa Barbara |
|
Friedlander, Sheldon K. |
UCLA |
|
Froment, Gilbert |
Texas A&M |
|
Fuller, Gerry |
Stanford University |
|
Gani, Rafique |
Technical University of Denmark |
|
Gasteiger, Hubert |
University Duesseldorf |
|
Genzer, Jan |
North Carolina State University |
|
Georgiou, George |
University of Texas-Austin |
|
Gandhi, Harendra |
Ford Motor Co |
|
Glaborg, Peter |
DTU (Denmark) |
|
Gladden, Lynn |
Cambridge University |
|
Goodenough, John |
University of Texas-Austin |
|
Gooding, Charles |
Clemson University |
|
EXPERT (VWC Organizer) |
AFFILIATION |
|
Gorte, Raymond |
University of Pennsylvania |
|
Gottesfeld, Shimshon |
MTI MicroFuel Cells Inc. |
|
Graham, Mike |
University of Wisconsin |
|
Green, Don |
University of Kansas |
|
Grossmann, Ignacio |
Carnegie Mellon University |
|
Gschwend, Philip M. |
MIT |
|
Gubbins, Keith |
North Carolina State University |
|
Hall, Carol |
North Carolina State University |
|
Haller, Gary |
Yale University |
|
Hammond, Paula |
MIT |
|
Hangleiter, Andreas |
Technische Universitat Braunschweig |
|
Harold, Michael |
University of Houston |
|
Hawker, Craig |
UC Santa Barbara |
|
Haynes, Brian |
University of Sydney (Australia) |
|
Haynes, Charles |
University of British Columbia (Canada) |
|
Hendershot, Dennis |
Chilworth Technology |
|
Heuer, Arthur |
Case Western Reserve University |
|
Hidy, George |
Envair/Aerochem |
|
Hill, Michael |
University of Massachusetts |
|
Hilt, J. Zach |
University of Kentucky |
|
Hines, Melissa |
Cornell University |
|
Hoo, Karlene |
Texas Tech University |
|
Howard, Jack B. |
MIT |
|
Hubbell, Jeffrey |
Ecole Polytech Fed Lausanne |
|
Iglesia, Enrique |
UC Berkeley |
|
Israelachvili, Jacob |
UC Santa Barbara |
|
Jachuck, Roshan |
Clarkson University |
|
Jain, Pradeep |
University of Florida |
|
Jimenez, Jose |
Luis University of Colorado |
|
Johansen, Kim |
Dam Technical University of Denmark |
|
Johnston, Keith |
University of Texas-Austin |
|
Jorne, Jacob |
University of Rochester |
|
Kauppinen, Esko I. |
Helsinki University of Technology (Finland) |
|
Keasling, Jay |
UC Berkeley |
|
Khakar, Devang |
Vipin Indian Institute of Technology |
|
Khan, Saad |
North Carolina State University |
|
Kletz, Trevor |
Loughborough University (UK) |
|
Klibanov, Alexander |
MIT |
|
Klimov, Victor |
LANL |
|
Kohlbrand, Henry |
Dow Chemical |
|
Konstantinov, Konstantin |
Bayer Corp |
|
Kopecek, Jindrich |
University of Utah |
|
Krishnamoorti, Ramanan |
University of Houston |
|
Ladisch, Mike |
Purdue University |
|
Lahti, Paul |
University of Massachusetts |
|
Lange, Frederick |
UC Santa Barbara |
|
Langer, Robert |
MIT |
|
EXPERT (VWC Organizer) |
AFFILIATION |
|
Larsen, John |
Penn State University |
|
Laurencin, Cato |
University of Virginia |
|
Leal, Gary |
UC Santa Barbara |
|
Lee, Kelvin |
Cornell University |
|
Lee, L. James |
Ohio State University |
|
Lee, Sang |
Yup KAIST |
|
Lee, Vincent |
FDA |
|
Lesko, Jack |
Virginia Polytechnic Institute |
|
Lewis, Jennifer A. |
University of Illinois at Urbana Champaign |
|
Liao, James |
UCLA |
|
Linninger, Andreas |
University of Illinois |
|
Lips, Alexander |
Unilever |
|
Liu, Jun |
PNNL |
|
Loy, Doug |
University of Arizona |
|
Luss, Dan |
University of Houston |
|
Macosko, Chris |
University of Minnesota |
|
Madix, Robert |
Stanford University |
|
Maggioli, Victor |
Feltronics Corp. |
|
Mallapragada, Surya |
Iowa State University |
|
Mallouk, Tom |
Penn State University |
|
Malone, Michael |
University of Massachusetts |
|
Maranas, Costas |
Penn State University |
|
Marinan, Mark |
Dow Chemical |
|
Mark, J.E. |
University of Cincinnati |
|
Marlin, Tom |
McMaster University |
|
Marquardt, Wolfgang |
RWTH-Aachen |
|
Marrucci, Guiseppe |
University of Naples (Italy) |
|
McAvoy, Tom |
University of Maryland |
|
McCarty, Perry L. |
Stanford University |
|
McCormick, Alon V. |
University of Minnesota |
|
McLeish, TCB |
University of Leeds (UK) |
|
Meyer, Anne |
SUNY Buffalo |
|
Michaels, James N. |
Merck and Co. |
|
Mikos, Antonios |
Rice University |
|
Mitragotri, Samir |
UC Santa Barbara |
|
Mooney, David |
Harvard University |
|
Morari, Manfred |
ETH Zurich (Switzerland) |
|
Mortensen, Andreas |
Swiss Federal Institute of Technology |
|
Mudan, Krishna |
MSA Risk Consulting |
|
Narasimhan, Balaji |
Iowa State University |
|
Nauman, Bruce |
RPI |
|
Ni, Xiong-Wei |
Heriot-Watt University (UK) |
|
Nielsen, Jens |
Technical University of Denmark |
|
Nienow, Alvin |
University of Birmingham |
|
Norris, David |
University of Minnesota |
|
Ober, Chris |
Cornell University |
|
Ogunnaike, Tunde |
University of Delaware |
|
EXPERT (VWC Organizer) |
AFFILIATION |
|
Okano, Teruo |
Tokyo Women's Medical College (Japan) |
|
Overton, Tim |
Dow Chemical |
|
Ozin, Geoffrey |
University of Toronto (Canada) |
|
Palsson, Bernhard |
UC San Diego |
|
Panagiotopoulos, Athanassios |
Princeton University |
|
Pandis, Spyros |
Carnegie Mellon University |
|
Papoutsakis, Terry |
Northwestern University |
|
Paul, Don |
University of Texas-Austin |
|
Pearson, Ray |
Lehigh University |
|
Pekny, Joe |
Purdue University |
|
Pendergast, John Jr. |
Dow Chemical |
|
Penlidis, Alexander |
University of Waterloo |
|
Peper, Jody |
University of Minnesota |
|
Peppas, Nicholas |
University of Texas-Austin |
|
Pereira, Carmo |
DuPont |
|
Petrie, Jim |
University of Sydney (Australia) |
|
Pistikopoulos, Stratos |
Imperial College (UK) |
|
Ponton, Jack |
University of Edinburgh (Scotland) |
|
Pratsinis, Sotiris |
E. ETH Zurich (Switzerland) |
|
Prausnitz, John |
LBNL/UC Berkeley |
|
Prud’homme, Robert |
Princeton University |
|
Rao, Govind |
University of Maryland-Baltimore |
|
Ray, W. Harmon |
University of Wisconsin |
|
Register, Richard |
Princeton University |
|
Reklaitis, Gintaras |
Purdue University |
|
Richon, Dominque |
CEP/TEP, ENSMP (France) |
|
Rochelle, Gary |
University of Texas-Austin |
|
Russel, William |
Princeton University |
|
Russell, Alan |
University of Pittsburgh |
|
Sandler, Stan |
University of Delaware |
|
Schaak, Raymond |
Texas A&M University |
|
Schaffer, David |
UC Berkeley |
|
Schowalter, William |
Princeton University |
|
Schuth, Ferdi |
MPI für Kohlenforschung (Germany) |
|
Scranton, Alec |
University of Iowa |
|
Seal, Sudipta |
University of Central Florida |
|
Seborg, Dale |
UC Santa Barbara |
|
Sefton, Michael |
University of Toronto (Canada) |
|
Sehanobish, Kalyan |
Dow Automotive |
|
Seinfeld, John |
California Institute of Technology |
|
Shafi, Asjad |
Dow Chemical |
|
Shah, Nilay |
Imperial College (UK) |
|
Shirtum, Page |
RPS Engineering |
|
Shuler, Mike |
Cornell University |
|
Siddall, Jon |
Dow Chemical |
|
Sidkar, Subhas |
NMRL, EPA |
|
Sierka, Raymond |
University of Arizona |
|
EXPERT (VWC Organizer) |
AFFILIATION |
|
Siirola, Jeff |
Eastman Chemical Co. |
|
Sinclair Curtis, Jennifer |
University of Florida |
|
Smith, Philip |
University of Utah |
|
Smith, Robin |
University of Manchester |
|
Spannangel, Mary Anne |
University of Illinois |
|
Stephanopoulos, Gregory |
MIT |
|
Stone, Howard |
Harvard University |
|
Stadther, Mark |
University of Notre Dame |
|
Stucky, Galen |
UC Santa Barbara |
|
Stupp, Sam |
Northwestern University |
|
Sundaresan, Sankaran |
Princeton University |
|
Teja, Amyn |
Georgia Tech |
|
Tester, Jefferson |
MIT |
|
Thibodeaux, Louis |
Louisiana State University |
|
Tirrell, David |
California Institute of Technology |
|
Tirrell, Matthew |
UC Santa Barbara |
|
Towler, Gavin |
UOP (USA) |
|
Vaia, Rich |
AFRL |
|
Varma, Arvind |
Purdue University |
|
Vayenas, Constantinos G. |
University of Patras |
|
Velev, Orlin |
North Carolina State University |
|
Virkar, Anil |
University of Utah |
|
Wall, Terry |
University of Newcastle |
|
Wandrey, Christian |
Institute of Biotechnology (Germany) |
|
Wang, Danny |
MIT |
|
Wang, Zhen-Gang |
California Institute of Technology |
|
Wassick, John |
Dow Chemical |
|
Webb, Colin |
University of Manchester |
|
Weber, W.J. Jr. |
University of Michigan |
|
Wei, James |
Princeton University |
|
Weinberg, W. Henry |
UC Santa Barbara |
|
Weitz, David |
Harvard University |
|
Wender, Irving |
University of Cape Town (South Africa) |
|
Wendt, Jost |
University of Utah |
|
West, David |
Dow Chemical |
|
West, Jennifer |
Rice University |
|
Westerberg, Arthur |
Carnegie Mellon University |
|
Westmoreland, Phillip |
University of Massachusetts |
|
White, Ralph E. |
University of Southern California |
|
Whitesides, George |
Harvard University |
|
Wilson, Grant |
University of Texas-Austin |
|
Winey, Karen |
University of Pennsylvania |
|
Wittrup, Dane |
MIT |
|
Xia, Younan |
Washington University |
|
Yager, Paul |
University of Washington |
|
Yang, Hong |
University of Rochester |
|
Yang, Ralph |
University of Michigan |
APPENDIX 3B
The List of Journals Examined for Publications and Citations
|
No. |
Journal |
2005 Impact Factor |
|
Journals with Broad Coverage of Sciences and Engineering |
||
|
1 |
Science |
30.927 |
|
2 |
Nature |
29.273 |
|
3 |
Proceedings of the National Academy of Science |
10.231 |
|
4 |
Physical Review Letters |
7.489 |
|
5 |
Journal of the American Chemical Society |
7.419 |
|
Journals with Broad Coverage of Chemical Engineering Research |
||
|
6 |
AIChE Journal |
2.036 |
|
7 |
Chemical Engineering Science |
1.735 |
|
8 |
Industrial and Engineering Chemistry Research |
1.504 |
|
9 |
Chemical Engineering Research and Design |
0.792 |
|
10 |
Canadian Journal of Chemical Engineering |
0.574 |
|
11 |
Chemie Ingenieur Technik |
0.392 |
|
Area-1: Engineering Science of Physical Processes |
||
|
12 |
Journal of Physical Chemistry B |
4.033 |
|
13 |
Journal of Chemical Physics |
3.138 |
|
14 |
Journal of Membrane Science |
2.654 |
|
15 |
Journal of Rheology |
2.423 |
|
16 |
Journal of Fluid Mechanics |
2.061 |
|
17 |
Journal of Colloid and Interface Science |
2.023 |
|
18 |
Separation and Purification Technology |
1.752 |
|
19 |
Separation and Purification Review |
1.571 |
|
20 |
Granular Matter |
1.517 |
|
21 |
Fluid Phase Equilibria |
1.478 |
|
22 |
Rheologica Acta |
1.432 |
|
23 |
Journal of Chemical Thermodynamics |
1.398 |
|
24 |
Molecular Simulation |
1.345 |
|
25 |
International Journal of Multiphase Flow |
1.306 |
|
26 |
Journal of Non-Newtonian Fluid Mechanics |
1.268 |
|
27 |
Powder Technology |
1.219 |
|
28 |
Separation Science and Technology |
0.834 |
|
Area-2: Engineering Science of Chemical Processes |
||
|
29 |
Angewandte Chemie (International Edition) |
9.596 |
|
30 |
Journal of Catalysis |
4.780 |
|
31 |
Macromolecules |
4.024 |
|
32 |
Applied Catalysis-B |
3.809 |
|
33 |
Journal of Polymer Science Part A: Polymer Chemistry |
3.027 |
|
34 |
Journal of Power Sources |
2.770 |
|
35 |
Applied Catalysis-A |
2.728 |
|
No. |
Journal |
2005 Impact Factor |
|
36 |
Electrochimica Acta |
2.453 |
|
37 |
Catalysis Today |
2.365 |
|
38 |
Journal of the Electrochemical Society |
2.190 |
|
39 |
Solid State Ionics |
1.571 |
|
40 |
Journal of Applied Electrochemistry |
1.282 |
|
41 |
International Journal of Chemical Kinetics |
1.188 |
|
42 |
Surface and Interface Analysis |
0.918 |
|
43 |
Journal of Polymer Engineering |
0.312 |
|
44 |
Studies in Surface Science and Catalysis |
0.307 |
|
Area-3: Engineering Science of Biological Processes |
||
|
45 |
Nature Biotechnology |
22.738 |
|
46 |
Bioinformatics |
6.019 |
|
47 |
Proteins: Structure, Function, and Bioinformatics |
4.684 |
|
48 |
Applied and Environmental Microbiology |
3.818 |
|
49 |
Protein Science |
3.618 |
|
50 |
Metabolic Engineering |
2.484 |
|
51 |
Biotechnology & Bioengineering |
2.483 |
|
52 |
Biotechnology Progress |
1.985 |
|
53 |
Process Biochemistry |
1.796 |
|
54 |
Enzyme and Microbial Technology |
1.705 |
|
55 |
Bioprocess and Biosystems Engineering |
0.807 |
|
Area-4: Molecular and Interfacial Science and Engineering |
||
|
56 |
Journal of Physical Chemistry B |
4.033 |
|
57 |
Langmuir |
3.705 |
|
58 |
Journal of Colloid and Interface Science |
2.023 |
|
59 |
Colloids and Surfaces B |
1.588 |
|
60 |
Colloids and Surfaces A |
1.499 |
|
Area-5: Materials |
||
|
61 |
Progress in Polymer Science |
16.045 |
|
62 |
Nature Materials |
15.941 |
|
63 |
Nano Letters |
9.847 |
|
64 |
Advanced Materials |
9.107 |
|
65 |
Advanced Functional Materials |
6.770 |
|
66 |
Chemistry of Materials |
4.818 |
|
67 |
Inorganic Chemistry |
3.851 |
|
68 |
Acta Materialia |
3.430 |
|
69 |
Polymer |
2.849 |
|
70 |
Composites Science and Technology |
2.184 |
|
71 |
Journal of Materials Research |
2.104 |
|
72 |
Journal of Polymer Science Part B: Polymer Physics |
1.739 |
|
73 |
Journal of the American Ceramic Society |
1.586 |
|
74 |
Journal of the European Ceramic Society |
1.567 |
|
75 |
Materials Research Bulletin |
1.380 |
|
No. |
Journal |
2005 Impact Factor |
|
76 |
Polymer Engineering and Science |
1.076 |
|
77 |
Composite Structures |
0.953 |
|
78 |
Journal of Materials Science |
0.901 |
|
79 |
Journal of Ceramic Society of Japan |
0.749 |
|
80 |
Polymer Composites |
0.628 |
|
81 |
Inorganic Materials. |
0.387 |
|
82 |
Journal of Polymer Engineering |
0.312 |
|
Area-6: Biomedical Products and Biomaterials |
||
|
83 |
Advanced Drug Delivery Reviews |
7.189 |
|
84 |
Biomaterials |
4.698 |
|
85 |
Journal of Controlled Release |
3.696 |
|
86 |
Biomacromolecules |
3.618 |
|
87 |
Journal of Orthopaedic Research |
2.916 |
|
88 |
Tissue Engineering |
2.887 |
|
89 |
Pharmaceutical Research |
2.752 |
|
90 |
Journal of Biomedical Materials Research |
2.743 |
|
91 |
European Journal of Pharmaceutical Sciences |
2.347 |
|
92 |
Annals of Biomedical Engineering |
1.997 |
|
93 |
Journal of Biomaterials Science, Polymer Edition |
1.409 |
|
94 |
Journal of Materials Science: Materials in Medicine |
1.248 |
|
Area-7: Energy |
||
|
95 |
Carbon |
3.419 |
|
96 |
Progress in Energy and Combustion Science |
3.371 |
|
97 |
Combustion and Flame |
2.258 |
|
98 |
Solar Energy Materials and Solar Cells |
2.002 |
|
99 |
Fuel |
1.674 |
|
100 |
Energy and Fuel |
1.494 |
|
101 |
Fuel Process Technology |
1.171 |
|
102 |
SPE Journal |
0.816 |
|
103 |
Combustion Science and Technology |
0.774 |
|
104 |
Proceedings Combustion Institute |
0 |
|
Area-8: Environmental Impact and Management |
||
|
105 |
Environmental Science and Technology |
4.054 |
|
106 |
Atmospheric Chemistry and Physics |
3.495 |
|
107 |
Water Research |
3.019 |
|
108 |
Journal of Geophysical Research |
2.784 |
|
109 |
Atmospheric Environment |
2.724 |
|
110 |
Tellus B |
2.592 |
|
111 |
Journal of Aerosol Science |
2.477 |
|
112 |
Environmental Toxicology and Chemistry |
2.414 |
|
113 |
Chemosphere |
2.297 |
|
114 |
Journal of Atmospheric Science |
2.078 |
|
115 |
Water Resources Research |
1.939 |
|
No. |
Journal |
2005 Impact Factor |
|
116 |
Aerosol Science and Technology |
1.935 |
|
117 |
Journal of Contaminant Hydrology |
1.733 |
|
118 |
Ground Water |
1.419 |
|
119 |
Journal of Nanoparticle Research |
1.699 |
|
120 |
Journal of the Air and Waste Management Association |
1.317 |
|
121 |
Ecological Economics |
1.179 |
|
Area-9: Process Systems Development and Engineering |
||
|
122 |
INFORMS Journal on Computing |
1.762 |
|
123 |
Automatica |
1.693 |
|
124 |
SIAM Journal on Scientific Computing |
1.509 |
|
125 |
Computers & Chemical Engineering |
1.501 |
|
126 |
Mathematical Programming |
1.497 |
|
127 |
Journal of Process Control |
1.433 |
|
128 |
SIAM Journal on Optimization |
1.238 |
|
129 |
Chemical Engineering and Processing |
1.159 |
|
130 |
Computational Optimization and Applications |
0.886 |
|
131 |
Chemical Engineering Research & Design |
0.792 |
|
132 |
Chemical Engineering and Technology |
0.678 |
|
133 |
Journal of Global Optimization |
0.662 |
|
134 |
Journal of Optimization Theory and Applications |
0.612 |
|
135 |
Annals of Operations Research |
0.525 |
|
136 |
Process Safety Progress |
0.320 |
|
137 |
Optimization and Engineering |
|


