
Appendix A
NIH SBIR Program Data
NOTES:
“Year one” awards: NIH maintains data by fiscal year, and in a number of cases changes award number between years. As a result, it is often hard to track a complete award from first year to last. Our approach has therefore been to focus on “award years,” identifying for example the first year of each award for analysis. This focus provides a complete data set for all NIH awards, and also allows analysis of awards in subsequent years of support.
Following discussions with the NRC staff, the NIH made an effort to recalculate the data for woman and minority owners’ participation in the SBIR program. In September, 2007, the NIH provided corrected data, which is shown in Appendix A and in several figures in this report. However, apparent anomalies in the NIH data on the participation of women and minorities in 2001-2002 could not be resolved by the time of publication of this report.
TABLE App-A-1 Applications: Phase I and Phase II, 1992-2005
|
Phase I |
Phase II |
||||||
|
Fiscal Year |
All Applications (#) |
Total Funded (#) |
Success Rate (%) |
Fiscal Year |
All Applications (#) |
Total Funded (#) |
Success Rate (%) |
|
1992 |
1,982 |
541 |
27.3 |
1992 |
551 |
278 |
50.5 |
|
1993 |
2,297 |
594 |
25.9 |
1993 |
637 |
360 |
56.5 |
|
1994 |
3,225 |
530 |
16.4 |
1994 |
744 |
351 |
47.2 |
|
1995 |
3,453 |
624 |
18.1 |
1995 |
780 |
370 |
47.4 |
|
1996 |
3,051 |
525 |
17.2 |
1996 |
798 |
390 |
48.9 |
|
1997 |
2,789 |
743 |
26.6 |
1997 |
800 |
468 |
58.5 |
|
1998 |
2,689 |
717 |
26.7 |
1998 |
827 |
541 |
65.4 |
|
1999 |
3,430 |
908 |
26.5 |
1999 |
897 |
539 |
60.1 |
|
2000 |
3,907 |
986 |
25.2 |
2000 |
1,023 |
587 |
57.4 |
|
2001 |
3,203 |
940 |
29.3 |
2001 |
1,074 |
683 |
63.6 |
|
2002 |
3,735 |
1,001 |
26.8 |
2002 |
1,248 |
797 |
63.9 |
|
2003 |
4,812 |
1,137 |
23.6 |
2003 |
1,299 |
788 |
60.7 |
|
2004 |
5,856 |
1,150 |
19.6 |
2004 |
1,410 |
792 |
56.2 |
|
2005 |
5,071 |
937 |
18.5 |
2005 |
1,451 |
774 |
53.3 |
|
SOURCE: National Institutes of Health. |
|||||||
TABLE App-A-2 Phase I Applications by IC, 1992-2004
|
IC |
Number of Applications |
||||||||||||
|
1992 |
1993 |
1994 |
1995 |
1996 |
1997 |
1998 |
1999 |
2000 |
2001 |
2002 |
2003 |
2004 |
|
|
AA |
25 |
52 |
38 |
37 |
50 |
53 |
30 |
40 |
39 |
24 |
29 |
65 |
62 |
|
AG |
84 |
94 |
149 |
159 |
146 |
122 |
105 |
103 |
134 |
130 |
95 |
134 |
162 |
|
AI |
154 |
201 |
350 |
413 |
349 |
333 |
290 |
365 |
461 |
356 |
592 |
676 |
844 |
|
AR |
111 |
101 |
165 |
126 |
167 |
126 |
127 |
132 |
173 |
152 |
142 |
169 |
201 |
|
AT |
|
|
|
|
|
|
|
5 |
36 |
58 |
55 |
41 |
35 |
|
CA |
334 |
349 |
607 |
559 |
507 |
514 |
465 |
663 |
817 |
695 |
701 |
889 |
1,173 |
|
DA |
59 |
45 |
74 |
92 |
78 |
56 |
57 |
80 |
74 |
75 |
70 |
90 |
112 |
|
DC |
44 |
47 |
68 |
69 |
51 |
41 |
45 |
65 |
60 |
45 |
38 |
60 |
65 |
|
DE |
71 |
80 |
67 |
64 |
63 |
49 |
61 |
70 |
89 |
84 |
57 |
57 |
83 |
|
DK |
107 |
121 |
164 |
201 |
180 |
150 |
179 |
261 |
267 |
211 |
255 |
335 |
376 |
|
EB |
|
|
|
|
|
|
|
|
|
|
71 |
247 |
331 |
|
ES |
46 |
48 |
47 |
83 |
62 |
51 |
45 |
44 |
67 |
79 |
115 |
114 |
133 |
|
EY |
93 |
85 |
130 |
135 |
119 |
78 |
75 |
105 |
84 |
52 |
66 |
104 |
124 |
|
GM |
157 |
226 |
204 |
215 |
219 |
203 |
207 |
254 |
248 |
234 |
234 |
313 |
387 |
|
HD |
121 |
198 |
224 |
236 |
184 |
168 |
178 |
212 |
206 |
128 |
171 |
245 |
305 |
|
HG |
24 |
18 |
36 |
35 |
33 |
29 |
42 |
57 |
42 |
27 |
53 |
68 |
67 |
|
HL |
221 |
228 |
336 |
382 |
356 |
347 |
334 |
430 |
478 |
375 |
386 |
472 |
528 |
|
LM |
10 |
27 |
24 |
27 |
40 |
57 |
36 |
53 |
40 |
32 |
38 |
53 |
59 |
|
MD |
|
|
|
|
|
|
|
|
|
|
|
1 |
8 |
|
MH |
93 |
90 |
135 |
191 |
152 |
124 |
120 |
124 |
122 |
110 |
120 |
148 |
172 |
|
NR |
39 |
65 |
66 |
61 |
37 |
16 |
22 |
23 |
19 |
17 |
22 |
16 |
37 |
|
NS |
85 |
95 |
129 |
123 |
113 |
105 |
129 |
148 |
187 |
132 |
162 |
221 |
225 |
|
RR |
102 |
123 |
209 |
240 |
141 |
166 |
128 |
179 |
222 |
170 |
190 |
198 |
242 |
|
Total |
1,980 |
2,293 |
3,222 |
3,448 |
3,047 |
2,788 |
2,675 |
3,413 |
3,865 |
3,186 |
3,662 |
4,716 |
5,731 |
|
IC |
Percentage of All Applications |
||||||||||||
|
1992 |
1993 |
1994 |
1995 |
1996 |
1997 |
1998 |
1999 |
2000 |
2001 |
2002 |
2003 |
2004 |
|
|
AA |
1.3 |
2.3 |
1.2 |
1.1 |
1.6 |
1.9 |
1.1 |
1.2 |
1.0 |
0.8 |
0.8 |
1.4 |
1.1 |
|
AG |
4.2 |
4.1 |
4.6 |
4.6 |
4.8 |
4.4 |
3.9 |
3.0 |
3.5 |
4.1 |
2.6 |
2.8 |
2.8 |
|
AI |
7.8 |
8.8 |
10.9 |
12.0 |
11.5 |
11.9 |
10.8 |
10.7 |
11.9 |
11.2 |
16.2 |
14.3 |
14.7 |
|
AR |
5.6 |
4.4 |
5.1 |
3.7 |
5.5 |
4.5 |
4.7 |
3.9 |
4.5 |
4.8 |
3.9 |
3.6 |
3.5 |
|
AT |
0.0 |
0.0 |
0.0 |
0.0 |
0.0 |
0.0 |
0.0 |
0.1 |
0.9 |
1.8 |
1.5 |
0.9 |
0.6 |
|
CA |
16.9 |
15.2 |
18.8 |
16.2 |
16.6 |
18.4 |
17.4 |
19.4 |
21.1 |
21.8 |
19.1 |
18.9 |
20.5 |
|
DA |
3.0 |
2.0 |
2.3 |
2.7 |
2.6 |
2.0 |
2.1 |
2.3 |
1.9 |
2.4 |
1.9 |
1.9 |
2.0 |
|
DC |
2.2 |
2.0 |
2.1 |
2.0 |
1.7 |
1.5 |
1.7 |
1.9 |
1.6 |
1.4 |
1.0 |
1.3 |
1.1 |
|
DE |
3.6 |
3.5 |
2.1 |
1.9 |
2.1 |
1.8 |
2.3 |
2.1 |
2.3 |
2.6 |
1.6 |
1.2 |
1.4 |
|
DK |
5.4 |
5.3 |
5.1 |
5.8 |
5.9 |
5.4 |
6.7 |
7.6 |
6.9 |
6.6 |
7.0 |
7.1 |
6.6 |
|
EB |
0.0 |
0.0 |
0.0 |
0.0 |
0.0 |
0.0 |
0.0 |
0.0 |
0.0 |
0.0 |
1.9 |
5.2 |
5.8 |
|
ES |
2.3 |
2.1 |
1.5 |
2.4 |
2.0 |
1.8 |
1.7 |
1.3 |
1.7 |
2.5 |
3.1 |
2.4 |
2.3 |
|
EY |
4.7 |
3.7 |
4.0 |
3.9 |
3.9 |
2.8 |
2.8 |
3.1 |
2.2 |
1.6 |
1.8 |
2.2 |
2.2 |
|
GM |
7.9 |
9.9 |
6.3 |
6.2 |
7.2 |
7.3 |
7.7 |
7.4 |
6.4 |
7.3 |
6.4 |
6.6 |
6.8 |
|
HD |
6.1 |
8.6 |
7.0 |
6.8 |
6.0 |
6.0 |
6.7 |
6.2 |
5.3 |
4.0 |
4.7 |
5.2 |
5.3 |
|
HG |
1.2 |
0.8 |
1.1 |
1.0 |
1.1 |
1.0 |
1.6 |
1.7 |
1.1 |
0.8 |
1.4 |
1.4 |
1.2 |
|
HL |
11.2 |
9.9 |
10.4 |
11.1 |
11.7 |
12.4 |
12.5 |
12.6 |
12.4 |
11.8 |
10.5 |
10.0 |
9.2 |
|
LM |
0.5 |
1.2 |
0.7 |
0.8 |
1.3 |
2.0 |
1.3 |
1.6 |
1.0 |
1.0 |
1.0 |
1.1 |
1.0 |
|
MD |
0.0 |
0.0 |
0.0 |
0.0 |
0.0 |
0.0 |
0.0 |
0.0 |
0.0 |
0.0 |
0.0 |
0.0 |
0.1 |
|
MH |
4.7 |
3.9 |
4.2 |
5.5 |
5.0 |
4.4 |
4.5 |
3.6 |
3.2 |
3.5 |
3.3 |
3.1 |
3.0 |
|
NR |
2.0 |
2.8 |
2.0 |
1.8 |
1.2 |
0.6 |
0.8 |
0.7 |
0.5 |
0.5 |
0.6 |
0.3 |
0.6 |
|
NS |
4.3 |
4.1 |
4.0 |
3.6 |
3.7 |
3.8 |
4.8 |
4.3 |
4.8 |
4.1 |
4.4 |
4.7 |
3.9 |
|
RR |
5.2 |
5.4 |
6.5 |
7.0 |
4.6 |
6.0 |
4.8 |
5.2 |
5.7 |
5.3 |
5.2 |
4.2 |
4.2 |
|
Total |
100.0 |
100.0 |
100.0 |
100.0 |
100.0 |
100.0 |
100.0 |
100.0 |
100.0 |
100.0 |
100.0 |
100.0 |
100.0 |
|
SOURCE: National Institutes of Health. |
|||||||||||||
TABLE App-A-3 Applications by IC—Phase II, 1992-2004
|
|
Number of Applications |
|
||||||||||||
|
1992 |
1993 |
1994 |
1995 |
1996 |
1997 |
1998 |
1999 |
2000 |
2001 |
2002 |
2003 |
2004 |
||
|
AA |
11 |
9 |
5 |
9 |
6 |
14 |
6 |
9 |
9 |
3 |
6 |
5 |
20 |
AA |
|
AG |
38 |
24 |
19 |
27 |
22 |
16 |
21 |
26 |
30 |
27 |
26 |
24 |
32 |
AG |
|
AI |
41 |
44 |
47 |
56 |
47 |
57 |
59 |
64 |
58 |
60 |
66 |
68 |
100 |
AI |
|
AR |
19 |
17 |
14 |
12 |
16 |
22 |
19 |
24 |
26 |
23 |
35 |
24 |
14 |
AR |
|
AT |
|
|
|
|
|
|
|
1 |
1 |
1 |
4 |
3 |
10 |
AT |
|
CA |
43 |
97 |
148 |
166 |
134 |
110 |
72 |
95 |
123 |
117 |
126 |
147 |
159 |
CA |
|
DA |
11 |
18 |
10 |
16 |
15 |
29 |
21 |
16 |
18 |
27 |
24 |
27 |
29 |
DA |
|
DC |
7 |
15 |
9 |
14 |
11 |
6 |
8 |
11 |
11 |
19 |
26 |
14 |
27 |
DC |
|
DE |
16 |
13 |
10 |
11 |
13 |
10 |
7 |
13 |
7 |
14 |
33 |
28 |
20 |
DE |
|
DK |
25 |
36 |
21 |
24 |
34 |
48 |
29 |
35 |
30 |
52 |
57 |
59 |
58 |
DK |
|
EB |
|
|
|
|
|
|
|
|
|
|
14 |
11 |
18 |
EB |
|
ES |
9 |
15 |
5 |
9 |
8 |
6 |
12 |
10 |
9 |
11 |
17 |
24 |
31 |
ES |
|
EY |
17 |
17 |
11 |
26 |
21 |
27 |
24 |
21 |
19 |
16 |
13 |
30 |
27 |
EY |
|
GM |
37 |
25 |
44 |
53 |
45 |
47 |
38 |
46 |
56 |
63 |
44 |
69 |
81 |
GM |
|
HD |
23 |
23 |
43 |
43 |
36 |
39 |
29 |
48 |
51 |
42 |
42 |
45 |
55 |
HD |
|
HG |
3 |
5 |
3 |
7 |
3 |
5 |
4 |
11 |
10 |
8 |
6 |
11 |
12 |
HG |
|
HL |
61 |
73 |
62 |
59 |
72 |
91 |
87 |
98 |
66 |
105 |
114 |
130 |
94 |
HL |
|
LM |
1 |
1 |
3 |
1 |
|
|
|
2 |
4 |
3 |
2 |
3 |
|
LM |
|
MD |
|
|
|
|
|
|
|
|
|
|
|
1 |
|
MD |
|
MH |
20 |
16 |
23 |
22 |
28 |
28 |
27 |
36 |
39 |
37 |
21 |
33 |
45 |
MH |
|
NR |
4 |
7 |
2 |
6 |
6 |
2 |
1 |
4 |
5 |
5 |
5 |
4 |
4 |
NR |
|
NS |
16 |
24 |
14 |
23 |
37 |
37 |
32 |
29 |
39 |
54 |
49 |
30 |
39 |
NS |
|
RR |
7 |
10 |
29 |
35 |
21 |
18 |
8 |
28 |
42 |
45 |
42 |
41 |
33 |
RR |
|
Total |
409 |
489 |
522 |
619 |
575 |
612 |
504 |
627 |
653 |
732 |
772 |
831 |
908 |
|
|
|
Percentage of Total Applications, by IC |
|||||||||||||
|
1992 |
1993 |
1994 |
1995 |
1996 |
1997 |
1998 |
1999 |
2000 |
2001 |
2002 |
2003 |
2004 |
92-03 |
|
|
AA |
2.7 |
1.8 |
1.0 |
1.5 |
1.0 |
2.3 |
1.2 |
1.4 |
1.4 |
0.4 |
0.8 |
0.6 |
2.2 |
1.3 |
|
AG |
9.3 |
4.9 |
3.6 |
4.4 |
3.8 |
2.6 |
4.2 |
4.1 |
4.6 |
3.7 |
3.4 |
2.9 |
3.5 |
4.1 |
|
AI |
10.0 |
9.0 |
9.0 |
9.0 |
8.2 |
9.3 |
11.7 |
10.2 |
8.9 |
8.2 |
8.5 |
8.2 |
11.0 |
9.1 |
|
AR |
4.6 |
3.5 |
2.7 |
1.9 |
2.8 |
3.6 |
3.8 |
3.8 |
4.0 |
3.1 |
4.5 |
2.9 |
1.5 |
3.4 |
|
AT |
0.0 |
0.0 |
0.0 |
0.0 |
0.0 |
0.0 |
0.0 |
0.2 |
0.2 |
0.1 |
0.5 |
0.4 |
1.1 |
0.1 |
|
CA |
10.5 |
19.8 |
28.4 |
26.8 |
23.3 |
18.0 |
14.3 |
15.2 |
18.8 |
16.0 |
16.3 |
17.7 |
17.5 |
18.8 |
|
DA |
2.7 |
3.7 |
1.9 |
2.6 |
2.6 |
4.7 |
4.2 |
2.6 |
2.8 |
3.7 |
3.1 |
3.2 |
3.2 |
3.2 |
|
DC |
1.7 |
3.1 |
1.7 |
2.3 |
1.9 |
1.0 |
1.6 |
1.8 |
1.7 |
2.6 |
3.4 |
1.7 |
3.0 |
2.1 |
|
DE |
3.9 |
2.7 |
1.9 |
1.8 |
2.3 |
1.6 |
1.4 |
2.1 |
1.1 |
1.9 |
4.3 |
3.4 |
2.2 |
2.4 |
|
DK |
6.1 |
7.4 |
4.0 |
3.9 |
5.9 |
7.8 |
5.8 |
5.6 |
4.6 |
7.1 |
7.4 |
7.1 |
6.4 |
6.1 |
|
EB |
0.0 |
0.0 |
0.0 |
0.0 |
0.0 |
0.0 |
0.0 |
0.0 |
0.0 |
0.0 |
1.8 |
1.3 |
2.0 |
0.3 |
|
ES |
2.2 |
3.1 |
1.0 |
1.5 |
1.4 |
1.0 |
2.4 |
1.6 |
1.4 |
1.5 |
2.2 |
2.9 |
3.4 |
1.8 |
|
EY |
4.2 |
3.5 |
2.1 |
4.2 |
3.7 |
4.4 |
4.8 |
3.3 |
2.9 |
2.2 |
1.7 |
3.6 |
3.0 |
3.3 |
|
GM |
9.0 |
5.1 |
8.4 |
8.6 |
7.8 |
7.7 |
7.5 |
7.3 |
8.6 |
8.6 |
5.7 |
8.3 |
8.9 |
7.7 |
|
HD |
5.6 |
4.7 |
8.2 |
6.9 |
6.3 |
6.4 |
5.8 |
7.7 |
7.8 |
5.7 |
5.4 |
5.4 |
6.1 |
6.3 |
|
HG |
0.7 |
1.0 |
0.6 |
1.1 |
0.5 |
0.8 |
0.8 |
1.8 |
1.5 |
1.1 |
0.8 |
1.3 |
1.3 |
1.0 |
|
HL |
14.9 |
14.9 |
11.9 |
9.5 |
12.5 |
14.9 |
17.3 |
15.6 |
10.1 |
14.3 |
14.8 |
15.6 |
10.4 |
13.9 |
|
LM |
0.2 |
0.2 |
0.6 |
0.2 |
0.0 |
0.0 |
0.0 |
0.3 |
0.6 |
0.4 |
0.3 |
0.4 |
0.0 |
0.3 |
|
MD |
0.0 |
0.0 |
0.0 |
0.0 |
0.0 |
0.0 |
0.0 |
0.0 |
0.0 |
0.0 |
0.0 |
0.1 |
0.0 |
0.0 |
|
MH |
4.9 |
3.3 |
4.4 |
3.6 |
4.9 |
4.6 |
5.4 |
5.7 |
6.0 |
5.1 |
2.7 |
4.0 |
5.0 |
4.5 |
|
NR |
1.0 |
1.4 |
0.4 |
1.0 |
1.0 |
0.3 |
0.2 |
0.6 |
0.8 |
0.7 |
0.6 |
0.5 |
0.4 |
0.7 |
|
NS |
3.9 |
4.9 |
2.7 |
3.7 |
6.4 |
6.0 |
6.3 |
4.6 |
6.0 |
7.4 |
6.3 |
3.6 |
4.3 |
5.2 |
|
RR |
1.7 |
2.0 |
5.6 |
5.7 |
3.7 |
2.9 |
1.6 |
4.5 |
6.4 |
6.1 |
5.4 |
4.9 |
3.6 |
4.4 |
|
Total |
100.0 |
100.0 |
100.0 |
100.0 |
100.0 |
100.0 |
100.0 |
100.0 |
100.0 |
100.0 |
100.0 |
100.0 |
100.0 |
100.0 |
|
SOURCE: National Institutes of Health. |
||||||||||||||
TABLE App-A-4 Woman- and Minority-owned Firms—Application Shares, 1992-2006 (percent of all applications)
|
Fiscal Year |
Woman-owned Firms |
Fiscal Year |
Minority-owned Firms |
||||
|
Phase I (%) |
Phase II (%) |
All (%) |
Phase I (%) |
Phase II (%) |
All (%) |
||
|
1992 |
12.2 |
13.0 |
12.3 |
1992 |
10.3 |
5.6 |
9.5 |
|
1993 |
8.0 |
9.0 |
8.2 |
1993 |
6.9 |
5.7 |
6.7 |
|
1994 |
9.3 |
7.3 |
9.0 |
1994 |
9.6 |
7.9 |
9.4 |
|
1995 |
12.6 |
7.1 |
11.8 |
1995 |
9.1 |
8.1 |
9.0 |
|
1996 |
11.8 |
9.9 |
11.5 |
1996 |
10.0 |
5.4 |
9.3 |
|
1997 |
10.2 |
9.8 |
10.1 |
1997 |
8.0 |
5.5 |
7.6 |
|
1998 |
8.3 |
8.4 |
8.3 |
1998 |
5.5 |
5.6 |
5.5 |
|
1999 |
10.8 |
12.8 |
11.1 |
1999 |
7.8 |
5.5 |
7.3 |
|
2000 |
9.8 |
13.9 |
10.5 |
2000 |
5.4 |
5.7 |
5.5 |
|
2001 |
4.5 |
4.7 |
4.6 |
2001 |
2.9 |
3.1 |
2.9 |
|
2002 |
2.6 |
3.0 |
2.7 |
2002 |
1.2 |
1.5 |
1.3 |
|
2003 |
11.1 |
10.8 |
11.0 |
2003 |
7.0 |
4.1 |
6.4 |
|
2004 |
11.4 |
11.7 |
11.5 |
2004 |
7.3 |
5.1 |
6.9 |
|
2005 |
10.6 |
11.9 |
10.9 |
2005 |
5.3 |
4.8 |
5.2 |
|
2006 |
12.9 |
12.8 |
12.9 |
2006 |
6.7 |
4.0 |
6.1 |
|
SOURCE: National Institutes of Health. |
|||||||
TABLE App-A-5 Woman- and Minority-owned Firms—Award Shares, 1992-2006 (percent of all awards)
|
Fiscal Year |
Woman-owned Firms Award Share (%) |
Fiscal Year |
Minority-owned Firms Award Share (%) |
||||
|
Phase I |
Phase II |
Total |
Phase I |
Phase II |
Total |
||
|
1992 |
10.0 |
7.2 |
9.4 |
1992 |
7.4 |
5.0 |
6.9 |
|
1993 |
5.8 |
7.0 |
6.1 |
1993 |
5.2 |
5.6 |
5.3 |
|
1994 |
6.8 |
7.5 |
7.0 |
1994 |
8.2 |
10.4 |
8.6 |
|
1995 |
8.4 |
8.0 |
8.3 |
1995 |
5.5 |
6.1 |
5.7 |
|
1996 |
6.9 |
9.3 |
7.5 |
1996 |
4.8 |
5.2 |
4.9 |
|
1997 |
8.1 |
9.2 |
8.4 |
1997 |
5.1 |
4.4 |
4.9 |
|
1998 |
7.1 |
9.8 |
7.8 |
1998 |
3.9 |
6.4 |
4.5 |
|
1999 |
9.0 |
12.7 |
10.1 |
1999 |
6.3 |
4.0 |
5.6 |
|
2000 |
7.9 |
14.3 |
9.4 |
2000 |
2.9 |
6.4 |
3.7 |
|
2001 |
4.3 |
3.9 |
4.1 |
2001 |
2.1 |
3.7 |
2.6 |
|
2002 |
1.5 |
0.8 |
1.3 |
2002 |
0.3 |
0.8 |
0.5 |
|
2003 |
9.6 |
10.8 |
9.9 |
2003 |
3.8 |
2.8 |
3.5 |
|
2004 |
10.4 |
10.6 |
10.4 |
2004 |
4.0 |
3.4 |
3.9 |
|
2005 |
8.0 |
10.0 |
8.6 |
2005 |
4.0 |
2.9 |
3.7 |
|
2006 |
12.5 |
13.9 |
13.0 |
2006 |
5.6 |
3.3 |
4.7 |
|
SOURCE: National Institutes of Health. |
|||||||
TABLE App-A-6 Woman- and Minority-owned Firms—Success Rates, 1992-2006 (percent)
|
Woman-owned Firms |
Other Small Businesses |
Minority-owned Firms |
|||||||||
|
Fiscal Year |
Success Rate (%) |
Fiscal Year |
Success Rate (%) |
Fiscal Year |
Success Rate (%) |
||||||
|
Phase I |
Phase II |
All |
Phase I |
Phase II |
All |
Phase I |
Phase II |
Total |
|||
|
1992 |
22.3 |
18.9 |
21.7 |
1992 |
27.3 |
34.0 |
28.4 |
1992 |
19.7 |
30.4 |
20.8 |
|
1993 |
18.6 |
34.1 |
21.6 |
1993 |
25.8 |
44.0 |
29.0 |
1993 |
19.6 |
42.9 |
23.1 |
|
1994 |
12.0 |
26.3 |
13.6 |
1994 |
16.4 |
25.7 |
17.7 |
1994 |
13.9 |
34.1 |
16.2 |
|
1995 |
12.0 |
38.6 |
14.4 |
1995 |
18.0 |
34.2 |
20.4 |
1995 |
10.8 |
26.0 |
12.9 |
|
1996 |
10.0 |
28.1 |
12.5 |
1996 |
17.2 |
29.9 |
19.2 |
1996 |
8.2 |
29.0 |
10.1 |
|
1997 |
21.0 |
42.2 |
24.9 |
1997 |
26.5 |
45.0 |
30.1 |
1997 |
16.7 |
36.1 |
19.5 |
|
1998 |
22.7 |
47.9 |
27.3 |
1998 |
26.5 |
40.9 |
29.1 |
1998 |
18.9 |
46.9 |
24.0 |
|
1999 |
21.3 |
41.8 |
25.8 |
1999 |
25.3 |
42.1 |
28.5 |
1999 |
20.5 |
31.0 |
22.0 |
|
2000 |
19.7 |
34.5 |
23.2 |
2000 |
24.4 |
33.6 |
26.0 |
2000 |
12.8 |
37.8 |
17.3 |
|
2001 |
26.1 |
36.6 |
28.5 |
2001 |
27.7 |
44.1 |
31.4 |
2001 |
20.5 |
51.9 |
27.8 |
|
2002 |
14.3 |
10.3 |
13.3 |
2002 |
25.4 |
39.9 |
28.6 |
2002 |
7.3 |
20.0 |
10.7 |
|
2003 |
19.2 |
34.7 |
22.3 |
2003 |
22.2 |
34.6 |
24.7 |
2003 |
12.0 |
23.9 |
13.6 |
|
2004 |
16.3 |
25.9 |
18.2 |
2004 |
18.0 |
28.4 |
19.9 |
2004 |
9.9 |
18.8 |
11.2 |
|
2005 |
12.3 |
24.3 |
14.9 |
2005 |
16.4 |
28.9 |
18.9 |
2005 |
12.4 |
17.9 |
13.4 |
|
2006 |
16.9 |
36.2 |
21.4 |
2006 |
17.5 |
33.4 |
21.2 |
2006 |
14.5 |
27.7 |
16.5 |
|
SOURCE: National Institutes of Health |
|||||||||||
TABLE App-A-7 Phase I by State—Compared with Scientists and Engineers Employed
|
|
Applications per 1,000 pop |
State |
AREA |
Engineers |
Scientists |
Total Scientists and Engineers |
All Employees |
Scientists/Engineers/1,000 Employees |
Applications |
|
|
MA |
90.2 |
2.4 |
AK |
1 |
6,290 |
6,690 |
12,980 |
1,830,360 |
7.1 |
18 |
|
DC |
57.2 |
12.8 |
AL |
2 |
36,220 |
10,330 |
46,550 |
293,130 |
158.8 |
343 |
|
MD |
54.5 |
12.0 |
AR |
4 |
11,560 |
6,740 |
18,300 |
2,313,520 |
7.9 |
80 |
|
UT |
33.1 |
11.9 |
AZ |
5 |
56,460 |
14,790 |
71,250 |
1,125,830 |
63.3 |
528 |
|
NH |
31.8 |
6.2 |
CA |
6 |
319,420 |
147,100 |
466,520 |
14,534,620 |
32.1 |
8,929 |
|
VT |
27.3 |
8.5 |
CO |
8 |
53,000 |
25,260 |
78,260 |
2,110,640 |
37.1 |
1,053 |
|
CA |
26.4 |
9.5 |
CT |
9 |
37,290 |
16,970 |
54,260 |
1,633,350 |
33.2 |
708 |
|
DE |
25.5 |
49.3 |
DC |
10 |
13,350 |
20,520 |
33,870 |
408,270 |
83.0 |
327 |
|
CO |
24.5 |
10.6 |
DE |
11 |
6,090 |
6,380 |
12,470 |
603,130 |
20.7 |
200 |
|
VA |
23.4 |
8.0 |
FL |
12 |
113,390 |
46,750 |
160,140 |
7,330,880 |
21.8 |
1,034 |
|
WA |
23.0 |
7.8 |
GA |
13 |
55,680 |
23,280 |
78,960 |
3,806,550 |
20.7 |
472 |
|
OR |
21.1 |
6.8 |
HI |
15 |
7,920 |
4,710 |
12,630 |
564,850 |
22.4 |
170 |
|
IL |
21.1 |
9.7 |
IA |
16 |
15,880 |
9,780 |
25,660 |
574,270 |
44.7 |
161 |
|
CT |
20.8 |
10.4 |
ID |
17 |
13,670 |
9,100 |
22,770 |
5,719,070 |
4.0 |
77 |
|
AZ |
19.8 |
2.6 |
IL |
18 |
89,150 |
42,290 |
131,440 |
2,866,350 |
45.9 |
1,280 |
|
RI |
19.3 |
15.0 |
IN |
19 |
49,320 |
17,800 |
67,120 |
1,423,170 |
47.2 |
382 |
|
NM |
17.3 |
11.2 |
KS |
20 |
26,960 |
9,170 |
36,130 |
1,297,710 |
27.8 |
170 |
|
MN |
16.8 |
8.2 |
KY |
21 |
23,300 |
9,300 |
32,600 |
1,728,300 |
18.9 |
210 |
|
NJ |
15.8 |
9.7 |
LA |
22 |
28,580 |
13,050 |
41,630 |
1,861,000 |
22.4 |
201 |
|
WY |
14.6 |
6.9 |
MA |
23 |
73,160 |
40,340 |
113,500 |
595,120 |
190.7 |
5,728 |
|
MT |
14.2 |
6.3 |
MD |
24 |
52,070 |
34,340 |
86,410 |
2,458,140 |
35.2 |
2,886 |
|
HI |
14.0 |
6.3 |
ME |
25 |
9,800 |
4,250 |
14,050 |
3,125,930 |
4.5 |
154 |
|
IN |
13.1 |
12.1 |
MI |
26 |
134,090 |
30,900 |
164,990 |
4,294,310 |
38.4 |
939 |
|
PA |
12.8 |
9.8 |
MN |
27 |
55,180 |
26,780 |
81,960 |
2,602,230 |
31.5 |
826 |
|
IA |
12.4 |
3.9 |
MO |
28 |
35,600 |
18,550 |
54,150 |
1,095,450 |
49.4 |
331 |
|
NC |
12.2 |
8.8 |
MS |
29 |
15,120 |
6,740 |
21,860 |
2,630,780 |
8.3 |
55 |
|
ME |
12.1 |
23.0 |
MT |
30 |
5,620 |
7,530 |
13,150 |
402,930 |
32.6 |
128 |
|
SD |
11.9 |
4.8 |
NC |
31 |
51,390 |
38,010 |
89,400 |
883,450 |
101.2 |
984 |
|
NY |
11.9 |
7.2 |
ND |
32 |
4,210 |
2,510 |
6,720 |
1,116,860 |
6.0 |
46 |
|
MO |
11.6 |
4.8 |
NE |
33 |
11,300 |
8,290 |
19,590 |
613,090 |
32.0 |
93 |
|
OH |
11.3 |
8.7 |
NH |
34 |
12,820 |
4,190 |
17,010 |
3,881,440 |
4.4 |
393 |
|
WI |
10.9 |
4.5 |
NJ |
35 |
57,810 |
39,250 |
97,060 |
755,620 |
128.5 |
1,328 |
|
MI |
9.4 |
9.7 |
NM |
36 |
22,060 |
12,880 |
34,940 |
8,248,470 |
4.2 |
314 |
|
TX |
9.0 |
7.0 |
NV |
37 |
14,910 |
6,980 |
21,890 |
3,722,700 |
5.9 |
110 |
|
AL |
7.7 |
3.0 |
NY |
38 |
105,190 |
74,280 |
179,470 |
318,520 |
563.4 |
2,253 |
|
ND |
7.2 |
3.1 |
OH |
39 |
96,320 |
33,550 |
129,870 |
5,308,970 |
24.5 |
1,286 |
|
TN |
6.9 |
6.0 |
OK |
40 |
21,360 |
11,490 |
32,850 |
1,421,270 |
23.1 |
128 |
|
FL |
6.5 |
4.8 |
OR |
41 |
31,790 |
17,890 |
49,680 |
1,556,470 |
31.9 |
721 |
|
KS |
6.3 |
10.2 |
PA |
42 |
88,560 |
47,440 |
136,000 |
5,507,880 |
24.7 |
1,570 |
|
GA |
5.8 |
7.8 |
RI |
44 |
8,150 |
4,310 |
12,460 |
480,420 |
25.9 |
202 |
|
NV |
5.5 |
8.7 |
SC |
45 |
36,360 |
10,830 |
47,190 |
1,772,760 |
26.6 |
144 |
|
NE |
5.4 |
6.6 |
SD |
46 |
3,960 |
3,370 |
7,330 |
368,100 |
19.9 |
90 |
|
KY |
5.2 |
4.6 |
TN |
47 |
35,600 |
13,660 |
49,260 |
2,634,450 |
18.7 |
390 |
|
LA |
4.5 |
6.6 |
TX |
48 |
198,990 |
69,090 |
268,080 |
9,299,360 |
28.8 |
1,871 |
|
OK |
3.7 |
5.7 |
UT |
49 |
19,700 |
12,150 |
31,850 |
1,059,720 |
30.1 |
739 |
|
SC |
3.6 |
6.0 |
VA |
50 |
75,070 |
33,620 |
108,690 |
293,650 |
370.1 |
1,657 |
|
AK |
2.9 |
6.9 |
VT |
51 |
5,780 |
3,080 |
8,860 |
3,451,890 |
2.6 |
166 |
|
WV |
1.9 |
9.7 |
WA |
53 |
66,240 |
40,040 |
106,280 |
2,583,080 |
41.1 |
1,355 |
|
AR |
1.6 |
8.1 |
WI |
54 |
47,940 |
25,000 |
72,940 |
685,110 |
106.5 |
584 |
|
MS |
1.0 |
7.3 |
WV |
55 |
9,470 |
5,970 |
15,440 |
2,689,160 |
5.7 |
34 |
|
ID |
0.6 |
9.7 |
WY |
56 |
3,640 |
4,100 |
7,740 |
245,050 |
31.6 |
72 |
|
SOURCE: National Institutes of Health. |
||||||||||
TABLE App-A-8 Phase I—New Applicants and New Winners, 2000-2005
|
Number of “New” organizations by Fiscal Year, Based on Funded Competing R43, U43 SBIR Phase 1 Grants Baseline 1986 (program started in 1983, but recovering data from the mainframe files is difficult) Calculated by using the year of first SBIR award post baseline Source: impacii irdb pubfiles (1986 thru 2005) |
||||||||
|
Fiscal Year |
Number of “New” Winners |
Number of “New” Applicants |
All Applicants (#) |
All Winners (#) |
“New” Winners (%) |
“New” Applicants (%) |
Success Rate of New Applicants (%) |
Success Rate of Previous Winners (%) |
|
2000 |
306 |
1,263 |
2,006 |
649 |
47.1 |
63.0 |
24.2 |
46.2 |
|
2001 |
240 |
963 |
1,660 |
603 |
39.8 |
58.0 |
24.9 |
52.1 |
|
2002 |
274 |
1,198 |
1,937 |
650 |
42.2 |
61.8 |
22.9 |
50.9 |
|
2003 |
305 |
1,499 |
2,353 |
712 |
42.8 |
63.7 |
20.3 |
47.7 |
|
2004 |
294 |
1,703 |
2,680 |
705 |
41.7 |
63.5 |
17.3 |
42.1 |
|
2005 |
211 |
1,493 |
2,449 |
589 |
35.8 |
61.0 |
14.1 |
39.5 |
|
NOTE New is based on organizations with no previous SBIR support; however, these organizations may have submitted more than one application in previous years. SOURCE: National Institutes of Health. |
||||||||
TABLE App-A-9 Phase I Awards—By State, 1992-2005
|
State |
Number of Phase I State Awards by Fiscal Year |
Grand Total |
Percent of Total |
|||||||||||||
|
1992 |
1993 |
1994 |
1995 |
1996 |
1997 |
1998 |
1999 |
2000 |
2001 |
2002 |
2003 |
2004 |
2005 |
|||
|
AK |
|
|
|
|
|
|
|
|
|
|
|
2 |
|
1 |
3 |
0.0 |
|
AL |
5 |
11 |
6 |
4 |
7 |
5 |
6 |
10 |
8 |
11 |
9 |
8 |
6 |
4 |
100 |
0.8 |
|
AR |
2 |
|
|
|
|
1 |
|
3 |
1 |
2 |
1 |
3 |
4 |
5 |
22 |
0.2 |
|
AZ |
14 |
11 |
2 |
10 |
8 |
7 |
10 |
11 |
11 |
15 |
26 |
14 |
12 |
8 |
159 |
1.2 |
|
CA |
110 |
114 |
133 |
144 |
117 |
153 |
136 |
201 |
226 |
240 |
238 |
275 |
232 |
178 |
2,497 |
19.5 |
|
CO |
8 |
14 |
8 |
12 |
17 |
22 |
20 |
19 |
36 |
22 |
31 |
36 |
34 |
27 |
306 |
2.4 |
|
CT |
17 |
11 |
13 |
13 |
9 |
19 |
12 |
15 |
13 |
13 |
21 |
26 |
19 |
11 |
212 |
1.7 |
|
DC |
4 |
6 |
6 |
6 |
2 |
3 |
6 |
7 |
11 |
11 |
16 |
10 |
5 |
4 |
97 |
0.8 |
|
DE |
|
2 |
2 |
2 |
2 |
5 |
1 |
6 |
8 |
7 |
4 |
7 |
6 |
4 |
56 |
0.4 |
|
FL |
10 |
11 |
9 |
14 |
11 |
18 |
8 |
11 |
30 |
18 |
23 |
32 |
20 |
16 |
231 |
1.8 |
|
GA |
5 |
3 |
3 |
6 |
8 |
5 |
4 |
4 |
16 |
12 |
12 |
14 |
19 |
6 |
117 |
0.9 |
|
HI |
8 |
5 |
4 |
3 |
3 |
3 |
3 |
2 |
3 |
6 |
3 |
1 |
1 |
1 |
46 |
0.4 |
|
IA |
|
1 |
|
|
1 |
1 |
1 |
3 |
3 |
4 |
5 |
9 |
4 |
2 |
34 |
0.3 |
|
ID |
1 |
1 |
|
|
|
|
1 |
|
2 |
4 |
1 |
1 |
1 |
1 |
13 |
0.1 |
|
IL |
13 |
21 |
15 |
22 |
11 |
25 |
22 |
19 |
36 |
35 |
28 |
31 |
22 |
29 |
329 |
2.6 |
|
IN |
5 |
5 |
5 |
6 |
5 |
5 |
3 |
7 |
7 |
9 |
7 |
14 |
11 |
12 |
101 |
0.8 |
|
KS |
1 |
2 |
|
1 |
1 |
|
|
4 |
2 |
4 |
5 |
6 |
4 |
1 |
31 |
0.2 |
|
KY |
2 |
3 |
2 |
1 |
2 |
4 |
1 |
3 |
9 |
13 |
10 |
2 |
4 |
4 |
60 |
0.5 |
|
LA |
3 |
2 |
3 |
1 |
|
2 |
|
|
5 |
2 |
3 |
3 |
2 |
1 |
27 |
0.2 |
|
MA |
91 |
114 |
105 |
100 |
105 |
111 |
120 |
175 |
212 |
193 |
189 |
170 |
152 |
106 |
1,943 |
15.2 |
|
MD |
68 |
58 |
52 |
54 |
24 |
60 |
38 |
67 |
63 |
84 |
77 |
114 |
85 |
58 |
902 |
7.1 |
|
ME |
2 |
2 |
1 |
6 |
2 |
|
1 |
3 |
3 |
2 |
5 |
3 |
2 |
2 |
34 |
0.3 |
|
MI |
15 |
18 |
13 |
17 |
10 |
9 |
22 |
20 |
19 |
35 |
24 |
31 |
27 |
24 |
284 |
2.2 |
|
MN |
11 |
13 |
10 |
21 |
11 |
12 |
16 |
7 |
17 |
21 |
24 |
28 |
18 |
19 |
228 |
1.8 |
|
MO |
6 |
8 |
2 |
1 |
3 |
3 |
4 |
5 |
6 |
8 |
12 |
12 |
10 |
8 |
88 |
0.7 |
|
MS |
|
|
1 |
1 |
1 |
1 |
|
2 |
1 |
1 |
2 |
2 |
1 |
|
13 |
0.1 |
|
MT |
|
|
2 |
|
1 |
|
3 |
2 |
3 |
4 |
3 |
1 |
4 |
2 |
25 |
0.2 |
|
State |
Number of Phase I Awards by Fiscal Year |
Grand Total |
Percent of Total |
|||||||||||||
|
1992 |
1993 |
1994 |
1995 |
1996 |
1997 |
1998 |
1999 |
2000 |
2001 |
2002 |
2003 |
2004 |
2005 |
|||
|
NC |
22 |
10 |
15 |
10 |
14 |
21 |
23 |
21 |
32 |
37 |
39 |
35 |
39 |
28 |
346 |
2.7 |
|
ND |
1 |
|
|
|
|
|
|
|
|
1 |
2 |
1 |
3 |
|
8 |
0.1 |
|
NE |
1 |
3 |
1 |
1 |
|
4 |
2 |
1 |
3 |
3 |
4 |
3 |
3 |
5 |
34 |
0.3 |
|
NH |
4 |
7 |
6 |
3 |
8 |
13 |
4 |
6 |
12 |
18 |
18 |
20 |
7 |
3 |
129 |
1.0 |
|
NJ |
12 |
20 |
14 |
15 |
21 |
18 |
17 |
27 |
34 |
34 |
42 |
33 |
29 |
23 |
339 |
2.7 |
|
NM |
7 |
2 |
1 |
3 |
1 |
4 |
2 |
8 |
8 |
10 |
8 |
12 |
11 |
4 |
81 |
0.6 |
|
NV |
|
|
|
|
|
3 |
1 |
|
1 |
2 |
3 |
5 |
|
3 |
18 |
0.1 |
|
NY |
47 |
38 |
32 |
31 |
25 |
28 |
42 |
43 |
62 |
54 |
71 |
53 |
52 |
45 |
623 |
4.9 |
|
OH |
17 |
19 |
12 |
19 |
12 |
26 |
34 |
26 |
39 |
47 |
47 |
50 |
37 |
35 |
420 |
3.3 |
|
OK |
4 |
3 |
|
2 |
2 |
|
3 |
2 |
2 |
3 |
7 |
5 |
4 |
5 |
42 |
0.3 |
|
OR |
9 |
11 |
13 |
19 |
16 |
16 |
14 |
18 |
32 |
27 |
34 |
29 |
19 |
12 |
269 |
2.1 |
|
PA |
22 |
19 |
14 |
24 |
21 |
27 |
28 |
24 |
46 |
57 |
56 |
49 |
47 |
41 |
475 |
3.7 |
|
PR |
|
|
|
|
|
|
1 |
1 |
1 |
|
|
|
|
|
3 |
0.0 |
|
RI |
|
|
1 |
1 |
|
|
1 |
3 |
8 |
9 |
10 |
7 |
10 |
8 |
58 |
0.5 |
|
SC |
|
|
|
|
1 |
1 |
3 |
2 |
3 |
6 |
12 |
8 |
3 |
2 |
41 |
0.3 |
|
SD |
|
|
|
1 |
1 |
1 |
1 |
2 |
|
2 |
3 |
1 |
1 |
|
13 |
0.1 |
|
TN |
3 |
3 |
4 |
3 |
2 |
8 |
3 |
2 |
6 |
9 |
8 |
9 |
4 |
4 |
68 |
0.5 |
|
TX |
29 |
25 |
23 |
24 |
22 |
35 |
24 |
39 |
64 |
43 |
46 |
65 |
55 |
37 |
531 |
4.2 |
|
UT |
14 |
11 |
10 |
10 |
7 |
14 |
16 |
14 |
23 |
25 |
23 |
11 |
17 |
8 |
203 |
1.6 |
|
VA |
20 |
23 |
21 |
21 |
14 |
29 |
23 |
22 |
36 |
50 |
37 |
57 |
30 |
20 |
403 |
3.2 |
|
VT |
3 |
6 |
3 |
3 |
1 |
1 |
|
2 |
3 |
2 |
2 |
8 |
4 |
2 |
40 |
0.3 |
|
WA |
16 |
18 |
17 |
22 |
24 |
30 |
28 |
44 |
48 |
47 |
59 |
48 |
37 |
28 |
466 |
3.6 |
|
WI |
4 |
5 |
12 |
9 |
7 |
10 |
15 |
15 |
16 |
29 |
25 |
27 |
18 |
15 |
207 |
1.6 |
|
WV |
|
|
|
|
|
|
|
|
1 |
1 |
|
|
|
|
2 |
0.0 |
|
WY |
|
|
|
|
|
1 |
2 |
3 |
2 |
1 |
4 |
2 |
|
|
15 |
0.1 |
|
Grand Total |
636 |
659 |
596 |
666 |
560 |
764 |
725 |
931 |
1,233 |
1,293 |
1,339 |
1,393 |
1,135 |
862 |
12,792 |
100.0 |
|
SOURCE: U.S. Small Business Administration, Tech-Net Database. |
||||||||||||||||
TABLE App-A-10 Resubmission Rates—Phases I and II, 1992-2004
|
Phase I |
|||||||||
|
Fiscal Year |
All Applications (#) |
Resubmissions (#) |
Resubmission as Percent of Applications |
Total Funded (#) |
1st-time Winners (#) |
Funded on Resubmission (#) |
Not Funded (#) |
1st-time Success Rate (%) |
Resubmission Success Rate (%) |
|
1992 |
1,980 |
334 |
23.2 |
540 |
442 |
98 |
1,440 |
26.9 |
29.3 |
|
1993 |
2,293 |
312 |
18.4 |
593 |
514 |
79 |
1,700 |
25.9 |
25.3 |
|
1994 |
3,222 |
427 |
15.9 |
530 |
473 |
57 |
2,692 |
16.9 |
13.3 |
|
1995 |
3,448 |
655 |
23.2 |
621 |
467 |
154 |
2,827 |
16.7 |
23.5 |
|
1996 |
3,047 |
657 |
26.0 |
523 |
395 |
128 |
2,524 |
16.5 |
19.5 |
|
1997 |
2,788 |
607 |
29.7 |
742 |
526 |
216 |
2,046 |
24.1 |
35.6 |
|
1998 |
2,675 |
514 |
26.2 |
716 |
581 |
135 |
1,959 |
26.9 |
26.3 |
|
1999 |
3,413 |
612 |
24.4 |
906 |
761 |
145 |
2,507 |
27.2 |
23.7 |
|
2000 |
3,865 |
786 |
27.1 |
969 |
746 |
223 |
2,896 |
24.2 |
28.4 |
|
2001 |
3,186 |
760 |
33.4 |
911 |
658 |
253 |
2,275 |
27.1 |
33.3 |
|
2002 |
3,662 |
636 |
23.4 |
945 |
773 |
172 |
2,717 |
25.5 |
27.0 |
|
2003 |
4,716 |
864 |
21.6 |
710 |
472 |
238 |
4,006 |
12.3 |
27.5 |
|
2004 |
5,731 |
1,167 |
24.8 |
1,028 |
767 |
261 |
4,703 |
16.8 |
22.4 |
|
Phase II |
|||||||||
|
Fiscal Year |
All Applications (#) |
Resubmissions (#) |
Resubmission as Percent of Applications |
Total Funded (#) |
1st-time Winners(#) |
Funded on Resubmission (#) |
Not Funded (#) |
1st-time Success Rate (%) |
Resubmission Success Rate (%) |
|
1992 |
409 |
103 |
25.2 |
137 |
107 |
30 |
272 |
35.0 |
29.1 |
|
1993 |
489 |
147 |
30.1 |
215 |
160 |
55 |
274 |
46.8 |
37.4 |
|
1994 |
522 |
138 |
26.4 |
131 |
110 |
21 |
391 |
28.6 |
15.2 |
|
1995 |
619 |
202 |
32.6 |
210 |
162 |
48 |
409 |
38.8 |
23.8 |
|
1996 |
575 |
204 |
35.5 |
173 |
124 |
49 |
402 |
33.4 |
24.0 |
|
1997 |
612 |
211 |
34.5 |
280 |
191 |
89 |
332 |
47.6 |
42.2 |
|
1998 |
504 |
141 |
28.0 |
237 |
193 |
44 |
267 |
53.2 |
31.2 |
|
1999 |
627 |
149 |
23.8 |
289 |
231 |
58 |
338 |
48.3 |
38.9 |
|
2000 |
653 |
197 |
30.2 |
267 |
206 |
61 |
386 |
45.2 |
31.0 |
|
2001 |
732 |
242 |
33.1 |
381 |
284 |
97 |
351 |
58.0 |
40.1 |
|
2002 |
772 |
242 |
31.3 |
358 |
269 |
89 |
414 |
50.8 |
36.8 |
|
2003 |
830 |
249 |
30.0 |
349 |
264 |
85 |
481 |
45.4 |
34.1 |
|
2004 |
908 |
287 |
31.6 |
302 |
223 |
79 |
606 |
35.9 |
27.5 |
|
SOURCE: National Institutes of Health. |
|||||||||
TABLE App-A-11 Phase I, Year One Awards at NIH, 1992-2005
|
Fiscal Year |
Number of Awards |
Total Amount ($) |
Average Amount ($) |
|
1992 |
541 |
26,616,441 |
49,199 |
|
1993 |
594 |
29,560,122 |
49,765 |
|
1994 |
530 |
39,249,711 |
74,056 |
|
1995 |
624 |
59,005,464 |
94,560 |
|
1996 |
525 |
50,936,972 |
97,023 |
|
1997 |
743 |
72,528,667 |
97,616 |
|
1998 |
717 |
70,077,801 |
97,738 |
|
1999 |
908 |
96,125,835 |
105,865 |
|
2000 |
986 |
117,779,337 |
119,452 |
|
2001 |
940 |
120,072,266 |
127,736 |
|
2002 |
1,001 |
137,504,731 |
137,367 |
|
2003 |
1,137 |
168,520,060 |
148,215 |
|
2004 |
1,150 |
187,091,805 |
162,689 |
|
2005 |
937 |
160,982,684 |
171,806 |
|
SOURCE: National Institutes of Health, NRC calculation. |
|||
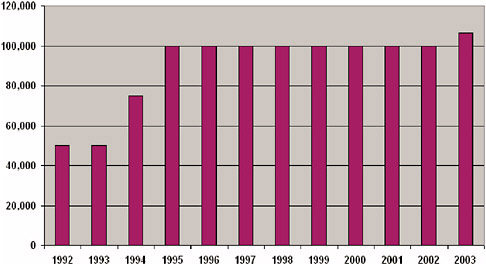
FIGURE App-A-1 Phase I median award size, 1992-2003.
SOURCE: National Institutes of Health, NRC calculation.
TABLE App-A-12 Oversized SBIR Phase I Awards, 1992-2005
|
Fiscal Year |
$0-$100K (%) |
$>100K-$120K (%) |
$>120K-$150K (%) |
$>150K-$175K (%) |
$>175K-$200K (%) |
>$200K (%) |
|
1992 |
100.0 |
0.0 |
0.0 |
0.0 |
0.0 |
0.0 |
|
1993 |
100.0 |
0.0 |
0.0 |
0.0 |
0.0 |
0.0 |
|
1994 |
100.0 |
0.0 |
0.0 |
0.0 |
0.0 |
0.0 |
|
1995 |
99.7 |
0.3 |
0.0 |
0.0 |
0.0 |
0.0 |
|
1996 |
99.4 |
0.6 |
0.0 |
0.0 |
0.0 |
0.0 |
|
1997 |
99.7 |
0.1 |
0.1 |
0.0 |
0.0 |
0.0 |
|
1998 |
95.4 |
3.5 |
1.2 |
0.0 |
0.0 |
0.0 |
|
1999 |
70.8 |
16.6 |
7.0 |
2.5 |
0.1 |
2.9 |
|
2000 |
62.1 |
16.4 |
11.1 |
2.0 |
2.2 |
6.3 |
|
2001 |
53.8 |
13.9 |
13.5 |
5.1 |
5.1 |
8.6 |
|
2002 |
51.8 |
13.5 |
12.2 |
5.8 |
6.6 |
10.1 |
|
2003 |
48.0 |
13.9 |
12.7 |
4.1 |
4.6 |
16.7 |
|
2004 |
43.4 |
10.9 |
14.2 |
6.0 |
6.4 |
19.1 |
|
2005 |
40.5 |
10.5 |
15.6 |
7.6 |
7.8 |
18.0 |
|
SOURCE: National Institutes of Health. |
||||||
TABLE App-A-13 Phase I Awards by States—Per 1,000 Life and Physical Scientists
|
|
Life & Physical Scientists, 2003 |
NIH Phase I Awards, 2003 |
NIH Phase I Awards per 1,000 Life & Physical Scientists, 2003 |
|
New Hampshire |
1,480 |
14.0 |
9.5 |
|
Vermont |
850 |
6.0 |
7.1 |
|
Massachusetts |
20,380 |
140.0 |
6.9 |
|
Maryland |
17,910 |
90.0 |
5.0 |
|
Oregon |
5,870 |
23.0 |
3.9 |
|
Connecticut |
5,670 |
22.0 |
3.9 |
|
California |
64,390 |
248.0 |
3.9 |
|
Virginia |
13,030 |
40.0 |
3.1 |
|
Ohio |
15,100 |
45.0 |
3.0 |
|
Iowa |
3,130 |
9.0 |
2.9 |
|
Colorado |
11,710 |
33.0 |
2.8 |
|
Indiana |
4,070 |
11.0 |
2.7 |
|
Rhode Island |
1,580 |
4.0 |
2.5 |
|
Michigan |
9,390 |
23.0 |
2.4 |
|
Arizona |
5,580 |
13.0 |
2.3 |
|
Nevada |
2,510 |
5.0 |
2.0 |
|
Wyoming |
1,510 |
3 |
2.0 |
|
Delaware |
2,020 |
4.0 |
2.0 |
|
Minnesota |
11,200 |
22.0 |
2.0 |
|
Washington |
16,940 |
33.0 |
1.9 |
|
New Mexico |
3,200 |
6.0 |
1.9 |
|
Wisconsin |
11,220 |
21.0 |
1.9 |
|
New Jersey |
17,530 |
32.0 |
1.8 |
|
Utah |
5,060 |
9.0 |
1.8 |
|
South Carolina |
4,610 |
8.0 |
1.7 |
|
Maine |
1,830 |
3.0 |
1.6 |
|
Pennsylvania |
25,080 |
41.0 |
1.6 |
|
District of Columbia |
5,210 |
8.0 |
1.5 |
|
Oklahoma |
3,350 |
5.0 |
1.5 |
|
North Dakota |
1,420 |
2.0 |
1.4 |
|
New York |
30,330 |
41.0 |
1.4 |
|
North Carolina |
17,770 |
24.0 |
1.4 |
|
Missouri |
9,240 |
12.0 |
1.3 |
|
Kansas |
3,910 |
5.0 |
1.3 |
|
Florida |
19,440 |
24.0 |
1.2 |
|
Alabama |
5,170 |
6.0 |
1.2 |
|
Texas |
42,440 |
49.0 |
1.2 |
|
Illinois |
18,300 |
21.0 |
1.1 |
|
Arkansas |
2,700 |
3.0 |
1.1 |
|
Louisiana |
5,540 |
5.0 |
0.9 |
|
Nebraska |
3,920 |
3.0 |
0.8 |
|
Kentucky |
2,660 |
2.0 |
0.8 |
|
Alaska |
2,800 |
2.0 |
0.7 |
|
South Dakota |
1,420 |
1.0 |
0.7 |
|
|
Life & Physical Scientists, 2003 |
NIH Phase I Awards, 2003 |
NIH Phase I Awards per 1,000 Life & Physical Scientists, 2003 |
|
Georgia |
11,410 |
8.0 |
0.7 |
|
Tennessee |
7,130 |
4.0 |
0.6 |
|
Hawaii |
1,790 |
1.0 |
0.6 |
|
Montana |
2,790 |
1.0 |
0.4 |
|
Idaho |
3,100 |
1.0 |
0.3 |
|
Mississippi |
3,650 |
1.0 |
0.3 |
|
West Virginia |
2,510 |
0.0 |
0.0 |
|
Average |
|
|
3.2 |
|
SOURCE: National Institutes of Health; National Science Board, Science and Engineering Indicators 2005, Arlington, VA: National Science Foundation, 2005. |
|||
TABLE App-A-14 Top 20 Zip Codes, 1992-2003
|
Zip Code |
State |
Total Number of Grants |
|
92121 |
CA |
311 |
|
02139 |
MA |
143 |
|
94043 |
CA |
114 |
|
02472 |
MA |
99 |
|
01801 |
MA |
92 |
|
01915 |
MA |
73 |
|
20850 |
MD |
73 |
|
20877 |
MD |
64 |
|
97403 |
OR |
60 |
|
84108 |
UT |
57 |
|
02138 |
MA |
57 |
|
53711 |
WI |
52 |
|
98104 |
WA |
50 |
|
92037 |
CA |
47 |
|
77840 |
TX |
46 |
|
94545 |
CA |
45 |
|
98109 |
WA |
44 |
|
92008 |
CA |
44 |
|
27713 |
NC |
41 |
|
02464 |
MA |
40 |
|
02142 |
MA |
39 |
|
|
|
1,591 |
|
SOURCE: National Institutes of Health. |
||
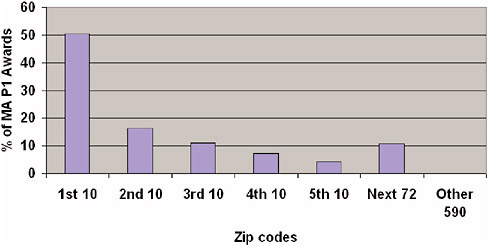
TABLE App-A-15 Phase I Awards by IC, 1992-2002
|
Funding IC |
Number of Awards |
|||||||||||
|
1992 |
1993 |
1994 |
1995 |
1996 |
1997 |
1998 |
1999 |
2000 |
2001 |
2002 |
Total |
|
|
AA |
4 |
7 |
3 |
7 |
4 |
12 |
4 |
14 |
15 |
9 |
11 |
90 |
|
AG |
12 |
14 |
28 |
16 |
5 |
34 |
26 |
29 |
34 |
37 |
26 |
261 |
|
AI |
63 |
73 |
49 |
74 |
70 |
100 |
83 |
91 |
99 |
104 |
122 |
928 |
|
AR |
5 |
16 |
17 |
26 |
29 |
25 |
20 |
27 |
22 |
27 |
14 |
228 |
|
AT |
|
|
|
|
|
|
|
2 |
6 |
7 |
7 |
22 |
|
CA |
160 |
157 |
114 |
95 |
80 |
154 |
138 |
192 |
181 |
187 |
212 |
1,670 |
|
DA |
13 |
9 |
22 |
24 |
19 |
13 |
14 |
32 |
30 |
27 |
20 |
223 |
|
DC |
6 |
10 |
12 |
8 |
5 |
12 |
8 |
20 |
21 |
18 |
9 |
129 |
|
DE |
6 |
8 |
6 |
14 |
7 |
6 |
14 |
8 |
31 |
34 |
12 |
146 |
|
DK |
16 |
22 |
36 |
49 |
39 |
50 |
40 |
70 |
82 |
65 |
67 |
536 |
|
EB |
|
|
|
|
|
|
|
|
|
|
17 |
17 |
|
ES |
8 |
8 |
8 |
9 |
10 |
8 |
9 |
11 |
23 |
28 |
30 |
152 |
|
EY |
16 |
14 |
25 |
28 |
27 |
18 |
18 |
18 |
19 |
19 |
29 |
231 |
|
GM |
42 |
63 |
48 |
42 |
53 |
68 |
74 |
88 |
79 |
80 |
76 |
713 |
|
HD |
31 |
52 |
24 |
27 |
35 |
42 |
32 |
37 |
51 |
30 |
41 |
402 |
|
HG |
6 |
5 |
4 |
5 |
5 |
8 |
17 |
17 |
9 |
8 |
22 |
106 |
|
HL |
68 |
51 |
56 |
103 |
79 |
83 |
72 |
109 |
133 |
112 |
85 |
951 |
|
LM |
2 |
3 |
2 |
|
|
3 |
6 |
4 |
4 |
1 |
2 |
27 |
|
MH |
17 |
24 |
20 |
33 |
21 |
36 |
34 |
41 |
31 |
36 |
42 |
335 |
|
NR |
4 |
7 |
1 |
6 |
1 |
3 |
6 |
5 |
5 |
2 |
2 |
42 |
|
NS |
25 |
23 |
35 |
40 |
19 |
31 |
45 |
51 |
50 |
42 |
50 |
411 |
|
RR |
36 |
27 |
20 |
13 |
14 |
33 |
40 |
39 |
41 |
36 |
33 |
332 |
|
Shared |
|
|
|
2 |
1 |
3 |
16 |
1 |
3 |
2 |
16 |
44 |
|
Total |
540 |
593 |
530 |
621 |
523 |
742 |
716 |
906 |
969 |
911 |
945 |
7,996 |
|
Funding IC |
Percentage of Awards |
|||||||||||
|
1992 |
1993 |
1994 |
1995 |
1996 |
1997 |
1998 |
1999 |
2000 |
2001 |
2002 |
Total |
|
|
AA |
0.7 |
1.2 |
0.6 |
1.1 |
0.8 |
1.6 |
0.6 |
1.5 |
1.5 |
1.0 |
1.2 |
1.1 |
|
AG |
2.2 |
2.4 |
5.3 |
2.6 |
1.0 |
4.6 |
3.6 |
3.2 |
3.5 |
4.1 |
2.8 |
3.3 |
|
AI |
11.7 |
12.3 |
9.2 |
11.9 |
13.4 |
13.5 |
11.6 |
10.0 |
10.2 |
11.4 |
12.9 |
11.6 |
|
AR |
0.9 |
2.7 |
3.2 |
4.2 |
5.5 |
3.4 |
2.8 |
3.0 |
2.3 |
3.0 |
1.5 |
2.9 |
|
AT |
0.0 |
0.0 |
0.0 |
0.0 |
0.0 |
0.0 |
0.0 |
0.2 |
0.6 |
0.8 |
0.7 |
0.3 |
|
CA |
29.6 |
26.5 |
21.5 |
15.3 |
15.3 |
20.8 |
19.3 |
21.2 |
18.7 |
20.5 |
22.4 |
20.9 |
|
DA |
2.4 |
1.5 |
4.2 |
3.9 |
3.6 |
1.8 |
2.0 |
3.5 |
3.1 |
3.0 |
2.1 |
2.8 |
|
DC |
1.1 |
1.7 |
2.3 |
1.3 |
1.0 |
1.6 |
1.1 |
2.2 |
2.2 |
2.0 |
1.0 |
1.6 |
|
DE |
1.1 |
1.3 |
1.1 |
2.3 |
1.3 |
0.8 |
2.0 |
0.9 |
3.2 |
3.7 |
1.3 |
1.8 |
|
DK |
3.0 |
3.7 |
6.8 |
7.9 |
7.5 |
6.7 |
5.6 |
7.7 |
8.5 |
7.1 |
7.1 |
6.7 |
|
EB |
0.0 |
0.0 |
0.0 |
0.0 |
0.0 |
0.0 |
0.0 |
0.0 |
0.0 |
0.0 |
1.8 |
0.2 |
|
ES |
1.5 |
1.3 |
1.5 |
1.4 |
1.9 |
1.1 |
1.3 |
1.2 |
2.4 |
3.1 |
3.2 |
1.9 |
|
EY |
3.0 |
2.4 |
4.7 |
4.5 |
5.2 |
2.4 |
2.5 |
2.0 |
2.0 |
2.1 |
3.1 |
2.9 |
|
GM |
7.8 |
10.6 |
9.1 |
6.8 |
10.1 |
9.2 |
10.3 |
9.7 |
8.2 |
8.8 |
8.0 |
8.9 |
|
HD |
5.7 |
8.8 |
4.5 |
4.3 |
6.7 |
5.7 |
4.5 |
4.1 |
5.3 |
3.3 |
4.3 |
5.0 |
|
HG |
1.1 |
0.8 |
0.8 |
0.8 |
1.0 |
1.1 |
2.4 |
1.9 |
0.9 |
0.9 |
2.3 |
1.3 |
|
HL |
12.6 |
8.6 |
10.6 |
16.6 |
15.1 |
11.2 |
10.1 |
12.0 |
13.7 |
12.3 |
9.0 |
11.9 |
|
LM |
0.4 |
0.5 |
0.4 |
0.0 |
0.0 |
0.4 |
0.8 |
0.4 |
0.4 |
0.1 |
0.2 |
0.3 |
|
MH |
3.1 |
4.0 |
3.8 |
5.3 |
4.0 |
4.9 |
4.7 |
4.5 |
3.2 |
4.0 |
4.4 |
4.2 |
|
NR |
0.7 |
1.2 |
0.2 |
1.0 |
0.2 |
0.4 |
0.8 |
0.6 |
0.5 |
0.2 |
0.2 |
0.5 |
|
NS |
4.6 |
3.9 |
6.6 |
6.4 |
3.6 |
4.2 |
6.3 |
5.6 |
5.2 |
4.6 |
5.3 |
5.1 |
|
RR |
6.7 |
4.6 |
3.8 |
2.1 |
2.7 |
4.4 |
5.6 |
4.3 |
4.2 |
4.0 |
3.5 |
4.2 |
|
Shared |
0.0 |
0.0 |
0.0 |
0.3 |
0.2 |
0.4 |
2.2 |
0.1 |
0.3 |
0.2 |
1.7 |
0.6 |
|
Total |
100.0 |
100.0 |
100.0 |
100.0 |
100.0 |
100.0 |
100.0 |
100.0 |
100.0 |
100.0 |
100.0 |
100.0 |
|
Shared awards: |
1992 |
1993 |
1994 |
1995 |
1996 |
1997 |
1998 |
1999 |
2000 |
2001 |
2002 |
|
AA, RR, RR |
|
|
|
|
|
|
|
|
|
|
6 |
|
AG, DA, DA |
|
|
|
|
|
|
|
|
|
1 |
|
|
AG, HD, HD |
|
|
|
|
|
|
|
|
|
1 |
|
|
AR, CA, CA |
|
|
|
|
|
|
2 |
|
|
|
|
|
AR, HD, HD |
|
|
|
|
|
1 |
|
|
|
|
|
|
AR, NR, NR |
|
|
|
1 |
|
|
|
|
|
|
|
|
AT, OD, OD |
|
|
|
|
|
|
|
|
|
|
3 |
|
CA, DK, DK |
|
|
|
|
|
|
|
|
1 |
|
|
|
CA, HD, HD |
|
|
|
|
|
|
1 |
|
|
|
|
|
CA, MD, MD |
|
|
|
|
|
|
|
|
|
|
1 |
|
CA, RR, RR |
|
|
|
|
|
1 |
|
|
|
|
|
|
DC, MD, MD |
|
|
|
|
|
|
|
|
|
|
5 |
|
DC, MH, MH |
|
|
|
|
1 |
|
|
|
|
|
|
|
DC, NR, NR |
|
|
|
|
|
|
|
1 |
|
|
|
|
GM, GM |
|
|
|
1 |
|
|
|
|
|
|
|
|
GM, LM, LM |
|
|
|
|
|
1 |
|
|
|
|
|
|
HD, HD |
|
|
|
|
|
|
9 |
|
|
|
|
|
HD, MH, MH |
|
|
|
|
|
|
3 |
|
|
|
|
|
HD, NR, NR |
|
|
|
|
|
|
1 |
|
|
|
|
|
MH, MH |
|
|
|
|
|
|
|
|
2 |
|
1 |
|
Total |
|
|
|
2 |
1 |
3 |
16 |
1 |
3 |
2 |
16 |
|
SOURCE: National Institutes of Health. |
|||||||||||
TABLE App-A-16 New Phase I Awards Made in Response to an RFA, 1992-2005
|
Fiscal Year |
PHASE |
Total Number of SBIR Awards (Parent Solicitation and Special PA/RFAs) |
Total Amount of SBIR Dollars Awarded (Parent Solicitation and Special PA/RFAs) |
Number of RFA SBIR Awards |
Amount of RFA SBIR Dollars Awarded |
RFA—Percent of All Awards |
RFA—Percent of All Award Dollars |
|
1992 |
Phase I |
540 |
26,571,593 |
0 |
0 |
0.0 |
0.0 |
|
1993 |
Phase I |
591 |
29,447,790 |
0 |
0 |
0.0 |
0.0 |
|
1994 |
Phase I |
527 |
39,143,156 |
37 |
2,779,027 |
7.0 |
7.1 |
|
1995 |
Phase I |
619 |
58,441,688 |
6 |
470,612 |
1.0 |
0.8 |
|
1996 |
Phase I |
523 |
50,634,759 |
3 |
300,000 |
0.6 |
0.6 |
|
1997 |
Phase I |
741 |
72,325,975 |
0 |
0 |
0.0 |
0.0 |
|
1998 |
Phase I |
702 |
69,368,224 |
1 |
98,525 |
0.1 |
0.1 |
|
1999 |
Phase I |
874 |
94,944,070 |
5 |
1,283,242 |
0.6 |
1.4 |
|
2000 |
Phase I |
944 |
113,276,949 |
12 |
2,976,638 |
1.3 |
2.6 |
|
2001 |
Phase I |
884 |
112,650,165 |
10 |
2,417,588 |
1.1 |
2.1 |
|
2002 |
Phase I |
930 |
124,423,577 |
65 |
11,586,853 |
7.0 |
9.3 |
|
2003 |
Phase I |
1,042 |
150,880,637 |
15 |
3,145,579 |
1.4 |
2.1 |
|
2004 |
Phase I |
1,023 |
158,499,201 |
15 |
4,595,326 |
1.5 |
2.9 |
|
2005 |
Phase I |
806 |
126,216,067 |
20 |
3,044,462 |
2.5 |
2.4 |
|
SOURCE: National Institutes of Health. |
|||||||
TABLE App-A-17 New Phase I Awards Made in Response to Program Announcements, 1992-2005 (PAs)
|
Fiscal Year |
PHASE |
Total Number of SBIR Awards (Parent Solicitation and Special PA/RFAs) |
Total Amount of SBIR Dollars Awarded (Parent Solicitation and Special PA/RFAs) |
Number of PA SBIR Awards |
Amount of PA SBIR Dollars Awarded |
Percent of Awards |
Percent of Dollars |
|
1992 |
Phase I |
540 |
26,571,593 |
0 |
0 |
0.0 |
0.0 |
|
1993 |
Phase I |
591 |
29,447,790 |
0 |
0 |
0.0 |
0.0 |
|
1994 |
Phase I |
527 |
39,143,156 |
0 |
0 |
0.0 |
0.0 |
|
1995 |
Phase I |
619 |
58,441,688 |
0 |
0 |
0.0 |
0.0 |
|
1996 |
Phase I |
523 |
50,634,759 |
0 |
0 |
0.0 |
0.0 |
|
1997 |
Phase I |
741 |
72,325,975 |
0 |
0 |
0.0 |
0.0 |
|
1998 |
Phase I |
702 |
69,368,224 |
1 |
106,906 |
0.1 |
0.2 |
|
1999 |
Phase I |
874 |
94,944,070 |
33 |
5,470,073 |
3.8 |
5.8 |
|
2000 |
Phase I |
944 |
113,276,949 |
42 |
9,826,643 |
4.4 |
8.7 |
|
2001 |
Phase I |
884 |
112,650,165 |
70 |
13,256,620 |
7.9 |
11.8 |
|
2002 |
Phase I |
930 |
124,423,577 |
120 |
23,269,261 |
12.9 |
18.7 |
|
2003 |
Phase I |
1,042 |
150,880,637 |
194 |
41,577,617 |
18.6 |
27.6 |
|
2004 |
Phase I |
1,023 |
158,499,201 |
215 |
48,889,961 |
21.0 |
30.8 |
|
2005 |
Phase I |
806 |
126,216,067 |
160 |
34,525,730 |
19.9 |
27.4 |
|
SOURCE: National Institutes of Health. |
|||||||
TABLE App-A-18 Phase I Awards—By Company, 1992-2003
|
Top 20 Phase I winners 1992-2003 |
|
|
Organization |
Number of Awards |
|
PANORAMA RESEARCH, INC. |
69 |
|
INOTEK PHARMACEUTICALS CORPORATION |
63 |
|
RADIATION MONITORING DEVICES, INC. |
56 |
|
LYNNTECH, INC. |
51 |
|
INFLEXXION, INC. |
44 |
|
OREGON CENTER FOR APPLIED SCIENCE |
44 |
|
NEW ENGLAND RESEARCH INSTITUTES, INC. |
42 |
|
CREARE, INC. |
40 |
|
INSIGHTFUL CORPORATION |
40 |
|
HAWAII BIOTECH, INC. |
38 |
|
PHYSICAL OPTICS CORPORATION |
33 |
|
BIOMEC, INC. |
30 |
|
SURMODICS, INC. |
30 |
|
BIOTEK, INC. |
29 |
|
SPIRE CORPORATION |
28 |
|
ONE CELL SYSTEMS, INC. |
27 |
|
COMPACT MEMBRANE SYSTEMS, INC. |
26 |
|
OSI PHARMACEUTICALS, INC. |
26 |
|
PERSONAL IMPROVEMENT COMPUTER SYSTEMS |
25 |
|
PHYSICAL SCIENCES, INC. |
25 |
|
Total |
766 |
|
SOURCE: National Institutes of Health. |
|
TABLE App-A-19 Phase I—Supplementary Awards, 1992-2003
|
Fiscal Year |
1993 |
1994 |
1995 |
1998 |
1999 |
2000 |
2001 |
2002 |
2003 |
|
Count |
2 |
3 |
2 |
10 |
23 |
21 |
20 |
12 |
10 |
|
Average ($) |
16,238 |
9,328 |
17,987 |
43,013 |
35,894 |
36,210 |
45,311 |
57,363 |
78,782 |
|
Maximum ($) |
25,000 |
15,000 |
26,331 |
98,000 |
98,000 |
105,853 |
173,059 |
287,606 |
151,607 |
|
Minimum ($) |
7,475 |
5,998 |
9,643 |
3,400 |
400 |
9,813 |
15,000 |
12,600 |
4,029 |
|
Sum ($) |
32,475 |
27,984 |
35,974 |
430,129 |
825,553 |
760,416 |
906,214 |
688,356 |
787,821 |
|
SOURCE: National Institutes of Health. |
|||||||||
TABLE App-A-20 Phase I Awards—Year Two of Support, 1992-2003
|
Fiscal Year |
1992 |
1993 |
1995 |
1996 |
1997 |
1998 |
1999 |
2000 |
2001 |
2002 |
2003 |
|
Count |
1 |
1 |
3 |
2 |
1 |
1 |
2 |
17 |
29 |
56 |
81 |
|
Average ($) |
44,848 |
49,957 |
78,618 |
57,718 |
99,944 |
100,009 |
55,858 |
203,928 |
216,888 |
214,773 |
195,558 |
|
Minimum ($) |
44,848 |
49,957 |
100,000 |
85,435 |
99,944 |
100,009 |
101,715 |
344,294 |
387,813 |
307,200 |
376,150 |
|
Maximum ($) |
44,848 |
49,957 |
49,413 |
30,000 |
99,944 |
100,009 |
10,000 |
71,238 |
65,428 |
15,600 |
49,930 |
|
Sum ($) |
44,848 |
49,957 |
235,855 |
115,435 |
99,944 |
100,009 |
111,715 |
3,466,776 |
6,289,766 |
12,027,313 |
15,840,190 |
|
SOURCE: National Institutes of Health. |
|||||||||||
TABLE App-A-21 Phase II—Year One Awards, 1992-2005
|
Fiscal Year |
Number of Awards |
Total Dollars |
Average Award Size ($) |
|
1992 |
278 |
64,634,293 |
232,497 |
|
1993 |
360 |
82,904,116 |
230,289 |
|
1994 |
351 |
82,130,205 |
233,989 |
|
1995 |
370 |
106,153,197 |
286,901 |
|
1996 |
390 |
124,699,140 |
319,741 |
|
1997 |
468 |
163,756,939 |
349,908 |
|
1998 |
541 |
182,404,280 |
337,161 |
|
1999 |
539 |
199,696,146 |
370,494 |
|
2000 |
587 |
223,656,320 |
381,016 |
|
2001 |
683 |
274,218,417 |
401,491 |
|
2002 |
797 |
330,503,121 |
414,684 |
|
2003 |
788 |
343,893,012 |
436,412 |
|
2004 |
792 |
362,710,289 |
457,968 |
|
2005 |
774 |
396,764,618 |
512,616 |
|
SOURCE: National Institutes of Health. |
|||
TABLE App-A-22 Phase II—Requests for Applications (RFAs), 1992-2005
|
Fiscal Year |
PHASE |
Total Number of SBIR Awards (Parent Solicitation and Special PA/RFAs) |
Total Amount of SBIR Dollars Awarded (Parent Solicitation and Special PA/RFAs) |
Number of RFA SBIR Awards |
Amount of RFA SBIR Dollars Awarded |
RFA—Percent of All Awards |
RFA—Percent of All Award Dollars |
|
1992 |
Phase II |
139 |
34,653,136 |
0 |
0 |
0.0 |
0.0 |
|
1993 |
Phase II |
215 |
52,537,980 |
0 |
0 |
0.0 |
0.0 |
|
1994 |
Phase II |
134 |
36,697,824 |
0 |
0 |
0.0 |
0.0 |
|
1995 |
Phase II |
212 |
73,059,839 |
0 |
0 |
0.0 |
0.0 |
|
1996 |
Phase II |
172 |
60,806,200 |
0 |
0 |
0.0 |
0.0 |
|
1997 |
Phase II |
279 |
104,817,711 |
0 |
0 |
0.0 |
0.0 |
|
1998 |
Phase II |
224 |
85,283,655 |
0 |
0 |
0.0 |
0.0 |
|
1999 |
Phase II |
278 |
114,811,423 |
1 |
507,041 |
0.4 |
0.4 |
|
2000 |
Phase II |
231 |
102,407,911 |
0 |
0 |
0.0 |
0.0 |
|
2001 |
Phase II |
343 |
148,866,724 |
0 |
0 |
0.0 |
0.0 |
|
2002 |
Phase II |
336 |
154,925,573 |
0 |
0 |
0.0 |
0.0 |
|
2003 |
Phase II |
327 |
156,101,955 |
0 |
0 |
0.0 |
0.0 |
|
2004 |
Phase II |
298 |
153,544,979 |
5 |
2,594,326 |
1.7 |
1.7 |
|
2005 |
Phase II |
312 |
163,695,822 |
5 |
2,659,999 |
1.6 |
1.6 |
|
SOURCE: National Institutes of Health. |
|||||||
TABLE App-A-23 Phase II—Program Announcements (PAs)—New Awards, 1992-2005
|
Fiscal Year |
PHASE |
Total Number of SBIR Awards (Parent Solicitation and Special PA/RFAs) |
Total Amount of SBIR Dollars Awarded (Parent Solicitation and Special PA/RFAs) |
Number of PA SBIR Awards |
Amount of PA SBIR Dollars Awarded |
PA—Percent of All Awards |
PA—Percent of All Award Dollars |
|
1992 |
Phase II |
139 |
34,653,136 |
0 |
0 |
0.0 |
0.0 |
|
1993 |
Phase II |
215 |
52,537,980 |
0 |
0 |
0.0 |
0.0 |
|
1994 |
Phase II |
134 |
36,697,824 |
0 |
0 |
0.0 |
0.0 |
|
1995 |
Phase II |
212 |
73,059,839 |
0 |
0 |
0.0 |
0.0 |
|
1996 |
Phase II |
172 |
60,806,200 |
0 |
0 |
0.0 |
0.0 |
|
1997 |
Phase II |
279 |
104,817,711 |
0 |
0 |
0.0 |
0.0 |
|
1998 |
Phase II |
224 |
85,283,655 |
0 |
0 |
0.0 |
0.0 |
|
1999 |
Phase II |
278 |
114,811,423 |
2 |
1,256,508 |
0.7 |
1.1 |
|
2000 |
Phase II |
231 |
102,407,911 |
1 |
370,000 |
0.4 |
0.4 |
|
2001 |
Phase II |
343 |
148,866,724 |
8 |
4,398,827 |
2.3 |
3.0 |
|
2002 |
Phase II |
336 |
154,925,573 |
8 |
4,980,270 |
2.4 |
3.2 |
|
2003 |
Phase II |
327 |
156,101,955 |
30 |
17,637,373 |
9.2 |
11.3 |
|
2004 |
Phase II |
298 |
153,544,979 |
32 |
23,569,833 |
10.7 |
15.4 |
|
2005 |
Phase II |
312 |
163,695,822 |
43 |
30,719,886 |
13.8 |
18.8 |
|
SOURCE: National Institutes of Health. |
|||||||
TABLE App-A-24 Phase II Extra-large Awards, 1992-2005
|
Fiscal Year |
NIH Phase II SBIR Awards Over 375K |
|||||||||
|
PHASE |
Total Number Funded |
Year Two |
Year Three |
Year Four |
Year Five |
|||||
|
1992 |
Phase II |
139 |
1 |
0.7% |
0 |
0.0% |
0 |
0.0% |
0 |
0.0% |
|
1993 |
Phase II |
215 |
5 |
2.3% |
0 |
0.0% |
0 |
0.0% |
0 |
0.0% |
|
1994 |
Phase II |
134 |
7 |
5.2% |
1 |
0.7% |
0 |
0.0% |
0 |
0.0% |
|
1995 |
Phase II |
212 |
70 |
33.0% |
0 |
0.0% |
0 |
0.0% |
0 |
0.0% |
|
1996 |
Phase II |
172 |
68 |
39.5% |
0 |
0.0% |
0 |
0.0% |
0 |
0.0% |
|
1997 |
Phase II |
279 |
131 |
47.0% |
1 |
0.4% |
0 |
0.0% |
0 |
0.0% |
|
1998 |
Phase II |
224 |
106 |
47.3% |
0 |
0.0% |
0 |
0.0% |
0 |
0.0% |
|
1999 |
Phase II |
278 |
169 |
60.8% |
2 |
0.7% |
0 |
0.0% |
0 |
0.0% |
|
2000 |
Phase II |
231 |
155 |
67.1% |
1 |
0.4% |
0 |
0.0% |
0 |
0.0% |
|
2001 |
Phase II |
343 |
240 |
70.0% |
1 |
0.3% |
0 |
0.0% |
0 |
0.0% |
|
2002 |
Phase II |
336 |
238 |
70.8% |
2 |
0.6% |
0 |
0.0% |
0 |
0.0% |
|
2003 |
Phase II |
327 |
224 |
68.5% |
8 |
2.4% |
0 |
0.0% |
1 |
0.3% |
|
2004 |
Phase II |
298 |
194 |
65.1% |
15 |
5.0% |
2 |
0.7% |
1 |
0.3% |
|
2005 |
Phase II |
312 |
205 |
65.7% |
15 |
4.8% |
14 |
4.5% |
2 |
0.6% |
|
Fiscal Year |
NIH Phase II SBIR Awards Over 500K |
|||||||||
|
PHASE |
Total Number Funded |
Year Two |
Year Three |
Year Four |
Year Five |
|||||
|
1992 |
Phase II |
139 |
0 |
0.0% |
0 |
0.0% |
0 |
0.0% |
0 |
0.0% |
|
1993 |
Phase II |
215 |
0 |
0.0% |
0 |
0.0% |
0 |
0.0% |
0 |
0.0% |
|
1994 |
Phase II |
134 |
1 |
0.7% |
1 |
0.7% |
0 |
0.0% |
0 |
0.0% |
|
1995 |
Phase II |
212 |
6 |
2.8% |
0 |
0.0% |
0 |
0.0% |
0 |
0.0% |
|
1996 |
Phase II |
172 |
5 |
2.9% |
0 |
0.0% |
0 |
0.0% |
0 |
0.0% |
|
1997 |
Phase II |
279 |
13 |
4.7% |
0 |
0.0% |
0 |
0.0% |
0 |
0.0% |
|
1998 |
Phase II |
224 |
7 |
3.1% |
0 |
0.0% |
0 |
0.0% |
0 |
0.0% |
|
1999 |
Phase II |
278 |
34 |
12.2% |
0 |
0.0% |
0 |
0.0% |
0 |
0.0% |
|
2000 |
Phase II |
231 |
52 |
22.5% |
1 |
0.4% |
0 |
0.0% |
0 |
0.0% |
|
2001 |
Phase II |
343 |
72 |
21.0% |
1 |
0.3% |
0 |
0.0% |
0 |
0.0% |
|
2002 |
Phase II |
336 |
80 |
23.8% |
1 |
0.3% |
0 |
0.0% |
0 |
0.0% |
|
2003 |
Phase II |
327 |
83 |
25.4% |
4 |
1.2% |
0 |
0.0% |
1 |
0.3% |
|
2004 |
Phase II |
298 |
91 |
30.5% |
11 |
3.7% |
2 |
0.7% |
1 |
0.3% |
|
2005 |
Phase II |
312 |
90 |
28.8% |
11 |
3.5% |
13 |
4.2% |
1 |
0.3% |
|
Fiscal Year |
NIH Phase II SBIR Awards Over 750K |
|||||||||
|
PHASE |
Total Number Funded |
Year Two |
Year Three |
Year Four |
Year Five |
|||||
|
1992 |
Phase II |
139 |
0 |
0.0% |
0 |
0.0% |
0 |
0.0% |
0 |
0.0% |
|
1993 |
Phase II |
215 |
0 |
0.0% |
0 |
0.0% |
0 |
0.0% |
0 |
0.0% |
|
1994 |
Phase II |
134 |
0 |
0.0% |
0 |
0.0% |
0 |
0.0% |
0 |
0.0% |
|
1995 |
Phase II |
212 |
0 |
0.0% |
0 |
0.0% |
0 |
0.0% |
0 |
0.0% |
|
1996 |
Phase II |
172 |
0 |
0.0% |
0 |
0.0% |
0 |
0.0% |
0 |
0.0% |
|
1997 |
Phase II |
279 |
0 |
0.0% |
0 |
0.0% |
0 |
0.0% |
0 |
0.0% |
|
1998 |
Phase II |
224 |
0 |
0.0% |
0 |
0.0% |
0 |
0.0% |
0 |
0.0% |
|
1999 |
Phase II |
278 |
8 |
2.9% |
0 |
0.0% |
0 |
0.0% |
0 |
0.0% |
|
2000 |
Phase II |
231 |
8 |
3.5% |
0 |
0.0% |
0 |
0.0% |
0 |
0.0% |
|
2001 |
Phase II |
343 |
9 |
2.6% |
1 |
0.3% |
0 |
0.0% |
0 |
0.0% |
|
2002 |
Phase II |
336 |
23 |
6.8% |
0 |
0.0% |
0 |
0.0% |
0 |
0.0% |
|
2003 |
Phase II |
327 |
18 |
5.5% |
4 |
1.2% |
0 |
0.0% |
1 |
0.3% |
|
2004 |
Phase II |
298 |
24 |
8.1% |
6 |
2.0% |
1 |
0.3% |
1 |
0.3% |
|
2005 |
Phase II |
312 |
27 |
8.7% |
8 |
2.6% |
11 |
3.5% |
1 |
0.3% |
|
SOURCE: National Institutes of Health. |
||||||||||
TABLE App-A-25 Phase I, Year One Supplements, 1992-2003
|
Fiscal Year |
1992 |
1993 |
1994 |
1995 |
1996 |
1997 |
1998 |
1999 |
2000 |
2001 |
2002 |
2003 |
|
Number of Awards |
4 |
6 |
9 |
7 |
8 |
15 |
24 |
16 |
31 |
33 |
33 |
30 |
|
Average ($) |
67,138 |
64,067 |
47,101 |
25,314 |
43,988 |
100,688 |
131,038 |
96,728 |
118,537 |
134,049 |
163,440 |
95,711 |
|
Maximum ($) |
142,502 |
150,000 |
121,237 |
82,000 |
118,886 |
214,957 |
530,198 |
375,000 |
574,670 |
600,000 |
713,490 |
370,349 |
|
Minimum ($) |
26,731 |
8,112 |
2,780 |
6,779 |
6,417 |
15,470 |
9,414 |
634 |
10,268 |
10,000 |
9,809 |
2,200 |
|
Total ($) |
268,550 |
384,402 |
423,913 |
177,196 |
351,906 |
1,510,314 |
3,144,900 |
1,547,643 |
3,674,641 |
4,423,627 |
5,393,530 |
2,871,315 |
|
SOURCE: National Institutes of Health. |
||||||||||||
TABLE App-A-26 Phase II, Year One Grants, 1992-2003
|
All Phase II, year one grants |
||||||
|
Fiscal Year |
1992 |
1993 |
1994 |
1995 |
1996 |
1997 |
|
Number of Grants |
137 |
215 |
131 |
210 |
173 |
280 |
|
Average ($) |
249,361 |
244,363 |
269,611 |
345,070 |
349,374 |
375,304 |
|
Amended Phase II, year one grants |
||||||
|
Fiscal Year |
1992 |
1993 |
1994 |
1995 |
1996 |
1997 |
|
Number of Grants |
29 |
55 |
22 |
48 |
51 |
89 |
|
Percent of all |
21.2 |
25.6 |
16.8 |
22.9 |
29.5 |
31.8 |
|
Average ($) |
238,893 |
247,948 |
255,816 |
354,890 |
336,933 |
358,916 |
|
Percent all av. |
95.8 |
101.5 |
94.9 |
102.8 |
96.4 |
95.6 |
|
Maximum ($) |
286,292 |
500,000 |
326,203 |
647,634 |
495,215 |
611,874 |
|
Minimum ($) |
129,427 |
112,898 |
2,000 |
93,848 |
3,646 |
7,666 |
|
Sum ($) |
6,927,902 |
13,637,125 |
5,627,959 |
17,034,712 |
17,183,579 |
31,943,518 |
|
SOURCE: National Institutes of Health. |
||||||
|
1998 |
1999 |
2000 |
2001 |
2002 |
2003 |
|
237 |
289 |
267 |
381 |
358 |
349 |
|
379,972 |
410,335 |
448,377 |
437,573 |
461,216 |
495,834 |
|
1998 |
1999 |
2000 |
2001 |
2002 |
2003 |
|
45 |
60 |
62 |
100 |
88 |
82 |
|
19.0 |
20.8 |
23.2 |
26.2 |
24.6 |
23.5 |
|
377,707 |
385,556 |
391,078 |
402,757 |
462,258 |
461,427 |
|
99.4 |
94.0 |
87.2 |
92.0 |
100.2 |
93.1 |
|
514,581 |
864,785 |
591,768 |
822,158 |
1,152,230 |
1,230,000 |
|
48,387 |
12,869 |
9,782 |
31,418 |
23,719 |
204,950 |
|
16,996,826 |
23,133,378 |
24,246,844 |
40,275,684 |
40,678,701 |
37,837,035 |
TABLE A pp-A-27 Phase II Contracts, 1992-2000
|
Fiscal Year |
1992 |
1993 |
1994 |
1995 |
1996 |
1997 |
1998 |
1999 |
2000 |
|
Number of Awards |
27 |
34 |
21 |
26 |
23 |
24 |
28 |
21 |
28 |
|
Average ($) |
205,473 |
222,926 |
210,814 |
337,065 |
304,616 |
377,640 |
359,969 |
414,538 |
324,965 |
|
Maximum ($) |
477,019 |
499,085 |
500,000 |
739,693 |
750,000 |
1,184,286 |
750,000 |
798,773 |
749,868 |
|
Minimum ($) |
14,834 |
9,660 |
13,915 |
10,000 |
7,050 |
9,793 |
7,253 |
4,245 |
87,992 |
|
Total ($) |
5,547,783 |
7,579,467 |
4,427,086 |
8,763,693 |
7,006,158 |
9,063,353 |
10,079,133 |
8,705,294 |
9,099,027 |
|
SOURCE: National Institutes of Health. |
|||||||||
TABLE App-A-28 Phase II Awards by IC, 1992-2003
|
IC |
Number of Awards |
Percent of Total |
Number of Applications |
Success Rate (%) |
||||||||||||
|
1992 |
1993 |
1994 |
1995 |
1996 |
1997 |
1998 |
1999 |
2000 |
2001 |
2002 |
2003 |
Awards |
||||
|
AA |
3 |
3 |
1 |
1 |
2 |
5 |
2 |
4 |
5 |
4 |
4 |
2 |
36 |
1.2 |
92 |
39.1 |
|
AG |
8 |
10 |
4 |
14 |
9 |
10 |
12 |
11 |
10 |
15 |
19 |
14 |
136 |
4.5 |
300 |
45.3 |
|
AI |
16 |
23 |
17 |
18 |
20 |
28 |
27 |
30 |
23 |
30 |
26 |
22 |
280 |
9.3 |
667 |
42.0 |
|
AR |
4 |
4 |
2 |
3 |
1 |
7 |
3 |
6 |
6 |
7 |
10 |
8 |
61 |
2.0 |
251 |
24.3 |
|
AT |
|
|
|
|
|
|
|
|
2 |
|
3 |
1 |
6 |
0.2 |
10 |
60.0 |
|
CA |
15 |
40 |
16 |
45 |
31 |
53 |
45 |
46 |
49 |
56 |
54 |
51 |
501 |
16.6 |
1,378 |
36.4 |
|
DA |
5 |
13 |
3 |
7 |
6 |
11 |
9 |
5 |
9 |
14 |
14 |
15 |
111 |
3.7 |
232 |
47.8 |
|
DC |
2 |
4 |
4 |
4 |
4 |
4 |
6 |
4 |
4 |
9 |
5 |
6 |
56 |
1.9 |
151 |
37.1 |
|
DE |
3 |
6 |
2 |
3 |
4 |
4 |
3 |
4 |
1 |
4 |
9 |
8 |
51 |
1.7 |
175 |
29.1 |
|
DK |
9 |
13 |
8 |
12 |
13 |
18 |
14 |
20 |
16 |
23 |
26 |
24 |
196 |
6.5 |
450 |
43.6 |
|
EB |
|
|
|
|
|
|
|
|
|
|
6 |
6 |
12 |
0.4 |
25 |
48.0 |
|
ES |
1 |
4 |
2 |
3 |
3 |
3 |
6 |
4 |
4 |
6 |
8 |
11 |
55 |
1.8 |
135 |
40.7 |
|
EY |
5 |
6 |
1 |
5 |
4 |
9 |
9 |
9 |
11 |
13 |
6 |
12 |
90 |
3.0 |
242 |
37.2 |
|
GM |
16 |
13 |
17 |
19 |
16 |
25 |
17 |
26 |
23 |
37 |
20 |
26 |
255 |
8.4 |
567 |
45.0 |
|
HD |
6 |
11 |
10 |
12 |
9 |
15 |
15 |
14 |
21 |
26 |
25 |
21 |
185 |
6.1 |
464 |
39.9 |
|
HG |
2 |
4 |
1 |
4 |
1 |
4 |
4 |
6 |
6 |
5 |
3 |
7 |
47 |
1.6 |
76 |
61.8 |
|
HL |
23 |
35 |
18 |
27 |
21 |
42 |
28 |
45 |
31 |
59 |
47 |
53 |
429 |
14.2 |
1,018 |
42.1 |
|
LM |
|
|
|
|
|
|
|
|
|
2 |
|
2 |
4 |
0.1 |
20 |
20.0 |
|
MD |
|
|
|
|
|
|
|
|
|
|
|
|
|
|
1 |
0.0 |
|
MH |
8 |
9 |
10 |
11 |
11 |
16 |
14 |
20 |
18 |
23 |
13 |
18 |
171 |
5.6 |
330 |
51.8 |
|
NR |
|
1 |
|
|
2 |
1 |
1 |
2 |
2 |
3 |
3 |
3 |
18 |
0.6 |
51 |
35.3 |
|
NS |
7 |
12 |
7 |
10 |
9 |
15 |
12 |
17 |
18 |
20 |
31 |
17 |
175 |
5.8 |
384 |
45.6 |
|
RR |
4 |
4 |
6 |
9 |
7 |
10 |
7 |
11 |
7 |
22 |
19 |
22 |
128 |
4.2 |
326 |
39.3 |
|
Shared |
|
|
2 |
3 |
|
|
3 |
5 |
1 |
3 |
7 |
|
24 |
0.8 |
|
|
|
Total |
137 |
215 |
131 |
210 |
173 |
280 |
237 |
289 |
267 |
381 |
358 |
349 |
3,027 |
100 |
|
|
|
SOURCE: National Institutes of Health. |
||||||||||||||||
TABLE App-A-29 Conversion Fates of Top 20 Phase II Winners, 1992-2003
|
Organization |
Number of Phase II Awards |
Number of Phase I Awards |
Conversion Rate (%) |
|
NEW ENGLAND RESEARCH INSTITUTES, INC. |
34 |
42 |
81.0 |
|
INFLEXXION, INC. |
32 |
44 |
72.7 |
|
RADIATION MONITORING DEVICES, INC. |
30 |
56 |
53.6 |
|
OREGON CENTER FOR APPLIED SCIENCE |
27 |
44 |
61.4 |
|
INSIGHTFUL CORPORATION |
22 |
40 |
55.0 |
|
LYNNTECH, INC. |
17 |
51 |
33.3 |
|
PANORAMA RESEARCH, INC. |
15 |
69 |
21.7 |
|
INOTEK PHARMACEUTICALS CORPORATION |
14 |
63 |
22.2 |
|
SOCIOMETRICS CORPORATION |
13 |
16 |
81.3 |
|
ABIOMED, INC. |
13 |
13 |
100.0 |
|
PERSONAL IMPROVEMENT COMPUTER SYSTEMS |
13 |
25 |
52.0 |
|
CREARE, INC. |
13 |
40 |
32.5 |
|
CLEVELAND MEDICAL DEVICES, INC. |
13 |
23 |
56.5 |
|
INDIVIDUAL MONITORING SYS, INC. (IM SYS) |
12 |
14 |
85.7 |
|
BIOTEK, INC. |
12 |
29 |
41.4 |
|
SURMODICS, INC. |
11 |
30 |
36.7 |
|
ADVANCED MEDICAL ELECTRONICS CORPORATION |
11 |
18 |
61.1 |
|
ELECTRICAL GEODESICS, INC. |
11 |
19 |
57.9 |
|
WESTERN RESEARCH COMPANY, INC. |
11 |
20 |
55.0 |
|
PHYSICAL SCIENCES, INC. |
11 |
25 |
44.0 |
|
Total (top 20 award winners) |
335 |
681 |
49.2 |
|
All Awards |
3,027 |
|
|
|
Top 20 as percent of all Phase II awards |
11.1 |
|
|
|
SOURCE: National Institutes of Health. |
|||
TABLE App-A-30 Phase II Awards by State, 1992-2005
|
State |
Number of Awards by Fiscal Year |
Grand Total |
Percent of Total |
|||||||||||||
|
1992 |
1993 |
1994 |
1995 |
1996 |
1997 |
1998 |
1999 |
2000 |
2001 |
2002 |
2003 |
2004 |
2005 |
|||
|
ALABAMA |
2 |
2 |
4 |
6 |
4 |
3 |
3 |
3 |
4 |
6 |
7 |
5 |
5 |
3 |
57 |
0.7 |
|
ARIZONA |
3 |
7 |
6 |
2 |
2 |
5 |
7 |
13 |
14 |
8 |
17 |
18 |
10 |
11 |
123 |
1.6 |
|
ARKANSAS |
|
|
1 |
1 |
|
|
|
|
|
|
1 |
1 |
|
2 |
6 |
0.1 |
|
CALIFORNIA |
39 |
62 |
53 |
60 |
66 |
94 |
119 |
99 |
94 |
120 |
137 |
137 |
155 |
142 |
1,377 |
17.8 |
|
COLORADO |
3 |
5 |
5 |
5 |
9 |
10 |
11 |
16 |
17 |
15 |
17 |
17 |
15 |
15 |
160 |
2.1 |
|
CONNECTICUT |
8 |
9 |
9 |
12 |
12 |
8 |
7 |
6 |
9 |
9 |
5 |
7 |
12 |
11 |
124 |
1.6 |
|
DELAWARE |
|
|
|
|
2 |
2 |
1 |
3 |
4 |
3 |
2 |
2 |
3 |
3 |
25 |
0.3 |
|
DIST OF COL |
1 |
2 |
4 |
2 |
2 |
6 |
6 |
6 |
14 |
9 |
12 |
8 |
8 |
5 |
85 |
1.1 |
|
FLORIDA |
6 |
13 |
10 |
4 |
3 |
10 |
9 |
4 |
11 |
10 |
9 |
9 |
10 |
11 |
119 |
1.5 |
|
GEORGIA |
1 |
1 |
3 |
3 |
1 |
4 |
6 |
8 |
8 |
6 |
5 |
5 |
7 |
8 |
66 |
0.9 |
|
HAWAII |
2 |
2 |
2 |
3 |
2 |
1 |
|
1 |
2 |
2 |
2 |
1 |
2 |
3 |
25 |
0.3 |
|
IDAHO |
|
1 |
1 |
|
|
|
|
1 |
1 |
|
|
|
1 |
1 |
6 |
0.1 |
|
ILLINOIS |
7 |
10 |
9 |
6 |
6 |
11 |
13 |
17 |
17 |
18 |
17 |
19 |
15 |
6 |
171 |
2.2 |
|
INDIANA |
4 |
2 |
|
3 |
5 |
5 |
4 |
4 |
5 |
5 |
7 |
6 |
6 |
9 |
65 |
0.8 |
|
IOWA |
2 |
1 |
|
|
|
1 |
2 |
2 |
1 |
3 |
4 |
2 |
2 |
1 |
21 |
0.3 |
|
KANSAS |
|
|
|
2 |
2 |
2 |
2 |
1 |
2 |
3 |
4 |
4 |
4 |
3 |
29 |
0.4 |
|
KENTUCKY |
1 |
2 |
1 |
|
1 |
1 |
|
1 |
1 |
3 |
4 |
1 |
4 |
5 |
25 |
0.3 |
|
LOUISIANA |
1 |
2 |
1 |
1 |
|
1 |
1 |
|
1 |
2 |
3 |
3 |
1 |
3 |
20 |
0.3 |
|
MAINE |
1 |
1 |
2 |
2 |
|
2 |
3 |
2 |
2 |
1 |
3 |
4 |
1 |
1 |
25 |
0.3 |
|
MARYLAND |
23 |
31 |
34 |
30 |
28 |
26 |
37 |
30 |
29 |
42 |
48 |
43 |
52 |
52 |
505 |
6.5 |
|
MASSACHUSETTS |
57 |
70 |
52 |
60 |
80 |
94 |
86 |
84 |
99 |
118 |
121 |
105 |
100 |
103 |
1,229 |
15.9 |
|
MICHIGAN |
8 |
10 |
7 |
8 |
11 |
15 |
19 |
14 |
10 |
14 |
13 |
19 |
18 |
24 |
190 |
2.5 |
|
MINNESOTA |
10 |
9 |
9 |
8 |
10 |
16 |
12 |
8 |
8 |
10 |
13 |
16 |
14 |
20 |
163 |
2.1 |
|
MISSISSIPPI |
|
|
|
|
|
|
|
|
|
|
|
1 |
1 |
|
2 |
0.0 |
|
MISSOURI |
2 |
1 |
2 |
|
|
1 |
3 |
3 |
6 |
3 |
7 |
7 |
4 |
5 |
44 |
0.6 |
|
MONTANA |
|
|
|
|
1 |
1 |
1 |
2 |
1 |
2 |
2 |
1 |
2 |
2 |
15 |
0.2 |
|
NEBRASKA |
1 |
1 |
1 |
2 |
2 |
2 |
2 |
1 |
3 |
4 |
2 |
1 |
4 |
3 |
29 |
0.4 |
|
State |
Number of Awards by Fiscal Year |
Grand Total |
Percent of Total |
|||||||||||||
|
1992 |
1993 |
1994 |
1995 |
1996 |
1997 |
1998 |
1999 |
2000 |
2001 |
2002 |
2003 |
2004 |
2005 |
|||
|
NEVADA |
1 |
1 |
2 |
2 |
1 |
1 |
|
|
1 |
3 |
4 |
2 |
2 |
|
20 |
0.3 |
|
NEW HAMPSHIRE |
1 |
2 |
2 |
6 |
6 |
4 |
6 |
7 |
6 |
7 |
8 |
12 |
12 |
8 |
87 |
1.1 |
|
NEW JERSEY |
12 |
7 |
8 |
8 |
7 |
6 |
9 |
19 |
21 |
20 |
27 |
21 |
16 |
19 |
200 |
2.6 |
|
NEW MEXICO |
|
1 |
2 |
2 |
4 |
4 |
2 |
1 |
4 |
5 |
5 |
6 |
5 |
4 |
45 |
0.6 |
|
NEW YORK |
13 |
21 |
23 |
20 |
23 |
26 |
22 |
22 |
27 |
32 |
42 |
40 |
36 |
36 |
383 |
5.0 |
|
NORTH CAROLINA |
7 |
9 |
13 |
8 |
6 |
14 |
16 |
15 |
13 |
17 |
24 |
23 |
23 |
31 |
219 |
2.8 |
|
NORTH DAKOTA |
|
|
|
|
|
|
|
|
|
|
|
|
1 |
2 |
3 |
0.0 |
|
OHIO |
4 |
8 |
8 |
11 |
10 |
14 |
18 |
18 |
17 |
16 |
29 |
29 |
19 |
19 |
220 |
2.9 |
|
OKLAHOMA |
1 |
2 |
3 |
1 |
1 |
|
1 |
1 |
|
1 |
2 |
1 |
3 |
4 |
21 |
0.3 |
|
OREGON |
6 |
7 |
8 |
11 |
12 |
14 |
19 |
18 |
21 |
21 |
21 |
20 |
23 |
27 |
228 |
3.0 |
|
PENNSYLVANIA |
13 |
7 |
7 |
12 |
16 |
13 |
17 |
20 |
18 |
27 |
38 |
34 |
34 |
32 |
288 |
3.7 |
|
PUERTO RICO |
|
|
|
|
|
|
|
|
1 |
1 |
|
|
|
|
2 |
0.0 |
|
RHODE ISLAND |
1 |
1 |
|
|
|
|
|
2 |
4 |
4 |
6 |
7 |
10 |
8 |
43 |
0.6 |
|
SOUTH CAROLINA |
|
|
|
|
|
|
|
|
1 |
1 |
6 |
7 |
5 |
6 |
26 |
0.3 |
|
SOUTH DAKOTA |
|
|
|
|
|
|
|
2 |
2 |
1 |
2 |
1 |
1 |
1 |
10 |
0.1 |
|
TENNESSEE |
2 |
2 |
4 |
4 |
1 |
1 |
5 |
5 |
3 |
2 |
2 |
5 |
6 |
4 |
46 |
0.6 |
|
TEXAS |
13 |
12 |
12 |
16 |
13 |
15 |
17 |
18 |
23 |
27 |
25 |
32 |
36 |
37 |
296 |
3.8 |
|
UTAH |
8 |
13 |
9 |
7 |
5 |
2 |
5 |
8 |
9 |
12 |
16 |
9 |
5 |
4 |
112 |
1.5 |
|
VERMONT |
2 |
1 |
2 |
4 |
3 |
2 |
1 |
|
1 |
1 |
1 |
5 |
6 |
4 |
33 |
0.4 |
|
VIRGINIA |
6 |
10 |
18 |
21 |
15 |
10 |
12 |
14 |
13 |
22 |
24 |
32 |
36 |
23 |
256 |
3.3 |
|
WASHINGTON |
5 |
11 |
12 |
14 |
14 |
15 |
30 |
34 |
26 |
30 |
42 |
42 |
36 |
35 |
346 |
4.5 |
|
WISCONSIN |
1 |
1 |
2 |
3 |
4 |
6 |
7 |
6 |
12 |
16 |
10 |
17 |
20 |
17 |
122 |
1.6 |
|
WYOMING |
|
|
|
|
|
|
|
|
1 |
1 |
1 |
1 |
1 |
1 |
6 |
0.1 |
|
Grand Total |
278 |
360 |
351 |
370 |
390 |
468 |
541 |
539 |
587 |
683 |
797 |
788 |
792 |
774 |
7,718 |
100.0 |
|
SOURCE: National Institutes of Health. |
||||||||||||||||
TABLE App-A-31 NIH—Target Groups
|
Size of Affected Populations |
In Commercialization |
In Use |
Total |
|||
|
Number |
Percent |
Number |
Percent |
Number |
Percent |
|
|
MISSING |
1 |
0.5 |
0 |
0.0 |
1 |
0.3 |
|
Under 10,000 persons |
30 |
16.3 |
42 |
26.6 |
72 |
21.1 |
|
10,000-49,999 |
23 |
12.5 |
21 |
13.3 |
44 |
12.9 |
|
50,000-199,999 |
9 |
4.9 |
17 |
10.8 |
26 |
7.6 |
|
200,000-499,999 |
13 |
7.1 |
14 |
8.9 |
27 |
7.9 |
|
500,000 or more |
76 |
41.3 |
44 |
27.8 |
120 |
35.1 |
|
Not sure |
32 |
17.4 |
20 |
12.7 |
52 |
15.2 |
|
|
184 |
100.0 |
158 |
100.0 |
342 |
100.0 |
|
SOURCE: National Institutes of Health, National Survey to Evaluate the NIH SBIR Program: Final Report, July 2003. |
||||||
TABLE App-A-32 High-impact Projects—By Target Sector
|
Population |
Number of High-impact Respondents |
All Respondents (#) |
Percent of High-impact |
Percent of All |
|
Outpatients |
4 |
28 |
9.1 |
11.2 |
|
Inpatients |
1 |
22 |
2.3 |
8.8 |
|
Hospital personnel |
4 |
10 |
9.1 |
4.0 |
|
Research labs |
2 |
67 |
4.5 |
26.9 |
|
Diagnostic labs |
4 |
15 |
9.1 |
6.0 |
|
Medical practitioners |
7 |
24 |
15.9 |
9.6 |
|
Homecare providers |
1 |
1 |
2.3 |
0.4 |
|
Other |
2 |
3 |
4.5 |
1.2 |
|
Other health services |
4 |
12 |
9.1 |
4.8 |
|
General public |
8 |
26 |
18.2 |
10.4 |
|
Educators |
2 |
7 |
4.5 |
2.8 |
|
Worksites |
0 |
1 |
0.0 |
0.4 |
|
Schools, universities |
1 |
11 |
2.3 |
4.4 |
|
Other companies, other technologies |
2 |
7 |
4.5 |
2.8 |
|
Health researchers |
1 |
5 |
2.3 |
2.0 |
|
MISSING |
1 |
10 |
2.3 |
4.0 |
|
Total |
44 |
249 |
100.0 |
100.0 |
|
NOTE: High-impact respondents are those with products in use, who expect to affect more than 500,000 people. SOURCE: National Institutes of Health, National Survey to Evaluate the NIH SBIR Program: Final Report, July 2003. |
||||
TABLE App-A-33 NIH—Field of Business
|
Q2. Field of Business |
|
|
Q2. Text: |
|
|
Number of Companies |
Percent |
Which of the following best describes this company’s major field of business? |
|
Biotechnology |
175 |
22.8 |
|
|
Chemical technology |
12 |
1.6 |
|
|
Computer hardware, software |
88 |
11.5 |
|
|
Diagnostics |
43 |
5.6 |
|
|
Engineering, fabrication |
13 |
1.7 |
|
|
Environment, ergonomics |
20 |
2.6 |
|
|
Health care |
21 |
2.7 |
|
|
Information & research |
85 |
11.1 |
|
|
Instrumentation |
17 |
2.2 |
|
|
Medical devices |
145 |
18.9 |
|
|
Medical education, health promotion |
65 |
8.5 |
|
|
Other |
25 |
3.3 |
|
|
Pharmaceuticals |
58 |
7.6 |
|
|
Total companies responding |
767 |
100 |
|
|
SOURCE: National Institutes of Health, National Survey to Evaluate the NIH SBIR Program: Final Report, July 2003. |
|||
TABLE App-A-34 NIH—Other SBIR Awards
|
How Many Related Phase II Awards? |
NIH Survey Breakout—Phase I and Phase II |
||||||||
|
Number of Awards |
NIH Survey |
NRC Survey |
Number of Awards |
Related Phase I Awards |
Related Phase II Awards |
||||
|
Number of Companies |
Percent |
Number of Companies |
Percent |
Number of Companies |
Percent |
Number of Companies |
Percent |
||
|
|
|
|
|
|
0 |
2 |
0.5 |
143 |
35.8 |
|
1 |
152 |
59.4 |
92 |
56.8 |
1 |
156 |
39.1 |
152 |
38.1 |
|
2 |
65 |
25.4 |
30 |
18.5 |
2 |
106 |
26.6 |
65 |
16.3 |
|
3 |
1 9 |
7.4 |
11 |
6.8 |
3 |
6 8 |
17.0 |
19 |
4.8 |
|
4 |
8 |
3.1 |
8 |
4.9 |
4 |
19 |
4.8 |
8 |
2.0 |
|
5 |
4 |
1.6 |
12 |
7.4 |
5 |
20 |
5.0 |
4 |
1.0 |
|
6 |
2 |
0.8 |
0 |
0.0 |
6 |
1 3 |
3.3 |
2 |
0.5 |
|
7 |
1 |
0.4 |
1 |
0.6 |
7 |
3 |
0.8 |
1 |
0.3 |
|
8 |
1 |
0.4 |
0 |
0.0 |
8 |
1 |
0.3 |
1 |
0.3 |
|
10 |
3 |
1.2 |
2 |
1.2 |
9 |
1 |
0.3 |
|
|
|
12 |
1 |
0.4 |
0 |
0.0 |
10 |
2 |
0.5 |
3 |
0.8 |
|
11 |
|
|
1 |
0.6 |
11 |
2 |
0.5 |
|
|
|
18 |
|
|
5 |
3.1 |
12 |
2 |
0.5 |
1 |
0.3 |
|
Number of Responses (excluding companies with 0 awards) |
256 |
|
162 |
|
14 |
1 |
0.3 |
|
|
|
Number of Surveyed Companies |
768 |
|
496 |
|
17 |
1 |
0.3 |
|
|
|
|
|
|
|
|
20 |
1 |
0.3 |
|
|
|
|
|
|
|
|
24 |
1 |
0.3 |
|
|
|
|
|
|
|
|
Total |
399 |
100.0 |
399 |
100.0 |
|
SOURCE: National Institutes of Health, National Survey to Evaluate the NIH SBIR Program: Final Report, July 2003; NRC Phase II Survey. |
|||||||||
TABLE App-A-35 NIH—Related Phase II Awards
|
Q5. Other related SBIR awards |
Q5. Text: |
||
|
|
Number of Responses |
Percent |
Has the company won any other SBIR Phase I or Phase II awards, in addition to the referenced award, for products, processes, or services that are related to this project? |
|
Yes |
399 |
52.0 |
|
|
No |
325 |
42.3 |
|
|
Other |
44 |
5.7 |
|
|
|
768 |
100.0 |
|
|
Q6. How many related Phase I awards? |
Q6. Text: |
||
|
Number of Awards |
Number of Companies |
Percent |
How many SBIR Phase I awards, that involve products, processes, or services related to the project supported by the SBIR award referenced earlier, has the company won? |
|
0 |
2 |
0.5 |
|
|
1 |
156 |
39.1 |
|
|
2 |
106 |
26.6 |
|
|
3 |
68 |
17.0 |
|
|
4 |
19 |
4.8 |
|
|
5 |
20 |
5.0 |
|
|
6 |
13 |
3.3 |
|
|
7 |
3 |
0.8 |
|
|
8 |
1 |
0.3 |
|
|
9 |
1 |
0.3 |
|
|
10 |
2 |
0.5 |
|
|
11 |
2 |
0.5 |
|
|
12 |
2 |
0.5 |
|
|
14 |
1 |
0.3 |
|
|
17 |
1 |
0.3 |
|
|
20 |
1 |
0.3 |
|
|
24 |
1 |
0.3 |
|
|
Total |
399 |
100.0 |
|
|
Q7. How Many Related Phase II Awards? |
Q7. Text: |
||||
|
Number of Awards |
NIH Survey |
NRC Survey |
How many other SBIR Phase II awards, that involve products, processes, or services related to the project supported by the SBIR award referenced earlier, has the company won? |
||
|
Number of Companies |
Percent |
Number of Companies |
Percent |
||
|
0 |
512 |
66.7 |
334 |
67.3 |
|
|
1 |
152 |
19.8 |
92 |
18.5 |
|
|
2 |
65 |
8.5 |
30 |
6.0 |
|
|
3 |
19 |
2.5 |
11 |
2.2 |
|
|
4 |
8 |
1.0 |
8 |
1.6 |
|
|
5 |
4 |
0.5 |
12 |
2.4 |
|
|
6 |
2 |
0.3 |
0 |
0.0 |
|
|
7 |
1 |
0.1 |
1 |
0.2 |
|
|
8 |
1 |
0.1 |
0 |
0.0 |
|
|
10 |
3 |
0.4 |
2 |
0.4 |
|
|
12 |
1 |
0.1 |
0 |
0.0 |
|
|
11 |
|
|
1 |
0.2 |
|
|
18 |
|
|
5 |
1.0 |
|
|
Total (excluding 0 awards) |
256 |
|
162 |
|
|
|
Total |
768 |
|
496 |
|
|
|
Number of Awards |
Related Phase I Awards |
Related Phase II Awards |
|
||
|
Number of Companies |
Percent |
Number of Companies |
Percent |
|
|
|
0 |
2 |
0.5 |
143 |
35.8 |
|
|
1 |
156 |
39.1 |
152 |
38.1 |
|
|
2 |
106 |
26.6 |
65 |
16.3 |
|
|
3 |
68 |
17.0 |
19 |
4.8 |
|
|
4 |
19 |
4.8 |
8 |
2.0 |
|
|
5 |
20 |
5.0 |
4 |
1.0 |
|
|
6 |
13 |
3.3 |
2 |
0.5 |
|
|
7 |
3 |
0.8 |
1 |
0.3 |
|
|
8 |
1 |
0.3 |
1 |
0.3 |
|
|
9 |
1 |
0.3 |
|
|
|
|
10 |
2 |
0.5 |
3 |
0.8 |
|
|
11 |
2 |
0.5 |
|
|
|
|
12 |
2 |
0.5 |
1 |
0.3 |
|
|
14 |
1 |
0.3 |
|
|
|
|
17 |
1 |
0.3 |
|
|
|
|
20 |
1 |
0.3 |
|
|
|
|
24 |
1 |
0.3 |
|
|
|
|
Total |
399 |
100.0 |
399 |
100.0 |
|
|
Total |
399 |
100.0 |
399 |
100.0 |
|
|
SOURCE: National Institutes of Health, National Survey to Evaluate the NIH SBIR Program: Final Report, July 2003. |
|||||
TABLE App-A-36 Impact of SBIR Award on Company Growth
|
Percent of company growth attributed to SBIR |
||
|
|
Number of Responses |
Percent |
|
Less than 25% |
132 |
29.5 |
|
25% to 50% |
100 |
22.4 |
|
51% to 75% |
78 |
17.4 |
|
More than 75% |
137 |
30.6 |
|
Total |
447 |
100.0 |
|
SOURCE: NRC Firm Survey. |
||
TABLE App-A-37 Company Formation
|
Company was formed wholly or in part because of the SBIR award |
Number of Responses |
Percent |
Number of founders with academic background |
Number of Responses |
Percent |
|
No |
342 |
74.8 |
0 |
86 |
|
|
Yes |
49 |
10.7 |
1 |
214 |
|
|
Yes, in part |
66 |
14.4 |
2 |
106 |
|
|
|
457 |
100.0 |
3 |
33 |
|
|
|
|
|
4 |
11 |
|
|
|
|
|
5 |
3 |
|
|
|
|
|
7 |
2 |
|
|
|
|
|
|
369 |
|
|
|
|
|
None |
86 |
18.9 |
|
|
|
|
At least one |
369 |
81.1 |
|
All |
455 |
100.0 |
|||
|
SOURCE: NRC Firm Survey. |
|||||
TABLE App-A-38 Project Impacts
|
Q3YN. Project go without award? |
Q3YN. Text: |
||||
|
|
Number of Responses |
Percent |
|
|
If the SBIR program were not available, would the project funded by the referenced award still have been pursued? |
|
Project go without award |
114 |
14.9 |
|
|
|
|
Project no go without award |
489 |
63.8 |
|
|
|
|
Not Applicable |
164 |
21.4 |
|
|
|
|
Total |
767 |
100.0 |
|
|
|
|
NIH—Project impacts |
|
||||
|
Q8. How important was the SBIR funding to the project? |
Q8. Text: |
||||
|
|
Number of Responses |
Percent |
|
|
How important overall has SBIR support been, or how important will it be, in research and development of this product, process, or service? |
|
Very important |
668 |
87.4 |
|
|
|
|
Important |
82 |
10.7 |
|
|
|
|
Somewhat important |
13 |
1.7 |
|
|
|
|
Not important |
1 |
0.1 |
|
|
|
|
Not very important |
0 |
0.0 |
|
|
|
|
Total |
764 |
100.0 |
|
|
|
|
NIH—Project impacts |
|
||||
|
Q9. Specific impacts |
Q9. Text: |
||||
|
|
Missing |
Yes |
No |
Not Applicable |
Did the granting of one or more SBIR awards for this product, process, or service have an impact on any of the following activities? |
|
Pursuing high-risk ideas |
9 |
667 |
42 |
50 |
|
|
Hiring additional personnel |
13 |
616 |
107 |
32 |
|
|
Raising additional capital |
23 |
341 |
305 |
99 |
|
|
Credibility or visibility for finding partners |
18 |
541 |
128 |
81 |
|
|
SOURCE: National Institutes of Health, National Survey to Evaluate the NIH SBIR Program: Final Report, July 2003. |
|||||
TABLE App-A-39 FDA Approval
|
Q11. FDA review required? |
Q11. Text: |
||||
|
|
Number of Responses |
Percent |
Was or is FDA approval required for the product, process, or service selected above? |
||
|
Yes |
324 |
42.2 |
|
|
|
|
No |
444 |
57.8 |
|
|
|
|
|
768 |
100.0 |
|
|
|
|
Q12. Submitted to FDA? |
Q12. Text: |
||||
|
|
Number of Responses |
Percent |
Has this product, process, or service been submitted for FDA review? |
||
|
Yes |
90 |
27.8 |
|
|
|
|
No |
234 |
72.2 |
|
|
|
|
|
324 |
100.0 |
|
|
|
|
Q13. Stage of Review |
Q13. Text: |
||||
|
|
Number of Responses |
Percent |
In what stage of the FDA approval process is this product, process, or service? |
||
|
Applied for approval |
8 |
8.9 |
|
|
|
|
Review ongoing |
13 |
14.4 |
|
|
|
|
Approved |
48 |
53.3 |
|
|
|
|
Not approved |
2 |
2.2 |
|
|
|
|
IND; Clinical trials |
11 |
12.2 |
|
|
|
|
Other |
7 |
7.8 |
|
|
|
|
MISSING |
1 |
1.1 |
|
|
|
|
Total |
90 |
100.0 |
|
|
|
|
Business Type |
|
FDA Approval Required (#) |
All Respondents (#) |
Percent |
|
|
Pharmaceuticals |
|
47 |
58 |
81.0 |
|
|
Medical devices |
|
102 |
145 |
70.3 |
|
|
Biotechnology |
|
87 |
175 |
49.7 |
|
|
Diagnostics |
|
21 |
43 |
48.8 |
|
|
All Respondents |
|
323 |
767 |
42.1 |
|
|
Other |
|
5 |
12 |
41.7 |
|
|
Instrumentation |
|
31 |
88 |
35.2 |
|
|
Chemical technology |
|
6 |
20 |
30.0 |
|
|
Health care |
|
5 |
21 |
23.8 |
|
|
Computer hardware, software |
|
14 |
85 |
16.5 |
|
|
Engineering, fabrication |
|
2 |
17 |
11.8 |
|
|
Environment, ergonomics |
|
1 |
13 |
7.7 |
|
|
Information & research |
|
1 |
25 |
4.0 |
|
|
Medical education, health promotion |
|
1 |
65 |
1.5 |
|
|
SOURCE: National Institutes of Health, National Survey to Evaluate the NIH SBIR Program: Final Report, July 2003. |
|||||
TABLE App-A-40 Project Focus
|
Q15B. Project focus: |
Q15B. Text: |
||
|
|
Number of Responses |
Percent |
Select the single category that is the most important medical, societal, or technological outcome. |
|
Preventing disease or disability |
84 |
10.9 |
|
|
Detecting disease or disability |
82 |
10.7 |
|
|
Diagnosing disease or disability |
66 |
8.6 |
|
|
Treating disease or disability |
236 |
30.7 |
|
|
Reducing the cost of medical care |
34 |
4.4 |
|
|
Developing information for healthcare professionals |
41 |
5.3 |
|
|
Developing health information for the general public |
28 |
3.6 |
|
|
Fostering new research collaborations |
3 |
0.4 |
|
|
Improving research tools |
146 |
19.0 |
|
|
Other |
7 |
0.9 |
|
|
Training research investigators |
1 |
0.1 |
|
|
Improving quality of technology, products |
7 |
0.9 |
|
|
Improving quality of life for general public |
16 |
2.1 |
|
|
Missing data |
17 |
2.2 |
|
|
Total |
768 |
100.0 |
|
|
Q16B. Population focus |
Q16B. Text: |
||
|
|
Number of Responses |
Percent |
Select the single population that is the most important population. |
|
Outpatients |
121 |
15.8 |
|
|
Inpatients |
73 |
9.5 |
|
|
Hospital personnel |
32 |
4.2 |
|
|
Research labs |
150 |
19.5 |
|
|
Diagnostic labs |
47 |
6.1 |
|
|
Medical practitioners |
92 |
12.0 |
|
|
Homecare providers |
4 |
0.5 |
|
|
Emergency medical services |
4 |
0.5 |
|
|
Military medical services |
|
0.0 |
|
|
Other |
5 |
0.7 |
|
|
Other health services |
23 |
3.0 |
|
|
General public |
104 |
13.5 |
|
|
Educators |
13 |
1.7 |
|
|
Worksites |
3 |
0.4 |
|
|
Schools, universities |
29 |
3.8 |
|
|
Police, fire, other municipal workers |
4 |
0.5 |
|
|
Other companies, other technologies |
37 |
4.8 |
|
|
Health researchers |
7 |
0.9 |
|
|
MISSING |
20 |
2.6 |
|
|
Total |
768 |
100.0 |
|
|
Q17. Projected size of benefiting populations |
Q17. Text: |
||
|
|
Number of Responses |
Percent |
Within the next few years, what is the anticipated size of the total target populations that would benefit from or use the product, process, or service being developed under this project? |
|
Under 10,000 persons |
142 |
18.5 |
|
|
10,000-49,999 |
81 |
10.5 |
|
|
50,000-199,999 |
74 |
9.6 |
|
|
200,000-499,999 |
59 |
7.7 |
|
|
500,000 or more |
242 |
31.5 |
|
|
Not sure |
164 |
21.4 |
|
|
MISSING |
6 |
0.8 |
|
|
768 |
100.0 |
||
|
SOURCE: National Institutes of Health, National Survey to Evaluate the NIH SBIR Program: Final Report, July 2003. |
|||
TABLE App-A-41 Sales by Source of Data
|
|
NH |
DOD |
NRC |
|||
|
Number of Responses |
Percent |
Number of Responses |
Percent |
Number of Responses |
Percent |
|
|
>$0 and <$1M |
140 |
68.3 |
179 |
86.1 |
147 |
72.8 |
|
$1M-<$5M |
42 |
20.5 |
22 |
10.6 |
39 |
19.3 |
|
$5M-<$50M |
22 |
10.7 |
6 |
2.9 |
15 |
7.4 |
|
$50M + |
1 |
0.5 |
1 |
0.5 |
1 |
0.5 |
|
Sales >$0 |
205 |
30.3 |
208 |
31.6 |
202 |
40.7 |
|
No sales yet |
472 |
69.7 |
450 |
68.4 |
294 |
59.3 |
|
Total responses |
677 |
|
658 |
|
496 |
|
|
Detailed Sales Responses, 3 data sources |
||||||
|
|
NIH |
|
DoD |
|
NRC |
|
|
<$50K |
35 |
|
54 |
|
44 |
|
|
$50-<$100K |
19 |
|
32 |
|
13 |
|
|
$100K-<500K |
59 |
|
68 |
|
51 |
|
|
$500K-<$1M |
27 |
|
25 |
|
19 |
|
|
$1M-<$5M |
42 |
|
22 |
|
29 |
|
|
$5M-<$50M |
22 |
|
6 |
|
12 |
|
|
$50M + |
1 |
|
1 |
|
1 |
|
|
Total |
205 |
|
208 |
|
169 |
|
|
SOURCE: National Institutes of Health, National Survey to Evaluate the NIH SBIR Program: Final Report, July 2003; DoD Commercialization Database; and NRC Phase II Survey. |
||||||
TABLE App-A-42 Sales-related Data
|
NIH—Sales |
|
|||
|
Q21. Expectations of sales |
Q21. Text: |
|||
|
|
Number of Responses |
Percent |
Upon completion of the project, were (or are) sales expected? (Include both sales and sales of licenses.) |
|
|
Yes |
576 |
85.1 |
|
|
|
No |
101 |
14.9 |
|
|
|
|
677 |
100 |
|
|
|
Q22. Sales Results |
Q22. Text: |
|||
|
|
Number of Responses |
Percent |
With regard to sales, which of the following resulted? |
|
|
Sales were realized |
224 |
39.2 |
|
|
|
Sales are anticipated |
340 |
59.4 |
|
|
|
No sales |
8 |
1.4 |
|
|
|
|
572 |
100 |
|
|
|
Q23. Dollar ranges for cumulative sales |
Q23. Text: |
|||
|
|
Number of Responses |
Percent |
What is the dollar range of cumulative sales related to the product, process, or service developed under this project? |
|
|
$50,000 or less |
35 |
|
|
|
|
$50,000-$99,999 |
19 |
|
|
|
|
$100,000-$499,999 |
59 |
|
|
|
|
$500,000-$999,999 |
27 |
|
|
|
|
$1M to <$5M |
42 |
|
|
|
|
$5M to <$50M |
22 |
|
|
|
|
$50M + |
1 |
|
|
|
|
|
205 |
|
|
|
|
Results for those with no sales to date, but expecting sales |
More than $0 sales, 3 data sources |
|||
|
|
Number of Responses |
Percent |
Source |
Percent |
|
None expected |
101 |
13.4 |
NRC |
40.7 |
|
Sales expected |
445 |
59.3 |
NIH |
30.3 |
|
Sales, <$1M |
140 |
18.6 |
DoD |
31.6 |
|
Sales, $1-5M |
42 |
5.6 |
|
|
|
Sales, $5-50M |
22 |
2.9 |
|
|
|
Sales >$50M |
1 |
0.1 |
|
|
|
|
751 |
100 |
|
|
|
Yes sales, yes licensing agreement |
||
|
Dollar Range of Sales |
Number of Responses |
Percent |
|
$50,000 or less |
11 |
15.1 |
|
$50,000-$99,999 |
4 |
5.5 |
|
$100,000-$499,999 |
25 |
34.2 |
|
$500,000-$999,999 |
10 |
13.7 |
|
$1,000,000-$4,999,999 |
13 |
17.8 |
|
$5,000,000-$49,999,999 |
10 |
13.7 |
|
73 |
100.0 |
|
|
SOURCE: National Institutes of Health, National Survey to Evaluate the NIH SBIR Program: Final Report, July 2003; DOD Commercialization Database; and NRC Phase II Survey. |
||
TABLE App-A-43 Sales by Number of Employees
|
Number of Employees |
Number of Responses |
Grand Total |
Percentage |
|||
|
<$1M |
$1M-<$5M |
$5M-<$50M |
$50M+ |
|||
|
Other |
19 |
6 |
2 |
|
29 |
12.9 |
|
0-5 |
54 |
6 |
|
|
70 |
31.3 |
|
6-10 |
20 |
6 |
2 |
|
30 |
13.4 |
|
11-15 |
18 |
10 |
2 |
|
30 |
13.4 |
|
16-20 |
6 |
2 |
3 |
|
13 |
5.8 |
|
21-25 |
2 |
2 |
1 |
|
5 |
2.2 |
|
26-30 |
5 |
|
|
|
5 |
2.2 |
|
31-40 |
4 |
|
|
|
4 |
1.8 |
|
41-50 |
3 |
3 |
3 |
|
9 |
4.0 |
|
51-75 |
1 |
2 |
|
|
5 |
2.2 |
|
101-200 |
5 |
1 |
4 |
1 |
11 |
4.9 |
|
201-300 |
|
1 |
4 |
|
6 |
2.7 |
|
301-500 |
1 |
2 |
|
|
3 |
1.3 |
|
500 plus |
2 |
1 |
1 |
|
4 |
1.8 |
|
Grand Total |
140 |
42 |
22 |
1 |
224 |
100.0 |
|
Percentage |
62.5 |
18.8 |
9.8 |
0.4 |
100.0 |
|
|
SOURCE: National Institutes of Health, National Survey to Evaluate the NIH SBIR Program: Final Report, July 2003. |
||||||
TABLE App-A-44 Employment Patterns
|
Q CQ24. Current number of employees |
Q CQ24. Text: |
|||||
|
|
NIH Groupings |
NRC Regroupings |
What is the current number of total employees (full-time equivalents) in your company? |
|||
|
Number of Responses |
Percent |
|
Number of Responses |
Percent |
||
|
5 or Fewer |
102 |
13.6 |
0-5 |
259 |
34.4 |
|
|
6-10 |
106 |
14.1 |
6-10 |
124 |
16.5 |
|
|
11-15 |
86 |
11.5 |
11-15 |
67 |
8.9 |
|
|
16-20 |
89 |
11.9 |
16-20 |
45 |
6.0 |
|
|
21-25 |
112 |
14.9 |
21-25 |
35 |
4.7 |
|
|
26-30 |
73 |
9.7 |
26-30 |
22 |
2.9 |
|
|
31-50 |
90 |
12.0 |
31-40 |
31 |
4.1 |
|
|
51-75 |
93 |
12.4 |
41-50 |
19 |
2.5 |
|
|
76-100 |
|
0.0 |
51-75 |
31 |
4.1 |
|
|
101-250 |
|
0.0 |
76-100 |
20 |
2.7 |
|
|
251-500 |
|
0.0 |
101-200 |
37 |
4.9 |
|
|
500 or More |
|
0.0 |
201-300 |
26 |
3.5 |
|
|
MISSING |
|
0.0 |
301-500 |
14 |
1.9 |
|
|
|
751 |
100.0 |
>500 |
22 |
2.9 |
|
|
|
|
|
|
752 |
100.0 |
|
|
emp-adjusted |
emp-adj.# responses |
Percent of responses |
|
emp_adj total employees |
Percent of all employees |
Percent of all employees at .rms <500 employees |
|
|
0 |
|
|
−17 |
|
|
|
0-5 |
259 |
34.5 |
|
783 |
1.0 |
2.7 |
|
6-10 |
124 |
16.5 |
|
972 |
1.3 |
3.4 |
|
11-15 |
67 |
8.9 |
|
842 |
1.1 |
2.9 |
|
16-20 |
45 |
6.0 |
|
804 |
1.0 |
2.8 |
|
21-25 |
35 |
4.7 |
|
836 |
1.1 |
2.9 |
|
26-30 |
22 |
2.9 |
|
628 |
0.8 |
2.2 |
|
31-40 |
31 |
4.1 |
|
1,131 |
1.5 |
4.0 |
|
41-50 |
18 |
2.4 |
|
852 |
1.1 |
3.0 |
|
51-75 |
31 |
4.1 |
|
1,922 |
2.5 |
6.7 |
|
76-100 |
20 |
2.7 |
|
1,859 |
2.4 |
6.5 |
|
101-200 |
37 |
4.9 |
|
5,534 |
7.2 |
19.4 |
|
201-300 |
26 |
3.5 |
|
6,589 |
8.6 |
23.1 |
|
301-500 |
14 |
1.9 |
|
5,825 |
7.6 |
20.4 |
|
More than 500 |
22 |
2.9 |
|
48,281 |
62.8 |
|
|
|
751 |
100.0 |
|
76,858 |
100.0 |
|
|
SOURCE: National Institutes of Health, National Survey to Evaluate the NIH SBIR Program: Final Report, July 2003. |
||||||
TABLE App-A-45 Sales by Industry Sector
|
Industry |
Number of Sales by Industry, By Size |
Grand Total |
|||||||
|
MISSING |
<$50K |
>$50K-<$100K |
$100K-<$500K |
$500K-<$1M |
$1M-<$5M |
$5M-<$50M |
$50M+ |
||
|
Biotechnology |
3 |
8 |
2 |
11 |
5 |
7 |
6 |
|
42 |
|
Chemical technology |
1 |
1 |
2 |
3 |
2 |
1 |
1 |
|
11 |
|
Computer hardware, software |
2 |
7 |
4 |
8 |
2 |
11 |
|
|
34 |
|
Diagnostics |
|
1 |
1 |
4 |
|
1 |
1 |
|
8 |
|
Environment, ergonomics |
1 |
1 |
|
4 |
|
|
|
|
6 |
|
Healthcare |
1 |
|
2 |
1 |
1 |
|
3 |
|
8 |
|
Information and research |
|
|
2 |
|
1 |
|
4 |
|
7 |
|
Instrumentation |
1 |
|
2 |
17 |
3 |
7 |
3 |
|
3 3 |
|
Medical devices |
6 |
6 |
2 |
4 |
9 |
11 |
4 |
1 |
43 |
|
Medical education, health promotion |
4 |
11 |
2 |
6 |
3 |
1 |
|
|
27 |
|
Other |
|
|
|
1 |
1 |
|
|
|
2 |
|
Pharmaceuticals |
|
|
|
|
|
3 |
|
|
3 |
|
Grand Total |
19 |
35 |
19 |
59 |
27 |
42 |
22 |
1 |
224 |
|
Industry |
Percentage of Respondents with Sales, By Industry |
Grand Total |
|||||||
|
MISSING |
<$50K |
>$50K-<$100K |
$100K-<$500K |
$500K-<$1M |
$1M-<$5M |
$5M-<$50M |
$50M+ |
||
|
Biotechnology |
7.1 |
19.0 |
4.8 |
26.2 |
11.9 |
16.7 |
14.3 |
0.0 |
100 |
|
Chemical technology |
9.1 |
9.1 |
18.2 |
27.3 |
18.2 |
9.1 |
9.1 |
0.0 |
100 |
|
Computer hardw are, software |
5.9 |
20.6 |
11.8 |
23.5 |
5.9 |
32.4 |
0.0 |
0.0 |
100 |
|
Diagnostics |
0.0 |
12.5 |
12.5 |
50.0 |
0.0 |
12.5 |
12.5 |
0.0 |
100 |
|
Environment, ergonomics |
16.7 |
16.7 |
0.0 |
66.7 |
0.0 |
0.0 |
0.0 |
0.0 |
100 |
|
Healthcare |
12.5 |
0.0 |
25.0 |
12.5 |
12.5 |
0.0 |
37.5 |
0.0 |
100 |
|
Information and research |
0.0 |
0.0 |
28.6 |
0.0 |
14.3 |
0.0 |
57.1 |
0.0 |
100 |
|
Instrumentation |
3.0 |
0.0 |
6.1 |
51.5 |
9.1 |
21.2 |
9.1 |
0.0 |
100 |
|
Medical devices |
14.0 |
14.0 |
4.7 |
9.3 |
20.9 |
25.6 |
9.3 |
2.3 |
100 |
|
Medical education, health promotion |
|
|
14.8 |
|
40.7 |
7.4 |
|
22.2 |
|
11.1 |
|
3.7 |
0.0 |
0.0 |
100 |
|
Other |
|
|
0.0 |
|
0.0 |
0.0 |
|
50.0 |
|
50.0 |
|
0.0 |
0.0 |
0.0 |
100 |
|
Pharmaceuticals |
|
|
0.0 |
|
0.0 |
0.0 |
|
0.0 |
|
0.0 |
|
100.0 |
0.0 |
0.0 |
100 |
|
Grand Total |
|
|
8.5 |
|
15.6 |
8.5 |
|
26.3 |
|
12.1 |
|
18.8 |
9.8 |
0.4 |
100 |
|
Industry |
Estimated Revenues by Industry, By Size |
Total Revenues by Industry ($) |
Average Revenues Respondents with Sales ($) |
Average Revenues, All |
|||||||||||
|
<$50K |
>$50K-<$100K |
$100K-<$500K |
$500K-<$1M |
$1M-<$5M |
$5M-<$50M |
$50M+ |
|||||||||
|
Biotechnology |
200,000 |
150,000 |
2,750,000 |
3,750,000 |
17,500,000 |
165,000,000 |
0 |
189,350,000 |
4,508,333 |
1,082,000 |
|||||
|
Chemical technology |
25,000 |
150,000 |
750,000 |
1,500,000 |
2,500,000 |
27,500,000 |
0 |
32,425,000 |
2,947,727 |
1,621,250 |
|||||
|
Computer hardware, software |
175,000 |
300,000 |
2,000,000 |
1,500,000 |
27,500,000 |
0 |
0 |
31,475,000 |
925,735 |
370,294 |
|||||
|
Diagnostics |
25,000 |
75,000 |
1,000,000 |
0 |
2,500,000 |
27,500,000 |
0 |
31,100,000 |
3,887,500 |
723,256 |
|||||
|
Environment, ergonomics |
25,000 |
0 |
1,000,000 |
0 |
0 |
0 |
0 |
1,025,000 |
170,833 |
78,846 |
|||||
|
Healthcare |
0 |
150,000 |
250,000 |
750,000 |
0 |
82,500,000 |
0 |
83,650,000 |
10,456,250 |
3,983,333 |
|||||
|
Information & research |
0 |
150,000 |
0 |
750,000 |
0 |
110,000,000 |
0 |
110,900,000 |
15,842,857 |
4,436,000 |
|||||
|
Instrumentation |
0 |
150,000 |
4,250,000 |
2,250,000 |
17,500,000 |
82,500,000 |
0 |
106,650,000 |
3,231,818 |
1,211,932 |
|||||
|
Medical devices |
150,000 |
150,000 |
1,000,000 |
6,750,000 |
27,500,000 |
110,000,000 |
100,000,000 |
245,550,000 |
5,710,465 |
1,693,448 |
|||||
|
Medical education, health promotion |
275,000 |
150,000 |
1,500,000 |
2,250,000 |
2,500,000 |
0 |
0 |
6,675,000 |
247,222 |
102,692 |
|||||
|
Other |
0 |
0 |
250,000 |
750,000 |
0 |
0 |
0 |
1,000,000 |
500,000 |
83,333 |
|||||
|
Pharmaceuticals |
0 |
0 |
0 |
0 |
7,500,000 |
0 |
0 |
7,500,000 |
2,500,000 |
625,000 |
|||||
|
All |
875,000 |
1,425,000 |
14,750,000 |
20,250,000 |
105,000,000 |
605,000,000 |
100,000,000 |
847,300,000 |
3,782,589 |
1,129,733 |
|||||
|
Industry |
Percentage of Revenues, By Industry, By Size |
Total Revenues by Industry |
||||||
|
<$50K |
>$50K-<$100K |
$100K-<$500K |
$500-<$1M |
$1M-<$5M |
$5M-<$50M |
$50M+ |
||
|
Biotechnology |
0.1 |
0.1 |
1.5 |
2.0 |
9.2 |
87.1 |
0.0 |
100 |
|
Chemical technology |
0.1 |
0.5 |
2.3 |
4.6 |
7.7 |
84.8 |
0.0 |
100 |
|
Computer hardware, software |
0.6 |
1.0 |
6.4 |
4.8 |
87.4 |
0.0 |
0.0 |
100 |
|
Diagnostics |
0.1 |
0.2 |
3.2 |
0.0 |
8.0 |
88.4 |
0.0 |
100 |
|
Environment, ergonomics |
2.4 |
0.0 |
97.6 |
0.0 |
0.0 |
0.0 |
0.0 |
100 |
|
Healthcare |
0.0 |
0.2 |
0.3 |
0.9 |
0.0 |
98.6 |
0.0 |
100 |
|
Information & research |
0.0 |
0.1 |
0.0 |
0.7 |
0.0 |
99.2 |
0.0 |
100 |
|
Instrumentation |
0.0 |
0.1 |
4.0 |
2.1 |
16.4 |
77.4 |
0.0 |
100 |
|
Medical devices |
0.1 |
0.1 |
0.4 |
2.7 |
11.2 |
44.8 |
40.7 |
100 |
|
Medical education, health promotion |
4.1 |
2.2 |
22.5 |
33.7 |
37.5 |
0.0 |
0.0 |
100 |
|
Other |
0.0 |
0.0 |
25.0 |
75.0 |
0.0 |
0.0 |
0.0 |
100 |
|
Pharmaceuticals |
0.0 |
0.0 |
0.0 |
0.0 |
100.0 |
0.0 |
0.0 |
100 |
|
Grand Total |
0.1 |
0.2 |
1.7 |
2.4 |
12.4 |
71.4 |
11.8 |
100 |
|
SOURCE: National Institutes of Health, National Survey toEvaluate the NIH SBIR Program: Final Report, July 2003. |
||||||||
TABLE App-A-46 Sales by Company Size (employment)
|
Company Size |
Sum of Responses, By Sales Range |
Total Number of Companies |
Size Distribution (%) |
||||||
|
<$50K |
$50K-<$100K |
$100K-<$500K |
$500K-<$1M |
$1M-<$5M |
$5M-<50M |
$50M+ |
|||
|
0-5 |
21 |
3 |
23 |
7 |
6 |
|
|
60 |
34.4 |
|
6-10 |
3 |
5 |
10 |
2 |
6 |
2 |
|
28 |
16.5 |
|
11-15 |
3 |
2 |
6 |
7 |
10 |
2 |
|
30 |
8.9 |
|
16-20 |
3 |
2 |
6 |
3 |
4 |
2 |
|
20 |
6.0 |
|
21-25 |
1 |
|
3 |
2 |
2 |
3 |
|
11 |
4.7 |
|
26-30 |
|
1 |
1 |
|
2 |
1 |
|
5 |
2.9 |
|
31-40 |
|
2 |
2 |
1 |
|
|
|
5 |
4.1 |
|
41-50 |
2 |
|
2 |
|
|
|
|
4 |
2.5 |
|
51-75 |
|
1 |
1 |
1 |
3 |
3 |
|
9 |
4.1 |
|
76-100 |
|
|
1 |
|
2 |
|
|
3 |
2.7 |
|
101-200 |
|
2 |
1 |
2 |
1 |
4 |
1 |
11 |
4.9 |
|
201-300 |
|
|
|
|
1 |
4 |
|
5 |
3.5 |
|
301-500 |
|
|
|
1 |
2 |
|
|
3 |
1.9 |
|
>500 |
|
|
1 |
1 |
1 |
1 |
|
4 |
2.9 |
|
Total Companies |
33 |
18 |
57 |
27 |
40 |
22 |
1 |
198 |
100.0 |
|
Excludes companies reporting no sales. Excludes companies reporting zero sales or missing data. Excludes companies not reporting companies size. |
|||||||||
|
Number of Employees |
Total Number of Responses |
Distribution by Size |
Companies with Sales |
Distribution by Size |
Percent with Sales/Percent all Companies |
||||
|
0-5 |
259 |
|
34.4 |
|
60 |
30.3 |
88.0 |
|
|
|
6-10 |
124 |
|
16.5 |
|
28 |
|
14.1 |
85.8 |
|
|
11-15 |
67 |
|
8.9 |
|
30 |
|
15.2 |
170.1 |
|
|
16-20 |
45 |
|
6.0 |
|
20 |
|
10.1 |
168.8 |
|
|
21-25 |
35 |
|
4.7 |
|
11 |
|
5.6 |
119.4 |
|
|
26-30 |
22 |
|
2.9 |
|
5 |
|
2.5 |
86.3 |
|
|
31-40 |
31 |
|
4.1 |
|
5 |
|
2.5 |
61.3 |
|
|
41-50 |
19 |
|
2.5 |
|
4 |
|
2.0 |
80.0 |
|
|
51-75 |
31 |
|
4.1 |
|
9 |
|
4.5 |
110.3 |
|
|
76-100 |
20 |
|
2.7 |
|
3 |
|
1.5 |
57.0 |
|
|
101-200 |
37 |
|
4.9 |
|
11 |
|
5.6 |
112.9 |
|
|
201-300 |
26 |
|
3.5 |
|
5 |
|
2.5 |
73.0 |
|
|
301-500 |
14 |
|
1.9 |
|
3 |
|
1.5 |
81.4 |
|
|
>500 |
22 |
|
2.9 |
|
4 |
|
2.0 |
69.1 |
|
|
|
752 |
|
100 |
|
198 |
100 |
100.0 |
|
|
|
SOURCE: National Institutes of Health, National Survey to Evaluate the NIH SBIR Program: Final Report, July 2003. |
|||||||||
TABLE App-A-47 Other Company Effects
|
Q25. Received nonSBIR funding for project |
Q25. Text: |
||
|
|
Number of Responses |
Percent |
Has your company received any additional non-SBIR funding or capital for this project? |
|
Yes |
281 |
36.6 |
|
|
No |
487 |
63.4 |
|
|
|
768 |
100.0 |
|
|
Q27. Sources of project funding |
Q27. Text: |
||
|
|
Number of Responses |
Percent |
Thinking now about the sources of additional funding or capital for this project and its outcome (product, service, or process), were or are any of the following sources important? |
|
Non-SBIR federal funds |
95 |
10.7 |
|
|
Your own company |
229 |
25.8 |
|
|
Other private company |
131 |
14.8 |
|
|
U.S. venture capital |
66 |
7.4 |
|
|
Foreign venture capital |
22 |
2.5 |
|
|
Private individual investor |
107 |
12.1 |
|
|
Personal funds |
124 |
14.0 |
|
|
State or local government funds |
63 |
7.1 |
|
|
College or university |
36 |
4.1 |
|
|
Other |
6 |
0.7 |
|
|
Foundations |
8 |
0.9 |
|
|
|
887 |
100.0 |
|
|
Q26. Validation effect of SBIR |
Q26. Text: |
||
|
|
Number of Responses |
Percent |
Do you believe that this additional funding or capital is a result of the NIH SBIR funding for the product, process, or service developed under this project? |
|
Yes |
214 |
78.4 |
|
|
No |
31 |
11.4 |
|
|
Not sure |
28 |
10.3 |
|
|
|
273 |
100.0 |
|
|
Q28. Most important source of project funding |
Q28. Text: |
||
|
|
Number of Responses |
Percent |
Which source has been or is the most important source of additional funding or capital? |
|
None |
487 |
x |
|
|
Non-SBIR federal funds |
19 |
6.8 |
|
|
Your own company |
85 |
30.6 |
|
|
Other private company |
61 |
21.9 |
|
|
U.S. venture capital |
22 |
7.9 |
|
|
Foreign venture capital |
3 |
1.1 |
|
|
Private individual investor |
37 |
13.3 |
|
|
Personal funds |
22 |
7.9 |
|
|
State or local government funds |
15 |
5.4 |
|
|
College or university |
5 |
1.8 |
|
|
Other |
5 |
1.8 |
|
|
Foundations |
4 |
1.4 |
|
|
|
278 |
100.0 |
|
|
SOURCE: National Institutes of Health, National Survey to Evaluate the NIH SBIR Program: Final Report, July 2003. |
|||
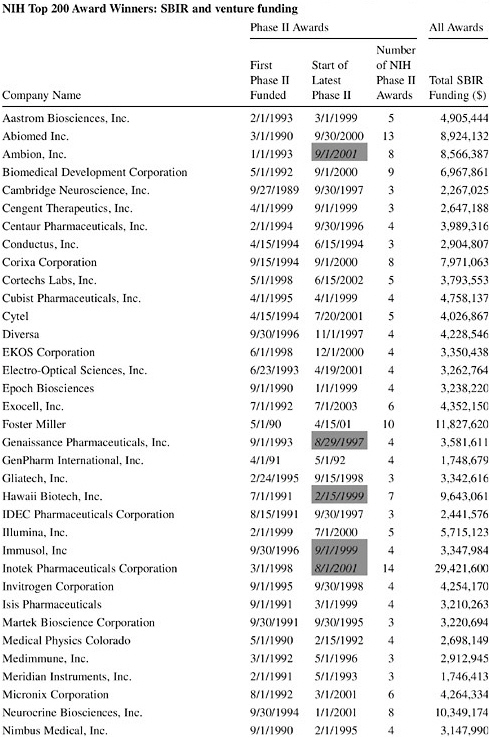
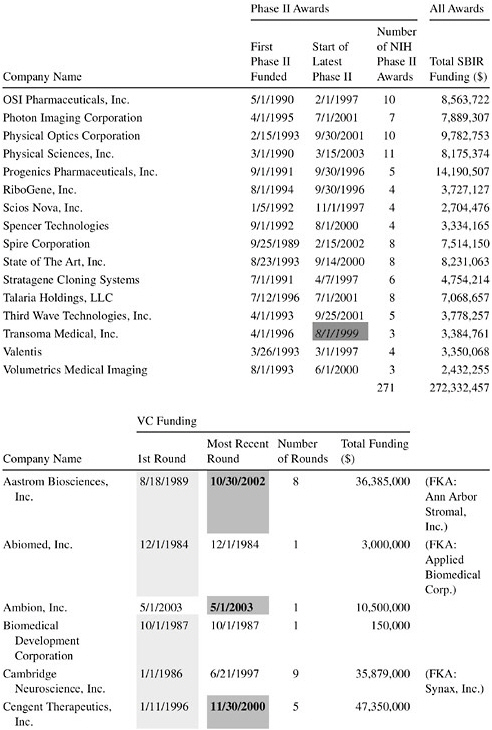
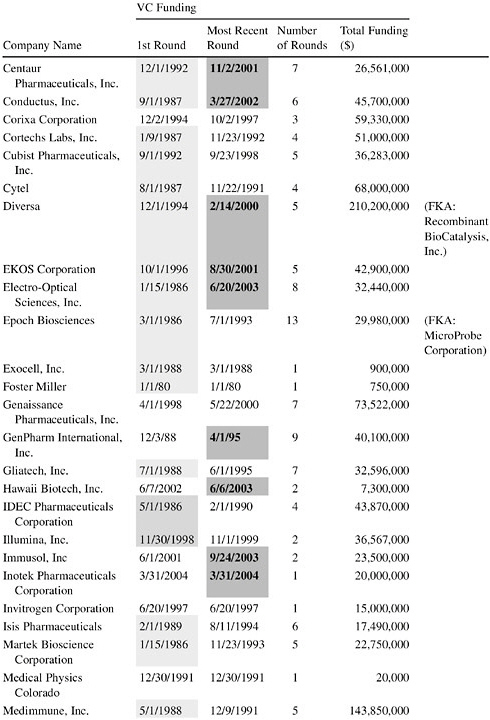
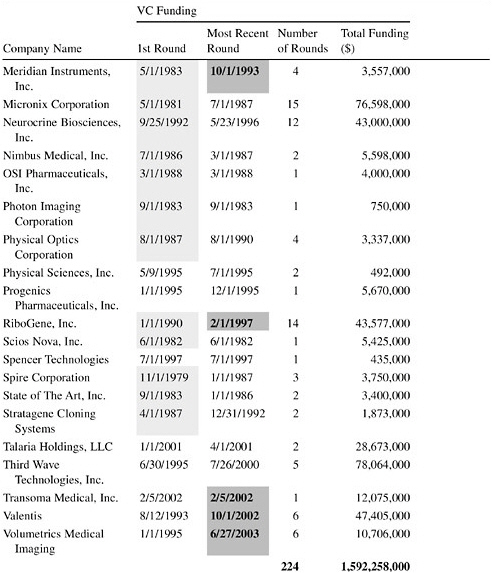
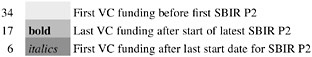
TABLE App-A-49 Knowledge Effects
|
Q32—Patents |
Percent |
Q32 Text: |
|
|
Number of Patents |
Number of Responses |
Number of Patents related to this project |
|
|
1 |
158 |
55.1 |
|
|
2 |
63 |
22.0 |
|
|
3-5 |
44 |
15.3 |
|
|
6-10 |
18 |
6.3 |
752 |
|
11-20 |
3 |
1.0 |
287 |
|
>21 |
1 |
0.3 |
|
|
|
287 |
100.0 |
|
|
Q32—Copyrights |
Percent |
Q32 Text: |
|
|
Number of Copyrights |
Number of Responses |
Number of copyrights related to this project |
|
|
1 |
86 |
57.7 |
|
|
2 |
17 |
11.4 |
|
|
3-5 |
33 |
22.1 |
|
|
6-10 |
9 |
6.0 |
|
|
11-20 |
3 |
2.0 |
|
|
>21 |
1 |
0.7 |
|
|
|
149 |
100.0 |
|
|
SOURCE: National Institutes of Health, National Survey to Evaluate the NIH SBIR Program: Final Report, July 2003. |
|||
TABLE App-A-50 Further Related Investments by Size of Investment
|
|
Number of Investments by Size of Investment |
Total Investment by Size of Investment ($) |
|
DoD data |
DoD data |
|
|
$50M+ |
1 |
77,000,000 |
|
$5M-<$50M |
3 |
32,329,122 |
|
$1M-<$5M |
36 |
80,492,819 |
|
<$1M |
180 |
38,637,715 |
|
None |
721 |
0 |
|
Total investments |
220 |
228,459,656 |
|
Percent of all respondents |
24.4 |
|
|
Average (all) |
|
253,562 |
|
Average (with investment) |
|
1,038,453 |
|
SOURCE: DoD Commercialization Database. |
||
TABLE App-A-51 Distribution of Sales Responses
|
Sales |
Number of Responses |
Percent |
|
<$50K |
54 |
26.0 |
|
$50K-<$100K |
32 |
15.4 |
|
$100K-<$500K |
68 |
32.7 |
|
$500K-<$1M |
25 |
12.0 |
|
$1M-<$5M |
22 |
10.6 |
|
$5M-<$50M |
6 |
2.9 |
|
$50M+ |
1 |
0.5 |
|
|
584 |
|
|
SOURCE: DoD Commercialization Database. |
||
TABLE App-A-52 Patents by Size of Company (employees)
|
Company Size |
Sum of Responses, By Number of Patents |
Total Responses |
Total Patents |
|||||||||||||
|
1 |
2 |
3 |
4 |
5 |
6 |
7 |
8 |
9 |
10 |
14 |
15 |
18 |
38 |
|||
|
0-5 |
60 |
25 |
8 |
6 |
1 |
|
|
|
1 |
|
|
|
|
|
101 |
172 |
|
6-10 |
25 |
12 |
8 |
2 |
|
|
1 |
|
|
|
|
1 |
|
|
49 |
103 |
|
11-15 |
15 |
3 |
1 |
|
|
1 |
1 |
|
|
1 |
|
|
|
|
22 |
47 |
|
16-20 |
6 |
3 |
2 |
2 |
1 |
1 |
|
|
|
2 |
|
|
|
|
17 |
57 |
|
21-25 |
6 |
4 |
1 |
|
|
|
|
|
|
|
|
|
|
|
11 |
17 |
|
26-30 |
6 |
|
|
|
|
|
|
|
|
|
1 |
|
|
|
7 |
20 |
|
31-40 |
3 |
1 |
|
1 |
|
|
1 |
|
|
|
|
|
|
|
6 |
16 |
|
41-50 |
6 |
3 |
1 |
|
|
|
|
|
|
|
|
|
|
|
10 |
15 |
|
51-75 |
5 |
1 |
|
1 |
|
|
|
|
|
|
|
|
|
|
7 |
11 |
|
101-200 |
9 |
2 |
3 |
|
|
|
|
2 |
|
|
|
|
1 |
1 |
18 |
94 |
|
201-300 |
5 |
2 |
2 |
|
|
1 |
1 |
|
|
1 |
|
|
|
|
12 |
38 |
|
301-500 |
|
1 |
|
|
1 |
|
|
|
|
|
|
|
|
|
2 |
7 |
|
500 plus |
1 |
1 |
1 |
|
1 |
|
|
1 |
|
|
|
|
|
|
5 |
19 |
|
Total responses |
147 |
58 |
27 |
12 |
4 |
3 |
4 |
3 |
1 |
4 |
1 |
1 |
1 |
1 |
267 |
616 |
|
Company Size |
All Companies (#) |
Number of Patenting Companies |
Number of Patents |
Patents per Company |
||||||||||||
|
0-5 |
|
259 |
|
|
|
|
101 |
|
|
|
|
|
172 |
|
|
0.7 |
|
6-10 |
|
124 |
|
|
|
|
49 |
|
|
|
|
|
103 |
|
|
0.8 |
|
11-15 |
|
67 |
|
|
|
|
22 |
|
|
|
|
|
47 |
|
|
0.7 |
|
16-20 |
|
35 |
|
|
|
|
17 |
|
|
|
|
|
57 |
|
|
1.6 |
|
21-25 |
|
22 |
|
|
|
|
11 |
|
|
|
|
|
17 |
|
|
0.8 |
|
26-30 |
|
31 |
|
|
|
|
7 |
|
|
|
|
|
20 |
|
|
0.6 |
|
31-40 |
|
19 |
|
|
|
|
6 |
|
|
|
|
|
16 |
|
|
0.8 |
|
41-50 |
|
31 |
|
|
|
|
10 |
|
|
|
|
|
15 |
|
|
0.5 |
|
51-75 |
|
20 |
|
|
|
|
7 |
|
|
|
|
|
11 |
|
|
0.6 |
|
101-200 |
|
37 |
|
|
|
|
18 |
|
|
|
|
|
94 |
|
|
2.5 |
|
201-300 |
|
26 |
|
|
|
|
12 |
|
|
|
|
|
38 |
|
|
1.5 |
|
301-500 |
|
14 |
|
|
|
|
2 |
|
|
|
|
|
7 |
|
|
0.5 |
|
500 plus |
|
22 |
|
|
|
|
5 |
|
|
|
|
|
19 |
|
|
0.9 |
|
All |
|
707 |
|
|
|
|
267 |
|
|
|
|
|
616 |
|
|
0.9 |
|
NOTE: Company = Award in this case. SOURCE: National Institutes of Health, National Survey to Evaluate the NIH SBIR Program: Final Report, July 2003 |
||||||||||||||||
TABLE App-A-53 Customer Satisfaction Survey
|
|
Number of Responses |
||||||
|
Completely Satisfied |
Mostly Satisfied |
Mixed |
Mostly Dissatisfied |
Completely Dissatisfied |
Not Applicable |
Total Responses |
|
|
Obtaining information |
446 |
268 |
37 |
2 |
|
6 |
759 |
|
Instructions |
368 |
305 |
69 |
8 |
2 |
6 |
758 |
|
Review process |
240 |
320 |
159 |
31 |
5 |
4 |
759 |
|
Award process |
316 |
319 |
91 |
18 |
7 |
5 |
756 |
|
Post-award admin |
377 |
269 |
75 |
19 |
5 |
11 |
756 |
|
Staff helpfulness |
|
|
missing data |
|
|
|
|
|
Business support |
|
|
missing data |
|
|
|
|
|
Other |
|
|
missing data |
|
|
|
|
|
|
Percentage of Total Responses |
||||||
|
Completely Satisfied |
Mostly Satisfied |
Mixed |
Mostly Dissatisfied |
Completely Dissatisfied |
Not Applicable |
Total Responses |
|
|
Obtaining information |
58.8 |
35.3 |
4.9 |
0.3 |
0.0 |
0.8 |
100.0 |
|
Instructions |
48.5 |
40.2 |
9.1 |
1.1 |
0.3 |
0.8 |
100.0 |
|
Review process |
31.6 |
42.2 |
20.9 |
4.1 |
0.7 |
0.5 |
100.0 |
|
Award process |
41.8 |
42.2 |
12.0 |
2.4 |
0.9 |
0.7 |
100.0 |
|
Post-award admin |
49.9 |
35.6 |
9.9 |
2.5 |
0.7 |
1.5 |
100.0 |
|
Staff helpfulness |
|
|
missing data |
|
|
|
|
|
Business support |
|
|
missing data |
|
|
|
|
|
Other |
|
|
missing data |
|
|
|
|
|
SOURCE: National Institutes of Health, National Survey to Evaluate the NIH SBIR Program: Final Report, July 2003. |
|||||||
TABLE App-A-54 FDA Approval
|
Approval Stage |
Percent of Responding Projects which Require FDA Approval |
|
Applied for approval |
5.0 |
|
Review ongoing |
3.0 |
|
Approved |
38.5 |
|
Not Approved |
6.5 |
|
IND: Clinical trials |
16.0 |
|
Other |
32.0 |
|
SOURCE: NRC Phase II Survey. |
|
TABLE App-A-55 Sales by Dependence on SBIR
|
Firm Revenues |
Percent of Firm Revenues that Come from SBIR (Number of responses in each percent range) |
||||||
|
0 |
1-10% |
11-25% |
26-50% |
51-75% |
76-100% |
Total Responses |
|
|
0 |
31 |
41 |
2 |
2 |
2 |
14 |
92 |
|
<$100K |
12 |
15 |
7 |
16 |
14 |
29 |
93 |
|
$100K-<$500K |
10 |
16 |
7 |
9 |
18 |
25 |
85 |
|
$500K-<$1M |
28 |
33 |
17 |
28 |
21 |
32 |
159 |
|
$1M-<$5M |
13 |
26 |
3 |
10 |
20 |
2 |
74 |
|
$5M-<$20M |
2 |
21 |
5 |
2 |
2 |
0 |
32 |
|
$20M-<$100M |
0 |
3 |
0 |
1 |
0 |
0 |
4 |
|
$100M+ |
2 |
2 |
0 |
0 |
0 |
0 |
4 |
|
Total |
98 |
157 |
41 |
68 |
77 |
102 |
543 |
|
NOTE: These data are for all agencies, not NIH-specific. SOURCE: NRC Firm Survey. |
|||||||
TABLE App-A-56 Company-level Activities
|
Activities |
U.S. Companies/Investors |
Foreign Companies/Investors |
||||
|
Finalized (%) |
Ongoing (%) |
Total (%) |
Finalized (%) |
Ongoing (%) |
Total (%) |
|
|
Licensing Agreement(s) |
19 |
16 |
35 |
9 |
6 |
15 |
|
Sale of Company |
1 |
4 |
5 |
0 |
1 |
1 |
|
Partial sale of Company |
2 |
4 |
6 |
0 |
1 |
1 |
|
Sale of technology rights |
6 |
7 |
13 |
1 |
1 |
2 |
|
Company merger |
0 |
3 |
3 |
0 |
1 |
1 |
|
Joint Venture agreement |
3 |
9 |
12 |
1 |
3 |
4 |
|
Marketing/distribution agreement(s) |
21 |
10 |
31 |
12 |
6 |
18 |
|
Manufacturing agreement(s) |
7 |
4 |
11 |
2 |
2 |
4 |
|
R&D agreement(s) |
15 |
11 |
26 |
4 |
3 |
7 |
|
Customer alliance(s) |
8 |
10 |
18 |
3 |
1 |
4 |
|
Other Specify____________ |
2 |
2 |
4 |
0 |
1 |
1 |
|
SOURCE: NRC Phase II Survey. |
||||||
TABLE App-A-57 Sales by Size of Reported Revenues
|
Revenues |
NRC Responses |
Percent of Those with Sales |
Percent of All Responses |
|
<$1M |
147 |
72.8 |
29.6 |
|
>$1M to <$5M |
39 |
19.3 |
7.9 |
|
>$5M to <$10M |
8 |
4.0 |
1.6 |
|
>$10M to <$50M |
7 |
3.5 |
1.4 |
|
>$50M |
1 |
0.5 |
0.2 |
|
Reporting Sales Total |
202 |
|
|
|
All Responses |
496 |
|
|
|
Percent Reporting Sales |
40.7 |
|
|
|
SOURCE: NRC Phase II Survey. |
|||
TABLE App-A-58 Change in Employment Caused by SBIR
|
Change in Employment |
Number of Responses |
Percent |
|
<0 |
63 |
39.7 |
|
0 |
40 |
11.6 |
|
1-10 |
123 |
6.1 |
|
11-25 |
36 |
1.9 |
|
26-50 |
19 |
1.0 |
|
50-75 |
6 |
4.8 |
|
76-99 |
3 |
1.3 |
|
101-250 |
15 |
0.3 |
|
251-500 |
4 |
100.0 |
|
+>500 |
1 |
0.0 |
|
|
310 |
|
|
SOURCE: NRC Phase II Survey. |
||
TABLE App-A-59 Sales Expectations
|
Sales Expectations |
Number of Responses |
Percent of Responses |
|
Sales expected |
95 |
19.2 |
|
Sales not expected |
32 |
6.5 |
|
Sales |
226 |
45.6 |
|
No response |
143 |
28.8 |
|
Total responses |
|
353 |
|
All responses to survey |
|
496 |
|
SOURCE: NRC Phase II Survey. |
||
TABLE App-A-60 Sales by Licensees
|
Revenues Reported for Licensee |
Number of Responses |
|
<$1M |
39 |
|
$1M-<$5M |
5 |
|
$5M-<$50M |
5 |
|
$50M+ |
3 |
|
Total |
52 |
|
All responses |
496 |
|
NOTE: These data are as reported by the recipient, not the licensee. SOURCE: NRC Phase II Survey. |
|
TABLE App-A-61 Additional Investment Dollars (For projects receiving additional investment).
|
Source of Investment |
Total Investment ($) |
Percent |
Number of Investments |
Percent |
Average Investment ($) |
|
Private investment from U.S. venture capital |
154,617,045 |
33.9 |
15 |
3.9 |
10,307,803 |
|
Private investment from other private equity |
141,992,212 |
31.1 |
40 |
10.4 |
3,549,805 |
|
Private investment from foreign investment |
39,616,075 |
8.7 |
12 |
3.1 |
3,301,340 |
|
Private investment from other domestic private company |
21,624,866 |
4.7 |
31 |
8.1 |
697,576 |
|
Your own company |
82,118,851 |
18.0 |
188 |
49.1 |
436,802 |
|
State or local government |
6,290,000 |
1.4 |
23 |
6.0 |
273,478 |
|
Personal funds |
9,850,408 |
2.2 |
67 |
17.5 |
147,021 |
|
College or universities |
236,500 |
0.1 |
7 |
1.8 |
33,786 |
|
Total |
456,345,957 |
100.0 |
383 |
100.0 |
1,191,504 |
|
SOURCE: NRC Phase II Survey. |
|||||
TABLE App-A-62 The “Go” Decision
|
In the absence of this SBIR award, would your company have undertaken this project? |
|
|
Definitely yes |
5% |
|
Probably yes |
8% |
|
Uncertain |
14% |
|
Probably not |
28% |
|
Definitely not |
46% |
|
SOURCE: NRC Phase II Survey. |
|
TABLE App-A-63 Patents and Publications
|
Patent applications and awards |
||||||
|
|
Applications |
Awarded |
||||
|
Number |
Percent |
Number |
Percent |
|||
|
No |
249 |
58.7 |
280 |
66.0 |
||
|
Yes |
175 |
41.3 |
144 |
34.0 |
||
|
Total Responses |
424 |
100.0 |
424 |
100.0 |
||
|
Publications |
||||||
|
Number of Publications |
Number of Responses |
|
Total Number of Publications |
|||
|
1 |
72 |
|
72 |
|||
|
2 |
52 |
|
104 |
|||
|
3 |
32 |
|
96 |
|||
|
4 |
19 |
|
76 |
|||
|
5 |
15 |
|
75 |
|||
|
6-10 |
15 |
|
133 |
|||
|
11-30 |
9 |
|
146 |
|||
|
30+ |
7 |
|
420 |
|||
|
Totals |
236 |
|
1,122 |
|||
|
SOURCE: NRC Phase II Survey. |
||||||
TABLE App-A-64 Time to Market
|
Number of Years to Market |
Number of Projects |
Percent of Projects |
||||
|
−11 |
|
1 |
|
|
0.4 |
|
|
−7 |
|
1 |
|
|
0.4 |
|
|
−4 |
|
1 |
|
|
0.4 |
|
|
−3 |
|
4 |
|
|
1.8 |
|
|
−2 |
|
6 |
|
|
2.7 |
|
|
−1 |
|
9 |
|
|
4.0 |
|
|
0 |
|
18 |
|
|
8.0 |
|
|
1 |
|
29 |
|
|
12.9 |
|
|
2 |
|
50 |
|
|
22.3 |
|
|
3 |
|
48 |
|
|
21.4 |
|
|
4 |
|
26 |
|
|
11.6 |
|
|
5 |
|
17 |
|
|
7.6 |
|
|
6 |
|
8 |
|
|
3.6 |
|
|
7 |
|
3 |
|
|
1.3 |
|
|
8 |
|
1 |
|
|
0.4 |
|
|
9 |
|
2 |
|
|
0.9 |
|
|
|
|
224 |
|
|
|
|
|
Award Year |
All Respondents |
Sales |
No Sales Yet |
Years Since Award |
||
|
1992 |
21 |
|
10 |
11 |
|
13 |
|
1993 |
34 |
|
14 |
20 |
|
12 |
|
1994 |
27 |
|
10 |
17 |
|
11 |
|
1995 |
32 |
|
17 |
15 |
|
10 |
|
1996 |
35 |
|
15 |
20 |
|
9 |
|
1997 |
59 |
|
25 |
34 |
|
8 |
|
1998 |
57 |
|
29 |
28 |
|
7 |
|
1999 |
81 |
|
44 |
37 |
|
6 |
|
2000 |
63 |
|
26 |
37 |
|
5 |
|
2001 |
87 |
|
34 |
53 |
|
4 |
|
NOTE: Negative answers are possible if the research represents enhancement of an existing product. SOURCE: NRC Phase II Survey. |
||||||


