
APPENDIX E
Results from the Evidence-Based Report* on Outcomes of Maternal Weight Gain
The purpose of this systematic evidence-based review, requested by the Agency for Healthcare Research and Quality (AHRQ) and conducted by the RTI International—University of North Carolina at Chapel Hill Evidence-based Practice Center (RTI-UNC EPC), was to review the evidence on outcomes of gestational weight gain with specific attention to five key questions:
-
KQ 1. What is the evidence that either total weight gain or rate of weight gain during pregnancy is associated with (1) birth outcomes, (2) infant health outcomes, and (3) maternal health outcomes? Does any evidence suggest that either total weight gain or rate of weight gain is a causal factor in infant or maternal health outcomes?
-
KQ 2. What are the confounders and effect modifiers for the association between gestational weight gain (overall and patterns) and birth outcomes? Based on the findings in KQ 1, do these confounders and effect modifiers themselves contribute to antepartum or postpartum complications or to longer-term maternal and fetal complications, including development of adult obesity?
-
KQ 3. What is the evidence that weight gains above or below thresholds defined in the 1990 IOM body mass index (BMI) guide-
|
* |
Appendixes and evidence tables cited in this report are provided electronically at http://www.ahrq.gov/downloads/pub/evidence/pdf/admaternal/admaternalapp.pdf. |
-
lines or weight loss in pregnancy contribute to antepartum or postpartum complications or longer-term maternal and fetal complications? How do these relationships vary by sociodemographic characteristics (i.e., race and age)?
-
KQ 4. What are the harms or benefits of offering the same weight gain recommendations to all pregnant women, irrespective of age and body weight considerations (e.g., pregravid weight, actual body weight at a particular time point, or optimal body weight)?
-
KQ 5. What are the anthropometric tools for determining adiposity and their appropriateness for the pregnancy state? What are the risks and benefits of measuring adiposity for (1) clinical management of weight gain during pregnancy and (2) evaluation of the relationship between weight gain and outcomes of pregnancy?
The review focused on screening studies from 1990 to October 2007 that were published in English, and excluded studies with low sample size (case series < 100 and cohorts < 40) or failure to control for pregravid weight. In total, 150 studies were systematically reviewed and each was rated on quality and used to assess the strength of evidence for each outcome. The report, including appendices and evidence tables, can be accessed and viewed in its entirety at http://www.ahrq.gov/clinic/tp/admattp.htm. Literature published outside of the scope of the report (prior to 1990 and after October 2007) are reviewed in Appendix C of this report. The methods and results and of the evidence review (Chapter 3 of the report) are provided below.
CHAPTER 2:
METHODS
In this chapter, we document the procedures that the RTI International-University of North Carolina Evidence-based Practice Center (RTI-UNC EPC) used to develop this comprehensive evidence report on outcomes of maternal weight gain. The team was led by a senior health services researcher (Meera Viswanathan, PhD, Study Director), a senior epidemiologist (Anna Maria Siega-Riz, PhD, RD, Scientific Director), and a senior nurse-researcher (Merry-K Moos, FNP, MPH, co-Scientific Director).
We first describe our strategy for identifying articles relevant to our five key questions (KQs), our inclusion and exclusion criteria, and the process we used to abstract relevant information from the eligible articles and generate our evidence tables. We also discuss our criteria for grading the quality of individual articles and for rating the strength of the evidence as a whole. Finally, we explain the peer-review process.
TABLE 1. Inclusion/exclusion Criteria for Gestational Weight Gain
|
Category |
Criteria |
|
Study population |
Women of any age with singleton pregnancies |
|
Study settings and geography |
KQ 1, KQ 2, KQ 4: Developed nations: United States, Canada, Western Europe, Japan, Australia, New Zealand |
|
KQ 3: United States |
|
|
KQ 5: All countries |
|
|
Time period |
January 1990 through October 2007 |
|
Publication languages |
English only |
|
Admissible evidence (study design and other criteria) |
Admissible designs |
|
Controlled trials (n ≥ 40), nonrandomized controlled trials (n ≥ 40), systematic reviews, meta-analyses, prospective trials with historical controls (n ≥ 40), prospective or retrospective observational cohort studies (n ≥ 40), and medium to large case series (n ≥ 100) |
|
|
Other criteria |
|
|
Original research studies must provide sufficient detail regarding methods and results to enable use and adjustment of the data and results. |
|
|
Relevant outcomes must be abstractable from data presented in the papers. |
|
|
Sample sizes must be appropriate for the study question addressed in the paper; single case reports or small case series (fewer than 100 subjects) are excluded. |
|
|
For KQ 1, 2, 3, and 4: prepregnancy body mass index (BMI) or weight must be accounted for in the relationship between maternal weight gain and outcome. |
|
|
Studies limited to women with preexisting health conditions only are excluded. |
Literature Review Methods
Inclusion and Exclusion Criteria
Our inclusion and exclusion criteria are documented in Table 1. As noted in Chapter 1, this systematic review focuses on outcomes of maternal weight gain with respect to the 1990 recommendations from the Institute of Medicine (IOM). Largely for that reason, we limited our searches to articles published in 1990 and thereafter. We also restricted our searches to developed countries so that we could have data generally relevant for maternal weight gain and health outcomes in the United States.
We excluded studies that (1) were published in languages other than English (given the available time and resources); (2) did not report information pertinent to the key clinical questions; (3) had fewer than 40 subjects
for randomized controlled trials (RCTs) or nonrandomized cohorts with comparisons or fewer than 100 subjects for case series; and (4) were not original studies.
For KQ 1, 2, 3, and 4, we required that the reported association between maternal weight gain and health outcomes accounted for prepregnancy body mass index (BMI) or weight, either through stratified univariate analysis or multivariate analysis.
Literature Search and Retrieval Process
Databases We used multifaceted search strategies to include current and valid research on the KQs, which we applied to four standard electronic databases—MEDLINE®, Cochrane Collaboration resources, Cumulative Index to Nursing and Allied Health Literature (CINAHL), and Embase. We also hand-searched the reference lists of relevant articles to make sure that we did not miss any relevant studies. We consulted with our Technical Expert Panel (TEP) about any studies or trials that are currently under way or that may not yet be published.
Search terms. Based on the inclusion/exclusion criteria above, we generated a list of Medical Subject Heading (MeSH) search terms (Table 2 and Appendix A*). Our TEP also reviewed these terms to ensure that we were not missing any critical areas, and this list represents our collective decisions as to the MeSH terms used for all searches.
TABLE 2. MEDLINE® Search Strategy and Unduplicated Results for February 2007
|
Search Terms |
Search Results |
|
#2 Search “Weight Gain”[MeSH] |
13,220 |
|
#5 Search pregnancy [MeSH] |
577,647 |
|
#6 Search #2 AND #5 |
1,808 |
|
#7 Search gestational weight gain |
1,725 |
|
#8 Search #6 OR #7 |
3,023 |
|
#9 Search #6 OR #7 Limits: English, Humans |
1,696 |
|
#15 Search (“Outcome Assessment (Health Care)”[MeSH] OR “Outcome and Process Assessment (Health Care)”[MeSH] OR “Pregnancy Outcome”[MeSH]) OR “Reproductive History”[MeSH] OR “birth outcomes” OR “infant health outcomes” OR “maternal health outcomes” Limits: English, Humans |
332,914 |
|
#16 Search #9 AND #15 Limits: English, Humans |
474 |
|
#19 Search (“Counseling”[MeSH] OR “Directive Counseling”[MeSH]) |
23,091 |
|
#20 Search #9 AND #19 |
12 |
|
#25 Search “Body Weights and Measures”[MeSH] |
279,399 |
|
#26 Search #9 AND #25 |
1,044 |
|
#29 Search “Anthropometry”[MeSH] |
71,849 |
|
#30 Search #26 AND #29 |
359 |
Our searches in MEDLINE® produced 715 unduplicated records. Searches in other databases yielded in 190 new records from CINAHL and 4 from Embase. Similar searches in Cochrane did not produce any new citations. Following an update on October 3, 2007, and additional searches for KQ 5, we ultimately identified 1,082 unduplicated records. In addition, peer reviews suggested 3 new citations that met our inclusion criteria.
Figure 1 presents the yield and results from our searches, which we conducted from February through October 3, 2007. Beginning with a yield
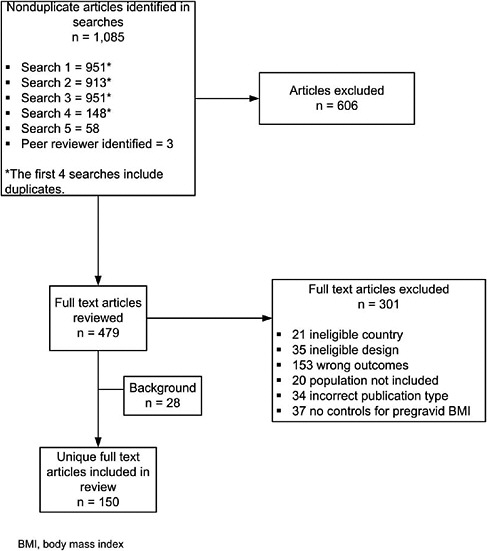
FIGURE 1. Disposition of articles for gestational weight gain.
of 1,085 articles, we retained 150 articles that we determined were relevant to address our KQs and met our inclusion/exclusion criteria (Table 1). We reviewed titles and abstracts of the articles against the basic inclusion criteria above; we retained relevant articles, all published after our search cutoff date of January 1990, and used them as appropriate in the discussion in Chapter 4.
Article selection process Once we had identified articles through the electronic database searches, review articles, and reference lists, we examined abstracts of articles to determine whether studies met our criteria. Each abstract was independently, dually reviewed for inclusion or exclusion, using an Abstract Review Form (Appendix B). If one reviewer concluded that the article should be included in the review, we retained it.
Of this entire group of 1,085 articles, 479 required full review. For the full article review, one team member read each article and decided whether it met our inclusion criteria, using a Full Text Inclusion/Exclusion Form (Appendix B*). Reasons for article exclusion are listed in Appendix D.
Literature Synthesis
Development of Evidence Tables and Data Abstraction Process
The senior staff who conducted this systematic review jointly developed the evidence tables. We designed the tables to provide sufficient information to enable readers to understand the studies and to determine their quality; we gave particular emphasis to essential information related to our KQs. We based the format of our evidence tables on successful designs that we have used for prior systematic reviews.
We trained abstractors by having them abstract several articles into evidence tables and then reconvening as a group to discuss the utility of the table design. The abstractors repeated this process through several iterations until they decided that the tables included the appropriate categories for gathering the information contained in the articles.
Three junior epidemiologists (Sunni Mumford, SM; Andrea Deierlein, MS, MPH; and Julie K. Knaack, MPH, RD, LDN) shared the task of initially entering information into the evidence tables. Senior staff reviewed the articles and edited all initial table entries for accuracy, completeness, and consistency. Abstractors reconciled all disagreements concerning the information reported in the evidence tables. The full research team met regularly during the article abstraction period and discussed global issues related to the data abstraction process.
The final evidence tables are presented in their entirety in Appendix C. Studies are presented in the evidence tables alphabetically by the last name
of the first author. A list of abbreviations and acronyms used in the tables appears at the beginning of that appendix.
Quality Rating of Individual Studies
The evidence for this systematic review is based almost entirely on observational studies. This fact presents a challenge for rating individual studies. Quality rating forms for RCTs have been validated and in use for several years; a similarly well-validated form for observational studies does not exist.
Thus, as a parallel effort, we developed a form to rate observational studies.35 This form, which can be used to rate the quality of a variety of observational studies, was based on a review of more than 90 AHRQ systematic reviews that included observational studies; we supplemented this review with other key articles identifying domains and scales.36,37 We structured the resultant form largely on the basis of the domains and subdomains suggested by Deeks and colleagues;36 we then adapted it for use in this systematic review (Appendix B*).
The form currently includes review of nine key domains: background, sample selection, specification of exposure, specification of outcome, soundness of information, followup, analysis comparability, analysis of outcome, and interpretation. Each of these domains was further evaluated on aspects of quality of the study design or reporting that would influence the reader’s perception of internal validity of the journal article (Table 3). We note that variations in reporting could result in different scores for studies drawing from the same sample.
As described in Table 3, we combined these elements to generate overall scores. We set the default as fair and then focused on the threshold required for good and poor studies; the algorithm is also described in Table 3. Fair studies, therefore, include studies that were predominantly fair (four to nine fair ratings on domains) and could not be rated either good (fewer than five good ratings for subdomains) or poor (fewer than three poor ratings for subdomains). Studies with more than five good ratings for domains that also received one or two poor ratings were downgraded to fair quality.
Key methodological concerns in this literature relate to the source of information on weight gain and the timing of measurement of weight gain. Studies that relied solely on self-reported pregravid and final pregnancy weights suffer from well-documented issues of recall bias. In addition, women tend to misreport their weight, and this bias varies by weight status38 and ethnicity.39 The timing of weight measurement (for pregravid weight and final weight) can vary depending on the design of the study; when unreported, the total weight gain during pregnancy cannot be assumed to be collected at similar time points for all women within the study,
TABLE 3. Scoring Algorithm for Subdomains and Overall Quality Rating for Individual Studies
|
Definition and Scoring Algorithm |
Rating |
|
Score algorithm for background (presented in the context of previous research, hypothesis clearly described) |
|
|
• Both elements present |
Good |
|
• Neither present |
Poor |
|
• One of two elements present |
Fair |
|
Score algorithm for sample definition (explicitly stated inclusion/exclusion criteria, uniform application of criteria, clear description of recruitment strategy, clear description of characteristics of the participants, power analysis or some other basis noted for determining the adequacy of study sample size) |
|
|
• > Three elements present |
Good |
|
• < Two elements present |
Poor |
|
• Two or three elements present |
Fair |
|
Score algorithm for exposure (clear definition of weight gain, check for plausibility of pregravid weight, clear explanation of actions taken on outliers) |
|
|
• All three elements present or clearly defined |
Good |
|
• Poor definition of weight gain |
Poor |
|
• Moderate or very clear definition of weight gain, one or more other elements present |
Fair |
|
Score algorithm for outcome (clear description of primary outcomes) |
|
|
• All essential details described |
Good |
|
• Few or no essential details described |
Poor |
|
• Some essential details described |
Fair |
|
Score algorithm for soundness of information (quality of source of information on exposure, confounders, and outcome) |
|
|
• Good for all three |
Good |
|
• Poor on source of information for exposure |
Poor |
|
• Any other score |
Fair |
|
Score algorithm for followup (adequate reporting of reasons for loss to followup) |
|
|
• Retrospective or prospective study with clear reporting on loss to followup |
Good |
|
• Prospective study, no reporting on followup |
Poor |
|
• Retrospective study with no reporting on loss to followup |
Fair |
|
Score algorithm for analysis comparability (comparability of cohorts through design, reasonable choice of control variables, clear description of confounders, adequate adjustment for confounders) |
|
|
• All elements present |
Good |
|
• Inadequate adjustment for confounding |
Poor |
|
• Any other score |
Fair |
|
Score algorithm for analysis outcome (withdrawals, lost to followup, and missing data adequately accounted for in the analysis, and appropriate statistical methods used) |
|
|
Definition and Scoring Algorithm |
Rating |
|
• Both elements clearly present |
Good |
|
• Neither element present |
Poor |
|
• Any other score |
Fair |
|
Score algorithm for interpretation (results interpreted appropriately based on study design and statistics, clinically useful, appropriate presentation, presented in the context of prior research, and conclusion supported by results) |
|
|
• All elements clearly present |
Good |
|
• Conclusions not supported by results |
Poor |
|
• Any other score |
Fair |
|
Score algorithm for overall quality |
|
|
• 5 or more good ratings and no poor ratings on subdomains |
Good |
|
• 3 or more poor ratings on subdomains |
Poor |
|
• < 5 good ratings and < 3 poor ratings on subdomains; 5 or more good ratings and any poor ratings |
Fair |
resulting in further bias. Our rating algorithm, therefore, paid special attention to the source of data on gestational weight gain and the timing of measurement. Studies that relied solely on recalled prepregnancy and total pregnancy weight were rated poor on that domain, but if they defined their gestational weight variable clearly (providing details on the timing of measurement for pregravid and final weight measurements) and either checked for the biological plausibility of pregravid weight status or explained how outliers were dealt with, they could receive an overall fair rating (assuming that they received fewer than three poor ratings overall).
Strength of Available Evidence
Our scheme follows the criteria applied in an earlier RTI-UNC EPC systematic review of systems for rating the strength of a body of evidence.40 That system has three domains: quality of the research (as evaluated by the quality rating algorithm described above), quantity of studies (including number of studies and adequacy of the sample size), and consistency of findings. Two senior staff members assigned grades by consensus.
We graded the body of literature for each KQ and present those ratings as part of the discussion in Chapter 4. The possible grades in our scheme are as follows:
-
Strong: The evidence is from studies of sound design (good quality); results are both clinically important and consistent with minor exceptions at most; results are free from serious doubts about generalizability, bias, or
-
flaws in research design. Studies with negative results have sufficiently large samples to have adequate statistical power.
-
Moderate: The evidence is from studies of sound design (good quality), but some uncertainty remains because of inconsistencies or concern about generalizability, bias, research design flaws, or adequate sample size. Alternatively, the evidence is consistent but derives from studies of weaker design (fair quality).
-
Weak: The evidence is from a limited number of studies of weaker design (fair or poor quality). Studies with strong design (good quality) either have not been done or are inconclusive.
-
No evidence: No published literature.
External Peer Review
As is customary for all evidence reports and systematic reviews done for AHRQ, the RTI-UNC EPC requested review of this report from a wide array of individual outside experts in the field, including our TEP, and from relevant professional societies and public organizations. AHRQ also requested review from its own staff. We sent 20 invitations for peer review: 6 TEP members, 6 relevant organizations, and 8 individual experts. Reviewers included clinicians (e.g., obstetrics and gynecology, women’s health/general health), representatives of federal agencies, advocacy groups, and potential users of the report.
We charged peer reviewers with commenting on the content, structure, and format of the evidence report, providing additional relevant citations, and pointing out issues related to how we had conceptualized and defined the topic and KQs. We also asked them to complete a peer review checklist. We received comments from 11 of the invited peer reviewers in addition to comments from AHRQ staff. The individuals listed in Appendix E** gave us permission to acknowledge their review of the draft. We compiled all comments and addressed each one individually, revising the text as appropriate.
CHAPTER 3:
RESULTS
This chapter presents the results of our evidence review for the following four key questions (KQs): KQ 1, outcomes of gestational weight gain; KQ 3, outcomes of gestational weight gain within or outside the recommendations of the Institute of Medicine (IOM); and KQ 5, anthropometrics of gestational weight gain.
We note that KQ 2, on modifiers of outcomes, is derivative of KQ 1. KQ 4, on recommendations for weight gain, is derivative of KQ 3. Because we framed KQ 2 and KQ4 as synthesis questions, we cover them in Chapter 4.
Appendix C provides the detailed evidence tables for KQs 1, 3, and 5. Our summary tables below feature groups of studies addressing each outcome; we present these text tables only when we have three or more studies pertaining to that particular outcome. These tables are organized by quality (good, then fair, then poor), and then alphabetically.
The summary tables generally provide information to identify the study (author and date), sample size, study quality, definition of gestational weight gain, definition of outcome, results, and confounders and effect modifiers. Unless otherwise noted, we use the metrics (e.g., grams, kilograms, pounds) that each study article used; we did not recalculate measures into the same metric.
KQ 1:
Outcomes of Gestational Weight Gain
We present outcomes in the physiological order, beginning with maternal antepartum and intrapartum outcomes, then birth outcomes (neonatal outcomes at the time of birth), infant outcomes (< 1 year), child outcomes (≥ 1 year), and finally maternal short- and long-term outcomes. Evidence Tables 1-35 (Appendix C) include studies relevant for KQ 1, listed alphabetically by author. For each outcome, we describe study characteristics and then report an overview of results, followed by detailed results. When meaningful, we present results separately for varied measures of gestational weight gain (categorical measures of weight gain, rate of weight gain, total weight gain, and other). For some bodies of evidence, variations in the definition of the outcome and inconsistencies in the direction of effect may suggest that an overall assessment of the effect is more meaningful than separate assessments of outcomes associated with each measure of gestational weight gain. Summary tables and text include information on the confounders and effect modifiers accounted for in each study.
Maternal Antepartum Outcomes
Maternal discomforts of pregnancy
Study characteristics Five studies (Evidence Table 1) investigated the relationship between weight gain and diverse maternal discomforts of pregnancy: a composite of pregnancy discomforts,41 physical energy and fatigue,42 stretch marks,43,44 and heartburn.45
Overview of results Two fair41,42 and three poor studies43-45 found no differences for women who gained an excessive amount of weight compared to those who did not, irrespective of body mass index (BMI) group,42 a higher frequency of symptoms from midpregnancy through the 36th week of gestation,46 no association between gestational weight gain
and heartburn in gestation,45 and some increased risk of stretch marks with increased weight gain.43,44
Detailed results A prospective cohort study in Sweden examined symptoms across pregnancy and attempted to document the prevalence and frequency of 27 pregnancy symptoms while controlling for biomedical factors.41 A cohort of 476 nulliparous women was assessed six times during gestation (gestational ages of 10, 12, 20, 28, 32, and 36 weeks). The investigators sought to determine the prevalence of various symptoms in pregnancy and to explore whether psychosocial variables are explanatory while controlling for possible confounding variables such as medical risk, smoking, and weight gain. Pregravid BMIs were calculated from self-reported weight information and women were weighed when they arrived at the hospital to give birth. Total weight gain was associated with a higher frequency of symptoms from midpregnancy through the 36th week of gestation. Reflecting on their findings, the researchers recommend that weight gain be included in future studies exploring the etiology of symptoms during pregnancy.
A secondary analysis of data collected in a US prospective cohort study investigated the relationship of prepregnancy weight and gestational weight gain on levels of physical energy and physical symptoms collected through a series of questionnaires that had been administered in patient homes in early, mid, and late pregnancy.42 All weight data were self-reported. The researchers found no differences in the number of physical symptoms or level of physical energy reported by women who gained an excessive amount of weight compared with those who did not, irrespective of BMI group. Women whose weight gain was greater than the IOM guidelines reported a lower level of functional status in the third trimester than women whose weight gain was within the guidelines (P = 0.014). Women participating in this study were 30.9 years of age on average, married, English-speaking, and of low medical risk. No confounders or effect modifiers were accounted for in the analysis.
The one study (rated poor quality) that investigated the determinants of heartburn in pregnancy undertook a cross-sectional study in the United Kingdom of 602 women of different gestational lengths who self-reported their pregravid weight and completed a questionnaire.45 The analysis, which considered age, race, parity, and pregravid BMI, found that weight gain in pregnancy was not a risk factor for heartburn in gestation.
Two studies (both rated poor quality) reported on the relationship between stretch marks (striae gravidarum) and weight gain.43,44 One was a small retrospective cohort (N = 48) recruited from one private and one teaching hospital in the United States.43 Mean total weight gain was significantly greater in women with abdominal striae than women without stretch
marks (P < .05) but the analysis did not account for any confounders or effect modifiers. The other study reported on a cross-sectional sample of 324 primiparous women who were assessed within 48 hours of giving birth in Great Britain.44 Logistic regression analysis found maternal age, BMI, weight gain, and neonatal birthweight to be independently associated with striae. Weight gain was a weakly significant risk factor (OR, 1.08; 95% CI, 1.02-1.14).
Hyperemesis
Study characteristics A retrospective cohort study compared the experiences of 1,270 women who had an antepartum admission before 24 weeks of gestation for hyperemesis with those of 154,821 women who experienced no antepartum admission related to vomiting (Evidence Table 2).47 Baseline weight and weight gain were abstracted from the Nova Scotia Atlee Perinatal Database, but the authors did not explain how the weights entered into the database were assessed.
Overview of results One poor study found a correlation between increasing likelihood of total gestational weight gain of < 7 kg with increasing numbers of antenatal admissions for hyperemesis.47
Detailed results The study, undertaken to determine the relationship between hyperemesis and a variety of outcomes, used the number of antenatal admissions as a marker for severity of disease. The study found a correlation between increasing likelihood of total gestational weight gain of < 7 kg with increasing numbers of antenatal admissions. Many potential confounders were incorporated into the analysis including previous pregnancy experiences, psychiatric disorders, pregravid weight, and preexisting medical diseases. Weight gain information, however, was missing for approximately 17 percent of the cohort.
Abnormal glucose metabolism
Study characteristics Eleven studies specifically investigated the relationship between weight gain in pregnancy and the development of abnormal glucose metabolism (Evidence Table 3, Table 4).3,48-57 Of these, four were done outside the United States.49,50,52,53 Numerous inconsistencies in methodology and definitions, such as differences in criteria used for the diagnosis of gestational diabetes mellitus (GDM), preclude clear summations regarding the research.
The diagnostic algorithm for assigning the diagnosis of GDM in most asymptomatic women begins with administration and interpretation of a 1-hour glucose challenge test; those women who have a glucose level following the challenge above a specified level then receive a 3-hour glucose
TABLE 4. Gestational Weight Gain and Abnormal Glucose Control
|
Author, Year Country, Setting Sample Size Baseline BMI Quality |
Pregravid Weight (How Measured) Total Weight Gain (How Measured) |
Definition of Groups |
Results |
Confounders and Effect Modifiers Included in Analysis |
|
Kieffer et al., 200648 |
Pregravid weight: Self-report; if unknown calculated from wt at ≤ 10 wks gestation |
Note: study aim to determine relationship of anthropometric and metabolic variables on infant outcomes |
Women with GDM had significantly lower average weight gain than those without GDM but weight gain was not significantly related to glucose category |
Parity, pregravid BMI, weight gain |
|
US Michigan federally qualified community health center |
||||
|
1,041 Latinas |
Total weight gain: Computed from last weight recorded within 7 days delivery |
|||
|
All BMIs |
||||
|
Good |
||||
|
Saldana et al., 20063 |
Pregravid weight: Self-report |
|
Weight gain ratio (observed/recommended) |
Race, maternal age, gestation age of weight measurement |
|
US North Carolina prenatal study |
||||
|
Total weight gain: Calculated on prenatal measurement to end of second trimester |
IGT OR (95% CI) 0.9 (0.7-1.1) |
|||
|
2,254 |
||||
|
GDM OR (95% CI) 1.2 (0.9-1.4) |
||||
|
All BMIs |
||||
|
Good |
|
Edwards et al., 199655 |
Pregravid weight: Self-report |
Pregravid wt 19.8-26.0 BMI: G1: < 11.5 kg gain G2: 11.6-16 kg gain G3: > 16 kg gain |
Incidence gestational diabetes: G1: 2.3% G2: 3.3% G3: 2.9% (P = .759) |
Maternal age, parity, race, prenatal smoking, prenatal alcohol use, prenatal illicit drug use, pregravid health, weight and adequacy of prenatal care |
|
US Minnesota, births at specific medical center |
||||
|
Total weight gain: Last prenatal assessment |
||||
|
1,343 divided between obese women (BMI > 29) matched to nonobese (BMI 19.8-26.0) |
||||
|
Pregravid wt > 29 kg G4: lost/gained nothing G5: 0.5-6.5 kg gain G6: 7-11.5 kg gain G7: 12-16 kg gain G8: > 16 kg gain |
||||
|
G4: 13.3% G5: 24.3% G6: 11.9% G7: 16.7% G8: 17.3% (P = .554) |
||||
|
Fair |
||||
|
Hackmon, et al., 200757 |
Pregravid weight: How determined not described |
|
There was no difference in maternal weight gain during early pregnancy between patients with abnormal versus normal GCT values (mean ± SD of 4.13 ± 3.2 and 4.16 ± 1.67, respectively). |
Gravidity, parity, ethnicity, BMI |
|
US inner city population |
||||
|
75 |
||||
|
Weight gain: Weight at 24-28 weeks end point for calculations |
||||
|
All BMIs |
||||
|
Fair |
||||
|
Kieffer et al., 200156 |
Pregravid weight: Self-report or, if unknown, weight assessment in 1st 10 wks gestation |
Wt gain to 28 wk GA: |
Multiple logistic regression analyses revealed statistically significant risk factors for GDM included increasing weight gain during first 28 wks of gestation |
Age, family history diabetes, parity, BMI, weight gain first 28 weeks, ethnicity |
|
US Detroit health care system |
Latinas: G1: < 14 lbs gain G2: 14-28 lbs gain (reference) G3: > 28 lbs gain |
|||
|
1,334 AA and Hispanic |
||||
|
All BMIs |
||||
|
Total weight gain: How determined not described |
||||
|
Fair |
||||
|
AAs: G4: < 14 lbs gain G5: 14-28 lbs gain G6: > 28 lbs gain |
|
Author, Year Country, Setting Sample Size Baseline BMI Quality |
Pregravid Weight (How Measured) Total Weight Gain (How Measured) |
Definition of Groups |
Results |
Confounders and Effect Modifiers Included in Analysis |
|
Murakami et al., 200552 |
Pregravid weight: Self-report on first visit |
G1: < 8.5 kg gain G2: 8.5-12.5 kg gain G3: > 12.5 kg gain |
AOR (95% CI) gestational diabetes G1: 5.14 (0.97-27.20) G2: Reference G3: 3.91 (0.61-24.73) |
Maternal age, parity, smoking, weight gain, gestational weeks; pregravid BMI |
|
Japan hospital data |
||||
|
Total weight gain: Measured on admission for birth |
||||
|
633 |
||||
|
All BMIs |
||||
|
Fair |
||||
|
Thorsdottir, et al., 200253 |
Pregravid weight: Self-report |
G1: < 11.5 kg gain G2: 11.5-16.0 kg gain G3: 16.1-20.0 kg gain G4: > 20 kg gain |
Incidence gestational diabetes G1: 2.9% G2: 0 G3: 0 G4: 0 (P = .015) |
Age, parity, height, gestational age |
|
Iceland University Hospital |
||||
|
Total weight gain: Maternity records (no specifics offered) |
||||
|
615 |
||||
|
BMI: 19.5-25.5 |
||||
|
Fair |
||||
|
Bianco, et al., 199854 |
Pregravid weight: Self-report |
Reported only for BMI > 35: G1: weight loss or no gain G2: 1-15 lb gain G3: 16-25 lb gain G4: 26-35 lb gain G5: > 35 lb gain |
Incidence GDM: G1: 15.7% G2: 15.0% G3: 14.4% G4: 13.4% G5: 12.5% (P = NS) |
Race, parity, clinic service, substance abuse, and preexisting medical conditions |
|
US New York |
||||
|
Total weight gain: Computed from measured weight within 4 weeks of delivery |
||||
|
Medical Center Database |
||||
|
11,840 |
||||
|
Nonobese (BMI 19-27) and Morbidly obese (BMI > 35) ages 20-34 |
||||
|
Poor |
|
Brennand et al., 200549 |
Pregravid weight: Measured weight ≤ 14 wk GA used as proxy |
G1: “Low weight gain” G2: “Acceptable weight gain” G3: “Excessive weight gain” |
Incidence GDM: G1: 38.6% G2: 27.3% G3: 19.3% (P = 0.011) |
None reported |
|
Quebec, Canada, First Nation’s People (Cree) |
||||
|
Total weight: Last recorded weight within 4 wks of giving birth |
||||
|
603 |
||||
|
All categories per Canadian Guidelines |
||||
|
All BMIs ≥ 18.5 |
Incidence IGT: G1: 12.0% G2: 15.2% G3: 7.9% (P = 0.249) |
|||
|
Poor |
||||
|
Kabiru and Raynor, 200451 |
Pregravid weight: First prenatal visit |
BMI < 25 first assessment: G1: no change BMI category G2: increase 1 category G3: increase > 1 category |
Incidence gestational diabetes G1: 0.5% G2: 1.5% G3: 3.7% (P = .005) |
Pregravid weight |
|
US Atlanta public hospital database |
||||
|
Total weight gain: Computed on weight at admission for birth |
||||
|
5,131 |
BMI ≥ 25 first assessment: G4: no change BMI category G5: increase 1 category G6: increase > 1 category |
|||
|
All BMIs ≥ 20 |
G4: 1.0% G5: 3.3% G6: 1.9% (P = .005) |
|||
|
Poor |
||||
|
Seghieri et al., 200550 |
Pregravid weight: How determined not described |
|
Weight gain as predictor of GDM OR (95% CI) |
Parity, age, pregestational BMI, weight gain, family history diabetes |
|
Italy Outpatient Diabetes Unit |
||||
|
1,880 |
1.024 (0.974-1.077) (P = NS) |
|||
|
Total weight gain: How determined not described |
||||
|
All BMIs |
||||
|
Poor |
||||
|
AA, African American; ACOG, American College of Obstetrics and Gynecology; BMI, body mass index; CHC, community health center; CI, confidence interval; G, group; GA, gestational age; GDM, gestational diabetes mellitus; GIP, gastric inhibitory polypeptide; IGT, impaired glucose tolerance; IOM, Institute of Medicine; NS, not significant; OR, odds ratio; PNV, prenatal visit. |
||||
tolerance test (GTT). Abnormalities in the GTT results are considered diagnostic of GDM. The set point for determining if the glucose challenge test is abnormal is not universally agreed upon. Therefore, more women in one setting may be tested for disease than in another setting, not because of an increased prevalence of disease but because of differing definitions of abnormal. In addition, impaired glucose tolerance (IGT) is not clearly defined. Women with an abnormal glucose challenge test who subsequently have a normal GTT are sometimes identified as having IGT; more commonly, women who have one abnormal value in their GTT are designated as having IGT. The lack of standardization in the criteria necessary to be considered to have IGT and GDM hampers the body of research exploring the relationship between weight gain and abnormal glucose tolerance in pregnancy. Further hampering understanding of the relationship is that GDM is generally diagnosed around 28 weeks of gestation and is treated, in part, by dietary counseling and efforts to control weight gain. Similar attention is not directed toward women without this diagnosis. Therefore, using total weight gain as a predictor of disease or as a comparison point to a population without the diagnosis is likely to result in methodologically flawed conclusions.
Overview of results Four studies (1 good,32 fair,55,56 1 poor51) found that greater weight gains in pregnancy were positively associated with abnormal glucose tolerance. Three studies (1 good quality,48 1 fair,53 1 poor49) found that women having lower than average weight gains had higher likelihood of GDM. Finally, four studies (2 poor,50,54 1 fair52,53,57) found no significant association.
Detailed results Whether total weight gain or the distribution of the gain across trimester or weeks of pregnancy predicts development of GDM is unclear from the articles we reviewed. As previously noted, treatment of the condition can alter total weight gain. Three studies3,56,57 analyzed the association between weight gain in the first two trimesters of pregnancy and the diagnosis of GDM. A good-quality study reported that a weight gain ratio at the end of the second trimester of pregnancy that was greater than the IOM recommendations correlated with abnormalities of glucose metabolism.3 A fair study found no correlation between weight gain in the first 24 to 28 weeks of gestation and an abnormal glucose challenge test, the first step in the testing process to identify GDM.57 A third study assessed to be of fair quality reported that weight gain in the first 28 weeks of gestation was a significant predictor of the diagnosis of GDM (OR, 1.02; 95% CI, 1.004-1.042; P = 0.015) for their total sample of 987 black and Latina women but that total weight gain was not.56 The OR for black women was the same (1.02; 95% CI, 1.002-1.044; P = 0.30). However, the
range of weight gain included in the reference category was large (14-28 pounds) especially given that nearly 50 percent of the sample entered into the reported pregnancies with BMIs > 26.0.
Overall, family history of diabetes,50,56 maternal age,3,50,56 parity,50 and BMI3,50,56,57 were found to be more predictive of abnormal glucose metabolism than gestational weight gain in the research we reviewed.
Maternal hypertensive disorder
Study characteristics Twelve studies investigated the relationship between weight gain and pregnancy-induced hypertensive disorders (Evidence Table 4, Table 5).4,25,49,51-55,58-61 Six of the studies were conducted outside the United States;49,52,53,58,59,61 six studied US cohorts.4,25,51,54,55,60 While all of these studies reported on blood pressures that became elevated during gestation, the criteria for diagnosing gestational hypertension (also called pregnancy-induced hypertension) and preeclampsia were often poorly defined; in addition, criteria for the various diagnoses lacked consistency between studies.
Overview of results The vast majority of the studies (7 fair,4,25,53,55,58-60 3 poor,49,51,61) found that increasing weight gain was associated with increasing likelihood of a pregnancy-induced hypertensive disorder. Two studies, one fair52 and one poor,54 did not support this association.
Detailed results Six studies specifically examined the impact of weight gain on the development of pregnancy-induced hypertension in women classified as obese by their pregravid weight status.4,49,54,55,58,59 A prospective cohort study from Sweden examined the relationship of weight gain by pregravid BMI on pregnancy outcomes for 245,526 women who delivered term infants between 1994 and 2002.58 When compared to a reference gain of 8-16 kg, the researchers found that gains of less than 8 kg were protective against the development of preeclampsia for all pregravid BMI categories. The finding was not significant, however, for those with BMIs < 20. Gaining more than 16 kg increased the likelihood of developing preeclampsia, especially for women who entered pregnancy with lower BMIs. The greatest increased risk was for women entering pregnancy at a BMI of 20 to 24.9 (OR, 2.31; CI, 2.15-2.49); the lowest increased risk was for women who entered pregnancy at a BMI ≥ 35 (OR, 1.50; CI, 1.17-1.92).
One US retrospective cohort study studied 771 women with BMIs of 30 or greater matched by race or ethnicity, delivery date, age categories, and parity categories with women of normal pregravid BMIs (19.8-26.0).55 For women of normal weight, as weight increased the prevalence of preeclampsia steadily increased (P = .048) but increasing weight was not associated with the prevalence of gestational hypertension. For obese women, weight
TABLE 5. Gestational Weight Gain and Pregnancy-Induced Hypertension
|
Author, Year Country, Setting Sample Size Baseline BMI Quality |
Pregravid Weight (How Measured) Total Weight Gain (How Measured) |
Definition of Groups |
|
Cedergren, 200658 |
Pregravid weight: Self-report; if unknown “standardized measurement” used |
G1: BMI < 20 G2: BMI 20-24.9 G3: BMI 25-29.9 G4: BMI 30-34.9 G5: BMI > 35 |
|
Swedish Medical Birth Registry |
||
|
245,526 |
Total weight gain: Computed on weight at presentation for delivery |
|
|
All BMIs |
||
|
Fair |
||
|
DeVader et al., 200725 |
Pregravid weight: Noted on prenatal record or reported at postpartum stay |
G1: Weight gain < 25 lbs G2: Weight gain 25-35 lbs G3: Gained > 35 lbs |
|
USA Missouri, birth certificate data |
||
|
94,696 |
Total weight gain: As stated on birth certificate data. Specifics not provided |
|
|
BMI: 19.8-26.0 |
||
|
Fair |
||
|
Edwards et al.,199655 |
Pregravid weight: Self-reported |
Pregravid wt 19.8-26.0 BMI: G1: < 11.5 kg gain G2: 11.6-16 kg gain G3: > 16 kg gain |
|
USA Minnesota, births at specific medical center |
||
|
Total weight gain: Last prenatal assessment |
||
|
1,343 divided between obese women (BMI > 29) matched to nonobese (BMI 19.8-26.0) |
Pregravid wt > 29 kg G4: lost/gained nothing G5: 0.5-6.5 kg gain G6: 7-11.5 kg gain G7: 12-16 kg gain G8: > 16 kg gain |
|
|
Fair |
||
|
Kiel et al., 20074 |
Total weight gain: As stated on birth certificate data. Specifics not provided |
Analysis done by each class of obesity and weight changes in gestation including: weight loss ≥ 10 lbs; weight loss 2-9 lbs; no weight change; gain 2-9 lbs; gain 10-14 lbs; gain 15-25 lbs; gain 26-35 lbs; gain > 35 lbs |
|
USA Missouri, birth certificate data |
||
|
120,251 |
||
|
BMIs ≥ 30.0 |
||
|
Fair |
|
Results |
|
Confounders and Effect Modifiers Included in Analysis |
|
Preeclampsia by BMI for weight gain < 8 kg (reference gain 8-16 kg). OR (95% CI): G1: 0.90 (0.55-1.48) G2: 0.73 (0.61-0.89) G3: 0.64 (0.54-0.76) G4: 0.52 (0.42-0.62) G5: 0.63 (0.51-0.79) |
Preeclampsia by BMI for weight gain > 16 kg (reference weight gain 8-16 kg): Odds ratios (95% CI) G1: 2.23 (1.83-2.71) G2: 2.31 (2.15-2.49) G3: 1.88 (1.72-2.06) G4: 1.65 (1.43-1.92) G5: 1.50 (1.17-1.92) |
Age, parity, smoking in early pregnancy, year of birth |
|
AOR for preeclampsia (95% CI) |
Maternal age, race/ethnicity, education, Medicaid status, tobacco and alcohol use, maternal height, adequacy of prenatal care, child’s sex, child’s birth year |
|
|
G1: 0.56 (0.49-0.64) G2: 1 G3: 1.88 (1.74-2.04) |
|
|
|
Preeclampsia: G1: 2.8% G2: 2.9% G3: 6.6% (P = .048) |
Gestational HTN: G1: 2.3% G2: 3.8% G3: 3.3% (P = .607) |
Maternal age, parity, race, prenatal smoking, prenatal alcohol use, prenatal illicit drug use, pregravid health, weight and adequacy of prenatal care |
|
G4:10.7% G5: 7.7% G6: 8.3% G7: 7.9% G8: 16.5% (P = .076) |
G4: 9.3% G5: 8.3% G6: 11.3% G7: 10.3% G8: 9.0% (P = .832) |
|
|
Data all presented in graph form: Using a gain of 15-25 pounds as reference for each obesity class, OR of preeclampsia lower with less weight gain and higher with more weight gain |
Age, education, poverty (defined as participation in one or more subsidized programs) tobacco use, parity, chronic hypertension |
|
|
Author, Year Country, Setting Sample Size Baseline BMI Quality |
Pregravid Weight (How Measured) Total Weight Gain (How Measured) |
Definition of Groups |
|
Murakami et al., 200552 |
Pregravid weight: Self-reported at first visit |
G1: < 8.5 kg gain G2: 8.5-12.5 kg gain G3: > 12.5 kg gain |
|
Japan hospital data |
||
|
633 |
Total weight gain: Measured on admission for birth |
|
|
All BMIs |
||
|
Fair |
||
|
Ogunyemi et al., 199860 |
Pregravid weight: Self-reported |
G1: “low weight gain” G2: “normal weight gain” G3: “high weight gain” |
|
USA, rural Alabama |
||
|
582 |
Total weight gain: Weight at last prenatal visit |
|
|
All BMIs |
||
|
Fair |
||
|
Thorsdottir et al., 200253 |
Pregravid weight: Self-reported |
G1: < 11.5 kg gain G2: 11.5-16.0 kg gain G3: 16.1-20.0 kg gain G4: > 20 kg gain |
|
Iceland, university hospital |
||
|
615 |
Total weight gain: Maternity records (no specifics offered) |
|
|
BMI: 19.5-25.5 |
||
|
Fair |
||
|
Bianco et al., 199854 |
Pregravid weight: Self-reported |
Reported only for BMI > 35: |
|
USA, New York Medical Center Database |
G1: weight loss or no gain G2: 1-15 lb gain G3: 16-25 lb gain G4: 26-35 lb gain G5: > 35 lb gain |
|
|
Total weight gain: Computed on measured weight within 4 weeks of delivery |
||
|
11,840 |
||
|
Nonobese (BMI 19-27) and morbidly obese (BMI > 35) ages 20-34 |
||
|
Poor |
||
|
Brennand et al., 200549 |
Pregravid weight: Measured weight ≤ 14 wk GA used as proxy |
G1: “Low weight gain” G2: “Acceptable weight gain” G3: “Excessive weight gain” |
|
Quebec, Canada, First Nation’s People (Cree) |
||
|
603 |
Total weight gain: Computed on last recorded weight within 4 wks of giving birth |
All categories per Canadian Guidelines |
|
BMI ≥ 18.5 |
||
|
Poor |
|
Results |
|
|
Confounders and Effect Modifiers Included in Analysis |
|
Estimated OR (95% CI) preeclampsia |
Maternal age, parity, smoking, weight gain, gestational weeks; pregravid BMI |
||
|
G1: 0.74 (0.37-1.48) G2: 1 G3: 0.57 (0.24-1.32) |
|
||
|
Incidence preeclampsia: G1: 10% G2: 7% G3: 19% (P = < .01) |
|
Age, parity, pregravid BMI, tobacco use, hypertension |
|
|
% gestational HTN G1: 1.5% G2: 4.6% G3: 5.1% G4: 9.2% (P = 0.026) |
% preeclampsia G1: 1.4% G2: 2.3% G3: 5.4% G4: 4.4% (P = 0.262) |
Age, parity, height, gestational age |
|
|
Incidence PIH G1: 11.8% G2: 13.7% G3: 13.7% G4: 12.4% G5: 21.3% |
|
Race, parity, clinic service, substance abuse, and preexisting medical conditions |
|
|
(P = NS) |
|
||
|
HTN disorders G1: 7.3% G2: 12.5% G3: 19.3% (P = 0.051) |
PIH: G1: 3.7% G2: 6.3% G3: 4.4% (P = 0.698) |
Preeclampsia G1: 3.7% G2: 6.3% G3: 14.9% (P = 0.013) |
None reported |
|
Author, Year Country, Setting Sample Size Baseline BMI Quality |
Pregravid Weight (How Measured) Total Weight Gain (How Measured) |
Definition of Groups |
|
Jensen et al., 200559 |
Pregravid weight: Self-reported |
G1: < 5 kg gain G2: 5.0-9.9 kg gain G3: 10.0-14.9 kg gain G4: ≥ 15.0 kg gain |
|
Danish medical centers |
||
|
481 |
Total weight gain: Details not provided |
|
|
BMI ≥ 30 |
||
|
Poor |
||
|
Kabiru and Raynor, 200451 |
Pregravid weight: First prenatal visit |
BMI < 25 first assessment: G1: no change BMI category G2: increase 1 category G3: increase > 1 category |
|
USA Atlanta, public hospital database |
||
|
Total weight gain: Computed on weight at admission for birth |
||
|
5,131 |
BMI ≥ 25 first assessment: G4: no change BMI category G5: increase 1 category G6: increase > 1 category |
|
|
Poor |
||
|
BMI ≥ 20 |
||
|
Wataba et al., 200661 |
Total weight gain: Computed by delivery weight less pregravid weight (no details on how assessed) divided by gestational age |
Separate analyses done for low, medium and high pregravid weight groups by following intervals of kg/week gain: < 0.15: 0.15-.20; 0.20-.25; 0.25-.30; 0.30-.35; 0.35-40; > 0.40 |
|
Japanese medical center |
||
|
21,718 |
||
|
All BMIs |
||
|
Poor |
||
|
AOR, adjusted odds ratio; BMI, body mass index; CI, confidence interval; G, group; GA, gestational age; HTN, hypertension; kg, kilogram; lb, pounds; NS, not significant; OGTT, oral glucose tolerance test; OR, odds ratio; PIH, pregnancy-induced hypertension; USA, United States of America; wt, weight; wts, weights. |
||
gain and the development of either gestational hypertension or preeclampsia were not significantly associated.
In a retrospective cohort study of 603 Cree women in Canada (rated poor quality), Brennand et al.49 found that overweight and obese women had a significant unadjusted OR of 2.25 to 4.25 times higher, respectively, than normal weight women for pregnancy-induced hypertension and 1.25 to 3.45 times higher for preeclampsia.
Three retrospective cohorts were limited to women who entered pregnancy with BMIs ≥ 30.4,54,59In a study of 481 Danish women, the authors,
|
Results |
Confounders and Effect Modifiers Included in Analysis |
|
OR (95% CI) gestational HTN G1: 1 G2: 2.1 (0.8-5.7) G3: 3.6 (1.3-9.8) G4: 4.8 (1.7-13.1) (P = 0.001) |
Results of 2 hour OGTT, age, pregravid BMI, gestational age, parity, smoking, ethnicity, and site of prenatal care |
|
Incidence preeclampsia G1: 1.9% G2: 3.2% G3: 1.6% (P = .203) |
Pregravid weight |
|
G4: 2.8% G5: 3.7% G6: 3.7% (P = .002) |
|
|
No clear trends for preeclampsia or severe preeclampsia by pregravid weight status and kg/week weight gains. AOR generally crossed 1.0 or had wide confidence intervals. |
|
using < 5 kg as the reference weight gain, found a statistically significant trend for development of pregnancy-associated hypertension with increasing weight (P = 0.0001).59 A U.S. study examined birth certificate data for 120,251 obese women classified according to the 1998 National Institute of Health obesity classes.4 The researchers found that the amount of weight gain associated with minimal risk for preeclampsia differed by class of obesity but that, in all classes, a gain of less than 15 pounds was protective. The third study (rated poor quality) specifically investigated pregnancy and neonatal risks associated with BMIs > 35 in 527 morbidly obese women.54
Although these women were more likely to experience obstetrical complications than a control population (BMIs 19-27), gestational weight gain did not affect the complication rate.
One other study did not support the association between weight gain and pregnancy-induced hypertension.52 In this study, 633 Japanese women who gave birth to a singleton infant at 24-42 weeks of gestational age were studied. Pregravid BMI categories were those defined by the IOM. At the time of the study (2005) the Japan Society of Obstetrics and Gynecology did not have a recent guideline for weight gain during pregnancy; as a result, researchers used the frequency distributions from their population to set quartiles regarding weight gain and then set the parameters for insufficient and excessive gains accordingly. In this study, insufficient gain was defined as less than 8.5 kg and excessive gain as 12.5 kg. Finding no significant influence on weight gain and various perinatal outcomes of the mother or infant, the research team used other cut-off points and was still unable to find an appropriate criterion for predicting risk. The authors stated that their sample size was not sufficient to prove a lack of significance. Of note, the mean pregravid BMI of the sample was 20.9 ± 2.8 and the mean weight gain was 10.5 kg ± 3.4. While this study was assessed to be of fair quality, it has little, if any, generalizability to the United States because our population of childbearing women is more racially and ethnically diverse and have a higher mean BMI.
Gallstones
Study characteristics Two studies reported on the relationship between weight gain in pregnancy and cholelithiasis (gallstones)62,63 (Evidence Table 5).
Overview of results Two studies (1 poor62 and 1 fair63) suggest a potential relationship between weight gain and cholelithiasis.
Detailed results One study reported on weight and the development of gallstones in a prospective study of 128 northern plains Native American and white women in 2004.63 Nine independent variables including BMI, prenatal weight gain, prenatal physical activity, dietary fat, iron supplementation, age, parity, history of gallbladder disease, and serum cholesterol were analyzed. Weight assessments during pregnancy were carefully collected; how pregravid weights were determined is not specifically stated. Gestational weight gain had a nonsignificant, partial correlation of 0.09 and a beta coefficient of 0.13. A case-control study (rated poor quality), using data abstracted from birth certificates, reported on 6,211 women from the state of Washington who had a gallstone-related diagnosis at delivery or in the first year postpartum between 1987 and 2001.62 Four controls
were randomly selected for each case and matched for year of delivery. Multiple logistic regression found an inverse relationship between gestational weight gain and gallbladder disease. The OR per kg was. 0.98 (95% CI, 0.97-0.99; P = < 0.001). Maternal age, race, BMI based on self-reported pregravid weight, GDM, and infant gestational age were accounted for in the analysis.
Maternal Intrapartum Outcomes
Premature rupture of membranes (PROM)
Study characteristics Investigators explored the relationship of gestational weight gain and the risks for premature rupture of membranes (PROM) in two studies (Evidence Table 6).64,65 One involved a total of 1,176 women who had experienced preterm delivery, defined as gestation ≤ 36 weeks, with PROM (n = 220), preterm delivery without PROM (n = 184), full-term delivery with PROM, defined as gestation ≥ 37 weeks, with at least 3 hours of PROM before the onset of labor, (n = 184), and 588 controls. Women were recruited following delivery at two academic medical centers in the United States.64 In another study,65 the investigators analyzed data for 62,167 women enrolled in the Danish National Birth Cohort who had pregravid weight and total weight gain recorded in the registry. They assessed the impact of obesity and gestational weight gain on the risk of various subtypes of preterm birth, including PROM. Pregravid weight and gestational gains were self-reported.
Overview of results Two fair studies64,65 suggest that low weight gain (< 21 pounds) or low rate of weight gain (< 275 g per week) is associated with a higher risk of PROM for full-term pregnancies and preterm pregnancies.
Results for categorical measures of weight gain. A retrospective case-control study,64 published in 1992, found that weight gain below the reference category of 21 pounds to 30 pounds significantly increased the risk of preterm delivery with PROM while weight gain above the reference category significantly reduced the risk of PROM. Similar trends were noted for full-term PROM. However, they were statistically significant only for gestational weight gain of 31 to 40 pounds when compared with women who gained 21 to 30 pounds (OR, 0.56; 95% CI, 0.33-0.94). Many potential confounders and effect modifiers were included in the analyses, including diet quality, BMI, age, race, parity, gestational iron supplementation, various medical conditions such as chlamydia that are considered risks for PROM, and smoking. The authors did not say if they adjusted for gestational age as a continuous variable. All variables, including pregravid
weight and total weight gain, were assessed through a questionnaire administered to most of the subjects within 72 hours of giving birth.
Results for rate of weight gain In the Danish cohort study, women with a weekly weight gain of less than 275 grams per week had an adjusted hazards ratio for PROM of 1.5 (95% CI, 1.2-1.7) compared with women gaining between 276 grams and 675 grams weekly. When compared with women with BMIs of 18.5 to 24.9, those with either low (< 18.5) or high (> 30) BMIs had significantly higher rates of preterm delivery with PROM. The authors adjusted for prepregnancy BMI, weight gain, parity, mother’s age, socio-occupational status, and lifestyle exposures in early pregnancy including smoking and alcohol exposure.65
Preterm labor
Study characteristics One poor study (Evidence Table 7) examined the relationship between gestational weight gain and preterm labor.66 Preterm labor was not defined. This study, set in the United States, examined data from 11,505 women at the Boston Hospital for Women. The study defined gestational weight gain as pounds gained per week (≤ 0.4, 0.41 to 0.65, 0.66 to 0.9, and > 0.9).
Overview of results One poor study suggested that weight gain below 0.65 to 0.9 pounds per week significantly increased the risk of preterm labor.66
Results After controlling for an extensive list of confounders and effect modifiers (race, height, prepregnancy weight, infant sex, maternal age, education, health insurance, marital status, planned pregnancy, parity, previous induced or spontaneous abortion, previous stillbirth, uterine exposure to diethylstilbestrol, incompetent cervix, uterine anomaly, maternal morbidity, substance abuse, caffeine use, and prenatal care), the study found that weight below the reference range of 0.66 to 0.9 pounds per week significantly increased the risk of premature labor (AOR for 0.41-0.65 pounds per week: 1.7, 95% CI, 1.3-2.1; AOR for ≥ 0.4 pounds per week: 3.0; 95% CI, 2.2-4.2). Weight gain above 0.9 pounds per week did not have a significant effect on premature labor.
Postterm pregnancy
Study characteristics One study58 used data from 245,526 pregnancies identified through the Swedish Medical Birth Registry (Evidence Table 8).
Overview of results One fair study found no evidence of association between gestational weight gain and postterm gestation.58
Results The author examined the effects of low (< 8 kg) and high weight gain (> 16 kg), compared with the effect of average weight gain (8-16 kg), on deliveries at > 41 weeks of gestation across strata of maternal pregravid BMI strata. After adjusting estimates for maternal age, parity, smoking in early pregnancy, and year of birth, no significant associations emerged between gestational weight gain and postterm gestational age. The study suggests that low or high gestational weight gain has no effect on postterm gestation.
Induction of labor
Study characteristics Five studies examined the relationship between gestational weight gain and labor induction (Table 6, Evidence Table 9) Of these, three were set in the United States,25,51,67 one in Denmark,59 and one in Finland.68 Of these five studies, three were of poor quality.51,59,68 Three examined induction of labor59,67,68 and two examined failed induction of labor (defined as a birth that required a cesarean delivery despite induction of labor).25,51 One of five studies was limited to obese, glucose-tolerant women,67 and one to women of normal weight;25 the other studies included women with a range of pregravid BMI. Each of the five studies defined gestational weight gain differently. Three used categories of gestational weight gain, with different cutpoints.25,59,67 One stratified its sample by weight gain categories, comparing women with normal prepregnancy weight and weight gain during pregnancy with those with abnormal weight gain during pregnancy, defined as ≥ 20 kg or ≤ 5 kg during pregnancy; the study did not specify the prepregnancy weight status of women in these “abnormal” weight gain categories.68 Another study characterized weight gain as change in BMI class between prepregnancy weight and weight at delivery.51 The study defined BMI categories as follows: normal, BMI 20 to 24.9; overweight, BMI 25 to 29.9; obese I, BMI 30 to 34.9; obese II, BMI 35 to 39.9; morbid obesity, BMI ≥ 40.51.
Overview of results Two fair25,67 and three poor51,59,68 studies examined the association of increased gestational weight gain and labor induction59,67,68 or failure of labor induction,25,51 and found a risk of labor induction or failure of induction with increased gestational weight gain.
Results The three studies that looked at induction of labor found a statistically significant increase in the risk of labor induction with increases in gestational weight gain.59,67,68 The magnitude of the effect across all three studies cannot be summarized because of differences in the definition of weight gain and in the nature of confounders controlled for in the analysis. Both studies examining failed induction of labor found a significant as-
TABLE 6. Gestational Weight Gain and Induction of Labor
|
Author, Date Country, Setting Sample Size Baseline BMI Quality |
Pregravid Weight (How Measured) Total Weight Gain (How Measured) |
Definition of Groups |
Results |
Confounders and Effect Modifiers Included in Analysis |
|
DeVader et al., 200725 |
Pregravid weight: Medical record: If missing, obtained from mother during postpartum hospital stay Total weight gain: Obstetrical records |
G1: < 30 lbs G2: 30-35 lbs G3: > 35 lbs |
AOR for failed induction of labor vs. other birth outcomes G1: 0.68 (95% CI, 0.59-0.78) G2: 1.0 G3: 1.51 (95% CI, 1.39-1.64) |
Maternal age, maternal race or ethnicity, maternal education, Medicaid status, tobacco use, alcohol use, maternal height, prior pregnancy, adequacy of prenatal care, child’s sex, and child’s birth year |
|
USA, birth certificate data |
||||
|
94,696 |
||||
|
Normal weight only |
||||
|
Fair |
||||
|
Graves et al., 200667 |
Pregravid weight: Actual prepregnant weight or early first trimester weight documented in medical records Total weight gain: Last prenatal assessment |
≤ 45 pounds vs. > 45 pounds |
OR induction of labor for > 45 lb: 1.5 (95% CI, 1.0-2.4) |
Maternal BMI, infant birthweight, and gestational age at delivery |
|
USA, midwifery practices |
||||
|
1,500 |
||||
|
All weights/BMI |
||||
|
Fair |
||||
|
Ekblad and Grenman, 199268 |
Pregravid weight: Data from records, unclear if self-reported Total weight gain: Last prenatal assessment |
G1: weight gain ≤ 5 kg G2: weight gain ≥ 20 kg G3: reference (normal prepregnancy weight and normal weight gain [undefined]) |
Percentage induced G1: 23% G2: 43% G3: 24 P < 0.05 for G2 vs. G3 |
NA |
|
Finland, hospital |
||||
|
357 |
||||
|
Normal weight only |
||||
|
Poor |
|
Jensen et al., 200559 |
Pregravid weight: Records or self-report of pregravid BMI Total weight gain: Last prenatal assessment |
G1: < 5.0 kg G2: GWG 5.0-9.9 kg G3: GWG 10.0-14.9 kg G4: GWG ≥ 15 kg |
OR for induction of labor G1: 1.0 G2: 2.7 (95% CI, 1.3-5.7) G3: 2.8 (95% CI, 1.3-5.9) G4: 3.7 (95% CI, 1.7-8.0) P for trend = 0.002 |
Age, pregravid BMI, 2 hour OGTT result, smoking, gestational age |
|
Denmark, university hospitals |
||||
|
481 |
||||
|
Obese only |
||||
|
Poor |
||||
|
Kabiru and Raynor, 200451 |
Pregravid weight: Weight at first prenatal visit Total weight gain: Weight at admission for birth |
G1: normal BMI, no change in BMI between first prenatal visit and delivery G2: normal BMI, 1 category increase in BMI between first prenatal visit and delivery G3: normal BMI, > 1 category increase in BMI between first prenatal visit and delivery G4: overweight BMI, no change in BMI between first prenatal visit and delivery G5: overweight BMI, 1 category increase in BMI between first prenatal visit and delivery G6: overweight BMI, > 1 category increase in BMI between first prenatal visit and delivery |
Percent failed induction of labor G1: 4.7 G2: 9.2 G3: 15.9 P < 0.001 |
NA |
|
USA, hospital |
||||
|
5,131 |
||||
|
All BMIs > 20 |
||||
|
Poor |
G4: 7.9 G5: 10.3 G6: 14.6 P < 0.001 |
|||
|
AOR, adjusted odds ratio; BMI, body mass index; G, group; GWG: gestational weight gain; OGTT, oral glucose tolerance test. |
||||
sociation between gestational weight gain and increase in the risk of failed induction compared with all other delivery routes.25,51
Length of labor
Study characteristics Three cohort studies, set in Finland and the United States, examined the association between gestational weight gain and labor (Table 7, Evidence Table 10).68-70 Two studies focused on length of labor,68,69 one on labor abnormalities.70 The definition of gestational weight gain differed across studies. One study examined an overall increase in weight of > 25 percent or ≤ 25 percent for women with normal pregravid weight (90-120 percent of normal weight for height based on Metropolitan Life Insurance Company Table for 1983).69 Another reported on categories of gestational weight gain (< 16 pounds, 16-25 pounds, 26-35 pounds, and > 35 pounds) for pregravid BMI categories defined by the IOM.70 The third study, of poor quality, stratified its sample by weight gain categories, comparing women with normal prepregnancy weight and weight gain during pregnancy with those with abnormal weight gain (≥ 20 kg, or ≤ 5 kg) during pregnancy; the study did not specify the prepregnancy weight status of women in these “abnormal” weight gain categories.68
Overview of results Two of three studies (2 fair,69,70 1 poor68) suggested that higher weight gain among normal weight women of normal weight was associated with longer labor.68,69
Results The two studies that examined length of labor demonstrated significantly longer second stage of labor for women with high weight gain, based on samples of 35,768 and 10,469 respectively. Neither study controlled for confounders or effect modifiers.
The study that reported on labor abnormalities found higher odds of labor abnormalities for women gaining > 35 pounds compared with women gaining < 16 pounds. These odds lost statistical significance when adjusted for confounders. In a trend analysis, the study found a higher risk of labor abnormalities with increased weight gain, suggesting that a difference of 10 pounds corresponds to an OR of 2 (P < 0.0001) after adjusting for BMI, patient care (private vs. nonprivate), parity, infant sex, hypertension, and macrosomia.70
Mode of delivery
Study characteristics Twenty-one cohort studies reported on the relationship between gestational weight gain and mode of delivery (Table 8, Evidence Table 11).4,25,49,51,52,54,58,59,61,67-78 Thirteen studies were set in the United States,4,25,51,54,67,69-71,73-77 three in Canada,49,53,72,78 two in Ja-pan,52,61 one in Sweden,58 one in Denmark,59 and one in Finland.68
TABLE 7. Gestational Weight Gain and Length of Labor
|
Author, Date Country, Setting Sample Size Baseline BMI Quality |
Pregravid Weight (How Measured) Total Weight Gain (How Measured) |
Definition of Groups |
Results |
Confounders and Effect Modifiers Included in Analysis |
|
Johnson et al., 199270 |
Pregravid weight: Self-report collected at first antepartal visit |
G1: total weight gain < 16 pounds G2: total weight gain 16-25 pounds G3: total weight gain 26-35 pounds G4: total weight gain > 35 pounds |
Elevated odds of labor abnormalities only in the group gaining > 35 pounds compared with women gaining < 16 pounds; not significant when adjusted for confounders |
Prepregnancy weight quartile, height (tertile), BMI category, race/ethnicity, marital status, private physician, parity, infant sex, maternal age, hypertension, and birthweight |
|
USA, prenatal clinics |
||||
|
3,191 |
||||
|
Total weight gain: Last prenatal visit |
||||
|
All weights/BMI |
Trend analysis showed risk of labor abnormalities with increased weight gain, a difference in 10 lb. corresponds to OR = 2 (P < 0.0001) after adjusting for BMI, patient care (private vs. nonprivate), parity, infant sex, hypertension, and macrosomia |
|||
|
Fair |
||||
|
Purfield and Morin, 199469 |
Pregravid weight: Self-report as noted in medical chart |
G1: prepregnant weight increased by 25% or less G2: prepregnant weight increased by more than 25% |
Normal weight primigravidas with a low risk pregnancy who gained an excessive amount of weight had a longer mean length of second stage labor than women who gained less weight |
NA |
|
USA, Tertiary care medical center |
||||
|
Total weight gain: Weight at admission to hospital for birth |
||||
|
104 |
Minutes of length of second stage in minutes by weight groups (SD): G1: 72.42 (46.69) G2: 93.28 (52.87) t = −2.05 P = 0.02 |
|||
|
Normal weight women only |
||||
|
Fair |
|
Author, Date Country, Setting Sample Size Baseline BMI Quality |
Pregravid Weight (How Measured) Total Weight Gain (How Measured) |
Definition of Groups |
Results |
Confounders and Effect Modifiers Included in Analysis |
|
Ekblad and Grenman, 199268 |
Pregravid weight: Data from records, unclear if self-reported |
G1: weight gain ≤ 5 kg G2: weight gain ≥ 20 kg G3: reference (normal prepregnancy weight and normal weight gain [undefined]) |
Labor pattern-I stage (minutes ± SD) G1: 333 ± 208 G2: 374 ± 208 G3: 346 ± 188 |
NA |
|
Finland, hospital |
||||
|
357 |
Labor pattern-II stage (minutes) G1: 15 ± 18) P < 0.05 compared to reference category G2: 27 ± 25 G3: 21 ± 18 Labor pattern-III stage (minutes) G1: 13 ± 13 G2: 13 ± 11 G3: 12 ± 12 |
|||
|
Total weight gain: Last clinically measured weight prior to delivery |
||||
|
Normal weight only |
||||
|
Poor |
||||
|
BMI, body mass index; G, group; SD, standard deviation. |
||||
All 21 studies examined cesarean delivery as an outcome. Five examined instrumental delivery in addition to cesarean delivery.25,51,58,68,69 Eight studies reported on cesarean delivery without providing further definition.4,25,49,54,58,59,74,76 The studies that offered some detail varied in their definition; these studies defined cesarean delivery as failure to progress,51 unscheduled cesarean,67,70 cesarean including elective and emergency,52 elective cesarean and emergency cesarean,61,68 cephalopelvic disproportion/failure to progress, fetal distress, breech, and other indications,73 cesarean delivery for cephalic presentation,77 and cesarean delivery for singleton cephalic presentation separately analyzed for primary and repeat cesareans, with and without labor.78 A key consideration in assessing the risk of cesarean delivery is the route of previous delivery; with the declining prevalence of vaginal birth after cesarean (VBAC), a history of prior cesarean delivery is likely to result in cesareans for all subsequent pregnancies. Studies that fail to account for prior route of delivery cannot therefore control for its confounding effect. Eleven studies did not take into account prior route of delivery.4,25,49,52,54,58,59,61,67,68,70
Definitions of gestational weight gain also varied greatly. Some studies used categorical definitions designed to identify high weight gain alone,67,71 weight gain across a spectrum of gain,4,25,49,52,54,58,59,70,72,74,77 continuous weight gain,73,76 rate of weight gain,61,78 and weight gain in relation to pregravid weight.51,68,69,75
Overview of results Across the 14 fair4,25,52,58,67,69-73,75-78 and 7 poor49,51,54,59,61,68,74 studies that examined gestational weight gain as a predictor of route of delivery, only four (2 poor) failed to show an effect of gestational weight gain on route of delivery.49,52,54,67 The remainder demonstrated higher risks of cesarean delivery associated with gestational weight gain, with some evidence suggesting more pronounced risks associated with high pregravid BMI status. Notably, only 10 studies controlled for route of previous delivery. Of these, five controlled for co-morbidities that could have been significant confounders for route of delivery.71,72,75,76,78 One study explicitly examined the interactions between weight gain and pregravid weight; it did not find any significant effect.77
Results across BMI categories for categorical measures of weight gain. Fifteen studies considered weight gain across a range of pregravid weight categories. Of these, two fair studies defined gestational weight gain as a categorical variable (≤ 45 pounds vs. > 45 pounds,67 and < 41 vs. ≥ 41 pounds71). One of these two studies, limited to primary cesarean, found a significant association between weight gain and cesarean delivery (AOR, 1.38; 95% CI, 1.34-1.41).71 This study found pregravid BMI, diabetes, and hypertension to also be strong predictors of cesarean delivery. The other,
TABLE 8. Gestational Weight Gain and Mode of Delivery
|
Author, Date Country, Setting Sample Size Baseline BMI Quality |
Pregravid Weight (How Measured) Total Weight Gain (How Measured) |
Definition of Groups |
|
Cedergren, 200658 |
Pregravid weight: Self-report; if unknown, standardized measurement is made during first visit to maternity health care center |
Weight gain < 8 kg, 8-16 kg, and > 16 kg for each BMI class below |
|
Sweden, Medical Birth Registry |
||
|
245,526 |
G1: BMI < 20 G2: BMI 20-24.9 G3: BMI 25-29.9 G4: BMI 30-34.9 G5: BMI ≥ 35 |
|
|
All weights/BMI |
Total weight gain: Measured when woman entered delivery unit |
|
|
Fair |
||
|
Chen et al., 200473 |
Pregravid weight: Weight taken at first prenatal visit if presented before 20 weeks; if after 20 weeks, self report |
Gestational weight gain in lbs |
|
USA, private practice |
||
|
3,355 |
||
|
All weights/BMI |
||
|
Fair |
Total weight gain: Last clinically measured weight prior to delivery |
|
|
DeVader et al., 200725 |
Pregravid weight: Medical record; if missing, obtained from mother during postpartum hospital stay |
G1: < 30 lbs G2: 30-35 lbs G3: > 35 lbs |
|
USA, birth certificate data |
||
|
94,696 |
||
|
Normal weight only |
||
|
Fair |
Total weight gain: Obstetrical records |
|
Results |
|
Confounders and Effect Modifiers Included in Analysis |
|
AOR for weight gain < 8 kg for cesarean section compared with weight gain 8-16 kg (95% CI) G1: 1.07 (0.89-1.29) G2: 0.98 (0.92-1.05) G3: 0.88 (0.82-0.95) G4: 0.81 (0.73-0.90) G5: 0.75 (0.66-0.87) |
AOR for weight gain < 8 kg for instrumental delivery compared with weight gain 8-16 kg (95% CI) G1: 0.89 (0.71-1.11) G2: 0.88 (0.80-0.96) G3: 0.85 (0.76-0.95) G4: 0.75 (0.63-0.88) G5: 0.83 (0.65-1.03) |
Maternal age, parity, smoking in early pregnancy, and year of birth |
|
AOR for weight gain > 16 kg for cesarean section compared with weight gain 8-16 kg (95% CI) G1: 1.29 (1.17-1.43) G2: 1.24 (1.19-1.29) G3: 1.23 (1.17-1.30) G4: 1.22 (1.10-1.35) G5: 1.27 (1.05-1.52) |
AOR for weight gain > 16 kg for instrumental delivery compared with weight gain 8-16 kg (95% CI) G1: 1.28 (1.15-1.43) G2: 1.19 (1.14-1.25) G3: 1.14 (1.06-1.23) G4: 1.09 (0.93-1.27) G5: 1.04 (0.77-1.40) |
|
|
Progression of AOR of cesarean delivery weight gain (for every 5 lbs): 1.094 (1.074-1.115) |
BMI, maternal height, maternal age, pregnancy weight gain, gestational age at delivery, and fetal birthweight |
|
|
AOR for cesarean (95% CI): G1: 0.82 (0.78-0.87) G2: 1.0 G3: 1.35 (1.29-1.40) |
Maternal age, maternal race or ethnicity, maternal education, Medicaid status, tobacco use, alcohol use, maternal height, prior pregnancy, adequacy of prenatal care, child’s sex, and child’s birth year |
|
|
AOR for instrumental (95% CI): G1: 0.97 (0.90-1.04) G2: 1.0 G3: 1.03 (0.97-1.08) |
||
|
Author, Date Country, Setting Sample Size Baseline BMI Quality |
Pregravid Weight (How Measured) Total Weight Gain (How Measured) |
Definition of Groups |
|
Graves et al., 200667 |
Pregravid weight: Actual prepregnant weight or early first trimester weight documented in medical records |
≤ 45 lbs vs. > 45 lbs |
|
USA, midwifery practices |
||
|
1,500 |
||
|
All weights/BMI |
||
|
Fair |
Total weight gain: Last prenatal assessment |
|
|
Jain et al., 200777 |
Pregravid weight: Not stated |
G1: WG ≤ 15 lbs G2: WG 15-24 lbs G3: WG 25-35 lbs G4: WG ≥ 35 lbs |
|
USA, birth certificate records and Pregnancy Risk Assessment Monitoring System |
||
|
Total weight gain: Birth certificate |
||
|
7,661 |
||
|
All weights/BMI |
||
|
Fair |
||
|
Johnson et al., 199270 |
Pregravid weight: Self report collected at first antepartal visit |
G1: total weight gain < 16 lbs G2: total weight gain 16-25 lbs G3: total weight gain 26-35 lbs G4: total weight gain > 35 lbs |
|
USA, prenatal clinics |
||
|
3,191 |
Total weight gain: Last prenatal visit |
|
|
All weights/BMI |
||
|
Fair |
||
|
Joseph et al., 200372 |
Pregravid weight: Data taken from standardized forms and hospital medical records—no mention of self report |
G1: < 5 kg G2: 5-9 kg G3: 10-14 kg G4: 15-19 kg G5: ≥ 20 kg |
|
Nova Scotia Atlee Perinatal Database |
||
|
100,259 |
||
|
All weights/BMI |
Total weight gain: Not explained by authors—data taken from maternity records |
|
|
Fair |
|
Results |
|
Confounders and Effect Modifiers Included in Analysis |
|
Greater weight gain in pregnancy was not associated significantly with route of delivery |
Prepregnancy BMI category, total prenatal weight gain category, induction of labor, newborn birthweight ≥ 4,000 g, gestational age > 41 weeks, and race/ethnicity |
|
|
AOR for primiparous cesarean delivery (from model including interaction term for overweight/obese + > 25 lbs weight gain) G1: 0.95 (0.59-1.52) G2: 1.0 (ref) G3: 1.10 (0.76-1.60) G4: 1.62 (1.10-2.39) |
AOR for multiparous cesarean delivery (from model including interaction term for overweight/obese + > 25 lbs weight gain) G1: 1.11 (0.60-2.04) G2: 1.0 (ref) G3: 1.08 (0.63-1.85) G4: 1.95 (1.02-3.72) |
Maternal age, pregravid BMI, parity, education, race/ethnicity, US/foreign origin, interaction terms for pregravid BMI and weight gain |
|
AOR for unscheduled cesarean (95% CI) G1: 1.0 G2: 0.95 (0.6-1.5) G3: 1.3 (0.86-1.95) G4: 1.95 (1.32-2.87) |
Prepregnancy weight quartile, height (tertile), BMI category, private physician (yes/no), maternal age, parity, birthweight, diabetes, hypertension, and maternal education |
|
|
AOR for cesarean delivery (95% CI) G1: 1.10 (1.00-1.20) G2: 1.04 (0.99-1.10) G3: 1.00 G4: 1.09 (1.05-1.14) G5: 1.41 (1.35-1.47) |
Age, parity, prepregnancy weight, smoking, pregnancy (singleton or multiple), hypertension, diabetes, previous fetal death, induction, epidural, physician type, time |
|
|
Author, Date Country, Setting Sample Size Baseline BMI Quality |
Pregravid Weight (How Measured) Total Weight Gain (How Measured) |
Definition of Groups |
|
Kiel et al., 20074 |
Pregravid weight: Self report from data on birth certificate |
All obese women |
|
USA, birth registry |
G1: Loss 10 lbs or more G1: Loss 2-9 lbs G1: No change G1: Gain 2-9 lbs G1: Gain 10-14 lbs G1: Gain 15-25 lbs G1: Gain 25-35 lbs |
|
|
120,170 |
Total weight gain: Abstracted from medical chart |
|
|
Obese women only |
||
|
Fair |
||
|
Murakami et al., 200552 |
Pregravid weight: Self report at first visit to clinic |
G1: < 8.5 kg G2: 8.5-12.5 kg G3: > 12.5 kg |
|
Japan, hospital |
||
|
633 |
||
|
Total weight gain: Based on last clinically measured weight prior to delivery |
||
|
All weights/BMI |
||
|
Fair |
||
|
Purfield and Morin, 199569 |
Pregravid weight: Self report as noted in medical chart |
G1: prepregnant weight increased by 25% or less G2: prepregnant weight increased by more than 25% |
|
USA, Tertiary care medical center |
||
|
104 |
Total weight gain: Weight at admission to hospital for birth |
|
|
Normal weight women only |
||
|
Fair |
||
|
Rosenberg et al., 200571 |
Pregravid weight: Self report on birth certificate |
< 41 vs. ≥ 41 pounds |
|
USA, vital statistics data |
||
|
329,988 |
Total weight gain: Weight data on birth file |
|
|
All weights/no BMI |
||
|
Fair |
|
Results |
|
Confounders and Effect Modifiers Included in Analysis |
|
Compared with women who gained 15-25 lbs during their pregnancies, those who gained less weight had significantly lower odds of preeclampsia, cesarean delivery, and LGA births, but higher odds for SGA births |
Age, race, parity, education, poverty (enrollment in Medicaid, WIC, food stamp programs), tobacco use, chronic hypertension |
|
|
Magnitude differed by obesity classification, even after adjusting for known or suspected confounders |
||
|
AOR for cesarean delivery (95% CI) G1: 1.08 (0.56-2.07) G2: 1.00 G3: 1.23 (0.61-2.48) |
Maternal age, parity, smoking, prepregnancy BMI, and gestational age (weeks) |
|
|
Higher rate of vacuum extraction and cesarean delivery and lower rate of spontaneous vaginal delivery with excessive weight gain |
Vacuum extraction G1: n = 14 G2: n = 25 |
NA |
|
low forceps G1: n = 8 G2: n = 8 |
||
|
No difference in forceps delivery and vaginal delivery by weight gain status |
Cesarean section G1: n = 3 G2: n = 10 χ2 = 15.87, P = 0.001 for all 4 modes of delivery by weight groups |
|
|
Vaginal delivery G1: n = 27 G2: n = 9 |
||
|
AOR for primary cesarean (95% CI): 1.38 (1.34-1.41) |
Age, parity, GDM, pregnancy-induced hypertension, preeclampsia, prepregnancy weight, chronic diabetes, chronic hypertension, marital status, maternal education, mother’s birthplace, prenatal care payer, social risk, trimester prenatal care began |
|
|
Author, Date Country, Setting Sample Size Baseline BMI Quality |
Pregravid Weight (How Measured) Total Weight Gain (How Measured) |
Definition of Groups |
|
Shepard et al., 199875 |
Pregravid weight: Self report before 15 weeks of gestation |
Proportional weight gain (total weight gain/prepregnancy weight) and absolute weight gain |
|
USA, obstetrical practices |
||
|
2,301 |
||
|
Total weight gain: Self report of weight at delivery |
||
|
All weights/BMI |
||
|
Fair |
||
|
Sherrard et al., 200778 |
Pregravid weight: Self report |
Rate of weight gain (kg/wk) G1: Low (≤ 0.17) G2: Normal (0.18-0.50) G3: High (> 0.50) |
|
Canada, hospital database |
||
|
63,390 |
Total weight gain: Self report or measured |
|
|
All BMIs |
||
|
Fair |
||
|
Witter et al., 199576 |
Pregravid weight: Self report, unclear at what timepoint |
Pregnancy weight gain (kg) |
|
USA,obstetric database at major medical center |
||
|
4,346 |
Total weight gain: Weight recorded at last prenatal visit |
|
|
All weights/BMI |
||
|
Fair |
|
Results |
|
Confounders and Effect Modifiers Included in Analysis |
|
G1: Proportional Gain: Adjusted Relative Risk (95% CI) G2: Absolute Gain: Adjusted RR (95% CI) Underweight (< 19.4), ≤ median G1: 1.00 G2: 1.00 |
Low-Average (19.5-22.4), > median G1: 2.35 (1.06-5.21) G2: 1.62 (0.94-3.02) |
Preeclampsia, gestational diabetes, placental problems, fetal distress, macrosomia, induction, maternal age and height, parity, ethnicity, and marital status |
|
High-Average (22.5-28.4), ≤ median G1: 2.78 (1.26-6.12) G2: 1.80 (1.01-3.21) |
||
|
Underweight (< 19.4), > median G1: 2.08 (0.86-5.04) G2: 1.20 (0.56-2.59) |
High-Average (22.5-28.4), > median G1: 3.06 (1.40-6.73) G2: 2.02 (1.14-3.57) |
|
|
Low-Average (19.5-22.4), ≤ median G1: 1.62 (0.90-3.67) G2: 1.00 (0.54-1.84) |
Obese (> 28.5), ≤ median G1: 3.25 (1.40-7.54) G2: 2.13 (1.12-4.08) |
|
|
Obese (> 28.5), > median G1: 2.69 (1.18-6.16) G2: 1.65 (0.90-3.03) |
||
|
AOR for unlabored cesarean, primary G1: 0.79 (0.59-1.05) G2: 1.00 (ref) G3: 1.03 (0.64-1.64) |
AOR for unlabored cesarean, repeat G1: 0.91 (0.76-1.09) G2: 1.00 (ref) G3: 1.38 (1.04-1.83) |
BMI, gestational diabetes, pregnancy-induced hypertension, macrosomia, socioeconomic factors, parity, and maternal age |
|
AOR for labored cesarean, primary G1: 0.77 (0.68-0.86) G2: 1.00 (ref) G3: 1.40 (1.23-1.60) |
AOR for labored cesarean, repeat G1: 0.79 (0.54-1.15) G2: 1.00 (ref) G3: 1.22 (0.72-2.09) |
|
|
AOR for cesarean (95% CI): 1.04 (1.02-1.05) |
Age, pregravid BMI, height, at least one previous viable pregnancy, diagnosis of preeclampsia during the current pregnancy, previous cesarean delivery |
|
|
Author, Date Country, Setting Sample Size Baseline BMI Quality |
Pregravid Weight (How Measured) Total Weight Gain (How Measured) |
Definition of Groups |
|
Bianco et al., 199854 |
Pregravid weight: Unclear |
G1: 0 or weight loss G2: 1-15 lbs G3: 16-25 lbs G4: 26-35 lbs G5: > 35 lbs |
|
USA, major medical center |
||
|
11,926 |
Total weight gain: Weight from before 36 weeks gestation or not within 4 weeks of delivery |
|
|
BMI OF 27 and 34 are excluded from analysis |
||
|
Poor |
Maternal weight gain outcomes by BMI presented for morbidly obese women only, N: 613 |
|
|
Brennand et al., 200549 |
Pregravid weight: Routine prenatal care medical records, measured within 14 weeks of gestation |
Primigravid women (maternal weight gain outcomes by BMI presented only for obese women) G1: Obese—low weight gain (< 7 kg) G2: Obese—acceptable weight gain (7-11.5 kg) G3: Obese—excessive weight gain (> 11.5 kg) G4: Total |
|
Canada, medical records |
||
|
603 |
||
|
All weights/BMI |
||
|
Total weight gain: Based on last clinically measured weight prior to delivery: within 4 weeks of birth |
||
|
Poor |
||
|
Primigravid women (maternal weight gain outcomes by BMI presented only for obese women) |
||
|
Ekblad and Grenman, 199268 |
Pregravid weight: Data from records, unclear if self reported |
G1: weight gain < 5 kg G2: weight gain ≥ 20 kg G3: reference (normal prepregnancy weight and normal weight gain [undefined]) |
|
Finland, hospital |
||
|
357 |
Total weight gain: Routine prenatal care or maternity records based on last clinically measured weight prior to delivery |
|
|
Normal weight only |
||
|
Poor |
|
Results |
|
Confounders and Effect Modifiers Included in Analysis |
|
Cesarean % G1: 25.8% G2: 26.8% G3: 28.8% G4: 35.0% G5: 33.8% (P = NS) |
|
NA |
|
Cesarean section (%) G1: 25.3 G2: 23.5 G3: 23.7 |
|
NA |
|
χ2P = 0.952 G4: 24.1 |
|
|
|
Normal vaginal delivery (%) G1: 90 P < 0.05 compared to reference category G2: 64 G3: 71 |
Breech (%) G1: 1 G2: 0 G3: 2 |
NA |
|
Cesarean section—elective% G1: 3 G2: 5 G3: 13 |
||
|
Forceps or vacuum delivery (%) G1: 3 G2: 13 G3: 5 |
||
|
Cesarean section—emergency% G1: 3 G2: 18 G3: 9 |
|
Author, Date Country, Setting Sample Size Baseline BMI Quality |
Pregravid Weight (How Measured) Total Weight Gain (How Measured) |
Definition of Groups |
|
Jensen et al., 200559 |
Pregravid weight: Records or self report of pregravid BMI |
G1: GWG 5.0-9.9 kg G2: GWG 10.0-14.9 kg G3: GWG ≥ 15 kg |
|
Denmark, university hospitals |
||
|
481 |
Total weight gain: Last prenatal assessment |
|
|
Obese only |
||
|
Poor |
||
|
Kabiru and Raynor, 200451 |
Pregravid weight: First prenatal visit |
Primary cesarean G1: normal BMI, no change in BMI between first prenatal visit and delivery G2: normal BMI, 1 category increase in BMI between first prenatal visit and delivery G3: normal BMI, > 1 category increase in BMI between first prenatal visit and delivery G4: overweight BMI, no change in BMI between first prenatal visit and delivery G5: overweight BMI, 1 category increase in BMI between first prenatal visit and delivery G6: overweight BMI, > 1 category increase in BMI between first prenatal visit and delivery |
|
USA, hospital |
||
|
5,131 |
Total weight gain: Weight at admission for birth |
|
|
All BM’s > 20I |
||
|
Poor |
|
Results |
Confounders and Effect Modifiers Included in Analysis |
|
OR for cesarean delivery (95% CI) G1: 1.0 G2: 2.4 (1.1-5.3) G3: 3.0 (1.4-6.4) G4: 3.6 (1.6-7.8) P for trend = 0.002 |
2-h OGTT result, maternal age, prepregnancy BMI, gestational age (continuous variables), parity, smoking, ethnic background, and clinical center (categorical variables |
|
Operative vaginal delivery G1: 11.4 G2: 12.4 G3: 12.2 P = 0.837 G4: 8.4 G5: 11.4 G6: 17.3 P < 0.001 |
Pregravid BMI, none other |
|
Cesarean delivery rate for failure to progress G1: 2.5 G2: 6.5 G3: 10.2 P = 0.203 G4: 3.5 G5: 6.9 G6: 10.2 P = 0.002 |
|
Author, Date Country, Setting Sample Size Baseline BMI Quality |
Pregravid Weight (How Measured) Total Weight Gain (How Measured) |
Definition of Groups |
|
Wataba et al., 200661 |
Pregravid weight: Unreported |
Rate of weight gain, categorized differently across different BMI groups |
|
Japan, academic medical center |
||
|
Total weight gain: From hospital database/register |
||
|
21,718 |
||
|
All weights/BMI |
||
|
Poor |
||
|
Young et al., 200274 |
Pregravid weight: Self reported |
G1: < 30 lbs G2: 30-35 lbs G3: > 35 lbs |
|
USA, private practice |
||
|
3,375 |
Total weight gain: Based on last clinically measured weight prior to delivery |
|
|
All weights/BMI |
||
|
Poor |
||
|
AOR, adjusted odds ratio; BMI, body mass index; G, group; GDM, gestational diabetes mellitus; kg, kilogram; lbs, pounds; LGA, large-for-gestational age; SGA, small-for-gestational age. |
||
which did not control for route of previous delivery, did not find any association between gestational weight gain and route of delivery.67
Six studies defined gestational weight gain in categories that allowed for the identification of both low and high weight gain, across a spectrum of pregravid weight categories;52,58,70,72,74 of these, one was rated poor quality74 and the remainder fair. One study showed no difference in cesar-
|
Results |
|
Confounders and Effect Modifiers Included in Analysis |
|
For nulliparous, low BMI women: Higher risk of cesarean delivery for women with weight gain ≥ 0.4 kg/week (AOR: 2.30 [95% CI, 1.06-4.98] compared with women gaining 0.25-0.3 kg/week) |
For nulliparous, high BMI women: No increased risk |
Parity, baseline BMI |
|
For parous, medium BMI women: Higher risk of cesarean delivery for women with weight gain 0.25-0.3 kg/week (AOR: 1.49 [95% CI, 1.09-2.04] compared with women gaining 0.20-0.25 kg/week) |
||
|
For nulliparous, medium BMI women: Higher risk of cesarean delivery for women with weight gain ≥ 0.4 kg/week (AOR: 1.61 [95% CI, 1.21-2.14] compared with women gaining 0.25-0.3 kg/week) and for women with weight gain 0.35-0.4 kg/week (AOR: 1.68 [95% CI, 1.22-2.30] compared with women gaining 0.25-0.3 kg/week) |
||
|
No data presented on cesarean delivery for other BMI groups for parous women |
||
|
Increase in overall cesarean delivery rate with increased weight gain was significant at all BMI levels |
|
BMI |
ean delivery by weight gain category.52 All others showed some patterns of association with higher levels of weight gain, although the magnitude of the effect varied.58,70,72,74 Three studies found similar thresholds for the rise in risk of cesarean delivery, namely, weight gains in excess of 15 kg72 or greater than 35 pounds.70,77 One study looked at both relatively low weight gain (< 8 kg) and relatively high weight gain (> 16 kg) in comparison with
weight gain of 8 to 16 kg.58 The study found no statistically significant risk of cesarean delivery for low or normal BMI categories but significantly higher risk with higher weight gain for overweight, obese, and morbidly obese women.58 One study examined the effects of pregravid weight, gestational weight gain, and the interaction between the two as predictors of cesarean delivery for primiparous and multiparous women (defined in two different ways). The study found that pregravid overweight or obese status as well as weight gain over 35 pounds are associated with the risk of cesarean delivery for primiparous women, but no significant effect of the interaction between weight gain and pregravid weight. The study did not find consistently significant effects of these variables on cesarean delivery for multiparous women; the previous route of delivery, a likely confounder, was not controlled in these analyses.
Results across BMI categories for rate of weight gain. Two studies, one rated fair78 and the other poor,61 examined the rate of weight gain across a range of pregravid weight categories. The fair study separately examined the risks of primary and repeat cesarean, with and without labor in models that accounted for gestational diabetes, pregnancy-induced hypertension, macrosomia, socioeconomic factors, parity, or maternal age. The study found that a high rate of weight gain (> 0.5 kg/week) significantly increased the risk of a labored primary cesarean, while a low rate of weight gain (≤ 0.17 kg/week) significantly reduced the risk, compared with an average rate of weight gain (0.18-0.50 kg/week). High rate of weight gain significantly increased the risk of unlabored repeat cesareans. The rate of weight gain during pregnancy did not predict the risk of primary unlabored cesarean or repeat labored cesarean. In contrast, pregravid overweight and obese status was a significant risk factor for all types of cesarean delivery. The poor study examined associations between cesarean delivery and rates of weekly weight gain (seven categories), categorized differently across different BMI groups (three groups) and parity (two categories), resulting in 42 comparisons.61 As with the fair study, a subset of results were significant, suggesting that for nulliparous women with low or medium BMI, high rates of weight gain increased the risks of cesarean delivery. Specifically, the study found:
-
among nulliparous, low-BMI women, a higher risk of elective cesarean delivery for women with weight gain ≥ 0.4 kg per week (AOR: 2.30 [1.06-4.98]) than for women gaining between 0.25 and 0.3 kg per week.
-
among nulliparous, medium-BMI women, a higher risk of elective cesarean delivery
-
for women with weight gain ≥ 0.4 kg per week (AOR: 1.61
-
-
-
[1.21-2.14]) than for women gaining 0.25 to 0.3 kg per week and
-
for women with weight gain of 0.35 to 0.4 kg per week (AOR: 1.68 [1.22-2.30]) than for women gaining 0.25-0.3 kg per week.
-
The study examined risk of emergency (rather than elective) cesarean for high BMI nulliparous women and failed to find an association with gestational weight gain rates.
In examining outcomes for parous women, with a single exception—a higher risk of cesarean delivery for women with weight gain 0.25-0.3 kg/wk (AOR, 1.49 [1.09-2.04]) than for women gaining 0.20 to 0.25 kg/week—the poor study did not find statistically significant effects for rate of weight gain on cesarean delivery for parous, medium-BMI women. No data were presented on cesarean delivery (emergency or elective) for low or high BMI groups for parous women.
Results across BMI categories for continuous measures of weight gain Of the 15 studies that considered a range of pregravid weight categories, two fair studies modeled gestational weight gain as a continuous variable.73,76 Both found significantly higher risks of cesarean delivery with increasing weight. One study identified the progression of AOR of cesarean delivery weight gain for every 5 pounds of gestational weight gain to be 1.094 (95% CI, 1.074-1.115).73 The second study calculated the attributable risk for cesarean delivery of gaining more than 16 kg to be 6.9 percent.76 Both studies account for route of previous delivery.
Results across BMI categories for other measures of weight gain Of these same 15 studies, three (1 fair,75 and 2 poor51,53,68) defined gestational weight gain as a function of pregravid weight.51,68,75 Two of three studies controlled for previous route of delivery by limiting their sample to primary cesareans. The fair study used underweight women who gained less than the median for proportional weight gain (total weight gain/prepregnancy weight) as the referent.75 This study found higher risks of cesarean delivery for all other categories, although risks were statistically significant only for women in the high and obese BMI category in all weight gain categories and women in the average BMI category who gained less than the median proportional weight gain. One poor-quality study characterized weight gain as change in BMI class between prepregnancy weight and at delivery. BMI categories were defined as follows: normal, BMI 20 to 24.9; overweight, BMI 25 to 29.9; obese I, BMI 30 to 34.9; obese II, BMI 35 to 39.9; morbid obesity, BMI ≥ 40.51 This study found no statistically significant association between weight gain and cesarean delivery among normal-BMI women but did find a positive association for high-BMI women. The extent to which
these results corroborate findings from the fair study is hard to determine given the differences in the reference category, but both studies imply that increased risks of cesarean are pronounced among overweight and obese women. A third study, also of poor quality, examined differences in route of delivery between women with normal prepregnancy weight and weight gain during pregnancy with those with abnormal weight gain (≥ 20 kg or ≤ 5 kg) during pregnancy; the study did not specify the prepregnancy weight status of women in these “abnormal” weight gain categories.68 Unlike the other two studies in this category, the rates for cesarean delivery were not statistically significantly different across groups. The study did find a statistically significant higher rate of normal vaginal delivery for low weight gain women compared with the reference category of normal prepregnancy weight and weight gain. Notably, this study did not control for route of previous delivery.
Results within BMI categories for other measures of weight gain. Two studies were limited to women of normal BMI.25,69 Both suggested an increase in the risk of cesarean delivery with increasing weight gain, defined in one study as 25 percent gain over prepregnancy weight,69 and in the other as a weight gain > 35 pounds as compared with a weight gain of 30 to 35 pounds. Weight gain of < 30 pounds was associated with a lower risk of cesarean delivery, suggesting a linear increase in the risk of cesarean delivery with weight gain for women of normal weight. One of the two studies controlled for previous cesarean delivery by limiting its sample to primigravidas.69
Four studies limited their analysis to obese women or morbidly obese women.4,49,54,59 Of these, two studies (both rated poor quality) suggested no difference in cesarean delivery outcomes by gestational weight gain.49,54 Neither accounted for route of previous delivery.
The other two studies suggested that the risk of cesarean delivery increased with higher levels of weight gain for obese and morbidly obese women.4,59 One poor study suggested that risk increases with higher levels of weight gain.59 Compared with the risk of cesarean delivery for women gaining < 5 kg, the results were as follows: AOR of cesarean delivery for women gaining 5 to 9.9 kg, 2.4 (95% CI, 1.1-5.3); AOR for women gaining 10 to 14.9 kg, 3.0 (95% CI, 1.4-6.4); and AOR for women gaining ≥ 15 kg, 3.6 (95% CI, 1.6-7.8).59 The other study suggested that women who had lower weight gain than women who gained 15 to 25 pounds had lower risks of cesarean delivery, but the magnitude of the association varied by obesity classification.4 Overall, across a range of outcomes the study suggested that minimal risk may correspond to a weight gain of 10 to 25 pounds for class I obese women (BMI 30-34.9), a weight gain of 0 to 9 pounds for class II obese women (BMI 35-39.9), and a weight loss of 0 to 9 pounds for class III obese women (BMI > 40). Neither of these studies controlled for route of previous delivery.
Results for instrumental delivery Five studies examined instrumental delivery in addition to cesarean delivery.25,51,58,68,69 Two found no association.25,68 Of the remaining studies, one found a higher risk of instrumental delivery with increased weight gain only for normal BMI and overweight women,58 and a second found this only for overweight women.51 A third study, limited to women of normal weight, examined differences in the rate of vacuum extraction and forceps delivery by amount of weight gain; it found a higher rate of vacuum extraction with excessive weight gain but no difference in rate of forceps delivery.69
Results controlling for confounding Studies varied in their adjustment for confounding factors. Seven studies controlled for route of previous delivery by limiting their sample to primary cesarean51,71,72,75 or primigravidas.69,73,74 Three studies included multigravidas but accounted for previous cesarean delivery in the analysis.76-78 The remaining 11 studies did not control for route of previous delivery.4,25,49,52,54,58,59,61,67,68,70
Of the 10 studies that controlled for route of previous delivery, five studies examined underlying health risks (e.g., preeclampsia, pregnancy-induced hypertension) as predictors of cesarean delivery; all five found these health factors to be significantly associated with risks of cesarean delivery.71,72,75,76,78
Vaginal birth after cesarean
Study characteristics One U.S. cohort study (rated poor quality) examined the effect of weight gain on the success of vaginal birth after cesarean (VBAC) (Evidence Table 12).79
Overview of results A single poor study found that gestational weight gain of 40 pounds or more increased the risk of VBAC failure.
Results Women who gained more than 40 pounds during pregnancy were less likely to have VBAC success than women who gained 40 pounds or less (OR, 0.65; 95% CI, 0.42-0.98). This study controlled for previous normal spontaneous vaginal delivery, previous VBAC, diabetes, induction, birthweight > 4,000 g, recurrent indication, one layer closure, pregnancy complications, and BMI, but it failed to account for age or parity. The study suggested that pregravid BMI was also a predictor of VBAC success, with lower pregravid BMI being predictive of success.
Vaginal lacerations
Study characteristics Two cohort studies examined vaginal lacerations (Evidence Table 13).51,68 One U.S. study (rated poor quality) examined the incidence of third- or fourth-degree lacerations among women.51 Weight gain was characterized as change in BMI class between prepregnancy
weight and weight at delivery. BMI categories were defined as follows: normal, BMI 20 to 24.9; overweight, BMI 25 to 29.9; obese I, BMI 30 to 34.9; obese II, BMI 35 to 39.9; morbid obesity, BMI ≥ 40. The second study (described earlier, also rated poor quality) was set in Finland.68 It examined the rate of vaginal repairs for women with normal prepregnancy weight and weight gain during pregnancy and for those with abnormal weight gain (≥ 20 kg, or ≤ 5 kg) during pregnancy.68
Overview of results Two studies, both of poor quality, did not report consistent results on the effects of gestational weight gain on vaginal lacerations.
Results The U.S. study found no differences in the incidence of third-and fourth-degree lacerations among women who were overweight before pregnancy.51 It did find a statistically significant difference among normal weight women; the incidence of lacerations rose from 24 percent for women with no change in BMI category to 29.3 percent for women gaining enough to change weight status by one BMI category and to 31.7 percent for women who gained enough to change weight status by more than one BMI category. The Finnish study found no statistical differences between study and control mothers in the rate of repair of second- or third-degree lacerations.68 Neither study controlled for any variable other than pregravid BMI.
Shoulder dystocia
Study characteristics Three studies, set in Ireland,80 the United States,51 and Finland,68 examined the effect of gestational weight gain on shoulder dystocia (Table 9, Evidence Table 14). The Irish study, a case-control investigation (rated poor) comparing cesarean delivery for shoulder dystocia with cephalic vaginal term deliveries, distinguished between two groups of gestational weight gain (< 12 kg and ≥ 12 kg).80 The Finnish study (described earlier and rated poor quality), stratified its sample by weight gain categories, comparing women with normal prepregnancy weight and weight gain during pregnancy with those with abnormal weight gain (≥ 20 kg or ≤ 5 kg) during pregnancy.68 The U.S. case-control study (also rated poor quality), stratified its sample between normal and overweight BMI categories and examined the effect of change in BMI class between prepregnancy weight and weight at delivery. The Irish study defined shoulder dystocia to include mild, moderate, and severe cases;80 the other two studies did not define their outcome variable.51,68
Overview of results Only one80 of three poor studies found a positive association between gestational weight gain and shoulder dystocia.
TABLE 9. Gestational Weight Gain and Shoulder Dystocia
|
Author, Date Country, Setting Sample Size Baseline BMI Quality |
Pregravid Weight (How Measured) Total Weight Gain (How Measured) |
Definition of Groups |
Results |
Confounders and Effect Modifiers Included in Analysis |
|
Ekblad and Grenman, 199268 |
Pregravid weight: Data from records, unclear if self reported |
G1: weight gain ≤ 5 kg G2: weight gain ≥ 20 kg G3: reference (normal prepregnancy weight and normal weight gain [undefined]) |
Shoulder dystocia% G1: 3 G2: 2 G3: 0.6 |
NA |
|
Finland, hospital |
Total weight gain: Last clinically measured weight prior to delivery |
|||
|
357 |
||||
|
Normal weight only |
||||
|
Poor |
||||
|
Geary et al., 199580 |
Pregravid weight: First prenatal visit |
Weight gain < 12 kg and ≥ 12 kg for cases shoulder dystocia and controls |
Maternal weight gain < 12 kg |
Parity Previous birth ≥ 4,000 g |
|
Ireland, hospital |
Total weight gain: Not described |
G1: Cases with shoulder dystocia G2: Controls |
G1: 59.1% G2: 74.1% OR 2.0 (1.6-2.2) |
|
|
363 |
||||
|
All weights/BMI |
||||
|
Poor |
|
Author, Date Country, Setting Sample Size Baseline BMI Quality |
Pregravid Weight (How Measured) Total Weight Gain (How Measured) |
Definition of Groups |
Results |
Confounders and Effect Modifiers Included in Analysis |
|
Kabiru and Raynor, 200451 |
Pregravid weight: First prenatal visit |
G1: normal BMI, no change in BMI between first prenatal visit and delivery G2: normal BMI, 1 category increase in BMI between first prenatal visit and delivery G3: normal BMI, > 1 category increase in BMI between first prenatal visit and delivery G4: overweight BMI, no change in BMI between first prenatal visit and delivery G5: overweight BMI, 1 category increase in BMI between first prenatal visit and delivery G6: overweight BMI, > 1 category increase in BMI between first prenatal visit and delivery |
Shoulder dystocia% G1: 0.5 G2: 1.4 G3: 1.1 P = 0.278 for associations within normal BMI categories |
NA |
|
USA, hospital |
Total weight gain: Weight at admission for birth |
|||
|
5,131 |
||||
|
All weights/BMI |
||||
|
Poor |
G4: 1.0 G5: 1.8 G6: 1.9 P = 0.357 for associations within overweight BMI categories |
|||
|
BMI, body mass index; g, gram; G, group; kg, kilogram; N, number; OR, odds ratio. |
||||
Results The three studies found rates of shoulder dystocia ranging from 0.6 percent to 1.4 percent.51,68,80 Two studies reported no statistically significant differences in rates of shoulder dystocia between weight gain groups.51,68 The Irish case-control investigation found that higher gestational weight gain during pregnancy was a significant predictor of shoulder dystocia (OR, 2.0; 95% CI, 1.6-2.2; P = 0.015). The authors calculated positive predictive value percentages from the study group and applied them to the total hospital population of singleton vaginal deliveries without shoulder dystocia over the same time period. These results suggest a positive predictive value of 1 percent for shoulder dystocia when gestational weight gain is 12 kg or greater.
The Irish study accounted for a subset of confounders and effect modifiers other than pregravid BMI.80 Multiparity and birth of a previous heavy baby were significant and independent determinants for shoulder dystocia, in addition to gestational weight gain. However, the investigators noted that each predictor individually accounted for less than 2 percent of the positive predictive value for shoulder dystocia, and all three put together accounted for less than 3 percent.
Cephalopelvic disproportion
Study characteristics Two U.S. cohort studies examined the association between gestational weight gain and cephalopelvic disproportion (CPD) (Evidence Table 15).25,74 One study, using Missouri birth certificate data, defined CPD as the condition when the size, presentation, or position of the fetal head to the maternal pelvis prevented cervical dilation or descent of the fetal head.25 This study controlled for a range of demographic confounders but not for maternal health characteristics.25 The other study (rated poor quality) defined CPD among primiparous women as little or no progress over a 2- to 4-hour period, with contractions documented to be adequate and cervix dilated to at least 3 cm or preferably 4 cm. However, if the delivering physician defined the indication as CPD, the decision was accepted without chart review, despite the definitions listed earlier.74
Both studies defined weight gain in categories: < 30 pounds, 30 to 35 pounds, and > 35 pounds. The study using birth certificate data limited inclusion to normal weight women (pregravid BMI 19.8-26.0);25 the other study examined the association between gestational weight gain and CPD across four pregravid BMI categories: < 20, 20 to 25, 25 to 30, and > 30.
Overview of results Both studies (1 fair25 and 1 poor74) showed that, for normal-weight women, the risk of CPD rose with higher gestational weight gain
Results The fair study reported an AOR of 1.58 (95% CI, 1.44-1.75) for women gaining > 35 pounds compared with women gaining 25
to 30 pounds, after adjusting for maternal age, maternal race or ethnicity, maternal education, Medicaid status, tobacco use, alcohol use, maternal height, prior pregnancy, adequacy of prenatal care, child’s sex, and child’s birth year.25 The poor study showed similar results, with an unadjusted OR of CPD of 1.85 (95% CI, 1.63-2.06) for normal-weight women gaining > 35 pounds compared with women gaining < 30 pounds. This study also showed an increased risk of CPD for underweight women gaining > 35 pounds compared with women gaining < 30 pounds (unadjusted OR: 3.8; 95% CI, 3-4.6). The relationship between weight gain and CPD was not statistically significant at higher pregravid BMI levels.74
Complications of labor and delivery
Study characteristics Two retrospective cohort studies, one from Iceland53 and the other from the United States,81 evaluated the impact of gestational weight gain on complications of labor and delivery (Evidence Table 16).
Overview of results Two studies, of fair53 and poor81 quality respectively found conflicting evidence on the risks of complications. One failed to find statistically significant results;53 the other reported that gestational weight gain of more than 40 pounds increased the risk for the previously listed complications by 40 percent.81
Results The fair study from Iceland analyzed the quartiles of total weight gain in women with normal pregravid BMIs (19.5-25.5) to determine the impact of weight gain on labor and delivery processes.53 After adjusting for age, height, parity, gestational length, and birthweight, they found that weight gain of 11.5 to 16.0 kg was associated with the highest likelihood of a normal vaginal delivery, defined to include no shoulder dystocia and no asphyxia, and the least likelihood of operative procedures including cesarean delivery and forceps- or vacuum-assisted deliveries. The findings of this study, however, were not statistically significant.
The poor U.S. study enrolled 493 women at 37 or more weeks of gestational age to determine the relationship between various lifestyle choices and complications in term pregnancy.81 Complications included dystocia, postpartum hemorrhage, retained placenta, fetal and neonatal distress, and pregnancy-induced hypertension. All complications were grouped together for the analysis. Smoking had a protective effect against complications, but entering pregnancy with excess weight for height and gaining more than 40 pounds during gestation both predicted complications. A gestational weight gain of more than 40 pounds increased the risk for the previously listed complications by 40 percent.
Birth Outcomes
Preterm birth
Study characteristics Twelve studies (Table 10, Evidence Table 17) examined the relationship between weight gain and birth outcomes.23,59,65,71,82-89 These include eight cohort studies,59,65,82-86,89 two case-control studies,87,88 and two cross-sectional studies.23,71 The majority of the studies defined preterm birth as delivery occurring prior to 37 weeks of gestation; the one exception defined it as delivery between 24 and 35 weeks of gestation.87 Each study defined weight gain differently. Two studies examined associations of weight gain with early and late preterm birth,23,65 and two studies examined associations across subtypes of preterm delivery.65,84
Overview of results Taken collectively, the results of these two good,84,88 seven fair,23,65,71,82,85,86,89 and three poor53,59,83,87 studies suggest an association between preterm birth and both low and high rates of weight gain and with low total weight gain, with one study reporting a 16 percent decrease in preterm birth associated with a 1 kg increase in maternal weight. The cut points for low and high weight gains and the severity of the risks of preterm birth associated with them differ by pregravid BMI. In general, low rates of weight gain were ≤ 0.37 kg per week and high rates of gain were > 0.52 kg per week throughout gestation, with the greatest risks found among underweight women. However, as pregravid BMI increases, the risk of preterm birth decreases for women gaining in the lower range of the low rate of weight gain and increases for women gaining in the lower range of the high rate of weight gain, such that the range of adequate rates of weight gain is shifted down for heavier women compared to their lighter counterparts. Some evidence also suggests that low rate of weight gain is associated with greater risks of early preterm birth as well as preterm birth due to premature rupture of the amniotic membranes.
Detailed results from categorical measures of total rate of weight gain. Four studies used categorical definitions of rate of weight gain averaged for the entire length of gestation;85,86,88,89 one study was rated good88 and the others rated fair.85,86,89 In the good study,88 a rate of weight gain of < 0.27 kg per week was not associated with preterm birth (OR, 1.56; 95% CI, 0.94-2.58). Among the fair studies, all three studies found evidence of an association between low rate of weight gain and preterm birth, and two studies found evidence of an association between high rate of weight gain and preterm birth.86,89
One study used a retrospective, U.S.-hospital-based cohort of deliveries from 1976 to 2001 to examine the association of preterm birth and gestational weight gain by maternal race or ethnicity.85 Weight gain was categorized into three groups based on rate of weight gain: < 0.27 kg per week,
TABLE 10. Gestational Weight Gain and Preterm Birth
|
Author, Year Country, Setting Sample Size Baseline BMI Quality |
Pregravid Weight (How Measured) Total Weight Gain (How Measured) |
Definition of Groups |
|
Kramer et al., 199588 |
Pregravid weight: Self-report |
Gestational weight gain categories (kg/wk): G1: < 0.27 G2: ≥ 0.27 |
|
Canada, University Hospitals |
||
|
Total weight gain: Self-report |
||
|
396 |
||
|
All weight/BMI |
||
|
Good |
||
|
Siega-Riz et al., 199684 |
Pregravid weight: Self-reported |
Categories of 3rd trimester weekly weight gain rates (kg/week): |
|
USA, Public Health Clinics (California) |
||
|
Total weight gain: Measured |
||
|
7,589 |
G1: Inadequate (Underweight, < 0.34; Normal weight, < 0.35; Overweight/Obese, < 0.30) |
|
|
All weight/BMI |
||
|
Good |
||
|
G2: Adequate (Underweight, > 0.34; Normal, > 0.35; Overweight/Obese, > 0.30) |
||
|
Carmichael et al., 199782 |
Pregravid weight: Self-report |
Total gestational weight gain (continuous) |
|
USA, University Hospital (California) |
||
|
Total weight gain: Maternity Records |
||
|
7,259 |
||
|
Nonobese |
||
|
Fair |
||
|
Dietz et al., 200623 |
Pregravid weight: Self-report |
Categories of mean rate of gestational weight gain (kg/wk) during second and third trimesters stratified by pregravid BMI and type of preterm birth (very preterm, 20-31 weeks; moderate preterm, 32-36 weeks): G1: < 0.12 G2: 0.12-0.22 G3: 0.23-0.68 G4: 0.69-0.79 G5: > 0.79 |
|
USA, Pregnancy Risk Assessment Monitoring System |
||
|
Total weight gain: Birth Certificates |
||
|
113,019 |
||
|
All weight/BMI |
||
|
Fair |
|
Results |
Confounders and Effect Modifiers Included in Analysis |
|
AOR (95% CI) for cases with preterm delivery versus controls |
Parity, marital status, language, age, education, matched on smoking history |
|
G1: 1.56 (0.94-2.58) G2: 1.00 (reference) |
|
|
AOR (95% CI) for rate of preterm birth: G1: 1.91 (1.40-2.61) G2: 1.00 (reference) |
Iron status, parity combined with maternal age, ethnicity, hypertension (chronic or pregnancy induced), smoking status, week prenatal care began |
|
AOR (95% CI) for rate of preterm labor: G1:1.75 (1.15-2.64) G2: 1.00 (reference) |
|
|
AOR (95% CI) for rate of PPROM: G1: 2.70 (1.35-5.42) G2: 1.00 (reference) |
|
|
Linear regression analysis of gestational age (days) as dependent variable and gestational weight gain (kg) as independent variable: Regression coefficient = 0.51; t-statistic = 13.1; P < 0.001 |
BMI, maternal age, infant sex cigarettes per day maternal height, parity, race, pattern of gain derived from quadratic curves |
|
AOR (95% CI) of spontaneous preterm birth/kg increase in total weight gain: 0.84 (0.82-0.87) |
|
|
In general, in comparison to women with normal BMI in G3: underweight women in G1-G5 and normal weight women in G1, G2, and G5 were at increased risk of very preterm births (AOR: 1.5-9.8). Underweight women in G1-G3 and G5 and normal women in G1, G2, and G5 were at increased risk moderate preterm births (AOR: 1.4-3.1). Overweight and obese women in G1 and G5 were at increased risk of very preterm birth (AOR: 2.3-2.5) but had no elevated risk of moderate preterm birth. Very obese women with G1, G4, G5 had increased risks of very preterm births (AOR: 2.1-2.8) and with G4 had increased risks of moderate preterm birth (AOR: 1.3) |
Race, Medicaid recipient, parity, marital status |
|
Author, Year Country, Setting Sample Size Baseline BMI Quality |
Pregravid Weight (How Measured) Total Weight Gain (How Measured) |
Definition of Groups |
|
Nohr et al., 200765 |
Pregravid weight: Self-reported |
Rate of gestational weight gain (g/wk) for women with early preterm birth (22-33 weeks) with PPROM : G1: < 275 G2: 276-675 G3: ≥ 676 |
|
Danish National Birth Cohort |
||
|
Total weight gain: Self-reported |
||
|
16,167 |
||
|
All weight/BMI |
||
|
Fair |
Rate of gestational weight gain (g/wk) for women with early preterm birth (22-33 weeks) without PPROM : G4: < 275 G5: 276-675 G6: ≥ 676 |
|
|
Rate of gestational weight gain (g/wk) for women with late preterm birth (34-36 weeks) with PPROM: G7: < 275 G8: 276-675 G9: ≥ 676 |
||
|
Rate of gestational weight gain (g/wk) for women with late preterm birth (34-36 weeks) without PPROM: G10: < 275 G11: 276-675 G12: ≥ 676 |
||
|
Rosenberg et al., 200571 |
Pregravid weight: Self-report |
Categories of total gestational weight gain (lbs): |
|
USA, New York City birth files |
||
|
Total weight gain: Self-report |
G1: < 41 G2: ≥ 41 |
|
|
329,988 |
||
|
All weight/BMI |
||
|
Fair |
|
Results |
Confounders and Effect Modifiers Included in Analysis |
|
HR (95% CI): G1: 2.1 (1.5-3.0) G2: 1.0 (ref) G3: 1.2 (0.8-1.8) |
Pregravid BMI, age, height, parity, socio-occupational status, smoking alcohol consumption |
|
HR (95% CI): G4: 1.9 (1.3-2.6) G5: 1.0 (ref) G6: 1.9 (1.3-2.6) |
|
|
HR (95% CI): G7: 1.3 (1.0-1.6) G8: 1.0 (ref) G9: 1.2 (1.0-1.5) |
|
|
HR (95% CI): G10: 1.0(0.9-1.2) G11: 1.0(ref) G12: 1.0 (0.9-1.2) |
|
|
AOR (95% CI) for Preterm Birth: G1: 1.00 (reference) G2: 0.54 (0.52-0.57) |
Pregravid weight, chronic diabetes, GDM, chronic hypertension, PIH preeclampsia, maternal age marital status maternal education maternal birthplace, prenatal care payer, social risk, parity, trimester that prenatal care began |
|
Author, Year Country, Setting Sample Size Baseline BMI Quality |
Pregravid Weight (How Measured) Total Weight Gain (How Measured) |
Definition of Groups |
|
Schieve et al., 199986 |
Pregravid weight: Self-reported |
Rate of weight gain (kg/week) in percentiles stratified by Low, Average, High, and Obese pregravid BMI: G1: 5th,0.10 G2: 10th, 0.16 G3: 25th,0.26 G4: 50th,0.35 G5: 75th, 0.46 G6: 90th, 0.57 G7: 95th, 0.65 |
|
USA, Pregnancy Nutrition Surveillance System (PNSS) |
||
|
Total weight gain: Self-reported |
||
|
266,172 |
||
|
All weight/BMI |
||
|
Fair |
||
|
Stotland et al., 200685 |
Pregravid weight: Medical Charts |
Categories of rate of gestational weight gain (kg/wk): |
|
USA, University Hospital (California) |
||
|
Total weight gain: Medical Charts |
||
|
15,101 |
G1: < 0.27 G2: 0.27 to 0.52 G3: > 0.52 |
|
|
Underweight/Normal BMI |
||
|
Fair |
||
|
Wen et al., 199089 |
Pregravid weight: Measured at first prenatal visit |
Rate of weight gain (kg/wk) after 20 weeks gestation |
|
USA, University Hospital (Alabama) |
||
|
G1: < 0.24 G2: 0.24-0.57 G3: 0.58-0.74 G4: ≥ 0.75 |
||
|
17,149 |
Total weight gain: Medical records |
|
|
All weight/BMI |
||
|
Fair |
||
|
Jensen et al., 200559 |
Pregravid weight: Self-report |
Total gestational weight gain categories (kg): |
|
Denmark, University hospital centers |
||
|
Total weight gain: Hospital records |
G1: < 5.0 G2: 5.0-9.9 G3: 10.0-14.9 G4: > 15.0 |
|
|
481 |
||
|
Obese |
||
|
Poor |
|
Results |
Confounders and Effect Modifiers Included in Analysis |
|
Reference category of rate of weight gain: 0.35-< 0.46 kg/wk RD of preterm birth varied by prepregnant BMI and gestational weight gain. Overall, women gaining 0.26-0.46 kg/wk had the lowest RD of preterm birth. The highest RD occurred for women gaining the least and most amount of weight, irrespective of prepregnant BMI; however, the highest RD of preterm births were among women of low BMI |
None |
|
AOR (95% CI) for preterm delivery < 37 weeks: G1: 2.6 (2.1-3.2) G2: 1.0 (reference) G3: 1.0 (0.8-1.2) |
Race, age pregravid BMI, year of delivery, parity, previous preterm birth, number of days between last weighing and delivery, smoking |
|
AOR (95% CI) for preterm delivery < 34 weeks: G1: 3.0 (2.0-4.8) G2: 1.0 (ref) |
|
|
AOR for preterm birth: G1: 1.52 (P < 0.05) G2: 1.11 (NS) G3: 1.00 (ref) G4: 1.71 (P < 0.05) |
Race, parity, infant sex, marital status, education, age, previous preterm delivery, smoking, alcohol consumption, drug use, height, pregravid weight |
|
Percent (%) preterm delivery by weight gain categories: |
NA |
|
G1: 6.5 G2: 6.0 G3: 4.6 G4: 2.5 P for trend = 0.11 |
|
Author, Year Country, Setting Sample Size Baseline BMI Quality |
Pregravid Weight (How Measured) Total Weight Gain (How Measured) |
Definition of Groups |
|
Spinillo et al., 199887 |
Pregravid weight: Self-report |
G1: Prepregnancy BMI ≤ 19.5 and 2nd/3rd trimester weight gain ≤ 0.37 kg/wk |
|
Italy, University Hospital |
||
|
Total weight gain: Medical records |
||
|
690 |
G2: Prepregnancy BMI > 19.5 and 2nd/3rd trimester weight gain ≥ 0.37 kg/wk |
|
|
All weight/BMI |
||
|
Poor |
G3: Prepregnancy BMI ≤ 48 kg and 2nd/3rd trimester weight gain ≤ 0.37 kg/wk |
|
|
G4: Prepregnancy BMI > 48 kg and 2nd/3rd trimester weight gain ≤ 0.37 kg/wk |
||
|
Velonakis et al., 199783 |
Pregravid weight: Self-reported |
Total gestational weight gain (continuous) |
|
France, Hospital |
||
|
Total weight gain: Measured |
||
|
2040 |
||
|
All weight/BMI |
||
|
Poor |
||
|
AOR, adjusted odds ratio; BMI, body mass index; CI, confidence interval; HR, hazards ratio; kg, kilogram; n, number; OR, odds ratio; PPROM, preterm premature rupture of amniotic membranes; RD, risk difference; USA, United States of America; wk, week. |
||
0.27-0.52 kg per week, and > 0.52 kg per week. Within the entire cohort and across four racial or ethnic groups (white, black, Latina, and Asian), the highest percentages of preterm birth occurred among women gaining < 0.27 kg per week. The adjusted odds of spontaneous preterm birth were 2.5 times higher in women with rates of weight gain < 0.27 kg per week than in women gaining 0.27 to 0.52 kg per week. The adjusted odds ratios for this association were statistically significant across the different racial or ethnic groups, ranging from 2.1 (95% CI, 1.4-3.1) for white women to 3.6 (95% CI, 2.2-6.0) for black women. No association between spontaneous preterm birth and rate of weight gain > 0.52 kg per week (relative to a weight gain of 0.27 to 0.52 kg per week) was seen either within the entire cohort or across the racial or ethnic groups.
|
Results |
Confounders and Effect Modifiers Included in Analysis |
|
AOR (95% CI) for cases with spontaneous preterm delivery versus controls: |
Pregravid BMI, pregravid weight, height, age, parity, smoking, social class education, infant sex |
|
G1: 5.63 (2.35-13.8) G2: 2.45 (1.60-3.75) P = 0.06 for interaction between G1 and G2 |
|
|
G3: 5.29 (1.45-20.90) G4: 2.42 (1.65-3.55) P = 0.21 for interaction between G3 and G4 |
|
|
Regression analysis with gestational age (weeks) as the dependent variable and net gestational weight gain as the independent variable: B = 0.191 (SE, 0.06) P = 0.001 |
Age, race, gravidity, previous diseases, parity, abortions, marital status, pathology of index pregnancy, infant sex, height pregravid weight, job classification, alcohol, smoking, APGAR score, duration of pregnancy |
Another study, conducted in a population of young, primarily black, disadvantaged women, found statistically significant higher odds of preterm delivery among women gaining < 0.24 kg per week and > 0.74 kg per week than among women gaining 0.58 to 0.74 kg per week.89
The final study used data collected from women participating in U.S. federally funded prenatal public health programs via the Pregnancy Nutrition Surveillance System (PNSS).86 Gestational weight gain was defined as rates of weight gain and net weight gain (kg/week) and categorized by the percentile distributions based on the total sample. Women with rates of weight gain between 0.35 and 0.46 kg per wk (the 50th through the 74th percentiles) were used as the reference for risk difference calculations. In general, the risk of preterm birth was highest among women with the small-
est and greatest rates of weight gain, < 0.10 kg per week and ≥ 0.65 kg per week, respectively. The lowest risks of preterm delivery occurred among women gaining between 0.26 and 0.46 kg per week (the 25th through the 74th percentiles). Preterm risk differences did vary by maternal pregravid BMI status. An increased risk of preterm birth was associated with rates of weight gain for the following pregravid BMI categories:
-
pregravid BMI < 19.8: < 0.26 kg per week;
-
pregravid BMI of 19.8 to 26.0: < 0.26 kg per week and > 0.65 kg per week;
-
pregravid BMI of 26.1 to 29.0: < 0.10 kg per week and > 0.65 kg per week; and
-
pregravid BMI > 29.0: ≥ 0.57 kg per week.
The results were similar when rates of weight gain per week excluded the first 14 weeks of gestation.
Results from categorical measures of trimester rate of weight gain Four studies used categorical definitions of rate of gestational weight gain measured during specific trimesters of pregnancy.23,65,84,87 All of the studies found evidence for an association between preterm birth and low rate of weight gain and two studies found evidence for an association between preterm birth and high rate of weight gain.
One study of good quality used a cohort of mainly Hispanic women recruited from public health clinics to examine the association between preterm birth and rate of weight gain during the third trimester.84 Women with preterm deliveries had significantly lower rates of third trimester weight gain than women with term deliveries, 0.50 (standard error of mean [SEM]: 0.02) kg per week versus 0.53 (SEM: 0.004) kg per week, respectively (P < 0.05). The odds of preterm birth were 1.91 (95% CI, 1.40-2.61) times greater among women with inadequate third trimester weight gains (defined as a rate of weight gain less than the 25th percentile of gain in each pregravid weight status: 0.34 kg/week, underweight; 0.35 kg/week, normal weight; 0.30 kg/week, overweight and obese) than among women with adequate rates of weight gain. When data were stratified by the type of preterm delivery, women with inadequate weight gains were 1.75 (95% CI, 1.15-2.64) times more likely to have preterm delivery resulting from preterm labor and 2.70 (95% CI, 1.32-5.42) times more likely to have preterm delivery resulting from preterm premature rupture of the amniotic membranes (PPROM) than women with adequate rates of weight gain.
One study, rated fair quality, used data from the Danish National Birth Cohort to assess the impact of gestational weight gain on early (22-
33 weeks), late (34-36 weeks), and all (22-36 weeks) preterm births with PPROM, without PPROM, and with medical inducement.65 Gestational weight gain was categorized as low (< 275 g/week), medium (275-675 g/week), and high (> 675 g/week) based on two self-reported measurements recorded at least 6 weeks apart between 12 and 37 weeks of gestation. Women with medium rates of weight gain were used as the reference. Overall, low rates of weight gain were significantly associated with an increased risk of early spontaneous preterm birth with and without PPROM and with all spontaneous preterm births with PPROM, adjusted odds ratios ranged from 1.5 to 2.1. High rates of weight gain were significantly associated with an increased risk of early spontaneous preterm births without PPROM (AOR, 1.9; 95% CI, 1.3-2.6) and early, late, and all medically induced early preterm births. However, when women with obesity-related diseases and abruptio placenta were excluded, the associations for medically induced preterm births were no longer significant.
Another fair quality study used information collected for the Pregnancy Risk Assessment Monitoring System (PRAMS) to examine the effect of rate of weight gain during the second and third trimesters on preterm birth.23 These investigators stratified women by prepregnancy BMI status and examined the risk of preterm birth in two categories: moderate length of gestation (32-36 weeks) and very short length of gestation (20 to 31 weeks). Second and third trimester rate of weight gain was categorized, in kg per week, as follows: < 0.12, 0.12-0.22, 0.23-0.68, 0.69-0.79, and > 0.79; the investigators also used five pregravid BMI groups: underweight (< 19.8), normal weight (19.8-26.0), overweight (26.1-28.9), obese (29.0-34.9), and very obese (≥ 35.0). Women of normal weight with rates of weight gain of 0.23 to 0.68 kg per week were used as the reference for analyses. After adjusting for covariates and excluding women with diabetes, hypertension, or small-for-gestational-age (SGA) infants, significant associations (AOR range, 1.3-3.1) were reported between moderate preterm birth and rates of weight gain as follows: < 0.69 and > 0.79 kg per week among underweight women; < 0.23 and > 0.79 kg per week among normal weight women; and 0.69 to 0.79 kg per week among obese and very obese women. Significant associations (AOR range, 1.5-9.8) were reported between very preterm birth and rates of weight gain as follows: all weight gain categories among underweight women; < 0.23 and > 0.79 kg per week among normal weight women; < 0.12 and > 0.79 kg per week among overweight and obese women; and < 0.12 and > 0.68 kg per week among very obese women. In general, the greatest odds were found among underweight women and in the extreme weight gain categories.
Results from a poor study87 were consistent with those of the other studies and revealed an overall increased odds of preterm birth (between 24
and 35 weeks’ gestation) with gestational weight gain ≤ 0.37 kg per week in the second and third trimesters; however, the odds were greater among women with pregravid BMI ≤ 19.5 compared to those with BMI > 19.5.
Results from categorical measures of total weight gain Two studies,59,71 one rated fair and the other poor, used categories of total weight gain. In the fair study, data from the New York City birth file from 1999 through 2001 was used to examine the odds of preterm birth associated with different levels of gestational weight gain.71 After adjusting for covariates, the investigators determined that the odds of preterm birth were significantly decreased (OR, 0.54; 95% CI, 0.52-0.57) among women who gained at least 41 pounds compared with women who gained less than 41 pounds. Results from the poor study,59 which used a population of obese women, showed the highest proportion of preterm birth among those with the lowest gestational weight gain (< 5.0 kg).
Results from continuous measures of weight gain The remaining two studies, one rated fair and the other poor, used gestational weight gain as a continuous measure.82,83 Both studies reported a significant increase in length of gestation for a 1 kg increase in total gestational weight gain.
In the fair study,82 simple regression techniques were used to develop a variable for pattern of weight gain that reflected the variation between a woman’s pattern of weight gain and a linear pattern of weight gain.82 Deviations in the pattern of weight gain, such as pronounced speeding up or slowing down of weight gain later in gestation, from an average pattern of weight gain were associated with decreased gestational age and increased risk of spontaneous preterm birth. A 1-kg increase in total gestational weight gain was associated with 0.51 day’s increase in gestational age (P < 0.001). The odds of spontaneous preterm birth were decreased by 16 percent for each 1-kg increase in total gestational weight gain (OR, 0.84; 95% CI, 0.82-0.87; P < 0.001).
Birthweight
Study characteristics Twenty-five studies examined the association between gestational weight gain and infant birthweight (Evidence Table 18).48,54,55,59,68,70,75,83,90-106 These studies consisted of various groups of women, in many different countries. Nine studies were completed outside the United States, in Canada,105 France,83,92 Italy,91,100 Denmark,59 Norway and Sweden,99 Finland,68 and Austria.93
One study observed the association for adolescent mothers.95 The association was also evaluated for mothers with gestational diabetes mellitus (GDM),100 mothers who had a positive diabetic screen but normal glucose tolerance levels,91 and obese glucose-tolerant women.59 Seven-
teen studies adjusted their analyses for multiple confounders, including maternal age, BMI, smoking, glucose levels, race, marital status, and parity.48,55,59,70,75,90-93,97-103,105
Overview of results The results for four good,48,98,103,10612 fair,55,65,70,75,92,93,97,99-102,104,105 and nine poor54,59,68,83,90,91,94-96 studies consistently demonstrate an association between higher gestational weight gain and birthweight.
Results from categorical measures of weight gain. Eight studies analyzed the relationship between weight gain and birthweight by categorizing gestational weight gain (Table 11).54,59,68,94,95,99,101,106 One study was rated to be of good quality,106 two of fair quality,99,101 and five of poor quality.54,59,68,94,95 These studies suggest a positive association between gestational weight gain and infant birthweight.
A U.S. study rated of good quality found that higher values for maternal weight near term, categorized by the percentage of standard weight-for-height, were associated with higher birthweight for black and Hispanic mothers.106 Specifically, black mothers > 135 percent of standard weight for height gave birth to infants that weighed on average 512 g more than infants born to black mothers < 100 percent of standard weight for height. Hispanic mothers > 135 percent of standard weight for height gave birth to infants that weighed on average 338 g more than infants born to Hispanic mothers < 100 percent of standard weight for height.
In one Scandinavian study (fair quality), estimated birthweights decreased by 131 g for women who gained less than 11 kg and increased by 164 g for women who gained more than 17 kg, as compared with estimated birthweights for women gaining between 11 and 17 kg.99 A fair-quality U.S. study examined patterns of weight gain and infant birthweight in a population of white nonobese women.101 Low weight gain by trimester was defined as having weight gain less than the 25th percentile. Infants of mothers with low weight gain in all three trimesters had weighed 248.1 g less, on average, than infants of mothers in other groups. Low weight gain for the first trimester was associated with a decrease in birthweight of 133 g; low weight gain for the second and third trimesters was associated with an 88.5 g decrease in birthweight.
The five poor-quality studies also found that increases in gestational weight gain resulted in larger infant birthweights.54,59,68,94,95 This trend held among studies of obese glucose-tolerant women,59 Finnish women,68 and adolescent mothers.94,95 One study stratified by maternal BMI and found that among women with low BMI (< 25) those that gained > 35 lbs had infants that were, on average, 273 g heavier than infants born to women gaining < 35 lbs. Among women with high BMI (> 25), women that gained > 35 lbs had infants that were, on average, 209 g heavier than infants
TABLE 11. Total Gestational Weight Gain (categorical) and Infant Birthweight
|
Author, Year Country, Setting Sample Size Baseline BMI Quality |
Pregravid Weight (How Measured) Total Weight Gain (How Measured) |
Definition of Groups |
Results |
Confounders and Effect Modifiers Included in Analysis |
|
Hickey et al., 1990106 |
Pregravid weight: Self-report |
Infant BW for groups defined by maternal weight near term (% of standard weight-for-height) |
G1: 3,325 g ± 460 G2: 3,543 g ± 410 G3: 3,200 g ± 389 G4: 3,381 g ± 385 G5: 3,157 g ± 373 G6: 3,282 g ± 400 G7: 3,025 g ± 494 G8: 3,154 g ± 375 G9: 2,813 g ± 289 G10: 3,205 g ± 472 |
N/A |
|
United States, prenatal clinics |
||||
|
Total weight gain: Routine prenatal care or maternity records |
||||
|
325 |
G1: > 135%, Black G2: > 135%, Hispanic G3: 120-135%, Black G4: 120-135%, Hispanic G5: 110-119%, Black G6: 110-119%, Hispanic G7: 100-109%, Black G8: 100-109%, Hispanic G9: < 100%, Black G10: < 100%, Hispanic |
|||
|
All weight/BMI |
||||
|
Good |
||||
|
Abrams et al., 1995101 |
Pregravid weight: Self-report |
G1: Infant BW among nonobese women |
3,485.8 g ± 523.1 |
Maternal age, parity, pregravid BMI, height, smoking, infant sex, difference in weeks between the last measured weight and delivery |
|
USA, university hospital |
||||
|
Total weight gain: Routine prenatal care or maternity records |
||||
|
4,420 |
||||
|
Nonobese |
||||
|
Fair |
|
Zaren et al., 199799 |
Pregravid weight: Self-report |
β is estimated change in infant BW (g) |
G1: β = −131 (P = 0.0001) G2: β = 164 (P = 0.0001) |
Maternal age, height, pregravid weight, smoking |
|
Norway and Sweden, university hospitals |
||||
|
Total weight gain: Routine prenatal care or maternity records |
G1: GWG ≤ 11 kg: G2: GWG ≥ 17 kg: |
|||
|
1,099 |
||||
|
All weights/BMI |
||||
|
Fair |
||||
|
Bianco et al., 199854 |
Pregravid weight: Self-report |
Infant BW for GWG: |
G1: 3,302 G2: 3,192 G3: 3,337 G4: 3,506 G5: 3,453 (P < 0.05) |
N/A |
|
USA, medical center |
G1: Weight loss or 0 lbs G2: 1-15 lbs G3: 16-25 lbs G4: 26-35 lbs G5: > 35 lbs |
|||
|
Total weight gain: Routine prenatal care or maternity records |
||||
|
613 |
||||
|
Morbidly obese (BMI > 35) |
||||
|
Poor |
||||
|
Cherry et al., 199395 |
Pregravid weight: Measured by study investigators |
Infant BW by Quartiles of weight gain |
G1: 2,829 g G2: 2,990 g G3: 3,112 g G4: 3,189 g |
N/A |
|
USA, hospital |
||||
|
RCT |
Quartiles defined as weekly weight gain in g per cm height |
|||
|
Total weight gain: Routine prenatal care or maternity records |
||||
|
599 |
||||
|
All weights/BMI |
G1: Quartile 1 (≤ 1.87g) G2: Quartile 2 (1.88-2.68g) G3: Quartile 3 (2.69-3.58g) G4: Quartile 4 (≥ 3.59g) |
|||
|
Poor |
|
Author, Year Country, Setting Sample Size Baseline BMI Quality |
Pregravid Weight (How Measured) Total Weight Gain (How Measured) |
Definition of Groups |
Results |
Confounders and Effect Modifiers Included in Analysis |
|
Ekblad and Grenman, 199268 |
Pregravid weight: Medical records |
Infant BW by group |
G1: 3,538 g ± 535 G2: 3,284 g ± 880 G3: 3,803 g ± 538 |
N/A |
|
G1: Normal prepregnancy weight and normal weight gain G2: Weight gain ≤ 5 kg G3: Weight gain ≥ 20 kg |
||||
|
Finland, hospital |
Total weight gain: Routine prenatal care or maternity records |
|||
|
357 |
(P < 0.005 compared to G1) |
|||
|
Prepregnancy weight 20% over or under ideal body weight for height and normal weight |
||||
|
Poor |
||||
|
Jensen et al., 200559 |
Pregravid weight: Self-report |
Infant BW for groups defined by GWG |
G1: 3,456 g ± 620 G2: 3,624 g ± 675 G3: 3,757 g ± 582 G4: 3,784 g ± 597 |
N/A |
|
Denmark, university hospitals |
||||
|
Total weight gain: Routine prenatal care or maternity records |
G1: GWG < 5.0 kg G2: GWG 5.0-9.9 kg G3: GWG 10-14.9 kg G4: GWG ≥ 15.0 kg |
|||
|
481 |
P < 0.0001 |
|||
|
Obese |
||||
|
Poor |
|
Shapiro et al., 200094 |
Pregravid weight: Routine prenatal care |
Infant BW for groups defined by BMI and weight gain |
G1: 3,363 g G2: 3,636 g G3: 3,565 g G4: 3,774 g |
N/A |
|
USA, community hospital |
||||
|
Total weight gain: Routine prenatal care or maternity records |
||||
|
159 |
G1: Low BMI (< 25), Low gain (< 35 lbs) G2: Low BMI (< 25), High gain (> 35 lbs) G3: High BMI (> 25), Low gain (< 35 lbs) G4: High BMI (> 25), High gain (> 35 lbs) |
|||
|
All weight/BMI |
||||
|
Poor |
||||
|
β unstandardized coefficient from multiple regression; BMI, body mass index; BW, birthweight; cm, centimeters; g, grams; GWG, gestational weight gain; kg, kilogram; lbs, pounds; N/A, not applicable; NR, not reported; RCT, randomized controlled trial; SC, standardized coefficient; SD, standard deviation. |
||||
born to women who gained < 35 lbs. One study among morbidly obese women (BMI > 35) found a similar trend, although it was inconsistent at the extremes of weight gain. Specifically, the following infant birthweights were found for each of the gestational weight gain categories: weight loss or 0 lbs, 3,302 g; 1-15 lbs, 3,192 g; 16-25 lbs, 3,337 g; 26-35 lbs, 3,506 g; > 35 lbs, 3,453 g.
Results for continuous total weight gain Fourteen studies (Table 12) evaluated the relationship between continuous total weight gain and birth-weight using linear regression techniques to determine the effect of every 1 kg increase in weight gain.48,55,59,90,92,93,96,98,100-105 Of these studies, three48,98,103 were rated of good quality, eight55,92,93,100-102,104,105 of fair quality, and three59,90,96 of poor quality. Seven studies of good and fair quality reported that birthweight increased between 16.7 and 22.6 g for every 1 kg increase in weight gain.48,93,98,101-103,105 Three poor-quality studies reported that birthweight increased between 18.4 and 44.3 g for every 1 kg increase in weight gain.59,90,96
Two studies of fair quality reported these values by BMI status.55,104 One found that 1 kg increases in weight gain among normal-weight women were associated with a 15 g increase in infant birthweight and, among obese women, an 11 g increase in infant birthweight.55 The other study reported, for each 1 kg increase in gestational weight gain, a 44.9 g increase in birth-weight for underweight women, a 22.9 g increase for women of normal weight, and an 11.9 g increase for overweight women.104
In the one fair-quality study that stratified by GDM, the association of total weight gain and infant birthweight was stronger among mothers with GDM than among women not diagnosed with GDM.100 Specifically, 1 kg increases in weight gain raised infant birthweight by 27.8 g among nondiabetic mothers and by 39.5 g among mothers with GDM.
Several studies reported statistically significant correlations between gestational weight gain and infant birthweight. Correlation coefficients between birthweight and total weight gain ranged from 0.22 to 0.28 in two fair-quality studies.97,105 A poor-quality study among obese, glucose-tolerant women reported a nonsignificant correlation value of r2 = 0.062.91
Results for continuous total weight gain by trimester Three studies reported on the effects of gestational weight gain, by trimester, on infant birthweights (Table 13).98,101,105 One U.S. study (rated good quality) reported that weight gain during the first trimester was associated with a 31 g increase in birthweight per kg of gestational weight gain. Comparable gains in infant birthweight for each kg of gestational weight gain in the second and third trimesters were 26 g and 7 g.98 This study also found that infant birthweight decreased by 211 g among mothers who lost weight during the first trimester.98
TABLE 12. Total Gestational Weight Gain (continuous) and Infant Birthweight
|
Author, Year Country, Setting Sample Size Baseline BMI Quality |
Pregravid Weight (How Measured) Total Weight Gain (How Measured) |
Definition of Groups |
Results |
Confounders and Effect Modifiers Included in Analysis |
|
Brown et al., 200298 |
Pregravid weight: Measured by study investigators |
G1: Increase in birthweight per 1 kg increase in total pregnancy weight gain |
G1: β = 20 g (P < 0.0001) |
Maternal age, parity, pregravid BMI, height, infant sex, gestational age |
|
USA, primary care clinics |
||||
|
Total weight gain: Collected by study investigators |
||||
|
389 |
||||
|
All weight/BMI |
||||
|
Good |
||||
|
Groff et al., 1997103 |
Pregravid weight: Self-report 82% First prenatal visit 18% |
G1: Increase in birthweight per 1 lb increase in total pregnancy weight gain |
G1: β = 10.1g ± 1.76 (P ≤ 0.001) |
Pregravid BMI, infant sex, smoking |
|
USA, multispecialty clinics |
||||
|
Total weight gain: Routine prenatal care or maternity records |
||||
|
341 |
||||
|
All weights/BMI |
||||
|
Good |
||||
|
Kieffer et al., 200648 |
Pregravid weight: Self-report |
G1: Increase in birthweight per 1 kg increase in total pregnancy weight gain |
G1: β = 19.7 g ± 2.8 (P < 0.01) |
Parity, pregravid BMI, height, 1-hour glucose value, gestational age |
|
USA, community health center |
Total weight gain: Routine prenatal care or maternity records |
|||
|
1,041 |
||||
|
All weights/BMI |
||||
|
Good |
||||
|
Abrams et al., 1995101 |
Pregravid weight: Self-report |
G1: Increase in birthweight per 1 kg increase in total pregnancy weight gain |
G1: β = 22.6 g (P < 0.001) |
Maternal age, parity, pregravid BMI, height, smoking, infant sex, gestational age |
|
USA, university hospital |
Total weight gain: Routine prenatal care or maternity records |
|||
|
4,420 |
||||
|
Nonobese |
||||
|
Fair |
|
Author, Year Country, Setting Sample Size Baseline BMI Quality |
Pregravid Weight (How Measured) Total Weight Gain (How Measured) |
Definition of Groups |
Results |
Confounders and Effect Modifiers Included in Analysis |
|
Butte et al., 200397 |
Pregravid weight: Measured by study investigators |
G1: Correlation coefficient G2: Variability in birthweight accounted for by gestational age, pregravid weight, and total pregnancy weight gain |
G1: 0.28 G2: 37.9% |
Maternal race, pregravid BMI, gestational age |
|
USA, US Agriculture |
||||
|
Total weight gain: Measured by study investigators |
||||
|
Research Service Children’s Nutrition Research Center |
||||
|
63 |
||||
|
All weights/BMI |
||||
|
Fair |
||||
|
Edwards et al., 199655 |
Pregravid weight: Self-report |
G1: Increase in birthweight per 1 kg increase in total pregnancy weight gain for obese women |
G1: β = 11 g ± 2 (P ≤ 0.001) G2: β = 15 g ± 2 (P ≤ 0.001) |
Maternal age, parity, pregravid BMI, pregnancy-induced hypertension, adequacy of prenatal care, alcohol use, drug use, smoking, gestational age |
|
USA, hospital |
Total weight gain: Routine prenatal care or maternity records |
|||
|
1,443 |
||||
|
Normal and obese BMI |
||||
|
G2: Increase in birthweight per 1 kg increase in total pregnancy weight gain for normal weight women |
||||
|
Fair |
||||
|
Guihard-Costa et al., 200492 |
Pregravid weight: Routine prenatal care |
G1: Standardized coefficient for effect of pregnancy weight gain on infant birthweight. |
G1: SC = 0.199 |
Maternal age, parity, pregravid BMI, height |
|
France, hospital database |
||||
|
Total weight gain: Routine prenatal care or maternity records |
||||
|
13,972 |
||||
|
All weights/BMI |
Standardized coefficients are regression coefficients calculated as if all of the independent variables had a variance of 1 |
|||
|
Fair |
|
Author, Year Country, Setting Sample Size Baseline BMI Quality |
Pregravid Weight (How Measured) Total Weight Gain (How Measured) |
Definition of Groups |
Results |
Confounders and Effect Modifiers Included in Analysis |
|
Hediger et al., 1994102 |
Pregravid weight: Self-report |
G1: Increase in birthweight per 1 kg increase in total pregnancy weight gain |
G1: β = 16.7 g ± 2.5 (P = 0.001) |
Maternal age, maternal race/ethnicity, parity, pregravid weight, height, gestational age, prior poor outcome, fat loss, pregravid weight: low weight, fat accretion, smoking, infant sex |
|
USA, setting not stated |
Total weight gain: Routine prenatal care or maternity records |
|||
|
608 |
||||
|
All weights/BMI |
||||
|
Fair |
||||
|
Kirchengast and Hartmann, 200393 |
Pregravid weight: Estimated from measured weight at first prenatal visit |
G1: Increase in birthweight per 1 kg increase in total pregnancy weight gain |
G1: β = 17.32 (14.62, 20.03) |
Maternal age, age at menarche, pregravid weight, height, distantia cristarum |
|
Austria, university hospital |
||||
|
Total weight gain: Routine prenatal care or maternity records |
||||
|
8,011 |
||||
|
All weights/BMI |
||||
|
Fair |
||||
|
Luke et al., 1996104 |
Pregravid weight: Self-report |
Increase in birthweight per 1 kg increase in total pregnancy weight gain for BMI categories: |
G1: β = 44.9 g ± 6.8 (P < 0.01) G2: β = 22.9 g ± 3.9 (P < 0.01) G3: β = 11.9 g ± 5.2 (P < 0.05) |
Maternal age, parity, black ethnicity, smoking, gestational age, infant sex |
|
USA, clinic |
Total weight gain: Routine prenatal care or maternity records |
|||
|
487 |
||||
|
All weights/BMI |
||||
|
Fair |
G1: Underweight G2: Normal weight G3: Overweight |
|
Author, Year Country, Setting Sample Size Baseline BMI Quality |
Pregravid Weight (How Measured) Total Weight Gain (How Measured) |
Definition of Groups |
Results |
Confounders and Effect Modifiers Included in Analysis |
|
Muscati et al., 1996105 |
Pregravid weight: Medical records |
G1: Increase in birthweight per 1 kg increase in total weight gain up to week 20 |
G1: β = 22 g ± 6 (P < 0.01) |
Parity, pregravid standard weight, pregravid excess weight, birth length, infant sex |
|
Canada, public health department |
Total weight gain: Collected by study investigators |
|||
|
371 |
||||
|
All weight/BMI |
||||
|
Fair |
||||
|
Pezzarossa et al., 1996100 |
Pregravid weight: Self-report |
Increase in birthweight per 1 kg increase in total pregnancy weight gain for: |
G1: β = 27.8 g (P = 0.0001) G2: β = 39.5 (P = 0.0001) |
Pregravid BMI, fasting plasma glucose |
|
Italy, not stated |
Total weight gain: Routine prenatal care or maternity records |
|||
|
192 |
||||
|
All weights/BMI |
G1: Controls (normal glucose tolerance) G2: GDM |
|||
|
Fair |
||||
|
Di Cianni et al., 200491 |
Pregravid weight: Not reported |
|
F statistic = 3.16, P = 0.08 |
Pregravid BMI, maternal triglycerides, plasma glucose |
|
Italy, diabetes clinic |
Total weight gain: Collected by study investigators |
|
||
|
180 |
||||
|
All weights/BMI |
||||
|
Poor |
||||
|
Jensen et al., 200559 |
Pregravid weight: Self-report |
G1: Increase in birthweight per 1 kg increase in total pregnancy weight gain |
G1: β = 18.4 g (P < 0.001) |
Maternal age, pregravid BMI, smoking, gestational age, result of 2-hour oral glucose tolerance test |
|
Denmark, university hospitals |
Total weight gain: Routine prenatal care or maternity records |
|||
|
481 |
||||
|
Obese |
||||
|
Poor |
|
Author, Year Country, Setting Sample Size Baseline BMI Quality |
Pregravid Weight (How Measured) Total Weight Gain (How Measured) |
Definition of Groups |
Results |
Confounders and Effect Modifiers Included in Analysis |
|
Paauw et al., 200590 |
Pregravid weight: Self-report |
G1: Increase in birthweight per 1 kg increase in total pregnancy weight gain |
G1: β = 21.0 g |
Maternal race, pregravid weight, marital status, smoking, gestational age |
|
USA, hospital |
Total weight gain: Self-report |
|||
|
351 |
||||
|
All weights/BMI |
||||
|
Poor |
||||
|
Springer et al., 199296 |
Pregravid weight: Self-report |
G1: Increase in birthweight per 1 lb increase in total pregnancy weight gain |
G1: β = 20.1g |
Maternal age, pregravid weight, length of gestation, smoking, weight gain at 20 weeks |
|
USA, university hospital |
Total weight gain: Routine prenatal care or maternity records |
|||
|
107 |
||||
|
All weights/BMI |
||||
|
Poor |
||||
|
AGA, Appropriate for gestational age; β, unstandardized coefficient from multiple regression; BMI, body mass index; g, gram; GDM, gestational diabetes mellitus; kg, kilogram; lb, pound; LGA, large-for-gestational age; NR, not reported. |
||||
A Canadian study of fair quality found similar results: for each 1 kg increase in weight gain up to week 20, birthweight increased by 22 g; increases from week 21 to 30 increased birthweight by 31 g; and weight gain from week 31 to term increased birthweight by 12 g.105 Lastly, another U.S. study of fair quality reported an 18 g increase in birthweight for each kilogram gained by the mother in the first trimester. Corresponding increases in the second and third trimesters were 32.8 g and 17.0 g, respectively.101
Results from other measures of weight gain (net weight gain and proportional weight gain) Four studies examined the associations between infant birthweight and various other measures of gestational weight gain. Three studies (1 rated poor quality) of net weight gain (total gestational weight gain minus infant birthweight) showed that infant birthweight increased as net gestational weight gain increased (Table 14).70,83,104 In one study, for every 1 kg increase in net weight gain, birthweight rose by 15.4 g.70 In another, which examined differences by BMI status, increases of 1 kg
TABLE 13. Continuous Gestational Weight Gain by Trimester and Infant Birthweight
|
Author, Year Country, Setting Sample Size Baseline BMI Quality |
Pregravid Weight (How Measured) Total Weight Gain (How Measured) |
Definition of Groups |
Results |
Confounders and Effect Modifiers Included in Analysis |
|
Brown et al., 200298 |
Pregravid weight: Measured by study investigators |
G1: Increase in birthweight per 1 kg increase in first trimester weight gain G2: Increase in birthweight per 1 kg increase in second trimester weight gain G3: Increase in birthweight per 1 kg increase in third trimester weight gain |
G1: β = 31 g (P < 0.0007) |
Maternal age, parity, pregravid BMI, height, infant sex, gestational age |
|
USA, primary care clinics |
||||
|
Total weight gain: Collected by study investigators |
G2: β = 26 g (P < 0.007) |
|||
|
389 |
||||
|
All weight/BMI |
||||
|
G3: β = 7 g (P < 0.40) |
||||
|
Good |
||||
|
Abrams et al., 1995101 |
Pregravid weight: Self-report |
G1: Increase in birthweight per 1 kg increase in first trimester weight gain G2: Increase in birthweight per 1 kg increase in second trimester weight gain G3: Increase in birthweight per 1 kg increase in third trimester weight gain |
G1: β = 18.0 g ± 2.4 (P < 0.001) |
Maternal age, parity, pregravid BMI, height, smoking, infant sex, gestational age |
|
USA, university hospital |
Total weight gain: Routine prenatal care or maternity records |
|||
|
G2: β = 32.8 g ± 2.8 (P < 0.001) |
||||
|
4,420 |
||||
|
Nonobese |
||||
|
Fair |
G3: β = 17.0 g ± 2.9 (P < 0.001) |
|||
|
Muscati et al., 1996105 |
Pregravid weight: Medical records |
G1: Increase in birthweight per 1 kg increase in total weight gain from weeks 21 to 30 G2: Increase in birthweight per 1 kg increase in total weight gain from weeks 31 to term |
G1: β = 31 g ± 7 (P < 0.001) |
Parity, pregravid standard weight, pregravid excess weight, birth length, infant sex |
|
Canada, public health department |
Total weight gain: Collected by study investigators |
|||
|
G2: β = 12 g ± 6 (P < 0.05) |
||||
|
371 |
||||
|
All weight/BMI |
||||
|
Fair |
||||
|
β, unstandardized coefficient from multiple regression; BMI, body mass index; g, gram; kg, kilogram; lbs, pounds. |
||||
in net weight gain raised infant birthweight as follows: for underweight women, 41.9 g; for women of normal weight, 19.2 g; and for obese women, 9.1 g.104 Each kilogram of net weight gain associated with an increase of 111.2 g in birthweight in another study.83
The fourth study, which considered proportional gestational weight gain (total gestational weight gain divided by pregravid weight) found that for mothers with BMIs of 19.5 to 22.4, those who gained above the median proportional gestational weight gain had infants who were 322 g heavier than the infants of mothers who gained below the median.
Similar results were found for mothers with BMIs of 22.4 to 28.5: those who gained above the median gave birth to infants who were 225 g heavier. Finally, for women with BMIs above 28.5, the increase in birthweight was 232 g.75
Low birthweight
Study characteristics Thirteen studies examined the effect of gestational weight gain on low birthweight (LBW) (Evidence Table 19).2,4,52,54,70,71,75,93,95,106-109 LBW is defined as infant birthweight < 2,500 g. Overall, the risk of LBW decreased as gestational weight gain increased. In general, risks for LBW began to decrease for gestational weight gains above 25 to 30 pounds. In 11 of these studies, the analyses were adjusted for multiple confounders, including maternal age, pregravid BMI, smoking, alcohol use, gestational age, parity, race, marital status, maternal education, pregnancy complications, and infant sex.2,4,52,70,71,75,93,106-109
Overview of results Ten studies considered the relationship between LBW and total gestational weight gain (Table 15).2,4,52,54,71,93,106-109 One of these studies was rated good quality,106 seven of fair quality,2,4,52,71,93,107,108 and two of poor quality.54,109 In general, as gestational weight gain increased, LBW decreased.
Three studies evaluated measures of gestational weight gain other than total gestational weight gain (Table 16).70,75,95 Two70,75 studies were of fair quality and one95 was of poor quality. These studies suggest reduced risk of LBW in association with increases in net, proportional, or other measures of change in weight gain.
Results for total gestational weight gain and LBW Results taken from a figure from a good-quality study of low-income black and Hispanic women showed the trend of decreasing LBW as maternal weight near term compared to the standard weight-for-height increased.106 A population-based cohort study in New York City reported a protective effect for LBW (OR, 0.41; 95% CI, 0.39-0.43) for women who gained more than 41 pounds compared with women who gained less than 41 pounds.71 A study in Denmark found that the risk of LBW was significantly reduced only for
TABLE 14. Net and Proportional Gestational Weight Gain and Infant Birthweight
|
Author, Year Country, Setting Sample Size Baseline BMI Quality |
Pregravid Weight (How Measured) Total Weight Gain (How Measured) |
Definition of Groups |
|
Johnson et al., 199270 |
Pregravid weight: Self-report |
G1: Increase in birthweight per 1 lb increase in net pregnancy weight gain |
|
USA, prenatal clinics |
||
|
3,191 |
Total weight gain: Routine prenatal care or maternity records |
|
|
All weights/BMI |
||
|
Fair |
||
|
Luke et al., 1996104 |
Pregravid weight: Self-report |
Increase in birthweight per 1 kg increase in net pregnancy weight gain for BMI categories: |
|
USA, clinic |
||
|
487 |
Total weight gain: Routine prenatal care or maternity records |
|
|
G1: Underweight G2: Normal weight G3: Overweight |
||
|
All weights/BMI |
||
|
Fair |
||
|
Shepard 199875 |
Pregravid weight: Self-report |
Infant birthweight for mothers with: |
|
USA, obstetrical practices in New Haven, CT |
G1: Low average BMI (19.5 to 22.4), proportional weight gained > median G2: Low average BMI (19.5 to 22.4), gained < median G3: High average BMI (22.5 to 28.5), gained > median G4: High average BMI (22.5 to 28.5), gained < median G5: Obese (> 28.5 BMI), gained > median G6: Obese (> 28.5 BMI), gained < median |
|
|
Total weight gain: Routine prenatal care or maternity records |
||
|
2,301 |
||
|
All weights/BMI |
||
|
Fair |
||
|
Velonakis et al., 199783 |
Pregravid weight: Self-report |
G1: Increase in birthweight for net pregnancy weight gain |
|
France, hospital |
||
|
2,040 |
Total weight gain: Routine prenatal care or maternity records |
|
|
All weights/BMI |
||
|
Poor |
||
|
β, unstandardized coefficient from multiple regression; BMI, body mass index; C-section, cesarean section; g, gram; kg, kilogram; lbs, pounds; N/A, not applicable. |
||
|
Results |
Confounders and Effect Modifiers Included in Analysis |
|
G1: β = 15.4 g ± 2.2 (P < 0.0001) |
Maternal race, parity, pregravid BMI, height, pregravid weight, marital status, education, tobacco/alcohol/drug use, pregnancy-induced hypertension, gestational age, macrosomia, infant sex |
|
G1: β = 41.9 g ± 7.5 (P < 0.01) G2: β = 19.2 g ± 3.9 (P < 0.01) G3: β = 9.1 g ± 5.3 |
Maternal age, parity, black ethnicity, smoking, gestational age, infant sex |
|
G1: 3,231 g G2: 3,553 g G3: 3,395 g G4: 3,620 g G5: 3,685 g G6: 3,453 g |
N/A |
|
G1: β = 111.17 g ± 12.94 (P = 0.000) |
Maternal age, parity, pathology of previous/current pregnancy, previous diseases, reproductive history, marital status, employment, infant sex, height, weight, smoking, alcohol use, APGAR score, gestational age, nationality |
TABLE 15. Total Gestational Weight Gain and Low Birthweight (LBW)
|
Author, Year Country, Setting Sample Size Baseline BMI Quality |
Pregravid Weight (How Measured) Total Weight Gain (How Measured) |
Definition of Groups |
|
Hickey et al., 1990106 |
Pregravid weight: Self-report |
G1: Percent BW < 3,000, Low weight gain < 120% of standard G2: Percent BW ≥ 3,000, Low weight gain < 120% of standard G3: Percent BW < 3,000, Acceptable weight gain ≥ 120% of standard G4: Percent BW ≥ 3,000, Acceptable weight gain ≥ 120% of standard |
|
United States, prenatal clinics |
||
|
Total weight gain: Routine prenatal care or maternity records |
||
|
325 |
||
|
All weights/BMI |
||
|
Good |
||
|
Cogswell et al., 19942 |
Pregravid weight: Self-report |
ORs and 95% CI, for LBW by GWG and prepregnancy BMI |
|
USA, Pregnancy Nutrition Surveillance System |
||
|
Total weight gain: Self-report |
G1: Normal BMI, GWG < 15 lbs G2: Normal BMI, GWG ≥ 40 lbs G3: Normal BMI, GWG 25-29 lbs (Reference for normal BMI) G4: Overweight BMI, GWG 30-34 lbs G5: Overweight BMI, GWG 35-39 G6: Overweight BMI, GWG ≥ 40 lbs G7: Overweight BMI, GWG 15-19 lbs (Reference for overweight BMI) |
|
|
53,541 |
||
|
Normal/Overweight/Obese |
||
|
Fair |
||
|
Desjardins and Hardwick, 1999107 |
Pregravid weight: Self-report |
G1: OR and 95% CI, for LBW and inadequate weight gain (defined by dietician) |
|
Canada, Healthiest Babies Possible Program |
Total weight gain: Home visitor’s scale |
|
|
1,892 |
||
|
All weights/BMI |
||
|
Fair |
||
|
Kiel et al., 20074 |
Pregravid weight: Medical records |
G1: Odds of LBW for weight gain > 25 lbs G2: OR of LBW for weight gain < 15 lbs G3: Reference Weight gain 15-25 lbs |
|
USA, birth certificate registry |
||
|
Total weight gain: Routine prenatal care or maternity records |
||
|
120,251 |
||
|
Obese |
||
|
Fair |
|
Results |
Confounders and Effect Modifiers Included in Analysis |
|
G1: 38.2 G2: 61.8 G3: 22.1 G4: 77.9 |
N/A |
|
G1: 2.1 (1.6-2.6) G2: 0.5 (0.4-0.6) G3: 1.0 G4: 0.5 (0.3-0.8) G5: 0.6 (0.3-1.1) G6: 0.4 (0.3-0.7) G7: 1.0 |
Maternal age, maternal race, height, smoking, infant sex, gestational age |
|
G1: 1.15 (0.78-1.67) |
Gestational age, adolescence, pregravid underweight, number of Healthiest Baby Possible visits |
|
G1: Odds of LBW are lower for women in this group G2: Odds of LBW are higher for women in this group Numerical value for ORs not reported in study |
Maternal age, maternal race, maternal education, poverty, smoking, parity, chronic hypertension |
|
Author, Year Country, Setting Sample Size Baseline BMI Quality |
Pregravid Weight (How Measured) Total Weight Gain (How Measured) |
Definition of Groups |
|
Kirchengast and Hartmann, 200393 |
Pregravid weight: Estimated from measured weight at first prenatal visit |
G1: OR and 95% CI, for LBW |
|
Austria, university hospital |
||
|
8,011 |
Total weight gain: Routine prenatal care or maternity records |
|
|
All weights/BMI |
||
|
Fair |
||
|
Murakami et al., 200452 |
Pregravid weight: Self-report |
OR and 95% CI, for LBW |
|
G1: GWG < 8.5 kg G2: GWG 8.5-12.5 kg G3: GWG > 12.5 kg |
||
|
Japan, hospital |
Total weight gain: Routine prenatal care or maternity records |
|
|
633 |
||
|
All weights/BMI |
||
|
Fair |
||
|
Rosenberg et al., 200571 |
Pregravid weight: Self-report |
OR and 95% CI, for LBW |
|
G1: GWG ≥ 41 lbs G2: GWG < 41 lbs |
||
|
USA, vital statistics data |
Total weight gain: Routine prenatal care or maternity records |
|
|
329,988 |
||
|
All weights/BMI |
||
|
Fair |
||
|
Zhou and Olsen, 1997108 |
Pregravid weight: Self-report |
OR and 95% CI, for LBW for GWG categories by BMI |
|
Denmark, two communities |
Total weight gain: Routine prenatal care or maternity records |
G1: GWG < 11 kg, Underweight (Reference) G2: GWG < 11 kg, Normal weight G3: GWG < 11 kg, Overweight G4: GWG 12-15 kg, Underweight G5: GWG 12-15 kg, Normal weight G6: GWG 12-15 kg, Overweight G7: GWG ≥ 16 kg, Underweight G8: GWG ≥ 16 kg, Normal weight G9: GWG ≥ 16 kg, Overweight |
|
7,122 |
||
|
All weights/BMI |
||
|
Fair |
|
Results |
Confounders and Effect Modifiers Included in Analysis |
|
G1: 0.90 (0.85-0.95) |
Maternal age, pregravid weight, height, distantia cristarum |
|
G1: 1.26 (0.57-2.75) G2: Reference G3: 0.62 (0.24-1.62) |
Maternal age, parity, pregravid BMI, smoking, gestational age |
|
G1: 0.41 (0.39-0.43) G2: Reference |
Maternal age, parity, GDM, pregnancy-induced hypertension, preeclampsia, pregravid weight, chronic diabetes, chronic hypertension, marital status, maternal education, mother’s birthplace, prenatal care payer, social risk, trimester prenatal care began |
|
G1: 1.0 G2: 0.9 (0.5-1.5) G3: 0.8 (0.3-2.0) G4: 0.5 (0.2-1.0) G5: 0.8 (0.4-1.5) G6: 0.9 (0.2-3.8) G7: 0.3 (0.1-1.0) G8: 0.4 (0.2-0.8) G9: 0.0 (0.0-2,500) |
Maternal age, parity, alcohol, no diabetes, term delivery, smoking, infant sex, gestational age |
|
Author, Year Country, Setting Sample Size Baseline BMI Quality |
Pregravid Weight (How Measured) Total Weight Gain (How Measured) |
Definition of Groups |
|
Bianco et al., 199854 |
Pregravid weight: Self-report |
% LBW for GWG: |
|
USA, medical center |
G1: Weight loss or 0 lbs G2: 1-15 lbs G3: 16-25 lbs G4: 26-35 lbs G5: > 35 lbs |
|
|
613 |
Total weight gain: Routine prenatal care or maternity records |
|
|
Morbidly obese (BMI > 35) |
||
|
Poor |
||
|
Lasker et al., 2005109 |
Pregravid weight: Not stated |
OR and 95% CI, for LBW |
|
USA, hospital |
G1: GWG < 10 lbs G2: GWG > 30 lbs G3: GWG 21-30 lbs (Reference) |
|
|
5,528 |
Total weight gain: Routine prenatal care or maternity records |
|
|
All weights/BMI |
||
|
Poor |
||
|
BMI, body mass index; BW, birthweight; CI, confidence interval; GDM, gestational diabetes mellitus; GWG, gestational weight gain; kg, kilogram; lbs, pounds; LBW, low birthweight; N/A, not applicable; OR, odds ratio. |
||
underweight women gaining at least 12 kg when compared to underweight women gaining less than 11 kg (OR, 0.5; 95% CI, 0.2-1.0).108 A study in Austria93 found that the odds ratio of LBW was 0.9 (95% CI, 0.85-0.95) for each 1 kg increase in gestational weight gain. A study among obese women also found that the risk of having a LBW infant was increased for low gestational weight gains.4
Among low-income women the effect of weight gain varied by pregravid BMI;2 only among women of average weight was there a consistent decrease in LBW risk as gestational weight gain increased from < 15 pounds to ≥ 40 pounds. Mothers of average weight who gained less than 15 pounds had an OR for delivering an LBW infant of 2.1 (95% CI, 1.6-2.6). The odds of LBW were substantially lower for women who gained more than 40 pounds (OR, 0.5; 95% CI, 0.4-0.6). There was no reduction in the percentage of LBW infants for weight gains above 30 to 34 pounds for overweight women, and for weight gains above 15 to 19 pounds for obese women. For overweight women gaining 30 to 34 pounds, the OR was 0.5 (95% CI, 0.3-0.8). The poor-quality studies showed results in the same general direction.54,109
|
Results |
Confounders and Effect Modifiers Included in Analysis |
|
G1: 2 G2: 11.1 G3: 8.3 G4: 5.2 G5: 3.8 |
N/A |
|
G1: 2.43 (1.45-4.05) G2: 0.63 (0.47-0.85) G3: 1.00 |
Maternal age, maternal race, marital status, prenatal care, prior term births, prior abortions, prior preterm births, BMI at delivery, preeclampsia, bleeding, smoking, multiple births, premature birth, congenital anomaly, incompetent cervix, smoking |
Two fair-quality studies did not find a statistically significant association between total gestational weight gain and LBW, although the point estimates were in the expected direction.52,107 Among a cohort of Japanese women,52 for weight gain < 8.5 kg, the adjusted OR of LBW was 1.26 (95% CI, 0.57-2.75) and for weight gain > 12.5 kg, it was 0.62 (95% CI, 0.24-1.62), when these groups were compared with women gaining between 8.5 and 12.5 kg. Another study found that inadequate weight gain was associated with an OR for LBW of 1.15 (95% CI, 0.78-1.67);107 in this study, a dietitian determined inadequate weight gain status (exact criteria were not reported).
Results for net, proportional, or other measures of change in weight gain and LBW One study looked at the relationship between net weight gain (total gestational weight gain minus infant birthweight) and the risk of LBW; the risk decreased as net weight gain increased.70 Odds ratios reported are in comparison with women gaining < 14.9 pounds. For mothers gaining > 33 pounds, the OR was 0.38 (95% CI, 0.2-0.8); for women gaining 24 to 33 pounds, the OR was 0.54 (95% CI, 0.28-1.04); and for women
TABLE 16. Other Gestational Weight Gain Measures and LBW
|
Author, Year Country, Setting Sample Size Baseline BMI Quality |
Pregravid Weight (How Measured) Total Weight Gain (How Measured) |
Definition of Groups |
|
Johnson et al., 199270 |
Pregravid weight: Self-report |
OR and 95% CI, for LBW |
|
USA, prenatal clinics |
G1: Net WG < 14.9 lbs (Reference) G2: Net WG 14.9-23.5 lbs G3: Net WG 24-33 lbs G4: Net WG > 33 lbs |
|
|
Total weight gain: Routine prenatal care or maternity records |
||
|
3,191 |
||
|
All weights/BMI |
||
|
Fair |
||
|
Shepard, 199875 |
Pregravid weight: Self-report |
%LBW |
|
USA, obstetrical practices in New Haven, CT |
G1: Proportional WG < median, underweight (BMI < 19.4) G2: Proportional WG < median, obese (BMI > 28.5) G3: Proportional WG > median, underweight (BMI < 19.4) G4: Proportional WG > median, Low-average BMI (19.5-22.4) G5: Proportional WG > median, High-average BMI (22.5-28.5) G6: Proportional WG > median, obese (BMI > 28.5) |
|
|
Total weight gain: Routine prenatal care or maternity records |
||
|
2,301 |
||
|
All weights/BMI |
||
|
Fair |
||
|
Cherry et al., 199395 |
Pregravid weight: Measured by study investigators |
%LBW for each shifting of EW category. |
|
USA, hospital |
||
|
599 |
Light: < 90% EW Normal: 90 to 110% of EW Heavy: > 110% EW |
|
|
Total weight gain: Routine prenatal care or maternity records |
||
|
All weights/BMI |
||
|
Poor |
G1: Heavy to normal G2: Normal to light G3: Normal to heavy G4: Light to normal |
|
|
BMI, body mass index, CI, confidence interval; EW, expected weight; lb, pound; LBW, low birthweight; N/A, not applicable; OR, odds ratio; WG, weight gain. |
||
|
Results |
Confounders and Effect Modifiers Included in Analysis |
|
G1: 1.0 (Reference) G2: 0.51 (0.27-0.98) G3: 0.54 (0.28-1.04) G4: 0.38 (0.2-0.8) |
Maternal race, parity, pregravid BMI, height, pregravid weight, marital status, education, tobacco/alcohol/drug use, pregnancy-induced hypertension, gestational age, macrosomia, infant sex |
|
G1: 3.5% G2: 7.4% G3: 2.1% G4: 2.8% G5: 2.1% G6: 4.6% |
N/A |
|
G1: 5% G2: 32% G3: 3.1% G4: 2.7% |
N/A |
gaining 14.9 to 23.5 pounds, the OR was 0.51 (95% CI, 0.27-0.98). The association between risk of LBW infants and proportional weight gain (total gestational weight gain divided by pregravid weight) above and below the median was also evaluated in relation to BMI status.75 Obese women had a higher percentage of LBW infants than underweight women. The risk of LBW was even higher for women gaining less than the median.
A study of adolescent mothers (rated poor quality) showed similar effects. Mothers who shifted to lower weight classes during pregnancy were more likely to have LBW babies, and mothers who progressed to higher weight classes had lower percentages of LBW.95
Macrosomia
Study characteristics Twelve studies examined the influence of gestational weight gain on macrosomia in their infants (Evidence Table 20).2,4,49,59,70,77,93,108,110-113 Studies did not define macrosomia consistently. Four studies defined macrosomia as birthweight > 4,500 g.2,108,110,113 Seven of the remaining eight studies defined macrosomia as birthweight > 4,000 g.4,59,70,77,93,111,112 One study applied both definitions.49 One110 study was rated to be of good quality, nine2,4,70,77,93,108,111-113 of fair quality, and two49,59 of poor quality.
Overview of results In four studies (all fair2,108,110,113) defining macrosomia as birth > 4,500 g and seven (6 fair4,70,77,93,111,112 and 1 poor59) studies defining macrosomia as birthweight > 4000 g, the highest weight gains were demonstrated to be associated with macrosomia. A single poor study failed to show a significant association, using either definition of macrosomia.49
Detailed results In four of the studies in which macrosomia was defined as birthweight > 4,500 g,2,108,110,113 the highest weight gains were associated with increased risk of macrosomia (Table 17). These four studies adjusted for multiple confounders such as age, BMI, race, parity, glucose levels, placental weight, smoking status, gestational age, and infant sex.2,108,110,113 A nested case-control study (rated good quality), using women gaining 0.22 to 0.31 kg per week as the reference group, found that women with the highest rates of pregnancy weight gain (0.40 to 1.03 kg/week) were at increased risk for macrosomia (OR, 2.23; 95% CI, 1.54-3.22) and that women with the lowest rates (−0.26 to 0.21 kg/week) were at decreased risk (OR, 0.52; 95% CI, 0.34-0.79).110 Results were similar when considering rates of weight gain only before 24 to 28 weeks of gestation.
A fair-quality study in Denmark also showed increased risk of macrosomia at the highest weight gains, with the highest risks among overweight
TABLE 17. Gestational Weight Gain and Macrosomia > 4,500 g
|
Author, Year Country, Setting Sample Size Baseline BMI Quality |
Pregravid Weight (How Measured) Total Weight Gain (How Measured) |
Definition of Groups |
Results |
Confounders and Effect Modifiers Included in Analysis |
|
Hedderson et al., 2006110 |
Pregravid weight: Self-report |
ORs and 95% CI, for macrosomia based on rate of weight gain |
G1: 0.52 (0.34-0.79) G2: 1.00 G3: 0.99 (0.67-1.47) G4: 2.23 (1.54-3.22) |
Maternal age, maternal race/ethnicity, parity, pregravid BMI, screening glucose value, gestational age |
|
USA, Kaiser Permanente Medical Care Program |
Total weight gain: Routine prenatal care or maternity records |
Rate of gain kg/wk: G1: −0.26 to 0.21 G2: 0.22 to 0.31 (Reference) G3: 0.32 to 0.39 G4: 0.40 to 1.03 |
||
|
45,245 |
||||
|
All weights/BMI |
||||
|
Good |
||||
|
Clausen et al., 2005113 |
Pregravid weight: Routine prenatal care |
ORs and 95% CIs for macrosomia |
G1: 1.0 G2: 2.1 (0.8-5.1) G3: 3.5 (1.5-8.0) G4: 4.3 (1.9-9.8) |
Maternal age, parity, smoking, placental weight, gestational diabetes, first trimester BMI |
|
Norway, university hospital |
G1: WG, Quartile 1 (Reference) G2: WG, Quartile 2 G3: WG, Quartile 3 G4: WG, Quartile 4 |
|||
|
2050 |
Total weight gain: Routine prenatal care of maternity records |
|||
|
All weights/BMI |
||||
|
Fair |
|
Author, Year Country, Setting Sample Size Baseline BMI Quality |
Pregravid Weight (How Measured) Total Weight Gain (How Measured) |
Definition of Groups |
Results |
Confounders and Effect Modifiers Included in Analysis |
|
Cogswell et al., 19942 |
Pregravid weight: Self-report |
ORs and 95% CIs for macrosomia by GWG and prepregnancy BMI |
G1: 1.0 G2: 1.5 (1.0-2.3)G3: 3.3 (2.3-4.7) G4: 1.0 G5: 4.0 (1.6-10.1) G6: 1.0 G7: 1.9 (1.3-2.9) G8: 2.1 (1.3-3.2) G9: 2.3 (1.6-3.3) |
Maternal age, maternal race, height, smoking, infant sex, gestational age |
|
USA, Pregnancy Nutrition Surveillance System |
||||
|
Total weight gain: Self-report |
G1: Normal BMI, GWG 25-29 lbs (Reference for normal BMI) G2: Normal BMI, GWG 35-39 lbs G3: Normal BMI, GWG ≥ 40 lbs G4: Overweight BMI, GWG 15-19 lbs (Reference for overweight BMI) G5: Overweight BMI, GWG ≥ 40 lbs G6: Obese, GWG 15-19 lbs (Reference for obese GMI) G7: Obese BMI, GWG 30-34 lbs G8: Obese BMI, GWG 35-39 lbs G9: Obese BMI, GWG ≥ 40 lbs |
|||
|
53,541 |
||||
|
Normal/Overweight/Obese |
||||
|
Fair |
|
Zhou and Olsen, 1997108 |
Pregravid weight: Self-report |
OR and 95% CI, for macrosomia by GWG categories and BMI |
G1: 1.0 G2: 52.8 (0.3-22.9) G3: 9.7 (1.2-81.8) G4: 0.0 (0.0-7×10⁵) G5: 6.8 (0.9-51) |
G6: 27.1 (3.3-220) G7: 6.1 (0.7-52.5) G8: 15.7 (2.2-114) G9: 45.6 (6.0-349) |
Maternal age, parity, alcohol, no diabetes, term delivery, smoking, infant sex, gestational age |
|
Denmark, two communities |
Total weight gain: Routine prenatal care or maternity records |
G1: GWG < 11 kg, underweight (Reference) G2: GWG < 11 kg, normal weight G3: GWG < 11 kg, overweight G4: GWG 12-15 kg, underweight, G5: GWG 12-15 kg, normal weight G6: GWG 12-15 kg, overweight G7: GWG ≥ 16 kg, underweight G8: GWG ≥ 16 kg, normal weight G9: GWG ≥ 16 kg, overweight |
|||
|
7,122 |
|||||
|
All weights/BMI |
|||||
|
Fair |
|||||
|
Brennand et al., 200549 |
Pregravid weight: Medical records |
% Macrosomia among obese women only |
G1: 16.9% G2: 15.3% G3: 18.4% (P = 0.834) |
|
N/A |
|
Canada, medical records |
|||||
|
Total weight gain: Routine prenatal care or maternity records |
G1: Low WG, < 7 kg G2: Acceptable WG, 7-11.5 kg G3: Excessive WG, > 11.5 kg |
||||
|
603 |
|||||
|
Normal/Overweight/Obese |
|||||
|
Poor |
|||||
|
BMI, body mass index; CI, confidence interval; GWG, gestational weight gain; kg, kilogram; kg/wk, kilogram per week; N/A, not applicable; OR, odds ratio; wk, week. |
|||||
and obese women.108 However, the confidence intervals from this study are very imprecise. A fair-quality study in Norway showed similar results, with increasing ORs as weight gain increased. Women with weight gain in the fourth quartile, as compared to weight gain in the first quartile, had the highest OR of 4.3 (95% CI, 1.9-9.8).113
Among low-income women enrolled in the Supplemental Food Program for Women, Infants, and Children (WIC), a fair-quality U.S. study reported significant associations between weight gain and macrosomia only for women gaining more than 30 to 34 pounds when compared with women gaining 25 to 29 pounds for women of normal weight or with women gaining 5 to 19 pounds for overweight and obese women.2 For average-weight women, the OR was 1.5 (95% CI, 1.0-2.3), for those gaining 35 to 39 pounds and 3.3 (95% CI, 2.3-4.7) for women gaining 40 pounds or more. Overweight women also had high risks for macrosomia, but only at weight gains of 40 pounds or more (OR, 4.0; 95% CI, 1.6-10.1). The OR among obese women gaining 30 to 34 pounds was 1.9 (95% CI, 1.3-2.9). Similar results were found for obese women gaining more than 35 pounds with odds ratios ranging from 2.1 to 2.3.
In a U.S. study of Cree women (rated poor quality), weight gain among obese women was not significantly associated with macrosomia.49
Of the eight studies that considered macrosomia as > 4,000 g, seven found a significant association between gestational weight gain and macrosomia (Table 18).4,59,70,77,93,111,112 In general, the highest weight gains were associated with an increased risk of macrosomia. Six4,70,77,93,111,112 of these studies were rated of fair quality, and one59 of poor quality. These studies were adjusted for multiple confounders including maternal age, race, education, parity, height, pregravid weight, pregravid BMI, distantia cristarum, length of gestation, glucose levels, smoking status, and infant sex.
Among the fair-quality studies of gestational weight gain on macrosomia, ORs for this association were between 2.41 and 3.37 for the highest weight gains when compared to weight gains within the normal range.70,77,111,112 Among a cohort of Japanese women (fair-quality study), the group with total weight gain above the 90th percentile for gestational age had an OR for macrosomia of 2.41 (95% CI, 1.83-3.17) relative to the group in the 50th to 74th percentile.111 The effect was reduced for total weight gain based on percentile for gestational age for the lower percentile ranges. A fair-quality U.S. study looked at the association between net weight gain (total gestational weight gain minus infant birthweight) and macrosomia.70 With women gaining < 14.9 pounds as the reference group, the strongest effect was noted among women gaining > 33 pounds (OR, 2.86; 95% CI, 2.02-4.02), followed by women gaining 24 to 33 pounds (OR, 1.77; 95% CI, 1.24-2.52); no significant effect was observed for women gaining 14.9 to 23.5 pounds. A fair-quality study in Germany found
TABLE 18. Gestational Weight Gain and Macrosomia > 4,000g
|
Author, Year Country, Setting Sample Size Baseline BMI Quality |
Pregravid Weight (How Measured) Total Weight Gain (How Measured) |
Definition of Groups |
Results |
Confounders and Effect Modifiers Included in Analysis |
|
Bergmann et al., 2003112 |
Pregravid weight: Not stated |
ORs and 95% CIs of macrosomia |
G1: 1.0 G2: 1.85 (1.77-1.93) G3: 3.37 (3.22-3.53) |
Pregravid BMI, height, parity, smoking, diabetes, postterm delivery |
|
Germany, Berlin Perinatal Registry |
||||
|
Total weight gain: Not stated |
G1: WG < 10 kg (Reference) G2: WG 10-16 kg G3: WG ≥ 16 kg |
|||
|
206,308 |
||||
|
All weights/BMI |
||||
|
Fair |
||||
|
Jain et al., 200777 |
Pregravid weight: Not stated |
ORs and 95% CIs for macrosomia |
G1: 0.49 (0.30-0.82) G2: 1.0 G3: 1.17 (0.82-1.65) G4: 2.83 (2.04-3.92) |
Maternal age, pregravid BMI, parity, education, race/ethnicity, US/foreign origin |
|
USA, birth certificate records and Pregnancy Risk Assessment Monitoring System |
||||
|
Total weight gain: Birth certificate |
G1: WG ≤ 15 lbs G2: WG 15-24 lbs G3: WG 25-35 lbs G4: WG ≥ 35 lbs |
|||
|
7,661 |
||||
|
All weights/BMI |
||||
|
Fair |
|
Author, Year Country, Setting Sample Size Baseline BMI Quality |
Pregravid Weight (How Measured) Total Weight Gain (How Measured) |
Definition of Groups |
Results |
Confounders and Effect Modifiers Included in Analysis |
|
Johnson et al., 199270 |
Pregravid weight: Self-report |
OR and 95% CI, for macrosomia |
G1: 1.0 G2: 1.20 (0.83-1.75) G3: 1.77 (1.24-2.52) G5: 2.86 (2.02-4.02) |
Maternal race, parity, pregravid BMI, height, pregravid weight, marital status, education, tobacco/alcohol/drug use, pregnancy-induced hypertension, gestational age, macrosomia, infant sex |
|
USA, prenatal clinics |
||||
|
Total weight gain: Routine prenatal care or maternity records |
G1: Net WG < 14.9 lbs (Reference) G2: Net WG 14.9-23.5 lbs G3: Net WG 24-33 lbs G4: Net WG > 33 lbs |
|||
|
3,191 |
||||
|
All weights/BMI |
||||
|
Fair |
||||
|
Kiel et al., 20074 |
Pregravid weight: Medical records |
G1: Odds of macrosomia for WG > 25 lbs G2: OR of macrosomia for WG < 15 lbs G3: Reference WG 15-25 lbs |
G1: Odds of Macrosomia are higher for women in this group G2: Odds of Macrosomia are lower for women in this group |
Maternal age, maternal race, maternal education, poverty, smoking, parity, chronic hypertension |
|
USA, birth certificate registry |
||||
|
Total weight gain: Routine prenatal care or maternity records |
||||
|
120,251 |
||||
|
Obese |
||||
|
Fair |
Numerical value for ORs not reported in study |
|||
|
Kirchengast and Hartmann, 200393 |
Pregravid weight: Estimated from measured weight at first prenatal visit |
G1: OR and 95% CI, for Macrosomia |
G1: 1.07 (1.05-1.10) |
Maternal age, pregravid weight, height, distantia cristarum |
|
Austria, university hospital |
||||
|
8,011 |
Total weight gain: Routine prenatal care or maternity records |
|||
|
All weights/BMI |
||||
|
Fair |
|
Takimoto et al., 2006111 |
Pregravid weight: Medical records |
ORs and 95% CI, for macrosomia |
G1: 0.31 (0.20-0.47) G2: 0.49 (0.34-0.70) G3: 1.0 G4: 1.62 (1.24-2.12) G5: 2.41 (1.83-3.17) |
Maternal age, parity, pregravid weight, gestational age, infant sex |
|
Japan, obstetric units |
||||
|
112,257 |
Total weight gain: Routine prenatal care or maternity records |
G1: Total GWG < 25th percentile for GA G2: Total GWG 25-49th percentile for GA G3: Total GWG 50-74th percentile for GA (Reference) G4: Total GWG 75-89th percentile for GA G5: Total GWG ≥ 90th percentile for GA |
||
|
All weights/BMI |
||||
|
Fair |
||||
|
Brennand et al., 200549 |
Pregravid weight: Medical records |
% Macrosomia among obese women only |
G1: 47.0% G2: 42.9% G3: 54.4% (P = 0.234) |
N/A |
|
Canada, medical records |
||||
|
603 |
Total weight gain: Routine prenatal care or maternity records |
G1: Low WG, < 7 kg G2: Acceptable WG, 7-11.5 kg G3: Excessive WG, > 11.5 kg |
||
|
Normal/Over-weight/Obese |
||||
|
Poor |
||||
|
Jensen et al., 200559 |
Pregravid weight: Self-report |
ORs and 95% CIs for Macrosomia |
G1: 1.0 G2: 1.8 (0.8-3.8) G3: 2.2 (1.0-4.7) G4: 4.0 (1.8-9.0) |
Maternal age, pregravid BMI, gestational age, 2-hour OGTT, parity, smoking, ethnicity, clinical center |
|
Denmark, university hospitals |
||||
|
Total weight gain: Routine prenatal care or maternity records |
G1: GWG < 5.0 kg (Reference) G2: GWG 5.0-9.9 kg G3: GWG 10.0-14.9 kg G4: GWG ≥ 15.0 kg |
|||
|
481 |
||||
|
Obese |
||||
|
Poor |
||||
|
BMI, body mass index; CI, confidence interval; GA, gestational age; GWG, gestational weight gain; lbs, pounds; OGTT, oral glucose tolerance test; OR, odds ratio; WG, weight gain. |
||||
a higher risk of macrosomia for women gaining more than 16 kg as compared to women gaining less than 10 kg (OR, 3.37; 95% CI, 3.22-3.53).112 Similar results were noted in a fair-quality U.S. study where weight gains above 35 pounds (as compared to weight gains of 15 to 25 pounds) were associated with an OR for macrosomia of 2.83 (95% CI, 2.04-3.92).77 A fair-quality study in Austria found that for each 1 kg increase in gestational weight gain, the OR for macrosomia was 1.07 (95% CI, 1.05-1.10).93 Of the poor-quality studies, one found results in a similar direction.59 One poor-quality study among obese Cree women found that the percent macrosomia did not differ between weight gain groups.49
Size based on gestational age
Study characteristics Twenty-five articles from 23 studies examined the association between gestational weight gain and large-for-gestational-age (LGA) and small-for-gestational-age (SGA) infants.4,51,58,59,61,66,68,89,95,100,105,108,111,114-123 These investigators used various definitions to classify both LGA and SGA infants. Some defined LGA as birthweight greater than the 90th percentile or more than 2 standard deviations (SD) above the mean. Some defined SGA as birthweight less than the 10th (or 15th) percentile or more than 2 (or 1.5) SD below the mean.
Of the 14 articles addressing LGA (Evidence Table 21),4,54,58,59,61,68,100,105,115,116,118,120-122 two defined LGA using the > 2 SD criterion.58,120 Ten used the commonly applied 90th percentile definition;4,54,59,61,100,105,115,116,118,121 one study evaluated multiple percentiles;68 and one defined LGA as fetal growth ratio (FGR) > 1.15.122 FGR is the ratio of the observed birthweight at a given gestational age to the mean birthweight at a given gestational age for a certain fetal growth distribution.
SGA definitions varied considerably as well: birthweight < 10th percentile; < 2 (or 1.5) SD below the mean; FGR < 0.85; or a combination of birthweight and percentile of placenta weight. If a study used a definition other than birthweight < 10th percentile, the specific criterion used will be noted in the text below. In general, the lowest weight gains were associated with increased risks for SGA.
Overview of results for LGA Among the studies that did not use BMI status (Table 19), six100,105,115,118,121,122 were rated of fair quality and four54,59,68,120 of poor quality. All reported lower risks of LGA with lower gestational weight gain. Studies that stratify by BMI status present greater challenges to synthesis. Two studies (1 good116 and 1 fair58) examined a range of BMI categories, and found inconsistent results: one reported that the estimates of LGA did not differ greatly across BMI categories116 while the other reported that high weight gain (> 16 kg) was strongly associated with LGA, and this association was most pronounced in the lowest BMI
categories. A fair-quality study of obese women4 observed lower odds of LGA among women who gained less than the reference group (15-25 pounds) and higher odds of LGA among women who gained more the reference group. A poor-quality study among Japanese women found that nulliparous women in the highest weight gain category (> 0.40 kg/week) had ORs for LGA of 2.25 (95% CI, 1.03-4.94) for low BMI women and 2.58 (95% CI, 1.71-3.89) for medium BMI women.61
Detailed results Among the studies that did not use BMI status (Table 19), three fair-quality studies that evaluated the impact of a 1 kg increase in weight gain produced similar results.105,115,121 For Italian women, the OR of having an LGA infant was 1.08 (95% CI, 1.03-1.12).115 For nondiabetic Japanese women with a positive diabetic screen, the OR was 1.08 (95% CI, 0.81-1.44).121 The third study evaluated this relationship separately for weight gain by time: up to week 20, from week 21 to week 30, and from week 31 to term. It found ORs of 1.17, 1.16, and 1.02 (non-significant), respectively.105 The OR for weeks 31 to term was not significant. In other words, the odds of giving birth to an LGA infant tends to increase for each 1 kg increase in gestational weight gain during the first and second trimester.
Two fair-quality studies100,118 considered the association between categorical weight gain and LGA. In a U.S. study,118 women with the highest weight gains were at increased risk for LGA (OR, 1.89; 95% CI, 1.51-2.37) relative to women in the 25th to 75th percentile of weight gain and to women in the 10th to 90th percentile (OR. 1.87; 95% CI, 1.39-2.52). In a study involving mothers with GDM,100 the risks for LGA were similar for weight gains up to 9 kg. However, for weight gains of 9 to 14 kg, the risk of LGA for mothers with GDM was two times that for nondiabetic mothers.
In a study that defined LGA as FGR > 1.15,122 the OR for having an LGA infant given a 5 kg decrease in net gestational weight gain (total gestational weight gain minus infant birthweight) was 0.73 (95% CI, 0.68-0.79). This result is consistent with other studies reporting that the odds of LGA drops with lower gains in maternal weight.
The poor-quality studies showed similar results. LGA was significantly related to the highest weight gains among studies of GDM mothers,120 obese glucose-tolerant mothers,59 and morbidly obese mothers.54 A Finnish study68 noted that women gaining ≥ 20 kg were more likely to have babies in the higher weight gain percentile categories, but these differences were not significantly different.
Four studies stratified results by BMI status (Table 20).4,58,61,116 In a good-quality U.S. study, the estimates of LGA did not differ greatly across BMI categories.116 The ORs of LGA for rate of weight gain of 50 g per week were as follows: among underweight women, 1.25 (95% CI,
TABLE 19. Gestational Weight Gain and LGA
|
Author, Year Country, Setting Sample Size Baseline BMI Quality |
Pregravid Weight (How Measured) Total Weight Gain (How Measured) |
Definition of Groups |
|
Bo et al., 2003115 |
Pregravid weight: Self-report |
G1: OR and 95% CI, for LGA for each 1 kg increase in GWG |
|
Italy, university clinic |
||
|
700 |
Total weight gain: Not collected |
|
|
All weights/BMI |
||
|
Fair |
||
|
Kitajima et al., 2001121 |
Pregravid weight: Self-report |
G1: OR and 95% CI, for LGA for each 1 kg increase in GWG |
|
Japan, university hospital |
||
|
Total weight gain: Routine prenatal care or maternity records |
||
|
146 |
||
|
All weights/BMI |
||
|
Fair |
||
|
Kramer et al., 1990122 |
Pregravid weight: Self-report |
G1: OR and 95% CI, for LGA for each 5 kg decrease in net gestational WG |
|
Canada, university hospital |
||
|
Total weight gain: Routine prenatal care or maternity records |
||
|
8,719 |
||
|
All weights/BMI |
||
|
Fair |
||
|
Muscati et al., 1996105 |
Pregravid weight: Medical records |
G1: OR for LGA per 1 kg increase in WG up to week 20 G2: OR for LGA per 1 kg increase in WG from weeks 21 to 30 G3: OR for LGA per 1 kg increase in WG from weeks 31 to term |
|
Canada, public health department |
||
|
Total weight gain: Collected by study investigators |
||
|
371 |
||
|
All weight/BMI |
||
|
Fair |
||
|
Parker and Abrams, 1992118 |
Pregravid weight: Self-report |
ORs and 95% CIs of LGA for high WG |
|
USA, hospital |
||
|
6,690 |
Total weight gain: Routine prenatal care or maternity records |
G1: Compared to UCSF Cohort 25-75th percentile of WG |
|
All weights/BMI |
G2: Compared to UCSF 10-90th percentile of WG |
|
|
Fair |
|
Results |
Confounders and Effect Modifiers Included in Analysis |
|
G1: 1.08 (1.03-1.12) |
Maternal age, pregravid BMI, smoking, gestational hyperglycaemia |
|
G1: 1.08 (0.81-1.44) |
Pregravid BMI, maternal plasma glucose levels, gestational age, infant sex |
|
G1: 0.73 (0.68-0.79) |
Pregravid weight, infant sex, smoking, parity, maternal diabetes, height, previous LBW infant, severe pregnancy-induced hypertension |
|
G1: 1.17 (P < 0.001) G2: 1.16 (P < 0.01) G3: 1.02 (P = NS) |
Parity, pregravid standard weight, pregravid excess weight, birth length, infant sex |
|
G1: 1.89 (1.51-2.37) G2: 1.87 (1.39-2.52) |
Maternal age, maternal race, parity, gestational age, smoking, pregravid BMI, height |
|
Author, Year Country, Setting Sample Size Baseline BMI Quality |
Pregravid Weight (How Measured) Total Weight Gain (How Measured) |
Definition of Groups |
|
Pezzarossa et al., 1996100 |
Pregravid weight: Self-report |
Relative risks for LGA |
|
Italy, not stated |
G1: GWG < 9 kg G2: GWG 9-14 kg |
|
|
192 |
Total weight gain: Routine prenatal care or maternity records |
|
|
All weights/BMI |
||
|
Fair |
||
|
Bianco et al., 199854 |
Pregravid weight: Self-report |
% LGA for GWG: |
|
USA, medical center |
||
|
Total weight gain: Routine prenatal care or maternity records |
G1: Weight loss or 0 lbs G2: 1-15 lbs G3: 16-25 lbs G4: 26-35 lbs G5: > 35 lbs |
|
|
613 |
||
|
Morbidly obese (BMI > 35) |
||
|
Poor |
||
|
Ekblad and Grenman, 199268 |
Pregravid weight: Medical records |
Infant BW by group |
|
Finland, hospital |
Infant weight percentile for mothers with normal pregravid weight and normal weight gain G1: < 2.5% G2: 2.5-10% G3: 10-50% G4: 50-90% G5: 90-97.5% G6: > 97.5% |
|
|
357 |
Total weight gain: Routine prenatal care or maternity records |
|
|
Prepregnancy weight 20% over or under ideal body weight for height and normal weight |
||
|
Poor |
||
|
Infant weight percentile for mothers with weight gain ≤ 5 kg G7: < 2.5% G8: 2.5-10% G9: 10-50% G10: 50-90% G11: 90-97.5% G12: > 97.5% |
||
|
Infant weight percentile for mothers with weight gain ≥ 20 kg G13: < 2.5% G14: 2.5-10% G15: 10-50% G16: 50-90% G17: 90-97.5% G18: > 97.5% |
|
Results |
Confounders and Effect Modifiers Included in Analysis |
|
G1: Relative risks for LGA similar between non-diabetic and GDM groups G2: GDM group has 2 times higher risk that non-diabetics |
Pregravid BMI, fasting plasma glucose |
|
Numerical results not reported. |
|
|
G1: 12.0 G2: 11.8 G3: 18.8 G4: 25.8 G5: 23.8 (P < 0.01) |
N/A |
|
G1: 1% G2: 6% G3: 35% G4: 43% G5: 13% G6: 2% |
N/A |
|
G7: 3% G8: 14% G9: 32% G10: 34% G11: 14% G12: 3% |
|
|
G13: 0% G14: 2% G15: 42% G16: 29% G17: 20% G18: 7% |
|
Author, Year Country, Setting Sample Size Baseline BMI Quality |
Pregravid Weight (How Measured) Total Weight Gain (How Measured) |
Definition of Groups |
|
Jensen et al., 200559 |
Pregravid weight: Self-report |
ORs and 95% CIs for LGA |
|
Denmark, university hospitals |
G1: GWG < 5.0 kg (Reference) G2: GWG 5.0-9.9 kg G3: GWG 10.0-14.9 kg G4: GWG ≥ 15.0 kg |
|
|
481 |
Total weight gain: Routine prenatal care or maternity records |
|
|
Obese |
||
|
Poor |
||
|
Sunehag et al., 1991120 |
Pregravid weight: Not stated |
G1: Association between LGA and GWG > 18 kg |
|
Italy, prenatal clinics |
||
|
133 |
Total weight gain: Not stated |
|
|
All weights/BMI |
||
|
Poor |
||
|
BMI, body mass index; CI, confidence interval; g, grams; GDM, gestational diabetes mellitus; GWG: gestational weight gain; kg, kilogram; lbs, pounds; LGA, large-for-gestational age; N/A, not applicable; NS, non-significant; OR, odds ratio; SD: standard deviation; USCF, University of Southern California at San Francisco; WG, weight gain. |
||
1.11-1.41); among women of normal weight, 1.14 (95% CI, 1.08-1.20); and among overweight and obese women, 1.14 (95% CI, 1.07-1.20). In a fair-quality study based on the Swedish birth registry,58 high weight gain (> 16 kg) was strongly associated with LGA, and this association was most pronounced in the lowest BMI categories. In comparison with the risk of LGA among women with weight gain between 8 and 16 kg (the reference group), adjusted ORs by BMI categories were as follows: BMI < 20, 3.26 (95% CI, 2.76-3.86); BMI ≥ 35, 1.54 (95% CI, 1.24-1.90).
In a fair-quality study of obese women,4 lower odds of LGA were observed among women who gained less than the reference group (15-25 pounds) and higher odds of LGA were observed among women who gained more the reference group. Minimal risk for LGA was observed at weight gains of 10 to 25 pounds for class I obese women (BMI 30-34.9), at gains of 0 to 9 pounds for class II obese women (BMI 35-39.9), and at gains of 0 to 9 pounds for class II obese women (BMI ≥ 40). A poor-quality study among Japanese women found that nulliparous women in the highest weight gain category (> 0.40 kg/week) had ORs for LGA of 2.25 (95% CI, 1.03-4.94) for low BMI women and 2.58 (95% CI, 1.71-3.89) for medium BMI women.61
|
Results |
Confounders and Effect Modifiers Included in Analysis |
|
G1: 1.0 G2: 2.4 (1.1-5.3) G3: 2.1 (1.1-4.8) G4: 4.7 (2-11) |
Maternal age, pregravid BMI, gestational age, 2 hour OGTT, parity, smoking, ethnicity, clinical center |
|
G1: χ2 = 8.2 (P < 0.005) |
N/A |
Eleven studies4,58,59,61,100,105,115,116,118,121,122 adjusted for potential confounders including age, pregravid BMI, glucose levels, smoking status, parity, and gestational age.
Overview of results for SGA Twenty studies examined the relationship between gestational weight gain and SGA (Evidence Table 22).4,51,54,58,59,61,66,68,89,95,105,108,111,114,116,118,119,122-124 One study was of good quality,116 twelve of fair quality,19,24,53,69,72,76,79,83,85,89-91 and seven of poor quality.11,14,20,22,29,31,59 SGA births as a percentage of all births tended to be highest for the lowest weight gains.
Detailed results for SGA As with LGA results, we discuss results relating to the simple association between weight gain and risk for SGA separately (Table 21) from those that also take BMI status into account (Table 22). Among indigent US women (fair-quality study),89 the percentage of SGA infants was 9.9 among women gaining < 0.24 kg per week, and 5.7 among the group gaining ≥ 0.75 kg per week. Similar results were observed among a cohort of Japanese women (fair-quality study),111 which defined SGA as birthweight < 1.5 SD below the mean. The percentage of SGA infants ranged from 10.9 percent in the lowest weight gain group
TABLE 20. Gestational Weight Gain and LGA by BMI Status
|
Author, Year Country, Setting Sample Size Baseline BMI Quality |
Pregravid Weight (How Measured) Total Weight Gain (How Measured) |
Definition of Groups |
|
Caulfield et al., 1998116 |
Pregravid weight: Self-report |
ORs and 95% CIs for LGA per 50g/wk increase in rate of weight gain by BMI |
|
USA, hospital obstetric database |
Total weight gain: Routine prenatal care or maternity records |
G1: Underweight G2: Normal weight G3: Overweight |
|
3,870 |
||
|
All weights/BMI |
||
|
Good |
||
|
Cedergren, 200658 |
Pregravid weight: Self-report |
ORs and 95% CIs for LGA (> 2 SD above the mean) |
|
Sweden, Medical Birth Registry |
Total weight gain: Routine prenatal care or maternity records |
Weight gain < 8 kg G1: BMI < 20 G2: BMI 20-24.9 G3: BMI 25-29.9 G4: BMI 30-34.9 G5: BMI ≥ 35 |
|
245,526 |
||
|
All weights/BMI |
||
|
Fair |
||
|
Weight gain > 16 kg G6: BMI < 20 G7: BMI 20-24.9 G8: BMI 25-29.9 G9: BMI 30-34.9 G10: BMI ≥ 35 |
||
|
Weight gain 8-16 kg (Reference) |
||
|
Kiel et al., 20074 |
Pregravid weight: Medical records |
G1: Odds of LGA for weight gain > 25 lbs G2: OR of LGA for weight gain < 15 lbs G3: Reference weight gain 15-25 lbs |
|
USA, birth certificate registry |
||
|
Total weight gain: Routine prenatal care or maternity records |
||
|
120,251 |
||
|
Obese |
||
|
Fair |
|
Results |
Confounders and Effect Modifiers Included in Analysis |
|
G1: 1.25 (1.11-1.41) G2: 1.14 (1.08-1.20) G3: 1.13 (1.07-1.20) |
Maternal age, race, parity, pregravid BMI, height, hypertension, provider type, smoking, infant sex |
|
G1: 0.43 (0.24-0.75) G2: 0.53 (0.47-0.61) G3: 0.48 (0.43-0.53) G4: 0.66 (0.59-0.75) G5: 0.54 (0.46-0.63) |
Maternal age, parity, smoking, year of birth |
|
G6: 3.26 (2.76-3.86) G7: 2.73 (2.60-2.88) G8: 2.14 (2.01-2.28) G9: 2.24 (2.00-2.51) G10: 1.54 (1.24-1.90) |
|
|
G1: Odds of LGA are higher for women in this group G2: Odds of LGA are lower for women in this group |
Maternal age, maternal race, maternal education, poverty, smoking, parity, chronic hypertension |
|
Numerical value for ORs not reported in study |
|
Author, Year Country, Setting Sample Size Baseline BMI Quality |
Pregravid Weight (How Measured) Total Weight Gain (How Measured) |
Definition of Groups |
|
Wataba et al., 200661 |
Pregravid weight: Not stated |
ORs and 95% CIs for LGA |
|
Nulliparous G1: Low BMI (< 18), WG > 0.40 kg/wk G2: Medium BMI (18-23.9), WG 0.20-0.25 kg/wk G3: WG 0.25-0.30 kg/wk (Reference) G4: Medium BMI, WG 0.30-0.35 kg/wk G5: Medium BMI, WG 0.35-0.40 kg/wk G6: Medium BMI, WG > 0.40 kg/wk |
||
|
Japan, academic medical center |
Total weight gain: Routine prenatal care or maternity records |
|
|
21,718 |
||
|
All weights/BMI |
||
|
Poor |
||
|
Parous G7: Low BMI (< 18), WG > 0.40 kg/wk G8: WG 0.20-0.25 kg/wk (Reference for low/med BMI) G9: Medium BMI (18-23.9), WG 0.25-0.30 kg/wk G10: Medium BMI, WG 0.30-0.35 kg/wk G11: Medium BMI, WG 0.35-0.40 kg/wk G12: Medium BMI, WG > 0.40 kg/wk G13: High BMI (≥ 24), WG 0.15-0.20 kg/wk G14: WG ≥ 0.30 kg/wk (Reference for high BMI) |
||
|
BMI, body mass index; CI, confidence interval; g, grams; g/wk, gram per week; kg/wk, kilogram per week; LGA, large-for-gestational age; OR, odds ratio; SD, standard deviation; WG, weight gain. |
||
(< 25th percentile of weight gain) to 3.1 percent in the highest weight gain group (≥ 90th percentile of weight gain). Another fair-quality U.S. study observed an increased incidence of SGA at low weight gains; the incidence among obese women with low weight gain was two times that among obese women with normal weight gain.118 Similar results were obtained in a poor-quality study of morbidly obese women.54
Six fair-quality studies24,53,76,83,90,91 evaluated the ORs for SGA and found that the lowest weight gains (as compared to normal weight gains) were associated with ORs between 1.82 and 3.0. Among indigent U.S. women,89 the risk of SGA was highest for mothers in the lowest weight gain category (< 0.24 kg/week) when compared with women gaining 0.58 to 0.74 kg per week (OR2.24; P < 0.05). A weaker association was observed for women gaining 0.24 to 0.57 kg per week (OR1.55; P < 0.05). A U.S.
|
Results |
Confounders and Effect Modifiers Included in Analysis |
|
|
G1: 2.25 (1.03-4.94) G2: 1.41 (1.31-1.76) G3: 1.0 G4: 1.76 (1.38-2.23) G5: 2.34 (1.77-3.10) G6: 2.58 (1.71-3.89) G7: 2.16 (0.63-7.44) G8: 1.0 G9: 1.48 (1.15-2.33) G10: 1.64 (1.18-2.27) G11: 2.23 (1.51-3.31) G12: 3.94 (2.56-6.03) G13: 2.27 (1.31-3.95) G14: 1.0 |
Preeclampsia, C-section, 1-minute Apgar score < 4 |
|
study noted earlier also found that women with the lowest weight gains had an OR for an SGA infant of 2.06 (95% CI, 1.62-2.63) when compared with women gaining between the 25th and 75th percentile, and an OR of 1.82 (95% CI, 1.35-2.47) when compared with women gaining between the 10th and 90th percentiles.118 A U.S. study found that the OR of SGA in a second pregnancy was 1.9 (95% CI, 1.8-2.2) for weight gains less than 0.2 kg/wk as compared to weight gains greater than 0.2 kg/wk.124 The study of Japanese women noted earlier defined SGA as birthweight < 1.5 SD below the mean and gestational weight gain according to percentiles.111 Among women in the two lowest weight gain categories (very low and low) the ORs of SGA were 2.87 (95% CI, 2.56-3.21) and 1.49 (95% CI, 1.35-1.66), respectively, when compared with women in the moderate weight gain category. In addition, a significant protective effect was observed for
TABLE 21. Gestational Weight Gain and SGA
|
Author, Year Country, Setting Sample Size Baseline BMI Quality |
Pregravid Weight (How Measured) Total Weight Gain (How Measured) |
Definition of Groups |
|
Parker and Abrams, 1992118 |
Pregravid weight: Self-report |
ORs and 95% CIs of SGA for low WG |
|
USA, hospital |
||
|
Total weight gain: Routine prenatal care or maternity records |
G1: Compared to UCSF Cohort 25-75th percentile of WG G2: Compared to UCSF 10-90th percentile of WG |
|
|
6,690 |
||
|
All weights/BMI |
||
|
Fair |
||
|
Cheng et al., 2004124 |
Pregravid weight: Self-report |
OR and 95% CI, for SGA |
|
USA, birth certificate registry |
G1: WG < 0.2 kg/wk G2: WG ≥ 0.2 kg/wk (Reference) |
|
|
Total weight gain: Not stated |
||
|
14,114 |
||
|
All weights/BMI |
||
|
Fair |
||
|
Cnattingius et al., 1998123 |
Pregravid weight: Self-report |
ORs and 95% CIs for SGA |
|
Sweden, Medical birth register |
G1: WG < 0.25 kg/wk G2:WG 0.25-0.34 kg/wk G3: WG 0.35-0.44 kg/wk G4: ≥ 0.45 kg/wk (Reference) |
|
|
Total weight gain: Routine prenatal care or maternity records |
||
|
167,750 |
||
|
All weights/BMI |
||
|
Fair |
||
|
Dawes and Grudzinskas, 1991119 |
Pregravid weight: Measured at first prenatal visit |
Average weekly weight gain < 0.20 kg as a predictor of SGA |
|
UK, hospital |
G1: Sensitivity G2: Specificity |
|
|
Total weight gain: Routine prenatal care or maternity records |
||
|
1,092 |
||
|
All weights/BMI |
||
|
Fair |
|
Results |
Confounders and Effect Modifiers Included in Analysis |
|
|
G1: 2.06 (1.62-2.63) G2: 1.82 (1.35-2.47) |
Maternal age, maternal race, parity, gestational age, smoking, pregravid BMI, height |
|
|
G1: 1.9 (1.8-2.2) G2: 1.0 |
Maternal age, education, Medicaid status, pregravid BMI, smoking, previous SGA, adequacy of prenatal care, maternal cardiac disease, preeclampsia, year of birth of second infant |
|
|
G1: 3.0 (2.5-3.5) G2: 1.9 (1.6-2.2) G3: 1.3 (1.1-1.5) G4: 1.0 |
Maternal age, parity, pregravid BMI, height, education, mother living with father, smoking |
|
|
G1: 12.9% G2: 91.3% |
Maternal age, parity, pregravid BMI, weight, smoking, gestational age |
|
|
Author, Year Country, Setting Sample Size Baseline BMI Quality |
Pregravid Weight (How Measured) Total Weight Gain (How Measured) |
Definition of Groups |
|
Kiel et al., 20074 |
Pregravid weight: Medical records |
G1: Odds of SGA for weight gain > 25 lbs G2: OR of SGA for weight gain < 15 lbs G3: Reference Weight gain 15-25 lbs |
|
USA, birth certificate registry |
||
|
Total weight gain: Routine prenatal care or maternity records |
||
|
120,251 |
||
|
Obese |
||
|
Fair |
||
|
Kramer et al., 1990122 |
Pregravid weight: Self-report |
G1: OR and 95% CI, for SGA for each 5 kg decrease in net gestational WG |
|
Canada, university hospital |
||
|
Total weight gain: Routine prenatal care or maternity records |
||
|
8,719 |
||
|
All weights/BMI |
||
|
Fair |
||
|
Muscati et al., 1996105 |
Pregravid weight: Medical records |
G1: OR for SGA per 1 kg increase in WG up to week 20 G2: OR for SGA per 1 kg increase in WG from weeks 21 to 30 G3: OR for SGA per 1 kg increase in WG from weeks 31 to term |
|
Canada, public health department |
||
|
Total weight gain: Collected by study investigators |
||
|
371 |
||
|
All weight/BMI |
||
|
Fair |
||
|
Steward and Moser, 2004114 |
Pregravid weight: Not stated |
G1: OR and 95% CI, for SGA defined as FGR < 0.85 |
|
USA, vital statistics data |
||
|
Total weight gain: Self-report |
||
|
2,933 |
||
|
All weights/BMI |
||
|
Fair |
|
Results |
Confounders and Effect Modifiers Included in Analysis |
|
|
G1: Odds of SGA are lower for women in this group G2: Odds of SGA are higher for women in this group Numerical value for ORs not reported in study |
Maternal age, maternal race, maternal education, poverty, smoking, parity, chronic hypertension |
|
|
G1: 1.32 (1.20-1.44) |
Pregravid weight, infant sex, smoking, parity, maternal diabetes, height, previous LBW infant, severe pregnancy-induced hypertension |
|
|
G1: 0.93 (P = NS) G2: 0.85 (P < 0.01) G3: 0.89 (P < 0.01) |
Parity, pregravid standard weight, pregravid excess weight, birth length, infant sex |
|
|
G1: 0.98 (0.97-0.98) |
Maternal age, race, education, marital status, pregravid weight, adequacy of prenatal care, smoking, infant sex |
|
|
Author, Year Country, Setting Sample Size Baseline BMI Quality |
Pregravid Weight (How Measured) Total Weight Gain (How Measured) |
Definition of Groups |
|
Takimoto et al., 2006111 |
Pregravid weight: Medical records |
ORs and 95% CI, for SGA |
|
Japan, obstetric units |
G1: Total GWG < 25th percentile for GA G2: Total GWG 25-49th percentile for GA G3: Total GWG 50-74th percentile for GA (Reference) G4: Total GWG 75-89th percentile for GA G5: Total GWG ≥ 90th percentile for GA |
|
|
Total weight gain: Routine prenatal care or maternity records |
||
|
112,257 |
||
|
All weights/BMI |
||
|
Fair |
||
|
Wen et al., 199089 |
Pregravid weight: Measured at first prenatal visit |
ORs for SGA |
|
USA, hospital |
G1: GWG < 0.24 kg/wk G2: GWG 0.24-0.57 kg/wk G3: GWG 0.58-0.74 kg/wk (Reference) G4: GWG ≥ 0.75 kg/wk |
|
|
Total weight gain: Routine prenatal care or maternity records |
||
|
Cohort |
||
|
17,149 |
||
|
Fair |
||
|
Bianco et al., 199854 |
Pregravid weight: Self-report |
% SGA for GWG: |
|
USA, medical center |
G1: Weight loss or 0 lbs G2: 1-15 lbs G3: 16-25 lbs G4: 26-35 lbs G5: > 35 lbs |
|
|
Total weight gain: Routine prenatal care or maternity records |
||
|
613 |
||
|
Morbidly obese (BMI > 35) |
||
|
Poor |
||
|
Cherry et al., 199395 |
Pregravid weight: Measured by study investigators |
%SGA for each shifting of EW category. |
|
USA, hospital |
||
|
599 |
Light: < 90% EW Normal: 90 to 110% of EW Heavy: > 110% EW G1: Normal to Heavy G2: Light to Normal G3: Heavy to Heavy G4: Normal to Normal G5: Light to Light G6: Heavy to Normal G7: Normal to Light |
|
|
Total weight gain: Routine prenatal care or maternity records |
||
|
All weights/BMI |
||
|
Poor |
|
Results |
Confounders and Effect Modifiers Included in Analysis |
|
|
G1: 2.87 (2.56-3.21) G2: 1.49 (1.35-1.66) G3: 1.0 G4: 0.55 (0.55-0.72) G5: 0.45 (0.45-0.63) |
Maternal age, parity, pregravid weight, gestational age, infant sex |
|
|
G1: 2.24 (P < 0.05) G2: 1.55 (P < 0.05) G3: 1.0 G4: 1.25 (NS) |
Maternal age, race, parity, marital status, education, previous preterm delivery, alcohol use, drug use, maternal height, maternal weight, smoking, infant sex |
|
|
G1: 4 G2: 3.9 G3: 5.6 G4: 3.1 G5: 3.8 |
N/A |
|
|
G1: 22% G2: 39% G3: 38% G4: 41% G5: 62% G6: 60% G7: 65% |
N/A |
|
|
Author, Year Country, Setting Sample Size Baseline BMI Quality |
Pregravid Weight (How Measured) Total Weight Gain (How Measured) |
Definition of Groups |
|
Ekblad and Grenman, 199268 |
Pregravid weight: Medical records |
Infant BW by group |
|
Finland, hospital |
Infant weight percentile for mothers with normal prepregnancy weight and normal weight gain G1: < 2.5% G2: 2.5-10% G3: 10-50% G4: 50-90% G5: 90-97.5% G6: > 97.5% |
|
|
Total weight gain: Routine prenatal care or maternity records |
||
|
357 |
||
|
Prepregnancy weight 20% over or under ideal body weight for height and normal weight |
||
|
Poor |
||
|
Infant weight percentile for mothers with weight gain ≤ 5 kg G7: < 2.5% G8: 2.5-10% G9: 10-50% G10: 50-90% G11: 90-97.5% G12: > 97.5% |
||
|
Infant weight percentile for mothers with weight gain ≥ 20 kg G13: < 2.5% G14: 2.5-10% G15: 10-50% G16: 50-90% G17: 90-97.5% G18: > 97.5% |
||
|
Jensen et al., 200559 |
Pregravid weight: Self-report |
Rates of SGA |
|
Denmark, university hospitals |
G1: GWG < 5.0 kg (Reference) G2: GWG 5.0-9.9 kg G3: GWG 10.0-14.9 kg G4: GWG ≥ 15.0 kg |
|
|
Total weight gain: Routine prenatal care or maternity records |
||
|
481 |
||
|
Obese |
||
|
Poor |
||
|
Lang et al., 199666 |
Pregravid weight: Not stated |
ORs and 95% CIs for SGA |
|
USA, hospital |
G1: WG ≤ 0.40 lbs/wk G2: WG 0.40-0.65 lbs/wk G3: WG 0.65-0.90 lbs/wk (Reference) G4: WG > 0.90 lbs/wk |
|
|
Total weight gain: Not stated |
||
|
11,505 |
||
|
All weights/BMI |
||
|
Poor |
||
|
BMI, body mass index; CI, confidence interval; EW, expected weight; FGR, fetal growth ratio; G, group; GWG, gestational weight gain; kg, kilogram; kg/wk, kilogram per week; lb, pound; NS, non-significant; OR, odds ratio; SGA, small-for-gestational age; WG, weight gain. |
||
|
Results |
Confounders and Effect Modifiers Included in Analysis |
|
|
G1: 1% G2: 6% G3: 35% G4: 43% G5: 13% G6: 2% |
N/A |
|
|
G7: 3% G8: 14% G9: 32% G10: 34% G11: 14% G12: 3% |
|
|
|
G13: 0% G14: 2% G15: 42% G16: 29% G17: 20% G18: 7% |
|
|
|
No significant difference in rates of SGA by maternal weight gain group. Numerical results not reported in article. |
Maternal age, pregravid BMI, gestational age, 2 hour OGTT, parity, smoking, ethnicity, clinical center |
|
|
G1: 2.8 (2.2-3.6) G2: 1.6 (1.4-1.9) G3: 1.0 (Reference) G4: 0.6 (0.5-0.7) |
Maternal age, race, parity, height, pregravid weight, maternal education, health insurance, planned pregnancy, previous induced abortion, previous spontaneous abortion, previous still birth, maternal morbidity, caffeine intake, marijuana, prenatal care, smoking, infant sex |
|
TABLE 22. Gestational Weight Gain and SGA by BMI Status
|
Author, Year Country, Setting Sample Size Baseline BMI Quality |
Pregravid Weight (How Measured) Total Weight Gain (How Measured) |
Definition of Groups |
|
Caulfield et al., 1998116 |
Pregravid weight: Self-report |
ORs and 95% CIs for SGA per 50g/wk increase in rate of weight gain by BMI |
|
USA, hospital obstetric database |
||
|
Total weight gain: Routine prenatal care or maternity records |
||
|
3,870 |
G1: Underweight G2: Normal weight G3: Overweight |
|
|
All weights/BMI |
||
|
Good |
||
|
Cedergren, 200658 |
Pregravid weight: Self-report |
ORs and 95% CIs for SGA (< 2 SD below the mean) |
|
Sweden, Medical Birth Registry |
||
|
Total weight gain: Routine prenatal care or maternity records |
Weight gain < 8 kg G1: BMI < 20 G2: BMI 20-24.9 G3: BMI 25-29.9 G4: BMI 30-34.9 G5: BMI ≥ 35 |
|
|
245,526 |
||
|
All weights/BMI |
||
|
Fair |
||
|
Weight gain > 16 kg G6: BMI < 20 G7: BMI 20-24.9 G8: BMI 25-29.9 G9: BMI 30-34.9 G10: BMI ≥ 35 |
||
|
Weight gain 8-16 kg (Reference) |
||
|
Cheng et al., 2004124 |
Pregravid weight: Self-report |
95% CIs of SGA for low weight gain (< 0.2 kg/wk) by BMI |
|
USA, birth certificate registry |
||
|
Total weight gain: Not stated |
||
|
14,114 |
G1: Underweight G2: Normal weight G3: Overweight G4: Obese |
|
|
All weights/BMI |
||
|
Fair |
|
Results |
Confounders and Effect Modifiers Included in Analysis |
|
|
G1: 0.87 (0.78-0.97) G2: 0.90 (0.84-0.96) G3: 0.93 (0.86-1.01) |
Maternal age, race, parity, pregravid BMI, height, hypertension, provider type, smoking, infant sex |
|
|
G1: 2.35 (1.92-2.88) G2: 1.99 (1.77-2.23) G3: 1.75 (1.48-2.07) G4: 1.68 (1.26-2.25) G5: 1.71 (1.03-2.85) |
Maternal age, parity, smoking, year of birth |
|
|
G6: 0.50 (0.41-0.61) G7: 0.50 (0.45-0.56) G8: 0.57 (0.47-0.68) G9: 0.61 (0.40-0.93) G10: 0.50 (0.20-1.24) |
||
|
G1: (1.2-2.4) G2: (1.9-2.7) G3: (1.6-2.9) G4: (1.4-2.1) |
Maternal age, education, Medicaid status, pregravid BMI, smoking, previous SGA, adequacy of prenatal care, maternal cardiac disease, preeclampsia, year of birth of second infant |
|
|
Author, Year Country, Setting Sample Size Baseline BMI Quality |
Pregravid Weight (How Measured) Total Weight Gain (How Measured) |
Definition of Groups |
|
Zhou and Olsen, 1997108 |
Pregravid weight: Self-report |
% Growth retardation (birthweight < 3,000g and placental weight > 490g) by weight gain category and BMI |
|
Denmark, two communities |
||
|
Total weight gain: Routine prenatal care or maternity records |
||
|
Cohort |
||
|
7,122 |
Weight gain < 11 kg G1: Underweight (Reference) G2: Normal G3: Overweight |
|
|
Fair |
||
|
Weight gain 12-15 kg G4: Underweight G5: Normal G6: Overweight |
||
|
Weight gain > 16 kg G7: Underweight G8: Normal G9: Overweight |
||
|
Kabiru and Raynor, 200451 |
Pregravid weight: Measured at first prenatal visit |
% SGA G1: No change in BMI category G2: 1 category increase in BMI G3: > 1 category increase in BMI |
|
USA, hospital |
||
|
5,131 |
||
|
Total weight gain: Routine prenatal care or maternity records |
||
|
All weights/BMI |
||
|
Poor |
||
|
% SGA among overweight G4: No change in BMI category G5: 1 category increase in BMI G6: > 1 category increase in BMI |
|
Results |
Confounders and Effect Modifiers Included in Analysis |
|
|
G1: 1.0 G2: 0.6 (0.4-0.8) G3: 0.6 (0.4-1.1) |
Maternal age, parity, alcohol, diabetes, term delivery, smoking, gestational age, infant sex |
|
|
G4: 0.3 (0.2-0.5) G5: 0.4 (0.3-0.6) G6: 0.4 (0.1-1.0) |
||
|
G7: 0.3 (0.2-0.5) G8: 0.2 (0.1-0.3) G9: 0.2 (0.1-0.6) |
||
|
G1: 19.5% G2: 13.5% G3: 9.5% G4: 14.2% G5: 9.9% G6: 11.5% |
N/A |
|
|
Author, Year Country, Setting Sample Size Baseline BMI Quality |
Pregravid Weight (How Measured) Total Weight Gain (How Measured) |
Definition of Groups |
|
Wataba et al., 200661 |
Pregravid weight: Not stated |
ORs and 95% CIs for SGA |
|
Japan, academic medical center |
Parous, Low BMI (< 18) G1: WG < 0.15 kg/wk G2: WG 0.15-0.20 kg/wk G3: WG 0.20-0.25 kg/wk G4: WG 0.25-0.30 kg/wk (Reference |
|
|
Total weight gain: Routine prenatal care or maternity records |
||
|
21,718 |
||
|
All weights/BMI |
||
|
Poor |
||
|
Parous, Medium BMI (18-23.9) G5: WG < 0.15 kg/wk G6: WG 0.15-0.20 kg/wk G7: WG 0.20-0.25 kg/wk (Reference) |
||
|
Parous, High BMI (> 24) G8: WG < 0.15 kg/wk G9: WG 0.15-0.20 kg/wk (Reference) |
||
|
Nulliparous, Low BMI (< 18) G10: WG < 0.15 kg/wk G11: WG 0.15-0.20 kg/wk G12: WG 0.20-0.25 kg/wk G13: WG 0.25-0.30 kg/wk (Reference |
||
|
Nulliparous, Medium BMI (18-23.9) G14: WG < 0.15 kg/wk G15: WG 0.15-0.20 kg/wk G16: WG 0.20-0.25 kg/wk G17: WG 0.25-0.30 (Reference) |
||
|
Nulliparous, High BMI (> 24) G18: WG < 0.05 kg/wk G19: WG 0.15-0.20 kg/wk (Reference) |
||
|
BMI, body mass index; cat, category; CI, confidence interval; g, gram; G, group; kg, kilogram; kg/wk, kilogram per week; lbs, pounds; med, medium; OR, odds ratio; SD, standard deviation; SGA, small-for-gestational age. |
||
|
Results |
Confounders and Effect Modifiers Included in Analysis |
|
|
G1: 5.42 (2.86-10.27) G2: 2.78 (1.53-5.06) G3: 1.39 (0.82-2.42) G4: 1.0 |
Preeclampsia, C-section, 1-minute Apgar score < 4 |
|
|
G5: 2.21 (1.67-2.93) G6: 1.68 (1.23-2.07) G7: 1.0 |
||
|
G8: 2.82 (1.17-6.78) G9: 1.0 |
||
|
G10: 6.20 (2.72-14.09) G11: 2.58 (1.14-5.87) G12: 2.46 (1.19-5.08) G13: 1.0 |
||
|
G14: 2.64 (1.88-3.71) G15: 1.60 (1.15-2.23) G16: 1.39 (1.03-1.87) G17: 1.0 |
||
|
G18: 7.06 (2.11-23.61) G19: 1.0 |
||
the two highest weight gain categories. One study, using data from the Swedish Medical Birth Registry, observed higher rates of SGA (here defined as < 2 SD below the mean) among the lowest weight gain groups.123 Specifically, women gaining < 0.25 kg per week had an OR of 3.0 (95% CI, 2.5-3.5) when compared with women gaining ≥ 0.45 kg per week. The ORs decreased as gestational weight gain category dropped. Similar results were found in a study of obese women.4
Among white nonsmokers in Canada (fair-quality study),105 for each 1 kg increase in weight gain up to week 20, the OR of an SGA infant was 0.93 (not significant); for weight gain from weeks 21 to 30, it was 0.85 (P < 0.01); and for weight gain from week 31 to term, it was 0.89 (P < 0.01). In other words, increases in weight gain from weeks 21 to term lowered a woman’s risk of an SGA infant. A fair-quality study of the predictors of SGA found that average weekly weight gain < 0.20 kg had 12.9 percent sensitivity and 91.3 percent specificity.119
Two fair-quality studies defined growth restriction using FGR, with SGA specified as an FGR < 0.85.79,89 In general, increases in weight gain were associated with lower risks of SGA. Specifically, one study found an OR of 0.98 (95% CI, 0.97-0.98) for each 1 kg increase in total gestational weight gain.114 Another study found an OR of 1.32 (95% CI, 1.20-1.44) for each 5 kg decrease in net gestational weight gain (total gestational weight gain minus infant birthweight).122
In a poor U.S. study,66 using women gaining 0.65 to 0.9 pounds per week as the reference group, women gaining ≤ 0.40 pounds per week had an OR for an SGA infant of 2.8 (95% CI, 2.2-3.6), and women gaining 0.4 to 0.65 pounds per week an OR of 1.6 (95% CI, 1.4-1.9). In this study, however, women gaining > 0.9 pounds per week also experienced a significant protective effect against SGA (OR, 0.6; 95% CI, 0.5-0.7).
The results from three14,20,31 poor-quality studies did not find statistically significant results. One study was among Finnish women,68 one defined SGA as birthweight < 2 SD below the mean,59 and one study was among morbidly obese women.54 A study among adolescents (also rated poor) looked at the proportion of infants who gained less than the median weight (instead of the 10th percentile).95 Mothers who shifted to higher weight classes had fewer infants who fell below the median for intrauterine growth; women who did not maintain their weight and shifted to lower weight classes were more likely to have infants below the median for intrauterine growth.
Six studies presented stratified analyses by BMI (Table 22).11,19,22,72,81,91 In general, the risk of SGA among women with low weight gain decreased as BMI increased.
A U.S. database study (rated good quality) found that increasing rates of weight gain were associated with reduced risk of an SGA infant, with
the risk decreasing with increasing BMI.116 Specifically, the ORs of SGA for each 50 g per week increase in maternal weight were as follows: 0.87 (95% CI, 0.78-0.97) for underweight mothers; 0.90 (95% CI, 0.84-0.96) for mothers of normal weight; and 0.93 (95% CI, 0.86-1.01) for overweight and obese women. In the Swedish birth registry study (rated fair quality), the risk of SGA was higher in the low weight gain group (< 8 kg), but the risk decreased with increasing BMI.58 Using women gaining between 8 and 16 kg as the reference group, these researchers reported that the OR for delivering an SGA infant for women with low weight gain (< 8 kg) was 1.71 (95% CI, 1.03-2.85) among women with a BMI ≥ 35; it was 2.35 (95% CI, 1.92-2.88) among women with a BMI < 20. Women gaining > 16 kg were at decreased risk for delivering an SGA infant, with the risk being similar between all BMI categories.
Among nondiabetic women in Denmark (fair-quality study) for whom SGA was defined as birthweight < 3,000 g despite placenta weight being above the 66th percentile (491 g), women who gained more than 16 kg were at lower risk of delivering an SGA infant; this risk was the same regardless of BMI status.108 The risk of SGA decreased with increasing weight gain, and it also tended to decrease as BMI increased. In a U.S. study, 95% CIs of the OR of SGA for low weight gain (< 0.2 kg/wk) compared to weight gain > 0.2 kg/wk, were similar across BMI categories: underweight (95% CI, 1.2-2.4), normal weight (95% CI, 1.9-2.7), overweight (95% CI, 1.6-2.9), obese (95% CI, 1.4-2.1).124
A poor-quality study of the effect of changing BMI categories found that excessive weight gain (defined in various ways depending on BMI) was associated with lower rates of SGA for two groups of women: normal weight (excessive gain, > 35 pounds; P = 0.016) and overweight (excessive gain, > 25 pounds; P = 0.003); this association did not hold for obese women.51 A study among Japanese women (also poor quality) found high risks for SGA among nulliparous women with low BMI (< 18) and low rates of weight gain (< 0.15 kg/week).61
Sixteen of these studies adjusted for multiple confounding factors such as age, pregravid BMI, smoking, glucose levels, parity, race, gestational age, marital status, height, education, and sex of infant.19,20,22,24,29,53,69,72,76,79,81,83,85,89-91
Apgar scores
Study characteristics Four studies, set in Sweden,58 the United States,33,92 and Japan,61 examined the effect of gestational weight gain on Apgar scores (Evidence Table 23, Table 23). Apgar scores, calculated on the basis of five criteria (appearance, pulse, grimace, activity, respiration), range from 0 to 10. Three were cohort studies; the fourth was a case-control study
TABLE 23. Gestational Weight Gain and Apgar Scores
|
Author, Date Country, Setting Sample Size Baseline BMI Quality |
Pregravid Weight (How Measured) Total Weight Gain (How Measured) |
Definition of Groups |
|
Cedergren, 200658 |
Pregravid weight: Self report, if unknown, standardized measurement is made during first visit to maternity health care center |
Weight gain < 8 kg, 8-16 kg, and > 16 kg for each BMI class below |
|
Sweden, Medical Birth Registry |
||
|
G1: BMI < 20 G2: BMI 20-24.9 G3: BMI 25-29.9 G4: BMI 30-34.9 G5: BMI ≥ 35 |
||
|
245,526 |
||
|
All weights/BMI |
Total weight gain: Measured when woman entered delivery unit |
|
|
Fair |
||
|
Johnson et al., 199270 |
Pregravid weight: Self report collected at first antepartal visit |
G1: total weight gain < 16 lb G2: total weight gain 16-25 lb G3: total weight gain 26-35 lb G4: total weight gain > 35 lb |
|
USA, prenatal clinics |
||
|
3,191 |
||
|
Total weight gain: Last prenatal visit |
||
|
All weights/BMI |
||
|
Fair |
||
|
Nixon et al., 1998125 |
Pregravid weight: Routine data forms, self report collected at first prenatal visit |
Continuous weight gain measure |
|
USA, county nurse-midwifery services |
||
|
Total weight gain: Routine data forms, prenatal care or maternity records prior to delivery |
||
|
2,228 |
||
|
All weights (IOM) |
||
|
Fair |
||
|
Wataba et al., 200661 |
Pregravid weight: Hospital database/register |
Rate of weight gain, categorized differently across different BMI groups |
|
Japan, academic medical center |
||
|
Total weight gain: Hospital database/record |
||
|
21,718 |
||
|
All weights/BMI |
||
|
Poor |
||
|
AOR, adjusted odds ratio; BMI, body mass index; kg/wk, kilogram per week. |
||
examining outcomes of macrosomic infants (≥ 4,000 g) and normal-weight babies (2,500-3,999 g).125
Overview of results These four studies, three rated fair19,33,92 and one poor,61 did not provide consistent evidence on the direction or trend of effect. These studies inconsistently controlled for confounders. None
|
Results |
Confounders and Effect Modifiers Included in Analysis |
|
|
No association between low weight gain and Apgar score (< 7), despite BMI of mother |
BMI, maternal age, parity, smoking in early pregnancy, year of birth |
|
|
Increased OR for gestational weight gain on 1-minute and 5-minute Apgar score ≤ 7, persists after adjusting (no further details provided) |
Prepregnancy weight quartile, height (tertile), BMI category, race, parity, hypertension, other variables entered by stepwise regression model |
|
|
Gestational weight gain was not a predictor of Apgar scores < 7 |
Age, parity, BMI |
|
|
AOR for 1 min Apgar scores < 4 for nulliparous women with low BMI, weekly weight gain < 15 kg/wk, compared with women gaining 0.25-0.3 kg/wk: 12.24 (2.04-73.43) |
Parity, baseline BMI |
|
|
AOR for 1 min Apgar scores < 4 for parous women with medium BMI, weekly weight gain 0.35-0.4 kg/wk compared with women gaining 0.2-0.25 kg/wk: 2.21 (1.08-4.53) |
||
|
No other relationships were significant |
||
controlled for a range of maternal pregnancy complications that could account for low Apgar scores.
Detailed results Three studies examined 1-minute or 5-minute Apgar scores at two levels: > 7 or ≥ 7. Two found no association between gestational weight gain and Apgar scores.19,92 The third found increased ORs for
gestational weight gain, after adjusting for prepregnancy weight quartile, height (tertile), BMI category, race, parity, hypertension, and other variables entered by stepwise regression model, but the authors provided no further details on the magnitude of the effect.70
One poor-quality study examined associations between 1-minute Apgar scores > 4 and rates of weekly weight gain (7 categories), categorized differently across different BMI groups (3 groups) and parity (2 categories), resulting in 42 comparisons.61 Two comparisons were statistically significant: (1) higher risk for low Apgar scores for nulliparous women with low BMI and lower-than-median weight gain for their peer group; and (2) higher risk for parous women with medium BMI with higher-than-median weight gain for their peer group.
Infant Outcomes
Perinatal mortality
Study characteristics Three studies, two set in the United States93,94 and one in Denmark,126 looked at the association between maternal weight gain and mortality, defined in one study as stillbirth126 and in two others as perinatal mortality (neonatal plus fetal deaths)93,94 (Table 24, Evidence Table 24). All three studies used different definitions of maternal weight gain:
-
weight gain per week;126
-
optimal weight gain127 defined as 36 to 40 pounds for underweight women, 31 to 40 pounds for women of ideal prepregnancy weight, and 26 to 30 pounds for overweight women, based on associations between maternal prepregnancy weight, height, weight gain, and adverse perinatal outcomes; and
-
low weight gain (< 0.8 kg per week).128
Overview of results One of these studies was rated poor quality128 and the others were rated fair. These studies suggest a protective effect of gestational weight gain on perinatal mortality but not on stillbirth.
Results for categorical measures of weight gain Both studies that focused on optimal or low weight gain found a protective effect of weight gain on infant mortality, but variations in the definition of maternal weight gain and the outcome do not allow quantification of the magnitude of the effect.93,94
Results for rate of weight gain The study that examined associations between weight gained per week and stillbirth found no effect of weight
TABLE 24. Gestational Weight Gain and Perinatal Mortality
|
Author, Date Country, Setting Sample Size Baseline BMI Quality |
Pregravid Weight (How Measured) Total Weight Gain (How Measured) |
Definition of Groups |
Results |
Confounders and Effect Modifiers Included in Analysis |
|
Bracero and Byrne, 1997127 |
Pregravid weight: Self-report at first prenatal visit |
G1: Suboptimal weight gain G2: Optimal weight gain |
Perinatal mortality% G1: 0.6 G2: 0.2 P < 0.0001 |
NA |
|
USA, hospital |
Total weight gain: Last prenatal assessment |
|||
|
20,971 |
||||
|
All |
||||
|
weights/BMI |
||||
|
Fair |
||||
|
Nohr et al., 2005126 |
Pregravid weight: Self-report of pre-pregnancy weight at first telephone interview between 9 and 24 weeks weeks |
Weight per week for BMI groups (underweight < 18.5; 18.5 ≤ normal weight < 25; 25 ≤ overweight < 30; and obese ≥ 30) |
Weight gain in pregnancy was not significantly associated with the risk of stillbirth for any BMI groups. |
AOR adjusted for age, height, parity, sociooccupational status, physical exercise, smoking, alcohol and coffee consumption |
|
Denmark, National Birth Cohort |
||||
|
Total weight gain: Average weekly increase between self reported weights in first and second pregnancy interviews for women who provided a first interview between 9-24 weeks, those who provided a second interview between 26 and 38 completed weeks of gestation, and those who had at least 6 weeks between 2 interviews |
||||
|
54,505 |
||||
|
All weights/BMI |
||||
|
Fair |
|
Author, Date Country, Setting Sample Size Baseline BMI Quality |
Pregravid Weight (How Measured) Total Weight Gain (How Measured) |
Definition of Groups |
Results |
Confounders and Effect Modifiers Included in Analysis |
|
Naeye, 1990128 |
Pregravid weight: Self-report at first antenatal care visit |
Low weight gain defined as < 0.8 kg/week after the first trimester for pregravid BMI groups below: G1: BMI < 20 G2: BMI 20-24 G3: BMI 25-30 G4: BMI > 30 |
Attributable risk estimates for perinatal death for low pregnancy weight gain G1: 0.03 (95% CI, 0.02-0.05) G2: 0.02 (95% CI, 0.01-0.03) G3: 0.01 (95% CI, 0.00-0.02) G4: 0.00 |
Age 35-40, diabetes mellitus, hypertensive disorders, black, preterm birth, major congenital malformations, twins, neonatal respiratory distress syndrome |
|
USA, hospitals affiliated with medical schools |
||||
|
Total weight gain: Data from medical records after first trimester |
||||
|
56,857 |
||||
|
All weights/BMI |
||||
|
Poor |
gain on stillbirth within groups defined by BMI.126 It found increased risks of stillbirth with pregravid obesity and overweight status. This association between higher pregravid weight and stillbirth persisted after the investigators excluded women with obesity-related diseases (diabetes, preeclampsia, and other hypertensive disorders). Within this subset of women without obesity-related diseases (n = 39,187), the AOR for stillbirth related to an increased weight of 100 g per week was 0.94 (95% CI, 0.87-1.03).
Neonatal distress
Study characteristics A Swedish study examined the effects of gestational weight gain on fetal distress (equivalent to International Classification of Diseases [ICD] 9-codes 768.2-4; and ICD 10-codes P20.0, P20.1, and P20.9) using medical birth registry data from 245,526 singleton, term pregnancies over a 9-year period. (Evidence Table 25).58 Women were grouped by BMI status into three gestational weight gain categories: < 8 kg (low), 8 to 16 kg, and > 16 kg (high).
Overview of results The results of this fair study show that after adjusting for maternal age, parity, smoking in early pregnancy, and year of birth, the authors reported that fetal distress was not significantly associated with low weight gain despite the BMI of the mother. Overweight and morbidly obese women with excessive weight gain did have an increased risk for fetal distress.
Detailed results Compared with women with gestational weight gain of 8-16 kg, the OR for fetal distress among women gaining 16 kg or more was 2.15 (95% CI, 1.10-4.20) for women with BMI ≥ 35 and 1.31 (95% CI, 1.05-1.53) for women with BMI 25-29.9.
Neonatal hypoglycemia
Study characteristics Two studies examined the effect of gestational weight gain on neonatal hypoglycemia (Evidence Table 26).75,96 One was a retrospective cohort study of 20,465 women;129 the other110 was a retrospective case-control study using data from 45,245 singleton, live births from a US prepaid group practice health plan. The studies categorized gestational weight gain differently; one examined gestational weight gain as a dichotomous variable based on extremes of weight gain (< 7 kg and > 18 kg),129 and the other used maternal rate of weight gain (total pregnancy weight gain minus infant birthweight divided by weeks of gestation when the last weight was measured) in kg per week.110 Hypoglycemia was defined by ICD codes129 or as at least one plasma glucose test result < 40 mg/dL.110
In the case-control study,110 babies were identified as cases if they had
the following complications: macrosomia (birthweight > 4,500 g), hypoglycemia (at least one plasma glucose < 40 mg/dL), or hyperbilirubinemia (at least one total serum bilirubin of 20 mg/dL or more). In general, hypoglycemic cases tended to be infants whose mothers were younger, nonwhite, and less educated than mothers of controls. More women with a prepregnancy BMI > 29.0 appeared among the cases (22.9 percent) than the controls (17.6 percent).
Overview of results The results of these studies (1 good110 and 1 fair129) suggest that gestational weight gain is associated with the risk of infant hypoglycemia.
Results In the case-control study (rated good quality),110 after adjusting for age, race-ethnicity, parity, plasma screening value, and gestational age at last weight measured, the authors found that women who gained in the highest bracket of weight gain per week (more than 0.40 kg/week) had a increased risk of delivering an infant with hypoglycemia (AOR, 1.94; 95% CI, 1.33-2.82) than women gaining 0.22 to 0.31 kg per week.
Findings from the retrospective cohort study were similar.129 After controlling for several confounders, the authors found that weight gain of more than 18 kg was associated with hypoglycemia (AOR, 1.67; 95% CI, 1.13-2.46) when compared with weight gain of 11.5 to 16.0 kg.
Hyperbilirubinemia
Study characteristics The retrospective case-control study described above also examined the effect of gestational weight gain on infant hyperbilirubinemia (Evidence Table 27).110
Overview of results One good study110 suggested that increased gestational weight gain is associated with a higher risk of hyperbilirubinemia.
Detailed results Compared with controls, the hyperbilirubinemia case group had more Asians (20.1 percent vs. 8.1 percent) and tended to be born at a gestational age < 37 weeks. Compared with women gaining 0.22 to 0.31 kg per week, women who gained in the highest bracket of weight gain/week (more than 0.40 kg/week) had an increased risk of delivering an infant with hyperbilirubinemia (AOR, 1.94; 95% CI, 1.33-2.82).
Neonatal hospitalization
Study characteristics One study investigated the influence of gestational weight gain on perinatal outcomes, including hospitalization of infant (Evidence Table 28).12 Using a hospital-based, retrospective cohort study design, the authors studied 633 women who delivered live, singleton babies in Japan between 24 and 42 weeks’ gestation. Mean age of the
women was 29.1 and most were nulliparas. Most of the women gained between 8.5 and 12.5 kg (mean, 10.5 kg) during their pregnancy. Gestational weight gain was collected from maternity records and was based on last weight taken at the hospital prior to delivery.
Overview of results One fair study suggested that infants of women who gained less than 8.5 kg during their pregnancy were 60 percent more likely to require hospitalization.12
Detailed results Overall, 13.3 percent had babies with complications requiring hospitalization, excluding admissions for phototherapy necessitated by neonatal jaundice. After adjusting for maternal age, parity, smoking, prepregnancy BMI, and gestational age, the authors did not find a significant relationship between gestational weight gain of less than 8.5 kg (AOR, 1.60; 95% CI, 0.88-2.88) or weight gain greater than 12.5 kg (AOR, 0.93; 95% CI, 0.46-1.88) and hospitalization of infant.
Other infant morbidity
Study characteristics Two studies addressed other neonatal morbidity in association with gestational weight gain (Evidence Table 29); one was the large cohort study noted above,129 and the other used a case-control design.130 Both studies relied on self-reported prepregnancy weights. Total weight gained during pregnancy was ascertained from prenatal records129 and women’s self-report.130 The studies differed on how gestational weight gain was categorized: the cohort study categorized gestational weight gain according to both the IOM recommendations (i.e., the woman was below, within, or above the IOM thresholds) and by extremes of weight gain (< 7 kg, > 15 kg); the case-control study defined gestational weight gain as a continuous variable.
Overview of results One fair study reported that gestational weight gain less than 7 kg was associated with neonatal seizure.129 Another fair study reported no significant association between infant leukemia and weight gain during pregnancy.130
Detailed results The cohort study looked at the relationship between gestational weight gain and several adverse neonatal outcomes (birth trauma, 5-minute Apgar score < 7, need for assisted ventilation, SGA, LGA, umbilical cord arterial pH < 7.1, umbilical cord arterial base excess < 10, admission to the neonatal intensive care unit [NICU], admission to the special-care nursery [a step-down unit], neonatal infection, seizure, hypoglycemia, polycythemia, jaundice, meconium aspiration syndrome, respiratory distress or tachypnea, anemia, birth asphyxia, and perinatal death).129 The authors controlled for maternal age, race, parity, smoking, pregravid
BMI, date of delivery, pregnancy-induced hypertension, mode of delivery, length of first stage of labor, length of second stage of labor, gestational age, and birthweight. Using weight gain of 11.5 to 16 kg as a reference, the authors reported that gestational weight gain less than 7 kg was associated with neonatal seizure (AOR, 10.66; 95% CI, 2.17-52.36). Gestational weight gain > 18 kg was associated with assisted ventilation (AOR, 1.52; 95% CI, 1.16-2.00), seizure (AOR, 6.19; 95% CI, 1.32-28.96), polycythemia (AOR, 1.59; 95% CI, 1.13-2.22), and meconium aspiration syndrome (AOR, 1.86; 95% CI, 1.13-3.05).
The case-control study130 examined the association between maternal reproductive history, including gestational weight gain, and the risk of infant leukemia in 240 cases, defined as infant leukemia diagnosed at < 1 year of age, and 255 controls matched to cases by year of birth. Infants with infant leukemia were significantly (P < 0.003) less likely to be white (79.5 percent vs. 85.5 percent) and more likely to be Hispanic (10.5 percent vs. 3.5 percent) than controls. After adjusting for sex, race or ethnicity, maternal education, and prepregnancy BMI, the authors found no significant association between infant leukemia and weight gain during pregnancy.
Infant BMI
Study characteristics Two older studies examined the influence of gestational weight gain on the offspring’s BMI (Evidence Table 30). One cohort study comprised 8,719 singleton, live-born infants from a hospital in Montreal, Canada, from 1980 to 1986.122 Of these mothers, 48 percent were primiparas, 90 percent were married, and 87 percent had started prenatal care in the first trimester. The infant’s weight and length at birth was used to calculate BMI. Weight gain was expressed as total weight gain minus the weight of the infant at birth. The second study enrolled 119 term GDM and 143 term control mother-infant dyads from a hospital in Rhode Island in 1982.131 The mothers were all screened for gestational diabetes using a universal screen approach between 24 and 28 weeks’ gestation. Anthropometric measurements on the infants were done by study staff on the second day of life; weight and height was used to calculate infants’ BMI. Total gestational weight gain was defined as measured weight at last prenatal visit (within one week of delivery) minus self-reported pregravid weight.
Results The Canadian study reported that net gestational weight gain was weakly but significantly correlated with infant’s BMI (r = .04, P < 0.01).122 In multivariate analysis, net gestational weight gain did not meet the criterion threshold for remaining in the stepwise regression.122
In the U.S. study, total gestational weight gain was significantly correlated with infant’s BMI (r = .22, P = 0.01).131 In multivariable regression
analysis done separately for mothers with GDM and controls, total gestational weight gain significantly predicted infant’s BMI such that a 1 kg increase in weight gain was associated with a 0.06 and 0.05 increase in BMI for GDM and control infants, respectively, after controlling for pregravid BMI and glucose values. The difference between the results of these two studies lies in the fact that once the weight of the infant is removed from total weight gain, an important product of conception is missing from the measure of weight gain and thus the strength of the association is reduced.131
Other infant growth characteristics
Study characteristics Six studies examined the association between gestational weight gain and various other infant growth characteristics (Evidence Table 31, Table 25).31,56,57,62,82,89
Overview of results The evidence from one good,98 three fair,14,56,57,82 and one poor study68 suggest that gestational weight gain is associated with various measures of infant growth characteristics. A single fair study failed to find an association between gestational weight gain and infant proportionality.122
Detailed results One good-quality study analyzed the relationship between weight gain (total and by trimester) and ponderal index (PI, a way of characterizing the relationship of height to mass for an individual).98 Each kilogram of weight gained in the first and third trimesters significantly increased the PI: first trimester, an estimated 0.21 units; third trimester, by 0.12 units. Second trimester weight gain was not associated with newborn PI. The authors adjusted their models for gestational age, sex, parity, maternal height, maternal age, and pregravid BMI.
A retrospective cohort study (rated fair quality) conducted in France examined predictors of various infant growth measures,92 using standardized coefficients (SC) from stepwise regression models. SCs are regression coefficients calculated as if all of the independent variables had a variance of 1. Pregnancy weight gain had a significant influence on birthweight (SC 0.199), crown-heel length (SC 0.142), head circumference (SC 0.120), and subscapular skinfold thickness (SC 0.146).
One fair-quality study examined proportional weight gain in relation to fetal growth rate in millimeters (mm) per day, calculated by averaging three ultrasound measurements of the sagital and transverse diameters of the fetal abdomen in three study time periods.117 Increases in proportional weight gain during the second period (weeks 25 to 33) and third period (weeks 33 to 37), but not the first period (weeks 17 to 25) were significantly associated with significant increases in fetal growth. These results were adjusted for age, BMI, smoking, history of delivering an SGA infant, and infant sex.
TABLE 25. Gestational Weight Gain and Other Infant Growth Measures
|
Author, Year Country, Setting Sample Size Baseline BMI Quality |
Pregravid Weight (How Measured) Total Weight Gain (How Measured) |
Definition of Groups |
|
Brown et al., 200298 |
Pregravid weight: Measured by study investigators |
G1: Increase in ponderal index per 1 kg increase in first trimester weight gain G2: Increase in ponderal index per 1 kg increase in second trimester weight gain G3: Increase in Ponderal Index per 1 kg increase in third trimester weight gain |
|
USA, primary care clinics |
||
|
Total weight gain: Collected by study investigators |
||
|
389 |
||
|
All weight/BMI |
||
|
Good |
||
|
Guihard-Costa et al., 200492 |
Pregravid weight: Routine prenatal care |
G1: SC for effect of GWG on crown-heel length G2: SC for effect of GWG on head circumference G3: SC for effect of GWG on subscapular skinfold thickness |
|
France, hospital database |
||
|
Total weight gain: Routine prenatal care or maternity records |
||
|
13,972 |
||
|
All weights/BMI |
SCs are regression coefficients calculated as if all of the independent variables had a variance of 1 |
|
|
Fair |
||
|
Kirchengast and Hartmann, 200393 |
Pregravid weight: Estimated from measured weight at first prenatal visit |
Change in infant size characteristics per 1 kg increase in GWG |
|
Austria, university hospital |
G1: Birth length (cm) G2: Head circumference (cm) G3: Acromial circumference (cm) G4: Diameter frontoccipitalis (cm) |
|
|
Total weight gain: Routine prenatal care or maternity records |
||
|
8,011 |
||
|
All weights/BMI |
||
|
Fair |
||
|
Kramer et al., 1990122 |
Pregravid weight: Self-report |
Correlation coefficients between GWG and: |
|
Canada, university hospital |
G1: Length G2: Head circumference G3: BMI G4: Ponderal Index G5: Weight/Head circumference |
|
|
Total weight gain: Routine prenatal care or maternity records |
||
|
8,719 |
||
|
All weights/BMI |
Net gestational weight gain was associated with correlation coefficients of −0.04 for length, −0.01 for head circumference, 0.04 for BMI, 0.04 for Ponderal Index, and 0.01 for weight/head circumference. Results were significant (P < 0.01) for length, BMI, and Ponderal Index |
|
|
Fair |
|
Results |
Confounders and Effect Modifiers Included in Analysis |
|
|
G1: β = 0.21 (P < 0.0003) |
Maternal age, parity, pregravid BMI, height, infant sex, gestational age |
|
|
G2: β = 0.05 PI (P < 0.4) |
||
|
G3: β = 0.12 (P < 0.03) |
||
|
G1: SC 0.142 G2: SC 0.120 G3: SC 0.146 |
Maternal age, parity, pregravid BMI, height |
|
|
G1: β = 0.55 (0.43-0.68) G2: β = 0.33 (0.23-0.42) G3: β = 0.47 (0.39-0.55) G4: β = 0.12 (0.07-0.18) |
Maternal age, age at menarche, pregravid weight, height, distantia cristarum |
|
|
G1: −0.04 (P < 0.01) G2: −0.01 G3: 0.04 (P < 0.01) G4: 0.04 (P < 0.01) G5: 0.01 |
Pregravid weight, infant sex, smoking, parity, maternal diabetes, height, previous LBW infant, severe pregnancy-induced hypertension |
|
|
Author, Year Country, Setting Sample Size Baseline BMI Quality |
Pregravid Weight (How Measured) Total Weight Gain (How Measured) |
Definition of Groups |
|
Shepard et al., 1996117 |
Pregravid weight: Medical records |
Increase in mean abdominal fetal growth rate (mm/day) per 5% increase in proportional weight gain in this period: |
|
Norway and Sweden, multicenter study |
Total weight gain: Measured at 3 study time periods |
|
|
G1: Weeks 17-25 G2: Weeks 25-33 G3: Weeks 33-37 |
||
|
369 |
||
|
All weights/BMI |
||
|
Fair |
||
|
Ekblad and Grenman, 199268 |
Pregravid weight: Medical records |
Mean symphysis-fundus height: |
|
G1: Weight gain ≤ 5 kg G2: Weight gain 5-20 kg G3: Weight gain ≥ 20 kg |
||
|
Finland, hospital |
Total weight gain: Routine prenatal care or maternity records |
|
|
357 |
||
|
Prepregnancy weight 20% over or under ideal body weight for height and normal weight |
||
|
Poor |
||
|
β, unstandardized coefficient from multiple regression; BMI, body mass index; cm, centimeters; g, gram; GWG, gestational weight gain; kg, kilogram; SC, standardized coefficient; SGA, small-for-gestational age. |
||
Infant body proportionality was studied in a Canadian population (rated fair quality) with validated gestational ages.122 Proportionality was evaluated using z transformations of crown-heel length, head circumference, BMI, PI, and birthweight/head circumference. Net gestational weight gain was associated with correlation coefficients of −0.04 for length, 0.04 for BMI, and 0.04 for PI (all P < 0.01). ORs of low and high PI for each 5 kg decrease in net gestational weight gain were not significant.
A fair-quality study conducted in Austria found that for each 1 kg increase in total gestational weight gain, birth length increased by 0.55 cm (95% CI, 0.43-0.68), head circumference increased by 0.33 cm (95% CI, 0.23-0.42), acromial circumference increased by 0.47 cm (95% CI, 0.39-0.55), and diameter frontoccipitalis increased by 0.12 cm (95% CI, 0.07-0.18).93 This study adjusted for maternal age, age at menarche, pregravid weight, height, and distantia cristarum.
|
Results |
Confounders and Effect Modifiers Included in Analysis |
|
|
G1: β = 0.35 (P = 0.49) G2: β = 0.88 (P = 0.02) G3: β = 1.53 (P = 0.02) |
Maternal age, pregravid BMI, previous SGA, infant sex |
|
|
G1: 30.8 cm ± 4.0 G2: 32.8 cm ± 3.4 G3: 35.0 cm ± 3.9 |
N/A |
|
Finally, a poor-quality retrospective cohort study conducted in Finland examined the relationship between weight gain and symphysis-fundus (SF) height.68 SF height did not differ significantly between weight gain groups at 24 weeks, but higher gestational weight gains were associated with longer SF height.
Child Outcomes
Childhood weight status
Study characteristics Four studies, using different definitions of outcomes, examined the long-term effect of gestational weight gain on children’s weight status (Evidence Table 32).99-102 Three studies enrolled the subjects at birth and then followed them through various end points; up to
15 months postpartum,132 3 years of age,24 and 2 and 5 years for the Avon longitudinal study of pregnancy and childhood (ALSPAC) in England.133 All three included only singleton births. One was conducted using a national representative sample from 1979 that followed the children of mothers who were born in 1984, 1986, 1988, and 1990 for up to 12 years.134
Overview of results Due to the different definitions of the outcomes, the results from three fair100-102 and one poor99,102 studies are mixed for an association between gestational weight gain and childhood weight status.
Detailed results In the ALSPAC study (rated fair), which used as its outcome “catch up growth” from birth to 2 years of age (for definition see Table 26), bivariate analysis suggested that children who showed catch-up growth were no different in the amount of weight that their mothers gained during pregnancy than children who showed no change or those who had catch-down growth. No adjustments were made for confounding.
In another fair study that reported on the effect of total weight gain and net weight gain (excluding infant birthweight),24 child BMI percentiles at age 3 were grouped as follows: below 50th (referent category), 50th to 84th, 85th to 94th, and 95th or higher. Gestational weight gain was associated with a BMI of ≥ 95 percentile in both bivariate and multivariate analysis; a 5 kg increase in weight gain was associated with a 52 percent increase in risk of obesity in the offspring. Gestational weight gain was also associated with BMI z score. Similar associations were found when using net weight gain as the exposure.
The one poor study that examined BMI ≥ 85th percentile at ages less than 14 months did not find any association with gestational weight gain.132 However, the nationally representative study did find an association for early onset of overweight associated with weight gains ≥ 20.43 kg (≥ 45 lbs) but not later on in life.134
The U.S. study (rated poor quality) determined, using multivariable logistic regression models, that gestational weight gain was a significant predictor of infant obesity at 1 and 14 months of age.132 The odds of obesity rose 10 percent at 1 month for every 5-pound increase in weight gain adjusting for parental and household variables, sex of the infant, and ethnicity (OR, 1.1; 95% CI, 1.0-1.2). At 14 months the association was reversed; the odds of obesity was decreased by 20 percent for every 5-pound increase in gestational weight gain (OR, 0.8; 95% CI, 0.7-1.0), adjusting for several variables include birth BMI and BMI from the previous study month.
Childhood hospitalization
Study characteristics One study, a cohort of children (N = 11,980) born to mothers attending midwifery centers in Denmark from April 1984
TABLE 26. Gestational Weight Gain and Childhood Weight Status
|
Author, Year Country, Setting Sample Size Baseline BMI Quality |
Pregravid Weight (How Measured) Total Weight Gain (How Measured) |
Definition of Groups |
Results |
Confounders and Effect Modifiers Included in Analysis |
|
Li et al., 2007134 |
Pregravid weight: Self-report |
Maternal weight gain categories (kg): G1: < 15 lbs G2: 15-24 lbs G3: 25-34 lbs G4: 35-44 lbs G5: > 45 lbs |
AOR (95% CI) for early onset overweight (early onset of overweight that persisted throughout childhood) compared with normal (low probability of overweight throughout childhood and was characterized as the never overweight class) G5: 1.7 (1.0-2.9) G3: 1.0 (reference) |
Infant sex, race, birth order, gestational age, birthweight, breastfeeding, pregravid BMI, maternal age, maternal education, family income |
|
USA, National Longitudinal Survey of youth 1979 Child and Young Adult file |
||||
|
Total weight gain: Self-report |
||||
|
1,739 |
||||
|
Other AOR for weight gain categories for early onset overweight not significant compared with weight gain 25-34 lbs |
||||
|
All weight/BMI |
||||
|
Fair |
No association between maternal weight gain and risk of late onset overweight (moderately high probability of overweight at age 2 years, low probability of overweight at age 4 and 6 years, but growing probability of overweight after age 8 years) |
|||
|
Oken et al., 200724 |
Pregravid weight: Self-report |
Maternal weight gain, 5 kg increments |
AOR (95%CI) BMI ≥ 95th percentile vs BMI < 50th percentile associated with a 5 kg increase in gestational weight gain: 1.52 (1.19-1.94) |
Smoking, race, household income, marital status, glucose tolerance, gestation length, breastfeeding duration, child’s sex |
|
USA, HMO |
||||
|
1,044 |
||||
|
Total weight gain: Measured |
||||
|
All weight/BMI |
Child BMI z-score at age 3 years for AOR listed above (95% CI): 0.11 (0.05, 0.17) |
|||
|
Fair |
|
Author, Year Country, Setting Sample Size Baseline BMI Quality |
Pregravid Weight (How Measured) Total Weight Gain (How Measured) |
Definition of Groups |
Results |
Confounders and Effect Modifiers Included in Analysis |
|
Ong et al., 2000133 |
Pregravid weight: Self-report |
Maternal weight gain, continuous measure |
Children were grouped into three growth categories (catch-up, no change, and catch-down) based on a gain in weight (SD score > 0.67 for catch-up; SD score < 0.67 for catch-down. |
NA |
|
UK, Avon longitudinal study of pregnancy and childhood |
||||
|
Total weight gain: Obstetric records |
||||
|
Maternal weight gain was not a significant predictor of catch-up growth between 0 and 2 years |
||||
|
848 |
||||
|
All weight/BMI |
||||
|
Fair |
||||
|
Sowan et al., 2000132 |
Pregravid weight: Self-report |
Maternal weight gain, 5 lb. increments |
AOR (95%CI) for infant obesity (BMI > gender and age specific 84th percentile based on Infant Growth Study population norms) at 1, 4, 7, and 10 months: NS |
Maternal age, nonpregnant weight, smoking, marital status, father living in home, family stress, grandmother living in home, socioeconomic status, gender, race, infant BMI at birth, infant BMI from previous study month |
|
USA, NIH-funded Infant Growth Study |
||||
|
Total weight gain: Self-report |
AOR (95%CI) for obesity at 14 months: .8 (0.7-1.0) |
|||
|
630 |
||||
|
All weight/BMI |
||||
|
Poor |
||||
|
AOR, adjusted odds ratio; BMI, body mass index; CI, confidence interval; G, group; HMO, health maintenance organization; kg, kilogram; lbs, pounds; USA, United States of America; vs, versus. |
||||
to 1987, examined the effect of maternal prenatal lifestyle factors on children’s hospitalizations with infectious diseases (Evidence Table 33).135 After excluding stillbirths, multiple births, and children with congenital malformations, the authors followed 10,440 newborns from 6 months to 12 years. Information on prenatal factors was self-reported by the mother via a questionnaire. Weight gain, calculated as the difference between the self-reported pregravid weight and the weight measured at the time of delivery obtained from the medical records, was categorized as < 10, 10 to 12, 13 to 15, and ≥ 16 kg. Outcome data on hospitalizations related to infections were obtained from registry information based on ICD codes.
Overview of results One fair study suggested that weight gain > 13 kg only for women who were underweight before pregnancy (BMI < 18) was associated with an increased risk of childhood hospitalization for infectious diseases.135
Detailed results The crude incidence rate ratios (IRRs) for the effect of weight gain on hospitalizations were nonsignificant compared with weight gains of 13 to 15 kg: < 10 kg, 0.99; 10 to 12 kg, 0.93; and > 16 kg, 1.01). When maternal pregravid weight status was stratified as BMI < 18 and BMI ≥ 18, weight gain greater than 13 kg among women with a pregravid BMI < 18 increased the risk of hospitalizations compared with women with higher BMI and gaining similar weight (IRR, 1.42; 95% CI, 1.09-1.86). This model adjusted for maternal and paternal age, social group, marital status, number of siblings, and maternal smoking during pregnancy.
Short- and Long-term Maternal Outcomes
Lactation We found no evidence on the effect of gestational weight gain (not defined by IOM definitions) on lactation that accounted for pregravid weight. We present results for studies relying on IOM definitions of weight gain under KQ 3.
Postpartum weight retention
Study characteristics Twelve articles from 10 study populations examine the relationship between gestational weight gain and postpartum weight retention (Evidence Table 34, Table 27).105,136-146 Six articles used data collected within 1-year postpartum;105,140-143,145 four used long-term follow-up data of greater than 1 year postpartum;136,142,144,146 and three used interpregnancy interval data.137-139
Overview of results The results of the two good144,147 and eight105,136-143,145 fair studies reviewed in this section suggest that gestational weight gain is positively associated with weight retention within 1 year postpar-
TABLE 27. Gestational Weight Gain and Postpartum Weight Retention
|
Author, Year Country, Setting Sample Size Baseline BMI Quality |
Pregravid Weight (How Measured) Total Weight Gain (How Measured) |
Definition of Groups |
|
Callaway et al., 2007146 |
Pregravid weight: Self report |
G1: Gestational weight gain ≤ 15 kg |
|
Australia, University Hospital |
||
|
Total weight gain: Obstetric records/maternal questionnaires |
G2: Gestational weight gain > 15 kg |
|
|
3,572 |
||
|
All weight/BMI |
||
|
Good |
||
|
Harris et al., 1999144 |
Pregravid weight: Measured at first trimester prenatal visit |
Continuous maternal weight gain, kg |
|
UK, Antenatal Care Project |
||
|
74 |
||
|
Total weight gain: Self report |
||
|
All weight/BMI |
||
|
Good |
||
|
Harris et al., 1997137 |
Pregravid weight: Measured within 13 weeks’ gestation |
Gestational weight gain during previous pregnancy (kg), continuous |
|
UK, Hospital |
||
|
523 |
||
|
Total weight gain: Measured |
||
|
All weight/BMI |
||
|
Fair |
||
|
Harris et al., 1997138 |
Pregravid weight: Measured within 13 weeks’ gestation |
Gestational weight gain during first pregnancy as a continuous measure (kg) |
|
UK, Hospital |
||
|
243 |
||
|
Total weight gain: Measured |
||
|
All weight/BMI |
||
|
Fair |
|
Results |
Confounders and Effect Modifiers Included in Analysis |
|
|
G1: Mean change (95% CI) in BMI at 21 years postpartum: 5.06 kg/m2 (4.85-5.27) |
Baseline income, secondary school completion, ethnicity, maternal age at birth, parity, birthweight, gestational age, infant sex, maternal smoking during pregnancy, smoking at 21 years, sedentary lifestyle at 21 years, baseline maternal BMI, hypertensive disorders during pregnancy |
|
|
G2: Mean change (95% CI) in BMI at 21 years postpartum: 6.40 kg/m2 (6.19-6.61) |
||
|
P < 0.001 |
||
|
G2 was associated with a mean change in BMI over 21 years of 0.19 kg/m2 (95%CI: 0.16-0.22) |
||
|
ANCOVA model with weight (kg) at 2.5 years postpartum as dependent variable and maternal weight gain (kg) as independent variable: B = −0.031 β = −0.029 SEM = 0.120 P = 0.796 |
Marital status, increased dissatisfaction with body, increased access to food, increased energy intake, decreased activity, smoking status, maternal age, duration of followup, pregravid BMI, parity, gestational age at booking, parental obesity, social support |
|
|
ANCOVA model for interpregnancy weight change (kg), defined as the difference between weight at start of index pregnancy and weight at start of previous pregnancy: B = 0.262 β = 0.227 SEM = 0.52 P < 0.001 |
Marital status, smoking status, alcohol, parity, age, socioeconomic status, nulliparous BMI, birthweight, gestational age at start of previous pregnancy, gestational age at start of index pregnancy, gestational age at start of first pregnancy, interpregnancy interval, gestational age at delivery |
|
|
ANCOVA model for interpregnancy weight change (kg), defined as the difference between weight at start of first pregnancy and weight at start of the second pregnancy: B = 0.176 β = 0.169 SEM = 0.070 P < 0.013 |
Marital status, lactation, smoking status, alcohol, height, nulliparous BMI, birthweight, gestational age at start of previous pregnancy, terminations between pregnancy, interpregnancy interval |
|
|
Author, Year Country, Setting Sample Size Baseline BMI Quality |
Pregravid Weight (How Measured) Total Weight Gain (How Measured) |
Definition of Groups |
|
Hunt et al., 1995139 |
Pregravid weight: Self-report (validated by hospital records if available) |
G1: Population-based sample |
|
USA, population-based family history database (Utah) and participants of an obesity study |
||
|
G2: Morbidly obese women who were normal weight at age 20-24 years or prior to first pregnancy |
||
|
Total weight gain: Self-report (validated by hospital records if available) |
||
|
221 |
||
|
All weight/BMI Morbidly obese |
||
|
Fair |
||
|
Linne et al., 2004142 |
Pregravid weight: |
Gestational weight gain as a continuous variable (kg): |
|
Sweden, Stockholm Pregnancy and Weight Development Study |
Self-report |
|
|
G1: Pregravid BMI ≤ 25 |
||
|
Total weight gain: Medical Records |
||
|
G2: Pregravid BMI > 25 |
||
|
563 |
||
|
All weight/BMI |
||
|
Fair |
||
|
Linne et al., 2003136 |
Pregravid weight: Self-report |
G1: Women with normal BMI (20-25) at prepregnancy and 15 years postpartum |
|
Sweden, Stockholm Pregnancy and Women’s Nutrition Study |
||
|
Total weight gain: Medical records |
||
|
G2: Women with normal BMI at prepregnancy who had overweight BMI (> 25) at 15 years postpartum |
||
|
563 |
||
|
Normal weight/overweight |
||
|
Fair |
|
Results |
Confounders and Effect Modifiers Included in Analysis |
|
|
Regression of current weight on total number of pregnancies showed a 1.3 kg/pregnancy increase in current weight (P = 0.03) with no difference between G1 and G2 (P = 0.60) |
Weight at ages 20 to 24, current age |
|
|
Gestational weight gain was significantly greater in G2 than G1 for the first pregnancy only (P < 0.05) |
||
|
G2 had a net weight retention after the first pregnancy of 4.0 kg greater than G1 at 6 weeks postpartum |
||
|
G2 averaged 1.6 kg/pregnancy greater weight retention than G1 for additional pregnancies |
||
|
G2 had significantly greater weights at prepregnancy, delivery, 1 year postpartum, and 15 years postpartum compared to G1 (P < 0.001); however, G2 did not have a higher risk of postpartum retention than G1 |
Alcohol use, smoking, number of pregnancies since index child, employment area |
|
|
G1: Mean (SD) maternal weight gain, 13.6 (3.7) kg |
None |
|
|
G2: Mean (SD) maternal weight gain, 15.4 (4.4) kg |
||
|
t-Test: P < 0.001 |
||
|
Author, Year Country, Setting Sample Size Baseline BMI Quality |
Pregravid Weight (How Measured) Total Weight Gain (How Measured) |
Definition of Groups |
|
Muscati et al., 1996105 |
Pregravid weight: Physicians’ records |
G1: Weight gain ≤ week 20 (kg) |
|
Canada, Prenatal Nutrition Counseling Program |
||
|
Total weight gain: Measured |
G2: Weight gain weeks 21-30 (kg) |
|
|
371 |
||
|
G3: Weight gain weeks 31-term |
||
|
All weight/BMI |
||
|
Fair |
||
|
G4: Total weight gain ≤ 12 kg |
||
|
G5: Total weight gain > 12 kg |
||
|
Ohlin et al., 1990145 |
Pregravid weight: Self-report |
Gestational weight gain as a continuous variable (kg) |
|
Sweden, maternity clinics |
||
|
Total weight gain: Maternity records |
||
|
1423 |
||
|
All weight/BMI |
||
|
Fair |
|
Results |
Confounders and Effect Modifiers Included in Analysis |
|
|
Regression model of weight retention (kg) at 6 weeks postpartum as the dependent variable and G1-G5 as independent variables: |
Standard weight for height (based on 1983 Metropolitan Life Insurance Tables), pregravid weight above standard (difference between actual weight and standard weight), parity, gestational age, infant sex |
|
|
G1: β = 0.86 (SE: 0.05) P < 0.001 |
||
|
G2: β = 0.68 (SE: 0.07) P < 0.001 |
||
|
G3: β = 0.49 (SE: 0.07) P < 0.001 |
||
|
G4: β = 0.58 (0.13) P = NR |
||
|
G5: β = 0.77 (0.04) P = NR |
||
|
Among women with AGA infants, women with 6 week postpartum weights greater than the median value (6.2kg, underweight; 5.7kg, normal weight; 3.1kg, overweight) had significantly greater total weight gains and weight gains during the first 20 weeks’ gestation compared to women with 6 week postpartum weights of the median value or lower |
||
|
Regression model for weight change (kg), defined as the difference between prepregnancy and 1 year postpartum weights: B = 0.32 P < 0.001 |
Lactation score, age, prepregnancy BMI, parity |
|
|
Author, Year Country, Setting Sample Size Baseline BMI Quality |
Pregravid Weight (How Measured) Total Weight Gain (How Measured) |
Definition of Groups |
|
Soltani et al., 2000143 |
Pregravid weight: Measured at 13 weeks’ gestation |
Pregravid weight G1: Normal weight G2: Underweight G3: Overweight G4: Obese |
|
UK, Hospital |
||
|
77 |
||
|
Total weight gain: Measured |
||
|
All weight/BMI |
||
|
Fair |
||
|
Walker et al., 2004141 |
Pregravid weight: Self report |
Continuous gestational weight gain (kg) |
|
USA, Austin New Mothers Study |
||
|
Total weight gain: Self report |
||
|
382 |
||
|
All weight/BMI |
||
|
Fair |
||
|
Parham et al., 1990140 |
Pregravid weight: Self report |
Gestational weight gain for population in tertiles, mean (se): G1: 3.7 (2.9) G2: 9.4 (1.3) G3: 16.0 (3.7) |
|
USA, prenatal clinics serving low income women |
||
|
Total weight gain: Measured |
||
|
158 |
||
|
All weight/BMI |
||
|
Poor |
||
|
AGA, average gestational age; ANCOVA, analyses of covariances; β, unstandardized regression coefficient; B, standardized regression coefficient; kg, kilogram; SD, standard deviation; SE, standard error; SEM, standard error of the mean; UK, United Kingdom. |
||
|
Results |
Confounders and Effect Modifiers Included in Analysis |
|
|
G1: Patterns of changes in body weight (kg) and fat mass follow a monotonous trend; body weight and fatness increased during gestation, decreased substantially at 6 weeks postpartum, and then stayed the same or slightly decreased until 6 months postpartum |
None |
|
|
G2: Showed similar pattern to G1. |
||
|
G3: Divergent pattern of weight gains and losses; body fat mass changes show a very scattered pattern |
||
|
G4: Divergent pattern of both weight and fat mass gains and losses; heavier and greater fat masses at 6 months postpartum compared to 13 weeks gestation; significantly lower fat mass loss and greater skinfold thickness gain between 36 weeks gestation and 6 months postpartum compared to normal weight women (P < 0.05) |
||
|
Each kg of gestational weight gain was associated with 0.314 kg/m2 of postpartum BMI (P < 0.001) |
Ethnicity, time, interaction of ethnicity and time, pregravid BMI, weight-related distress, energy intake |
|
|
Change in BMI category between prepregnancy and 1-3 months postpartum: G1, G2: 83% No change; 7% Desirable change (i.e., underweight women becoming normal weight); 10% Undesirable change (~5% had an increase in BMI category and ~5% had a decrease in BMI category) G3: 42% no change; 19% desirable change; 39% undesirable change (all increases in BMI category) |
None |
|
tum105,141,145 and with interpregnancy weight gains.137-139 There is evidence to suggest that pattern of weight gain influences weight retention; a higher percentage of weight gained within the first 20 weeks of gestation is retained at 6 weeks postpartum compared to weight gains later in pregnancy.105 Additionally, weight retention differs across pregravid BMI strata,138,143 with overweight and obese women retaining more weight compared to normal weight women. Postpartum weight retention seems to be especially problematic for obese women, who may be at risk for increases in fat mass and central adiposity in the postpartum period.143 In the long term, the effect of gestational weight gain on weight retention is less conclusive; two studies144,146 found little to no association between gestational weight gain and weight at 2.5 and 21 years after the index pregnancy and one study136 found that women who became overweight at 15 years follow-up had higher gestational weight gains compared to women who remained normal weight.
Results for less than 1-year postpartum Three cohort studies, two rated105,143 and the other rated poor,140 examined the association between weight gain and weight retention prior to 1-year postpartum.
One study used a population of low-income white women to examine the influence of total gestational weight gain and partial weight gains, categorized as weight gain ≤ 20 weeks, 21-30 weeks, and 31 weeks to term, on postpartum weight retention at 6 weeks.105 Each kilogram of gestational weight gain at ≤ 20 weeks, 21-30 weeks, and 31 weeks to term was significantly (P < 0.001) associated with an increase of 0.86 (± 0.05), 0.68 (± 0.07), and 0.49 (± 0.07) kg at 6 weeks postpartum, respectively. Pregravid weight status, defined as underweight, normal weight, and overweight, was based on 1983 Metropolitan Life Insurance Table weight-for-height values. The mean gestational weight gains for women with < median postpartum weight retention (median values of postpartum weight retention were 5.7 kg for underweight, 6.2 kg for normal weight, and 3.1 kg for overweight women) were 13.3, 13.2, and 9.6 kg for underweight, normal weight, and overweight women, respectively. In contrast, the mean weight gains for women ≥ median postpartum weight retention were 19.6, 20.2, and 19.1 kg, respectively (P < 0.001). Similar significant differences were seen for mean partial weight gains between women with postpartum weight retention < median and ≥ median values (P < 0.05-P < 0.001), with the greatest weight gain differences seen within 20 weeks of gestation. Gestational weight gain of 12 kg was associated with 2.5 kg of postpartum weight retention; regression analyses for weight gains of ≤ 12 kg and > 12 kg were associated with 0.58 (SE: 0.13) and 0.77 (SE: 0.04) kg of postpartum weight retention per kg of weight gain, respectively.
Another study measured body weight, body fat mass (kg), and skinfold thickness (sum of five skinfold thicknesses) from 13 weeks of gestation through 6 months postpartum.143 BMI categories at 13 weeks’ gestation were defined using the IOM BMI classifications. Patterns in changes of body weight and fat mass across the study period were described for each BMI category. Among normal-weight women, the patterns of changes in both body weight and fat mass follow a monotonic trend; body weight and fatness increased during gestation, decreased substantially at 6 weeks postpartum, and then stayed the same or slightly decreased until 6 months postpartum. Overweight women show a divergent pattern of weight gains and losses; women with the highest weight gains and losses at 6 months postpartum were in this group. Body fat mass changes showed a very scattered pattern. Obese women also show a divergent pattern of both weight and fat mass gains and losses; however, the majority of obese women are heavier and have greater fat masses at 6 months postpartum compared to 13 weeks’ gestation. Compared with normal-weight women, obese women have significant (P < 0.05) increases in total skinfold thickness between 36 weeks’ gestation and 6 months postpartum and in waist to hip ratio between 6 weeks’ and 6 months postpartum.
Results from the poor study were consistent140 among the women within the upper tertile for gestational weight gains (mean 16.0 ± 3.7 kg), approximately 39 percent had an increase in BMI category at 1 to 3 months postpartum compared to only 5 percent among women within the lower and middle tertiles for gestational weight gains (mean 3.7 ± 2.9 kg and 9.4 ± 1.3 kg, respectively).
Postpartum weight retention at 1 year Three publications (2 studies), all rated fair quality, measured weight retention at 1 year postpartum.141,142,145 One study using data from a low income, racially/ethnically diverse population reported that a 1 kg increase in gestational weight gain was associated with an increase of 0.314 kg/m2 in BMI at 1 year postpartum.141 Two articles based on data from the Stockholm Pregnancy and Weight Development Study examined the association between gestational weight gain and weight retention at 1 year postpartum.142,145 In one article, a 1 kg increase in total gestational weight gain was associated with a 0.32 kg increase in weight at 1 year postpartum (P < 0.001), which explained 12.7 percent of the variation in the change in weight from prepregnancy to 1 year postpartum (P < 0.001).145 The other article examined body weight at prepregnancy, delivery, 1 year followup, and 15 years followup in women with normal (BMI 20-25) and overweight (BMI > 25) pregravid BMI.142 Women who were overweight before pregnancy were significantly heavier at each time point (P < 0.001); however, there were
no significant differences between normal-weight women and overweight women in the amount of weight retained from prepregnancy to 6 months and 1 year postpartum.
Postpartum weight retention in the medium term One good-quality study144 found no association between gestational weight gain and weight retention at two and half years postpartum in a small cohort of women with low antenatal risks enrolled in the Antenatal Care Project (United Kingdom).
Long-term postpartum weight retention Three publications (2 studies) measured long-term weight retention. One good-quality study in a cohort of Australian women examined the association between gestational weight gain, dichotomized as ≤ 15 kg and > 15 kg, and weight retention at 21 years after the index pregnancy.146 Excessive weight gain during pregnancy (> 15 kg) was associated with a mean change in BMI of 0.19 kg/m2 (95% CI, 0.16-0.22).
Two articles, both rated fair, from the Stockholm Pregnancy and Weight Development Study examined the effects of gestational weight gain on weight retention at 15 years postpartum.136,142 At 15 years follow-up, women who had been overweight (BMI > 25) before pregnancy were heavier than women who had been of normal weight (BMI 20-25) before pregnancy.142 The difference in the weight increases from prepregnancy to 15 years follow-up between overweight and normal-weight women were not significant (7.7 ± 7.0 kg and 6.2 ± 12.1 kg, respectively; P = 0.36).142 Among women with normal pregravid weight, those who remained at a normal weight at 15 years follow-up had significantly lower gestational weight gains than women who were overweight at 15 years follow-up (13.6 ± 3.7 kg and 15.4 ± 4.4 kg, respectively; P < 0.001).136
Interpregnancy weight retention Three studies, all rated fair quality, examined the association between gestational weight gain and inter-pregnancy weight retention.137-139 Two cohort studies used data collected from women attending a city hospital in England.137,138 In one, gestational weight gain during a previous pregnancy was associated with a 0.262 kg increase (standard error of the mean [SEM], 0.052; P < 0.001) in weight between the index pregnancy and the previous pregnancy.137 In the other, gestational weight gain was associated with a 0.176 kg increase (SEM, 0.074; P = 0.001) in weight from the beginning of the index pregnancy to the beginning of the second pregnancy.138 Prepregnancy BMI and interpregnancy weight gain were independently associated, suggesting that women who had gained the most weight between pregnancies were more likely to have been overweight before their first pregnancy than women who gained less between pregnancies.
A cross-sectional study examined the effect of weight gain (self-reported) from multiple pregnancies on the development of morbid obesity in a group
of morbidly obese women, who were not morbidly obese prior to their first pregnancy, and population-based controls.139 The mean gestational weight gain and net weight retention for all pregnancies was 14.2 kg and 5.7 kg, respectively, for women who became morbidly obese, and 12.5 kg and 3.4 kg, respectively, for the controls. Women who became morbidly obese gained significantly more weight during their first pregnancy than controls (16.4 kg vs. 12.6 kg, respectively; P < 0.05), and they retained significantly more weight after their first and second pregnancies than controls (7.1 kg and 5.9 kg vs. 3.1 kg and 2.9 kg, respectively; P < 0.05). After adjusting for pregravid weight at ages 20 to 24 years, the authors determined that each pregnancy was associated with a 1.3 kg increase in current weight (P = 0.03), with no significant difference between the slopes of women who became obese and controls (1.6 kg/pregnancy and 1.0 kg/pregnancy, respectively; P = 0.6).
Premenopausal breast cancer
Study characteristics One study examined the effect of pregnancy weight gain on a woman’s risk of developing premenopausal breast cancer (Evidence Table 35).148 The study was a nested case-control study within a cohort of 22,610 Finnish women with a mean age of 40 during 1990 and 1993. Women self-reported their breast cancer status, and their current weight, highest nonpregnancy weight, weight at age 20, and weight gain during any pregnancy in one of four categories (< 10, 10-15, 16-20, and > 20 kg). A total of 114 women had identified themselves as having premenopausal breast cancer; of these, 98 women had provided information on year of birth, had been pregnant, and had their cancer diagnosed after a pregnancy. Four controls for each case from the cohort were selected matched by age and type of intrauterine device.
Overview of results The fair study suggested that gestational weight gain and premenopausal breast cancer are not associated.148
Detailed results ORs for breast cancer by gestational weight gain category were close to null and nonsignificant in both crude and adjusted models (age, education, family history of breast cancer, and change in BMI) using the < 10 kg category as the reference: ORs were 0.8 (0.44, 1.47), 1.0 (0.47, 2.04), and 0.8 (0.27, 2.13) for weight categories 10-15 kg, 16-20 kg, and > 20 kg, respectively.
KQ 3: Outcomes of Weight Gain Within or Outside IOM Recommendations
Although the KQ 3 issues are similar to those addressed in KQ 1, the focus here is on analyses that directly apply the categories of weight gain
during pregnancy that the IOM laid out in its 1990 document.1 The recommendations specific to BMI weight status groups and certain sociodemographic or physical characteristics are as follows:
-
28 to 40 pounds for women with low BMI (< 19.8);
-
25 to 35 pounds for women with normal BMI (19.8-26);
-
15 to 25 pounds for women high BMI (> 26.0-29.0);
-
weight gain of at least 15 pounds for obese women (BMI > 29);
-
weight gain in the upper end of the recommended range for adolescents and black women; and
-
weight gain in the lower end of the recommended range for short women (< 157 centimeters, or approximately 62 inches).
We present KQ 3 results similar to the presentation for KQ 1. We examine, first, maternal antenatal outcomes and then intrapartum outcomes; we then consider birth outcomes, infant outcomes, and child outcomes; and, finally, we cover maternal short- and long-term outcomes. When we have three or more studies dealing with the same topic (i.e., outcome), we present information in summary tables; otherwise, detailed information on these articles will be found in the relevant evidence tables in Appendix E.† For all outcomes, we first describe the studies (main study characteristics only); we then provide an overview of the results (for topics with more than one study), followed by a more detailed discussion of relevant studies.
We rated studies for quality as good, fair, or poor (as explained in Chapter 2). All studies are reported in summary tables (including quality grades), and they are presented in order by quality rating. The text focuses on studies of good and fair quality, in that order; the vast majority are fair quality, so studies for which no quality grade is specified can be assumed to be of fair quality. We only briefly summarize poor studies. Generally, if studies deal with more than one outcome, we describe the study once and refer back as needed.
Maternal Antepartum Outcomes
Gestational diabetes mellitus
Study characteristics Four studies examined the relationship between weight gain according to the IOM guidelines and GDM (Evidence Table 36, Table 28).3,53-55 Two studies were done specifically among obese women;54,55 two included women of normal weight;53,55 and one included women of various pregravid weight categories.3
Overview of results No definitive evidence from four studies (1 good,3 2 fair,53,55 1 poor54) exists of an association between high weight gain and
TABLE 28. Weight Change Relative to IOM Thresholds and Gestational Diabetes Mellitus
|
Author, Year Country, Setting Sample Size Baseline BMI Quality |
Pregravid Weight (How Measured) Total Weight Gain (How Measured) |
Definition of Groups |
Results |
Confounders and Effect Modifiers Included in Analysis |
|
Saldana et al., 20063 |
Pregravid weight: Self-report |
G1: Normal glucose tolerance G2: Impaired glucose tolerance G3: Gestational diabetes mellitus |
Mean (SE) weight gain ratio (defined as obeserved weight gain/IOM recommended weight gain): G1: 1.43 (0.04) G2: 1.48 (0.21) G3: 1.88 (0.15) P < 0.05 |
Race, age, gestational age |
|
USA, hospital |
||||
|
Total weight gain: Measured |
||||
|
952 |
||||
|
All weight/BMI |
||||
|
Good |
||||
|
BMI IOM |
||||
|
AOR (95% CI) for weight gain ratio: G1: 1.0 (reference) G3: 1.2 (0.9-1.4) |
||||
|
Edwards et al., 199655 |
Pregravid weight: Self-report |
Obese BMI > 29 (kg): G1: Lost weight/no change G2: 0.5-6.5 G3: 7-11.5 G4: 12-16 G5: > 16 |
Gestational diabetes, % G1: 13.3 G2: 24.3 G3: 11.9 G4: 16.7 G5: 17.3 P for linear trend (G1-G5) = 0.554 |
None |
|
USA, Hospital |
||||
|
Total weight gain: Measured |
||||
|
1,443 |
||||
|
Normal/obese weight/BMI |
||||
|
Fair |
||||
|
Normal weight BMI 19.8-26 G6: < 11.5 G7: 11.5-16 G8: > 16 |
||||
|
G6: 2.3 G7: 3.3 G8: 2.9 P for linear trend (G6-G8) = 0.759 |
|
Author, Year Country, Setting Sample Size Baseline BMI Quality |
Pregravid Weight (How Measured) Total Weight Gain (How Measured) |
Definition of Groups |
Results |
Confounders and Effect Modifiers Included in Analysis |
|
Thorsdottir, 200253 |
Pregravid weight: Self-report |
Maternal weight gain categories (kg): |
Gestational diabetes, % G1: 2.9 G2: 0 G3: 0 G4: 0 P for trend < 0.015 |
None |
|
Iceland, hospital records |
||||
|
Total weight gain: Maternity records |
G1: < 11.5 G2: 11.5-16.0 G3: 16.1-20.0 G4: > 20.0 |
|||
|
614 |
||||
|
Normal weight/BMI 19.5-25.5 |
||||
|
Fair |
||||
|
Bianco et al., 199854 |
Pregravid weight: Self-report |
Maternal weight gain categories among morbidly obese (BMI > 35): G1: Weight loss/no change G2: 1-15 lbs G3: 16-25 lbs G4: 26-35 lbs G5: > 35 lbs |
Distribution of GDM, %: G1: 15.7 G2: 15.0 G3: 14.4 G4: 13.4 G5: 12.5 P = NS |
Race, parity, clinic service, substance abuse, preexisting medical condition |
|
USA, medical center |
||||
|
Total weight gain: Measured |
||||
|
11,926 |
||||
|
Nonobese (BMI 19-27) and morbidly obese (BMI > 35) |
||||
|
Poor |
||||
|
AOR, adjusted odds ratio; BMI, body mass index; CI, confidence interval; g, gram; GDM, gestational diabetes mellitus; IOM, Institute of Medicine; kg, kilogram; NS, not sufficient; SE, standard error; USA, United States of America. |
||||
risk of developing GDM because of methodological problems with most studies addressing this topic.
Detailed results Obese women, independent of weight gain, had increased risks of developing GDM in three studies (1 of good quality,3 1 of poor quality54). Overweight women in the one good study that included them also had an increased risk for GDM.3 All studies used weight gain at the time of delivery, which included the weight gained after the diagnosis of GDM. This measure of weight gain is biased since, once the diagnosis of GDM is made, weight gain is closely monitored and controlled through treatment.
One good study evaluated weight gain up to the time of GDM diagnosis in both white and black women.3 The authors calculated the ratio of weight gain that expressed the amount of weight a woman gained to the amount she was expected to gain according to the IOM guidelines until the time of diabetes testing (that is, accounting for gestational length). Women who developed GDM had higher weight gain ratios than did women with normal glucose tolerance. In multivariable analysis, weight gain ratio was not significantly associated with developing GDM. However, among overweight women, a higher weight gain ratio was predictive of impaired glucose tolerance and this effect was stronger for white women (data not shown in table).
Two studies (1 poor-quality54) examined total weight gain and GDM risk in obese women; neither found any association (using bivariate analyses) with weight gains either above or below the IOM guidelines.54,55
Two studies reported findings for women of normal weight.53,55 One had too few women who developed GDM across the weight gain groups to permit analyses,53 and the other found no association.55
Hypertension
Study characteristics One poor study compared the effect of total weight gain on the risk of developing pregnancy-induced hypertension among morbidly obese women and nonobese women using data from Mount Sinai Medical Center from 1988 to 1995 (Evidence Table 37).54
Results In bivariate analysis, this study found no association between weight gains below or above the IOM guidelines and pregnancy-induced hypertension.
Preeclampsia
Study characteristics The association between gestational weight gain and preeclampsia was examined in four articles (2 from the same database)
of fair quality (Evidence Table 38, Table 29).4,25,53,55 Two studies included obese women;4,55 three included women of normal weight.25,53,55
Overview of results The evidence of an association between high weight gains and increased risk of preeclampsia is inconclusive.
Detailed results Among obese women, preeclampsia risk increased with gains greater than 25 pounds and decreased with gains lower than 15 pounds in one study.4 Another study reported no association, but it had not conducted multivariate analyses for this outcome.55
Among women of normal weight, one study found no association between preeclampsia and gains either below or above the IOM levels.53 In two other studies, the risk of preeclampsia rose as weight gains above the IOM recommendations increased;25,55 it dropped with weight gains below IOM thresholds in one of these studies.25
Maternal Intrapartum Outcomes
Cesarean delivery
Study characteristics Nine articles examined the effect on cesarean delivery of weight gain classified according to the IOM guidelines (Evidence Table 39, Table 30).4,25,53-55,77,118,149,150 These studies were all rated fair except for one poor study.54 Two articles were based on the same birth certificate data from Missouri;4,25 three used U.S. hospital databases;55,118,149 one used data from a U.S. midwifery practice;150 one used a random selection of normal-weight pregnant women in Iceland;53 and one used data from the U.S. Pregnancy Risk Assessment Monitoring System (PRAMS).77
Overview of results For underweight and normal-weight women, some evidence may suggest an increased risk of cesarean delivery for weight gains above IOM recommendations; evidence for obese or morbidly obese women is inconsistent.
Detailed results Two studies that examined women across a range of BMI categories found increased risks of cesarean delivery for weight gains exceeding IOM guidelines and these results were consistent in all pregravid weight categories (AORs of 1.6 and 2.0).149,150
The six studies stratified by pregravid weight status produced mixed results. Of the articles in this category, five considered women of normal weight.25,53,55,118,149 Of these five studies, two53,55 reported no association with weight gains above the IOM guidelines and three found a moderate association between cesarean delivery and weight gain above IOM recommendations25,118,149 Four studies (1 of poor quality54) examined these issues among overweight and obese women.54,55,118,149 They reported no
TABLE 29. Weight Change Relative to IOM Thresholds and Preeclampsia
|
Author, Year Country, Setting Sample Size Baseline BMI Quality |
Pregravid Weight (How Measured) Total Weight Gain (How Measured) |
Definition of Groups |
Results |
Confounders and Effect Modifiers Included in Analysis |
|
Devader et al., 200725 |
Pregravid weight: Self-report |
Maternal weight gain categories (lbs): |
AOR (95% CI) for preeclampsia: G1: 0.56 (0.49-0.64) G2: 1.00 (reference) G3: 1.88 (1.74-2.04) |
Age, race, education, income, alcohol use, height, prior pregnancy, inadequate prenatal care use, smoking, child’s gender, birth year |
|
USA, birth certificate data |
||||
|
Total weight gain: Measured |
G1: < 25 G2: 25-35 G3: > 35 |
|||
|
94,696 |
||||
|
Normal weight/BMI 19.8-26 |
||||
|
Fair |
||||
|
Edwards et al., 199655 |
Pregravid weight: Self-report |
Obese BMI > 29 (kg): |
Preeclampsia G1: 10.7 G2: 7.7 G3: 8.3 G4: 7.9 G5: 16.5 P for linear trend (for G1-G5) = 0.076 |
None |
|
USA, Hospital |
G1: Lost weight/no change G2: 0.5-6.5 G3: 7-11.5 G4: 12-16 G5: > 16 |
|||
|
Total weight gain: Measured |
||||
|
1,443 |
||||
|
Normal/Obese weight/BMI |
||||
|
Fair |
Normal weight BMI 19.8-26: G6: < 11.5 G7: 11.5-16.0 G8: > 16.0 |
|||
|
G6: 2.8 G7: 2.9 G8: 6.6 P for linear trend (for G6-G8) = 0.048 |
|
Author, Year Country, Setting Sample Size Baseline BMI Quality |
Pregravid Weight (How Measured) Total Weight Gain (How Measured) |
Definition of Groups |
Results |
Confounders and Effect Modifiers Included in Analysis |
|
Kiel et al., 20074 |
Pregravid weight: Self-report |
Maternal weight gain categories stratified by prepregnancy obesity status, Obese Class I (BMI 30-34.9), Obese Class II (BMI 35-39.9), Obese Class III (BMI ≥ 40): G1: ≤ –10 lbs G2: –2 to –9 lbs G3: No change G4: 2-9 lbs G5: 10-14 lbs G6: 15-25 lbs G7: 26-35 lbs G8: > 35 lbs |
For Obese Class I: OR (95% CI) for preeclampsia were significantly lower (< 1.00, G6 was reference) for G2-G5 and significantly higher for G7-G8. |
Age, race, parity, education, poverty (enrollment in Medicaid, WIC, food stamp programs), tobacco use, chronic hypertension |
|
USA, Hospital |
||||
|
Total weight gain: Medical record |
||||
|
120,170 |
||||
|
Obese BMI |
For Obese Class II: OR (95% CI) for preeclampsia were significantly greater (> 1.00, G6 was reference) for G1 and G3-G5 and significantly lower for G8. |
|||
|
Fair |
||||
|
For Obese Class III: OR (95% CI) for preeclampsia were significantly greater (> 1.00, G6 was reference) for G1-G3 and G5 and significantly lower for G7-G8 |
||||
|
Thorsdottir et al., 200253 |
Pregravid weight: Self-report |
Maternal weight gain categories (kg): G1: < 11.5 G2: 11.5-16.0 G3: 16.1-20.0 G4: > 20.0 |
Preeclampsia,% G1: 1.4 G2: 2.3 G3: 5.4 G4: 4.4 P for trend = 0.262 |
None |
|
Iceland, hospital records |
Total weight gain: Maternity record |
|||
|
614 |
||||
|
Normal weight/BMI 19.5-25.5 |
||||
|
Fair |
||||
|
AOR, adjusted odds ratio; BMI, body mass index; CI, confidence interval; g, gram; kg, kilogram; lbs, pounds; USA, United States of America. |
||||
TABLE 30. Weight Change Relative to IOM Thresholds and Cesarean Delivery
|
Author, Year Country, Setting Sample Size Baseline BMI Quality |
Pregravid Weight (How Measured) Total Weight Gain (How Measured) |
Definition of Groups |
Results |
Confounders and Effect Modifiers Included in Analysis |
|
Devader et al., 200725 |
Pregravid weight: Self-report |
G1: Gained less than 25 lbs G2: Gained 25-35 lbs G3: Gained more than 35 lbs |
AOR for cesarean delivery (additionally controlled for LGA and cephalopelvic disproportion) G1: 0.82 (0.78-0.87) G2: 1.0 G3: 1.35 (1.29-1.40) |
Age, race, education, income, alcohol use, height, prior pregnancy, inadequate prenatal care use, smoking, child’s gender, birth year |
|
USA-Missouri, birth certificate data |
||||
|
Total weight gain: As reported on birth certificate |
||||
|
94,696 |
||||
|
Normal weight BMI 19.8-26 |
||||
|
Fair |
||||
|
Edwards et al., 199655 |
Pregravid weight: Self-reported |
Obese G1: wt loss or 0 lbs G2: 1-14 lbs G3: 15-25 lbs G4: 26-35 lbs G5: > 35 lbs |
Obese G1: 30.7% G2: 21.6% G3: 23.8% G4: 26.2% G5: 30.1% Normal wt G1: 5.7% G2: 12.1% G3: 8.6% |
Age, parity, pregravid BMI, GDM, pregnancy-induced hypertension, prenatal adequacy, alcohol use, drug use, smoking, gestational age |
|
USA, hospital |
||||
|
Total weight gain: Prenatal records |
||||
|
1,443 |
||||
|
Normal BMI 19.8-26 |
||||
|
Obese BMI > 29 |
||||
|
Fair |
Normal weight G1: < 25 lbs G2: 25-35 lbs G3: > 35 lbs |
|||
|
No significant difference in rates of cesarean delivery by IOM weight gain categories for normal weight or obese women |
||||
|
Obese women AOR = 3.2 (2.3-4.4) for cesarean delivery |
|
Author, Year Country, Setting Sample Size Baseline BMI Quality |
Pregravid Weight (How Measured) Total Weight Gain (How Measured) |
Definition of Groups |
Results |
Confounders and Effect Modifiers Included in Analysis |
|
Jain et al., 200777 |
Pregravid weight: Self-reported |
G1: ≤ 15 lbs G2: 16-< 25 lbs G3: 25-< 35 lbs G4: ≥ 35 lbs G5: interaction term overwt/obese and gaining 25-35 |
Primipara (AOR, 95% CI) G5: 0.71 (0.43-1.19) |
Pregravid BMI, parity |
|
USA, PRAMS |
||||
|
Total weight gain: Self-reported |
Multipara G5: 0.77 (1.37-1.59) |
|||
|
7,661 |
||||
|
All weight/BMIs (using IOM definitions) |
||||
|
Fair |
||||
|
Kaiser and Kirby, 2001150 |
Pregravid BMI: Self-reported |
G1: Below IOM G2: Within IOM G3: Above IOM |
Crude OR 95% CI G1: 0.82 (0.49-1.36) G3:1.0 (0.62-1.63) |
Age, race, pregravid BMI, preeclampsia, height, previous live births, failure to progress, breech presentation, placental abruption, fetal bradycardia, primigravidity, birthweight |
|
USA, university nurse-midwifery system |
Total weight gain: Measured at last prenatal visit |
|||
|
AOR for weight gain above IOM recommendations: 2.04 (95% CI 1.02-4.05) |
||||
|
1,881 |
||||
|
All wt/BMI (using IOM definitions) |
||||
|
Fair |
|
Kiel et al., 20074 |
Pregravid BMI: Self-reported |
G1: Wt loss > 10 lbs G2: Wt loss 2-9 lbs G3: No change G4: 2-9 lbs G5: 10-14 lbs G6: 15-25 lbs G7: 26-35 lbs G8: > 35 lbs |
For all three classes of obese women, risks of cesarean delivery rise above an OR of 1 when weight gain exceeds 25 pounds |
Age, race, parity, education, poverty (enrollment in medicaid, WIC, food stamp programs), tobacco use, chronic hypertension |
|
USA-Missouri, birth certificate |
||||
|
Total weight gain: Birth certificate |
||||
|
120, 170 |
||||
|
Obese BMI > 30 |
||||
|
Fair |
||||
|
Parker and Abrams, 1992118 |
Pregravid weight: Self reported |
G1: Below IOM G2: Above IOM |
AOR for all women weight gain > IOM (G2) = 1.48 (1.25-1.76) |
Age, race, parity, pregravid BMI, height, maternal high and low weight gain, smoking, gestational age, birthweight |
|
USA, hospital data base |
Total weight gain: Measured weight in prenatal record |
For overweight women, there was no significant association between cesarean delivery and weight gain (AOR = 0.71 (0.40-1.26) |
||
|
6,690 |
||||
|
For nonoverweight women, the association between cesarean delivery and weight gain was 1.45 (1.21-1.73) |
||||
|
All wt/BMI (using IOM definitions) |
||||
|
Fair |
||||
|
Stotland et al., 2004149 |
Pregravid weight: No details reported |
G1: Below IOM G2: Above IOM |
AOR with birthweight in model G1: 0.99 (0.82-1.19) G2 :1.40 (1.22-1.59) |
Age, race, pregravid BMI, year of delivery, smoking, gestational age, birthweight, infant sex |
|
USA, university hospital |
||||
|
Total weight gain: No details reported, possibly measured weight in prenatal records |
||||
|
BMI < 19.8 G1 = 0.96 (0.67-1.37); G2 = 1.93 (1.45-2.53) BMI 19.8-26 G1 = 1.04 (0.81-1.33); G2 = 1.26 (1.06-1.50) BMI > 26 G1 = 0.74 (0.38-1.44); G2 = 1.21 (0.83-1.78) |
||||
|
9,788 |
||||
|
All wt/BMI |
||||
|
Fair |
|
Author, Year Country, Setting Sample Size Baseline BMI Quality |
Pregravid Weight (How Measured) Total Weight Gain (How Measured) |
Definition of Groups |
Results |
Confounders and Effect Modifiers Included in Analysis |
|
Thorsdottir et al., 200253 |
Pregravid weight: Self-reported |
G1 < 11.5 kg G2 11.5-16 kg G3 16.1-20 kg G4 > 20 kg |
G1: 17.4% G2: 9.5% G3: 12.9% G4: 13.1% |
Age, parity, height, gestational age, birthweight |
|
Iceland, hospital records |
Total weight gain: Measured weight in prenatal records |
|||
|
No significant differences in cesarean delivery rates by IOM weight gain categories in normal weight women |
||||
|
614 |
||||
|
Normal wt/BMI 19.5-25.5 |
||||
|
Fair |
||||
|
Bianco et al., 199854 |
Pregravid weight: Perinatal data base |
G1: wt loss or 0 lbs G2: 1-15 lbs G3: 16-25 lbs G4: 26-35 lbs G5: > 35 lbs |
G1: 25.5% G2: 26.8% G3: 28.8% G4: 35.0% G5: 33.8% No significant difference among morbidly obese women by weight gain categories |
Macrosomia |
|
USA, hospital |
||||
|
Total weight gain: Perinatal data base |
||||
|
11,926 |
||||
|
Nonobese BMI 19 to 27/morbidly obese BMI > 35 |
||||
|
OR for cesarean comparing morbidly to nonobese = 2.3 (1.9-2.8) |
||||
|
Poor |
association between weight gain and risk of cesarean delivery. For underweight women, two studies reported a moderate to strong association between weight gain above IOM recommendations and risk for cesarean delivery;118,149 for nonobese women, one of these studies reported a moderate association.118 Three studies reported that the risk of cesarean delivery was higher for obese or morbidly obese women than for nonobese women.54,55,150 One study suggested that these risks increase within classes of obesity with gains greater than 25 pounds.4
The one study that examined the interaction between weight gain of 25-34 pounds and pregravid overweight or obese status did find a significant effect for multiparous women but not primiparous.77
Birth Outcomes
Preterm birth
Study characteristics Four studies, all rated fair, reported on the association between weight gain according to the IOM guidelines and preterm birth defined as < 37 completed weeks of gestation (Evidence Table 40, Table 31).22,85,151,152 One study reported on total weight gain.22 All four reported on the rate of weight gain or pattern.22,85,151,152
Overview of results Despite inconsistencies in the definitions of rate of weight gain and the timing of its calculation, the four studies are consistent in showing increased risks of preterm birth for underweight and normal-weight women, thereby providing evidence of some association between weight gain below IOM recommendations and preterm birth. Evidence about any association between weight gain above IOM recommendations and preterm birth is inconclusive.
Detailed results on total weight gain The single study on total weight gain, set in the United States, included only singleton live births with no pregnancy complications among predominantly Hispanic women (80 percent) using information reported on the medical record.22 Total weight gain was defined as weight at last prenatal visit minus self-reported pregravid weight (which was checked for biological plausibility). To analyze observed weight gains in light of the IOM recommendations, the authors created an “expected total weight gain” variable using the amount of weight gain a woman was supposed to gain according to the IOM guidelines when her last weight was measured and then calculated a ratio of observed to expected weight gain. Ratios greater than 1 indicate that the women gained more weight than expected; ratios less than 1 indicate that they gained less weight than expected. For all but obese women, the pattern of risk of
TABLE 31. Weight Change Relative to IOM Thresholds and Preterm Birth ( 37 weeks)
|
Author, Year Country, Setting Sample Size Baseline BMI Quality |
Pregravid Weight (How Measured) Total Weight Gain (How Measured) |
Definition of Groups |
|
Hickey et al., 1995151 |
Pregravid weight: Self-reported |
G1: Low rate of weight gain in first trimester-underweight (BMI < 19.8) & < 2.3 kg and normal weight (BMI 19.8-26) & < 1.6 kg |
|
USA, university prenatal clinics |
||
|
Total weight gain: Prenatal records |
||
|
1,518 |
||
|
G2: Low rate of weight gain in second trimester (Underwt & < 0.38 kg/wk or normal wt & < 0.37 kg/wk) |
||
|
Under/normal wt |
||
|
Fair |
||
|
G3: Low rate of weight gain in third trimester (Underwt & < 0.38 kg/wk or normal wt & < 0.37 kg/wk) |
||
|
Schieve et al., 2000152 |
Pregravid weight: Self-reported baseline |
G1: Low < 0.5 less/week; G2: Average 0.5-1.5 lb/week G3: High > 1.5 lb/week |
|
USA, nationally representative 1988 births |
||
|
Weight gain: Rate of measured weight between 14 and 28 wks gestation |
||
|
3,511 |
||
|
All wt/BMI Low BMI < 19.8 Average BMI 19.8-26 |
||
|
High BMI > 26 |
||
|
Fair |
||
|
Siega-Riz et al., 199422 |
Pregravid weight: self reported |
Total weight gain expressed as a ratio of observed: expected based on the IOM recommendation for a given gestational age. |
|
USA, public health clinics |
||
|
Total weight Gain: Prenatal records |
||
|
5,854 |
||
|
All wt/BMI (using IOM definitions) |
||
|
Fair |
|
Results |
Confounders and Effect Modifiers Included in Analysis |
|
OR (95% CI) for spontaneous preterm G1: 1.27 (0.7-2.3) G2: 1.23 (0.7-2.18) G3: 2.46 (1.53-3.92) |
Age, race, pregravid BMI, height, alcohol use, history of previous infant less than 2,750 g, number of days between last weight observation and delivery, smoking, infant sex |
|
Pattern of weight gain G1 only: 2.94 (0.73-11.98) G2 only: 1.08 (0.1-11.23) G3 only: 11.54 (2.93-45.28) G1 & G2: 4.89 (0.85-28.14) G1 & G3: 4.49 (0.96-20.96) G2 & G3: 7.37 (1.66-32.76) All trimesters: 4.18 (0.75-23.35) |
|
|
AOR for preterm birth Low BMI: G1 = 6.7 (1.1-40.6) Low BMI: G2 = 0.8 (0.4-1.4) Low BMI: G3 = 1.0 (0.4-2.6) Average BMI: G1 = 3.6 (1.6-8.0) Average BMI: G2 (Reference) Average BMI: G3 = 1.0 (0.6-1.9) High BMI: G1 = 1.6 (0.7-3.5) High BMI: G2 = 1.1 (0.6-2.1) High BMI: G3 = 0.1 (0.03-0.6) |
Age, race, parity, marital status, education, smoking |
|
Adequacy of weight gain in the third trimester was predictive of preterm birth—the data suggested a threshold effect for all weight status groups with a marked decrease in risk at 90-110% of the IOM recommendation With the rate of weight gain less than 60% of the IOM value, women in all four groups had more than double the risk of delivering preterm, which was statistically significant for all but the obese category. Excessive rate of weight gain was signficantly associated with a preterm birth only for women of normal prepregnancy weight status at a value greater than 200% of the IOM value |
Pregravid BMI, gestational age |
|
Author, Year Country, Setting Sample Size Baseline BMI Quality |
Pregravid Weight (How Measured) Total Weight Gain (How Measured) |
Definition of Groups |
|
Stotland et al., 200685 |
Pregravid weight: Self-reported |
G1: low rate of weight gain < .27 kg/wk G2: ref 0.27-0.52 kg/wk G3: high rate of weight gain > 0.52 kg/wk |
|
USA, academic medical center |
||
|
Total weight gain: prenatal records |
||
|
15,101 |
||
|
Underweight BMI < 19.8 and normal weight BMI 19.8-26 |
||
|
Fair |
||
|
Af Am, African American; AOR, adjusted odds ratio; BMI, body mass index; CI, confidence interval; DOB, date of birth; G, group; IOM, Institute of Medicine; kg/wk, kilograms per week; OR, odds ratio; PTB, pre-term birth; USA, United States of America; wk, week; wt, weight. |
||
preterm birth was U-shaped. The lowest risk of preterm birth was observed for all women with weight gain ratios between 1.10 and 1.40.
Results on rate of weight gain for all women In the two studies that examined rate of weight gain among women in all BMI groupings,22,152 the U.S. study described above found that inadequate or excessive weight gain in the first or second trimester using the IOM definitions was not associated with preterm birth.22 By contrast, adequacy in the third trimester was predictive of risk of preterm birth; ratios of observed/expected between .90 and 1.10 were associated with decreased risk. A ratio of < 0.60 was significantly associated with a doubling of the risk of preterm birth for women of all but the obese weight groups. Among normal-weight women, a ratio > 2.0 was significantly associated with a preterm birth.
The other study was conducted in a nationally represented sample of all singleton live births in the United States from 1988.152 This study used common definitions of rate of weight gain (mapping to IOM categories for underweight women): low (< 0.5 lb/week), average (0.5 to 1.5 lb/week), and high > 1.5 lb/week) for all BMI groups. The authors calculated rate of weight gain in a regression model using measured prenatal weights from 14 to 28 weeks of gestation. Among women of normal weight, low weight gain was statistically significantly associated with an increased risk (ap-
|
Results |
Confounders and Effect Modifiers Included in Analysis |
|
Crude OR of spontaneous preterm birth G1:2.6 (95% CI 2.1-3.2) G3:1.0 (95% CI 0.8-1.2) |
Age, race, parity, pregravid BMI, history of previous PTB, year of delivery, number of days between last weighing and DOB, smoking |
|
AOR of spontaneous preterm birth G1: 2.5 (95% CI 2.0-3.1) G3:1.0 (95% CI 0.8-1.3) No differences in results by parity combined with history of preterm birth |
|
|
Slightly higher risks for Af Am and high wt gain close to sign for Af Am |
proximately fourfold) of preterm delivery compared with women in this same category who had average weight gain. This finding held true when medically indicated preterm deliveries were excluded, when women with pregnancy complications were excluded, and when models were adjusted for confounders listed in Table 31. Among underweight women, a low rate of weight gain was statistically significantly associated with the risk of pre-term birth when the same exclusions and model adjustments were made. In models with these same exclusions and adjustments, however, for women with a BMI ≤ 26, high weight gain was not associated with significant changes in the risk of preterm birth and for women with a BMI > 26, high weight gain was associated with lower risk of preterm birth.
Detailed results on rate of weight gain for normal or underweight women Two studies examined the effect of rate of weight gain on spontaneous preterm birth among only underweight and normal-weight women.85,151 In one U.S. study, the authors calculated the rate of weight gain over the entire pregnancy using weight at time of delivery minus self-reported pregravid weight divided by gestational age at delivery (minus 2 weeks because gestational age was based on last menstrual period).85 Low rate of weight gain during pregnancy, defined as < 0.27 kg per week, was statistically significantly associated with spontaneous preterm birth in both
crude and adjusted analyses. High rate of weight gain, defined as > 0.52 kg per week, was not associated with risk of preterm birth. These findings were similar when the models were stratified by ethnicity, parity, and history of preterm birth, and adjusted for the confounders listed.
In another U.S. study, total weight gain in the first trimester was defined as measured weight at 10 to 13 weeks minus self-reported pregravid weight; second and third trimester rates of weight gain were based on measured weights during the trimester.151 Low weight gain in the first or second trimester alone was not associated with spontaneous preterm birth. By contrast, low third-trimester weight gain was statistically significantly associated with spontaneous preterm birth. The combination of low second-and third-trimester rate of weight gain was also statistically significantly associated with spontaneous preterm birth. All analyses controlled for several confounders listed in Table 31.
Birthweight
Study characteristics Ten studies from nine databases examined the association between weight gain defined by IOM guidelines and birthweight (Evidence Table 41, Table 32).20,54,60,104,153-158 Three studies were done in only black women;60,153,154 two stratified by race;20,155,156 two were done in adolescents;153,154 one came from a cohort of 233 women enrolled in the WIC program in Iowa;157 and one used a perinatal database from a medical center in New York.54
Overview of results Overall, these studies (1 good,153 8 fair,20,60,104,154-157 and 1 poor54) support an association between weight gains less than the IOM guidelines and lower birthweight; such an association appears to be stronger when the rate of weight gain is the relevant factor. There is also evidence of an association for gains above the guidelines and higher birthweight but less so when rate of weight gain is the relevant factor.
Detailed results for total weight gain Seven articles examined total weight gain; one was good,153 one was poor quality,54 and the remainder were fair.20,60,104,156,157 The study of women in the WIC program found that weight gains both below and above the IOM guidelines were associated with lower birthweights (162 g and 153 g, respectively).157 One study found that women who were underweight or normal weight and who gained above the IOM guidelines had higher birthweights; women who gained below the guidelines had lower birthweights than those who gained within them.104 The association of higher birthweight with higher weight gain was also found among morbidly obese women in one poor study that failed to adjust for any confounders.54
Studies that stratified by race20,156 or that included only one race60,153
found, overall, that black women gaining above the IOM guidelines experienced significantly higher birthweights (a range of 73 g to 330 g) than those who gained less weight.20,60,153,156 Among white women,20,156 weight gain above the IOM guidelines was also associated with higher birthweights for those with a BMI ≤ 2920,156 but not > 29 in one study.156 This increase in birthweight was close to 200 g.20,156 In three of these studies,20,153,156 the analyses were adjusted for multiple confounders listed in Table 32.
One good study conducted among black adolescents that examined total weight gain found infant birthweights to be lower among those who gained less than the IOM recommendations than among those who gained within or above the guidelines;153 infant birthweights did not differ between those who gained within and those who gained above the thresholds.
Detailed results for rate of weight gain Three fair-quality studies examined rate of weight gain as the exposure of interest with respect to birthweight.154,155,158 The one including only adolescents found that mothers who gained < 0.23 kg per week had infants with a mean birthweight of 2,745 g; this birthweight was lower than for infants of mothers who gained 0.23 to 0.4 kg per week (3,097 g) and for those who gained > 0.4 kg per week (3,351 g).154
One study examined rate of weight gain only among normal-weight women from the ages of 12 to 29 from black, white, and Hispanic groups.158 The authors used a rate of weight gain between 20 to 36 weeks and defined low as < 0.34 kg per week, moderate as 0.34 to 0.68 kg per week, and excessive as > 0.68 kg per week. Controlling for several confounders, the investigators found that women with low rates of weight gain had infants of statistically significantly lower birthweights than did women with higher rates of weight gain. Birthweights did not differ between those who gained at excessive and moderate rates.
The other rate of weight gain study involved both white and black women with a BMI ≤ 26 and a mean age of 25.155 Their analyses used mothers who gained more than the IOM guidelines as the reference group. Mothers who gained low levels of weight (< 0.38 kg per week for underweight or < 0.37 kg per week for normal weight) in the second trimester had infants who weighed 166 g less than infants from the reference group; mothers who gained low levels of weight in the third trimester had infants who weighed 111 g less than those in the reference group. When all women were included in the analyses, the effect seen in the third trimester was statistically significant; however, when analyses were stratified by race, it was significant only for white women.
In addition, this study showed that pattern of weight gain was important. Low total weight gain in the first trimester combined with low rate of gain in the second was associated with an infant who weighed 236 g less
TABLE 32. Weight Change Relative to IOM Thresholds and Birthweight
|
Author, Year Country, Setting Sample Size Baseline BMI Quality |
Pregravid Weight (How Measured) Total Weight Gain (How Measured) |
Definition of Groups |
|
Nielsen, 2006153 |
Pregravid weight: Self-reported |
G1: < IOM G2: lower half IOM range G3: Upper half IOM range G4: > IOM |
|
USA, prenatal clinics |
||
|
Total weight gain: Prenatal records, measured |
||
|
African-Americans only |
||
|
815 |
||
|
All weight/BMIs |
||
|
Good |
||
|
Hickey et al., 199720 |
Pregravid weight: Self-reported |
G1: Below IOM range G2: Lower end of IOM range G3: Upper end of IOM range G4: Gain above IOM range |
|
USA, public health programs |
||
|
Total weight gain: Measured weights-prenatal records |
||
|
5,198 |
||
|
All wt/BMI (using IOM definitions) |
||
|
Fair |
||
|
Hickey et al., 1996155 |
Pregravid BMI: Self-reported |
G1: First trimester < 2.6 kg for underwt (BMI < 19.8) & < 1.6 kg for normal wt (BMI 19.8-26) |
|
USA, prenatal clinics |
||
|
Total weight gain: Prenatal records |
||
|
415 |
||
|
Under & Normal weight |
G2: Second trimester < 0.38 kg/wk for underwt & < 0.37 kg/wk for normal wt |
|
|
Fair |
||
|
G3: < 0.38 kg/wk for underwt & < 0.37 kg/wk for normal wt |
|
Results |
|
|
Confounders and Effect Modifiers Included in Analysis |
|
Adjusted birthweight BMI < 19.8 G1: 2,986 g G2: 3,167 g G3: 3,198 g G4: 3,277 g All significantly different from each other except G2 & G3 |
|
|
Parity, pregravid BMI, preeclampsia, time between last weight measure and delivery, height, smoking, infant sex |
|
BMI 19.8-26 G1: 3,018 g G2: 3,166 g G3: 3,255 g G4: 3,318 g All significantly different from each other |
BMI > 26 G1: 3,127 g G2: 3,351 g G3: 3,384 g G4: 3,434 g G1 significantly different from the others, G2,G3 & G4 not significantly different from each other |
||
|
BMI < 19.8 G1: Black: 2,840 White: 3,002 |
BMI 19.8-26.0 G1: Black: 3,052 White: 3,176 |
BMI > 26.0 G1: Black: 3,126 White: 3,385 |
Age, education, height, street drugs, alcohol use, time between last prenatal weight observation and delivery, smoking, gestational age, infant sex |
|
G2: Black: 2,995 White: 3,151 |
G2: Black: 3,105 White: 3,199 |
G2: Black: 3,192 White: 3,376 |
|
|
G3: Black: 3,017 White: 3,200 |
G3: Black: 3,180 White: 3,307 |
G3: Black: 3,312 White: 3,402 |
|
|
G4: Black: 3,163 White: 3,353 |
G4: Black: 3,228 White: 3,389 |
G4: Black: 3,300 White: 3,504 |
|
|
Association of low trimester gain with birthwt G1: all women –18 g P = .65 Black –15 g P = .76 White –42 g P = .53 |
No association with low weight gain in only the first or second trimester. G3: All –164 g P = .01 Black –80 g P = .38 White –300 g P = .005 |
G1 & G3: No significant diff |
Age, race, pregravid BMI, height, alcohol use, third trimester number of weeks between last weight observation and delivery, history of previous infant < 2,750 g, smoking, gestational age, infant sex |
|
G2 & G3: All –206 g P = .01 Black –178 g P = .08 White −268 g P = .06 |
|||
|
G1, G2 & G3: All –284 g P = .002 Black –252 g P = .03 White –379 g P = .008 |
|||
|
G2: All women –166g P = < .001 Black –164 g P = .005 White –158 g P = .05 |
|||
|
Association with low weight gain during more than one trimester |
|||
|
G3: All women –111g P = .008 Black –77 g P = .14 White –194 g P = .004 |
|||
|
G1 & G2: All –236 g P = .01 Black –265 g P = .04 White –169 g P = .25 |
|
Author, Year Country, Setting Sample Size Baseline BMI Quality |
Pregravid Weight (How Measured) Total Weight Gain (How Measured) |
Definition of Groups |
|
Hickey et al., 1993156 |
Pregravid BMI: Self-reported |
BMI ≤ 29 G1: gain < range G2: gain in the range G3: gain > range |
|
USA, prenatal clinics |
||
|
Total weight gain: Prenatal records |
||
|
1,168 |
||
|
All weight/BMIs |
BMI > 29 G4: gain < 6.0 kg G5: gain > 6.0 kg |
|
|
Fair |
||
|
Luke et al., 1996104 |
Pregravid weight: Self-reported |
G1: Gain < IOM G2: gain equal to IOM G3: gain > IOM |
|
USA, clinic |
||
|
Total weight gain: Prenatal records, measured |
||
|
487 |
||
|
All weight/BMIs |
||
|
Fair |
||
|
May, 2007157 |
Pregravid weight: Self reported |
G1: Below IOM G2: Greater IOM |
|
USA, WIC clinic |
||
|
Total gestational weight gain: Self-reported |
||
|
233 |
||
|
All weight/BMI |
||
|
Fair |
||
|
Ogunyemi et al., 199860 |
Pregravid weight: Self-reported |
G1: Low < IOM G2: Normal = IOM G3: High > IOM |
|
USA, Hospital |
||
|
Total gestational weight gain: Prenatal records, measured |
||
|
582 |
||
|
All weight/BMIs (using IOM definitions) |
||
|
Fair |
|
Results |
|
Confounders and Effect Modifiers Included in Analysis |
|
Adjusted Birthwt BMI ≤ 29 G1: Black: 3,027 White: 3,246 |
|
Maternal height, education, parity, marital status, smoking, alcohol use, hypertension, GDM, gestational age at delivery, socioeconomic status, time between last weight and delivery |
|
BMI > 29 G4: Black: 3,214 White: 3,500 |
||
|
G2: Black: 3,177 White: 3,233 |
G5: Black: 3,553 White: 3,596 |
|
|
G3: Black: 3,293 White: 3,523 |
|
|
|
Adjusted birthweight G1: BMI < 19.8 2,873 g* BMI 19.8-26.0 3,157 g* BMI > 26 3,138 g |
|
Maternal age, parity, black ethnicity, smoking, gestational duration, fetal sex |
|
G2: BMI < 19.8 3,190 g BMI 19.8-26 3,298 g BMI > 26 3,338 g |
|
|
|
G3: BMI < 19.8 3,489 g* BMI 19.8-26 3,494 g* BMI > 26 3,347 g |
|
|
|
* significantly different from gains within range within each BMI grouping |
||
|
Betas from multiple linear regression G1: –162 g G2: –153 g |
Maternal BMI, smoking, gestational age at delivery |
|
|
Birthweight G1: 3,029 G2: 3,210 G3: 3,283 (P < 0.01) |
|
NR |
|
Author, Year Country, Setting Sample Size Baseline BMI Quality |
Pregravid Weight (How Measured) Total Weight Gain (How Measured) |
Definition of Groups |
|
Scholl et al., 1995158 |
Pregravid weight: Self-reported |
Rate between 20-36 wks G1: low rate < 0.34 kg/wk G2: moderate rate 0.34-0.68 kg/wk G3: Excessive rate > 0.68 kg/wk |
|
USA Camden Study |
||
|
Total weight gain: Prenatal records, measured |
||
|
274 |
||
|
Normal weight BMI 19.8-26 |
||
|
air |
||
|
Stevens-Simon and McAnarney, 1992154 |
Pregravid weight: Self-reported |
|
|
G1: slow < 0.23 kg/wk G2: average 0.23-4 kg/wk G3: rapid > 0.4 kg/wk |
||
|
USA African-American adolescent maternity program |
Total weight gain: Prenatal records, measured |
|
|
141 |
||
|
All BMI |
||
|
Fair |
||
|
Bianco et al., 199854 |
Pregravid weight: Self-report |
Maternal weight gain categories among morbidly obese : G1: Weight loss/no change G2: 1-15 lbs G3: 16-25 lbs G4: 26-35 lbs G5: > 35 lbs |
|
USA, medical center |
||
|
Total weight gain: Measured |
||
|
11,926 |
||
|
Nonobese (BMI 19-27) and morbidly obese (BMI > 35) |
||
|
Poor |
||
|
&, and; AOR, adjusted odds ratio; birthwt, birthweight; BMI, body mass index; g, gram; G, group; GDM, gestational diabetes mellitus; IOM, Institute of Medicine; kg/wk, kilogram per week; NR, not/none reported; OR, odds ratio; underwt, underweight; USA, United States of America; WIC, The Special Supplemental Nutrition Program for Women, Infants, and Children. |
||
than those whose mothers gained more weight. This finding appeared to be statistically significant for all women and for black women when analyses were stratified by race. Low rate of weight gain in the second and third trimesters was associated with a 206 g deficit in weight of the infant. Low rate of weight gain in all three trimesters was associated with the greatest deficit, 284 g.
|
Results |
Confounders and Effect Modifiers Included in Analysis |
|
Birthweight (g): G1: 3,049 (56.94) P < 0.05, low vs. moderate plus excessive weight gain G2: 3,208 (36.33) G3: 3,191 (49.46) |
NR |
|
Birthweight (g): G1: 2,745 (694) G2: 3,097 (457) G3: 3,351 (482) P < 0.0001 No difference in pregravid by weight gain groups |
NR |
|
G1: 3,302 g G2: 3,192 g G3: 3,337 g G4: 3,506 g G5: 3,453 g P = < 0.05 |
NR |
Low birthweight
Study characteristics Twelve articles (from 10 databases) examined low birthweight (LBW, defined as < 2,500 g) (Evidence Table 42, Table 33).2,20,54,55,60,127,154,159-163 Two articles reported on data from the Pregnancy Nutrition Surveillance System (PNSS) from either eight2 or nine states;160 two used a single hospital database.55,159 Two studies used PRAMS data.162,163
TABLE 33. Weight Change Relative to IOM Thresholds and Low Birthweight (< 2,500 g)
|
Author, Year Country, Setting Sample Size Baseline BMI Quality |
Pregravid Weight (How Measured) Total Weight Gain (How Measured) |
Definition of Groups |
|
Hellerstedt et al., 1997159 |
Pregravid weight: Self-report |
Maternal weight gain categories stratified by pregravid BMI and smoking status: |
|
USA, hospital |
||
|
Total weight gain: Measured |
||
|
1,343 |
||
|
Normal/obese BMI |
Obese (BMI > 29.0): G1: Smokers, < IOM G2: Smokers, within IOM G3: Smokers, > IOM |
|
|
Good |
G4: Nonsmokers, < IOM G5: Nonsmokers, within IOM G6: Nonsmokers, > IOM |
|
|
Normal weight (BMI 19.8-26.0): G7: Smokers, < IOM G8: Smokers, within IOM G9: Smokers, > IOM |
||
|
G10: Nonsmokers, < IOM G11: Nonsmokers, within IOM G12: Nonsmokers, > IOM |
||
|
Obese: G13: Lost/no gain G14: 0.5-6.5 kg G15: 7-11.5 kg G16: 12-16 kg G17: > 16 kg |
||
|
Normal weight: G18: < 11.5 kg G19: 11.5-16 kg G20: > 16 kg |
|
Results |
Confounders and Effect Modifiers Included in Analysis |
|
G1: 17.3% G2: 10.0% G3: 12.3% |
Maternal age, pregravid BMI, infant sex, race, parity, prenatal alcohol use, prenatal illicit drug use, adequacy of prenatal care, gestational hypertension, GDM, gestational age |
|
G4: 10.5% G5: 7.8% G6: 2.6% |
|
|
G7: 17.5% G8: 3.5% G9: 3.6% |
|
|
G10: 12.4% G11: 6.0% G12: 5.3% |
|
|
G13: 16.0% G14: 11.1% G15: 8.3% G16: 4.0% G17: 6.0% P = 0.003 for G13-G17 |
|
|
G18: 14.2% G19: 5.4% G20: 4.9% P = 0.001 for G18-G20 |
|
|
For obese women, compared to nonsmokers who gained 7-11.5 kg, smokers who gained < 7 kg were at significantly higher risk of LBW: AOR: 7.7 (95% CI, 1.5-40.0) |
|
Author, Year Country, Setting Sample Size Baseline BMI Quality |
Pregravid Weight (How Measured) Total Weight Gain (How Measured) |
Definition of Groups |
|
Schieve et al., 1998160 |
Pregravid weight: Self-report |
Maternal weight gain categories stratified by pregravid BMI (IOM underweight, normal weight, overweight, and obese) and race (non-Hispanic white, non-Hispanic black, and Hispanic) |
|
USA, Pregnancy Nutrition Surveillance System (WIC clinics) |
||
|
Total weight gain: Self report |
||
|
173,006 |
||
|
All weight/BMI |
||
|
Good |
||
|
G1: ≥ 10 lbs below IOM G2: 1-9 lbs below IOM G3: Lower half of IOM G4: Upper half of IOM G5: 1-9 lbs above IOM G6: ≥ 10 lbs above IOM |
||
|
Bracero and Byrne, 1998127 |
Pregravid weight: Self-report |
Maternal weight gain categories: |
|
USA, hospital, Brooklyn, NY |
||
|
Total weight gain: Measured |
G1: Maternal weight gain under the IOM guidelines G2: Maternal weight gain within the IOM guidelines G3: Maternal weight gain over the IOM guidelines G4: Optimal weight gain (36-40 lbs for BMI < 19.8; 31-40 lbs for BMI 19.8-26.0; 26-30 lbs for BMI > 26.0) G5: Suboptimal weight gain (< 36 lbs for BMI < 19.8; < 31 lbs for BMI 19.8-26.0; < 26 lbs for BMI > 26.0) |
|
|
20,971 |
||
|
All weight/BMI |
||
|
Fair |
|
Results |
Confounders and Effect Modifiers Included in Analysis |
|
Within every BMI-race ethnicity stratum, the odds of delivering a LBW infant tended to decrease as weight gain increased. This trend was statistically significant for all strata; however, the trend diminished with increasing BMI. Women with underweight and normal weight BMI in G2 were 1.1-2.8 times more likely to deliver a LBW infant than women in G3; women in G1 were 1.8-3.2 times more likely to deliver a LBW infant compared to G3. |
Age, height, education, trimester of the special supplemental nutrition program for WIC |
|
G1: 10.1% G2: 3.3% G3: 2.5% (P < 0.001 comparing G1-G3) G4: 4.9% G5: 1.8% (P < 0.001 vs. G4) |
Not applicable |
|
Author, Year Country, Setting Sample Size Baseline BMI Quality |
Pregravid Weight (How Measured) Total Weight Gain (How Measured) |
Definition of Groups |
|
Cogswell et al., 19952 |
Pregravid weight: Self-report |
Maternal weight gain categories (lbs) stratified by pregravid BMI: |
|
USA, Pregnancy Nutrition Surveillance System |
||
|
Total weight gain: Self-report |
||
|
53,541 |
Normal weight (BMI 19.8-26.0): G1: < 15 G2: 15-19 G3: 20-24 G4: 25-29 G5: 30-34 G6: 35-39 G7: ≥ 40 |
|
|
Normal/Overweight/Obese |
||
|
Fair |
||
|
Overweight (BMI > 26.0-29.0): G8: < 15 G9: 15-19 G10: 20-24 G11: 25-29 G12: 30-34 G13: 35-39 G14: ≥ 40 |
||
|
Obese (BMI > 29.0): G15: < 15 G16: 15-19 G17: 20-24 G18: 25-29 G19: 30-34 G20: 35-39 G21: ≥ 40 |
|
Results |
Confounders and Effect Modifiers Included in Analysis |
|
AOR (95% CI) for low birthweight: G1: 2.1 (1.6-2.6) G2: 1.4 (1.1-1.8) G3: 1.0 (0.8-1.3) G4: 1.0 (reference) G5: 0.8 (0.6-1.0) G6: 0.6 (0.5-0.8) G7: 0.5 (0.4-0.6) |
Age, race, height, smoking, gestational age, infant sex |
|
G8: 1.1 (0.7-1.9) G9: 1.0 (reference) G10: 0.7 (0.4-1.2) G11: 0.8 (0.5-1.4) G12: 0.5 (0.3-0.8) G13: 0.6 (0.3-1.1) G14: 0.4 (0.3-0.7) G15: 1.5 (0.9-2.4) G16: 1.0 (reference) G17: 0.9 (0.5-1.6) G18: 1.3 (0.8-2.3) G19: 0.9 (0.5-1.7) G20: 1.0 (0.5-1.8) G21: 0.9 (0.5-1.5) |
|
Author, Year Country, Setting Sample Size Baseline BMI Quality |
Pregravid Weight (How Measured) Total Weight Gain (How Measured) |
Definition of Groups |
|
Edwards et al., 199655 |
Pregravid weight: Self-report |
Maternal weight gain categories (kg) |
|
USA, Hospital |
||
|
Total weight gain: Measured |
Obese BMI > 29: G1: Lost weight/no change G2: 0.5-6.5 G3: 7-11.5 G4: 12-16 G5: > 16 Normal BMI 19.8-26: G6: < 11.5 kg G7: 11.5-16 G8: > 16 kg |
|
|
1,443 |
||
|
Normal/Obese weight/BMI |
||
|
Fair |
||
|
Hickey et al., 199720 |
Pregravid weight: Self-report |
Maternal weight gain categories stratified by race: |
|
USA, public health programs |
||
|
Total weight gain: Measured |
Black Women: G1: Below range (< 12.5 kg for BMI < 19.8; < 13.9 kg for BMI 19.8-26.0; < 7.0 kg for BMI > 26.0) G2: In lower range (12.5-15.2 kg for BMI < 19.8; 11.5-13.8 kg for BMI 19.8-26.0; 7.0-9.2 kg for BMI > 26.0) G3: In upper range (15.3-18 kg for BMI < 19.8; 13.9-16.0 kg for BMI 19.8-26.0; 9.3-11.5 kg for BMI > 26.0) G4: Above range (> 18 kg for BMI < 19.8; > 16.0 kg for BMI 19.8-26.0; > 11.5 kg for BMI > 26.0) |
|
|
5,198 |
||
|
All weight/BMI |
||
|
Fair |
||
|
White Women: G5: Below range G6: In lower range G7: In upper range G8: Above range |
|
Results |
Confounders and Effect Modifiers Included in Analysis |
|
G1:12.8% G2: 8.9% G3: 7.9% G4: 6.8% G5: 8.7% P (for G1-G5) = 0.405 |
Age, parity, pregravid BMI, GDM, pregnancy-induced hypertension, prenatal adequacy, alcohol use, drug use, smoking, gestational age |
|
G6: 8.5% G7: 5.6% G8: 8.9% P (for G6-G8) = 0.183 |
|
|
AOR (95% CI) for birthweight < 2,500 g among obese women (BMI > 29.0): G3: 1.0 (reference) G1: 4.2 (0.9-19.6) |
|
|
AOR (95% CI) G1: 2.6 (1.2-5.6) G2: 1.0 (reference) G3: 1.2 (0.4-3.3) G4: 1.4 (0.6-3.6) G5: 1.5 (0.8-2.6) G6: 1.0 (reference) G7: 0.4 (0.2-0.9) G8: 0.7 (0.3-1.2) |
Age, education, height, drug use, alcohol use, time between last prenatal weight observation and delivery, smoking, gestational age, infant sex |
|
Author, Year Country, Setting Sample Size Baseline BMI Quality |
Pregravid Weight (How Measured) Total Weight Gain (How Measured) |
Definition of Groups |
|
Ogunyemi et al., 199960 |
Pregravid weight: Self-report |
Maternal weight gain categories: |
|
USA, Hospital |
||
|
Total weight gain: Measured |
G1: < IOM G2: Within IOM G3: > IOM |
|
|
582 |
||
|
All weight/BMI |
||
|
Fair |
BMI IOM |
|
|
Stevens-Simon and McAnarney, 1992154 |
Pregravid weight: Self-report |
Maternal weight gain categories (kg/wk): |
|
USA, adolescent maternity program |
Total weight gain: Measured |
G1: < 0.23 G2: 0.23-0.40 G3: > 0.40 |
|
141 |
||
|
Fair |
||
|
Strauss and Dietz, 1999161 |
Pregravid weight: Self-report |
Maternal weight gain categories stratified by pregravid BMI: |
|
USA, National Collaborative Perinatal Project and the Child Health and Development Study |
||
|
Total weight gain: Measured |
||
|
BMI < 20.0: G1: Low 1st trimester gain (< 0.1kg/wk) G2: Low 2nd trimester gain (< 0.3kg/wk) G3: Low 3rd trimester gain (< 0.3kg/wk) |
||
|
10,756 |
||
|
All weight/BMI |
||
|
Fair |
||
|
BMI 20.0-25.0: G4: Low 1st trimester gain G5: Low 2nd trimester gain G6: Low 3rd trimester gain |
||
|
BMI > 25.0: G7: Low 1st trimester gain G8: Low 2nd trimester gain G9: Low 3rd trimester gain |
|
Results |
Confounders and Effect Modifiers Included in Analysis |
|
AOR (95% CI) for very low birthweight: G1: 1.8 (0.6-4.7) G2: 1.1 (0.4-4.7) G3: 1.0 (Reference) |
Age, parity, pregravid BMI, preeclampsia, cesarean delivery, previous cesarean, tobacco use, previous fetal death, hypertension, asthma, previous LBW, vomiting, NICU Distribution of LBW, %: |
|
G1: 21.4 G2: 10.6 G3: 4.3 P = NS |
Not applicable |
|
AOR (95% CI) for < 2,500g: G1: 0.88 (0.50-1.57) G2: 2.68 (1.46-4.94) G3: 2.07 (1.22-3.51) G4: 1.31 (0.88-1.95) G5: 1.92 (1.29-2.87) G6: 2.12 (1.48-3.04) G7: 1.02 (0.50-2.08) G8: 1.88 (1.03-3.43) G9: 1.53 (0.86-2.74) |
Race, GDM, toxemia, smoking |
|
Reference group-normal rate of weight gain in the trimester |
|
Author, Year Country, Setting Sample Size Baseline BMI Quality |
Pregravid Weight (How Measured) Total Weight Gain (How Measured) |
Definition of Groups |
|
Bianco et al., 199854 |
Pregravid weight: Self-report |
Maternal weight gain categories among morbidly obese (BMI > 35): G1: Weight loss/no change G2: 1-15 lbs G3: 16-25 lbs G4: 26-35 lbs G5: > 35 lbs |
|
USA, medical center |
||
|
11,926 |
Total weight gain: Measured |
|
|
Nonobese (BMI 19-27) and morbidly obese (BMI > 35) |
||
|
Poor |
||
|
Hulsey et al., 2005162 |
Pregravid weight: Self-report |
Pregravid BMI and gestational weight gain categories: |
|
USA, birth certificates linked to PRAMS data |
||
|
Total weight gain: Birth certificate |
G1: BMI < 19.8 and < IOM G2: BMI 19.8-26.0 and < IOM G3: BMI 19.8-26.0 and within IOM G4: BMI 26.1-29.0 and < IOM G5: BMI > 29.0 and < IOM G6: BMI > 29.0 and within IOM |
|
|
87,293 |
||
|
All weight/BMI |
||
|
Poor |
||
|
Nida et al., 1996163 |
Pregravid weight: Self-report |
G1: < IOM G2: within IOM G3: > IOM |
|
USA PRAMS |
||
|
No sample size |
Total weight gain: Self-report |
|
|
All weight/BMI |
||
|
Poor |
||
|
AOR, adjusted odds ratio; BMI, body mass index; CI, confidence interval; g, gram; G, group; GDM, gestational diabetes; IOM, Institute of Medicine; kg, kilogram; lbs, pounds; LBW, low birthweight; MLBW, moderately low birthweight; NICU, neonatal intensive care unit; USA, United States of America; VLWB, very low birthweight; WIC, The Special Supplemental Nutrition Program for Women, Infants, and Children. |
||
|
Results |
Confounders and Effect Modifiers Included in Analysis |
|
Distribution of LBW,%: G1: 2.0 G2: 11.1 G3: 8.3 G4: 5.2 G5: 3.8 P = NS |
Race, parity, clinic service, substance abuse, preexisting medical condition |
|
AOR (95% CI) for very low birthweight (500-1,499g): G1: 2.06 (1.26-2.87) G2: 1.82 (1.22-2.29) G3: 1.00 (reference) G4: 2.05 (0.90-4.44) G5: 1.25 (0.61-1.61) G6: 1.74 (1.23-2.42) |
Ethnicity, intendedness of pregnancy, Medicaid status, WIC status, prenatal care, diabetes, hypertension |
|
AOR (95% CI) for moderately low birthweight (1500-2499 g): G1: 4.83 (2.98-7.83) G2: 1.77 (1.23-2.60) G3: 1.00 (reference) G4: 0.28 (0.11-1.83) G5: 1.09 (0.67-2.13) |
|
|
BMI < 19.8 G1: 10.2% G2: 6% G3: 4.7 |
Pregravid BMI |
|
BMI 19.8-25 G1: 8.4% G2: 3.9% G3: 4.5% |
|
|
BMI > 26 G1: 6.1% G2: 3.8% G3: 5.1% No statistical testing was performed |
Overview of results Evidence from twelve articles (2 good,159,160 7 fair,2,20,55,60,77,127,154,161 and 3 poor54,162,163) supports an association between weight gain less than the IOM guidelines and LBW for both underweight and normal-weight women; evidence is less conclusive about any association for women with higher body weight.
Detailed results for total weight gain In the nine-state PNSS study,160 analyses for normal and overweight women stratified by race showed a statistically significant decreased risk of LBW with higher gains. Among underweight women, a protective effect against LBW was seen with higher gains in whites and Hispanic and an increased risk was associated with low weight gains (> 10 lbs < IOM threshold) across all the race groups. Similarly, among obese women of all race groups, low weight gains (> 10 pounds below the IOM threshold) were associated with higher risk of LBW.160
In the eight-state PNNS study,2 for women of normal weight, the odds for LBW were elevated and statistically significant when their weight gains were below 19 pounds compared with women whose weight gains were in the recommended range. For overweight and obese women, weight gains below the IOM guidelines were not associated with LBW infants. This was also shown in the study by Edwards et al.55
Weight gains above the IOM guidelines starting at > 35 pounds were protective against having a LBW infant for normal-weight women,2 and starting at ≥ 40 pounds for overweight women, but higher weight gains were not protective for obese women.
Two studies showed almost double the odds of LBW among black women who delivered at term but had weight gain below the IOM range;20,60 this finding was statistically significant in only one (good) study.20 The OR among white women was 1.5 (not significant).20
The only association seen among obese women was among smokers who gained less than the IOM guidelines.159 These women had an eightfold increased risk of having an LBW infant compared with obese nonsmokers who gained adequately.159
One study performed bivariate analysis between the IOM categories of weight gain and LBW infants.127 It demonstrated a statistically higher prevalence of LBW among mothers who gained less than the IOM guidelines than among mothers who gained within or more than the guidelines.
Detailed results for rate of weight gain Two studies examined the effect of the rate of weight gain on LBW.154,161 One among black adolescents found no differences in the prevalence of LBW by rate-of-weight-gain group.154 The other included only term births, used data from the National Collaborative Perinatal Project and the Child Health and Development Study, and examined total weight gain in the first trimester and rates in
the second and third trimesters.161 Low rate of weight gain in the second and third trimesters was associated with an increased risk of term LBW or intrauterine growth restriction (IUGR) in both data sets. This association held for all weight status groups except women with a BMI > 25 when the analysis was stratified by pregravid BMI and adjusted for multiple confounders.
Fetal growth (large for gestational age or macrosomia)
Study characteristics We identified 15 studies that examined the association between weight gain categorized according to the IOM guidelines on LGA4,25,54,116,118,129,154,159 or macrosomia2,53,55,110,160,164,165 (Evidence Tables 43 and 44, Table 34). Five studies used data from a hospital database;54,55,116,118,129,159 three were cohort studies.53,154,164 One study used data from a health maintenance organization;110 one used a prenatal clinic database;153 one used state birth certificate data;4,25 one used the Pregnancy Nutrition Surveillance System;2,160 and one used controls from a multicenter study of birth defects.165
Overview of results for LGA infant weight Eight studies defined LGA as > 90 percentile of birthweight for gestational age (Table 34).4,25,54,116,118,129,154,159 The majority of these studies, of which two were rated good,116,159 one poor54 and the remainder fair,4,25,118,129,154 showed a consistent association between weight gains above the IOM guidelines and LGA for women of all weight status groups. Four articles examined LGA defined as > 4,500 g;2,53,110,160 two were good quality,110,160 two were fair.2,53 They also showed a consistent association. When macrosomia or high birth-weight was the outcome, results were less consistent (1 poor quality,165 2 fair-rated studies55,164).
Detailed results for LGA infant weight One study reported the risk of LGA among women of all weight status groups129 and another among non-obese women (BMI < 30).118 In both studies, the risk for LGA was nearly doubled for women who gained above the IOM guidelines. For women who gained below the IOM guidelines, the risk for LGA was decreased by close to 40 percent.129
For women of normal pregravid weight, the odds of LGA estimated from an adjusted model found a nonsignificant increased risk of having an LGA infant.55 In another study, the risk was twofold higher and statistically significant for women gaining more than IOM recommendations.25 This same study found that the odds of LGA was decreased by more than 60 percent with gains below the IOM guidelines for normal-weight women.
Among obese women, the risk of LGA was 2.3 times greater for non-smokers gaining in excess of the IOM guidelines, but this was not true
TABLE 34. Weight Change Relative to IOM Thresholds and Large-for-Gestational-Age Infant Weight
|
Author, Year Country, Setting Sample Size Baseline BMI Quality |
Pregravid Weight (How Measured) Total Weight Gain (How Measured) |
Definition of Groups |
|
LGA as > 90th percentile of birthweight for gestational age |
||
|
Caulfield et al., 1998116 |
Pregravid weight: Self report |
G1: Underweight, BMI < 19.8 G2: Normal weight, BMI 19.8-26.0 G3: Overweight, BMI > 26.0 |
|
USA, university hospital |
Total weight gain: Measured |
|
|
Black women: G4: No weight gain < IOM G5: No weight gain > IOM |
||
|
3,870 |
||
|
All weight/BMI |
||
|
White women: G6: No weight gain < IOM G7: No weight gain > IOM |
||
|
Good |
||
|
Hellerstedt et al., 1997159 |
Pregravid weight: Self-report |
Maternal weight gain categories stratified by pregravid BMI and smoking status: |
|
USA, medical center |
Total weight gain: Measured |
Obese (BMI > 29.0): G1: Smokers, < IOM G2: Smokers, within IOM G3: Smokers, > IOM |
|
1,343 |
||
|
Normal/obese BMI |
||
|
Good |
G4: Nonsmokers, < IOM G5: Nonsmokers, within IOM G6: Nonsmokers, > IOM |
|
|
Normal weight (BMI 19.8-26.0): G7:Smokers, < IOM G8: Smokers within IOM G9:Smokers, > IOM |
||
|
G10: Nonsmokers < IOM G11: Nonsmokers, within IOM G12: Nonsmokers, > IOM |
||
|
Obese: G13: Lost/no gain G14: 0.5-6.5 kg G15: 7-11.5 kg G16: 12-16 kg G17: > 16 kg |
||
|
Normal weight: G18: < 11.5 kg G19: 11.5-16 kg G20: > 16 kg |
||
|
Results |
Confounders and Effect Modifiers Included in Analysis |
|
AOR (95% CI) for LGA and rate of weight gain (per 50 g/wk): G1: 1.25 (1.11-1.41) G2: 1.14 (1.08-1.20) G3: 1.13 (1.07-1.20) |
Age, race, parity, pregravid BMI, height, hypertension, provider type, smoking, female infant |
|
Expected absolute change (as % of baseline) in incidence of LGA associated with modifiable risk factor (G4-G7): G4: +1.28 (+26) G5: −0.77 (−16) G6: +2.58 (+17) G7: −2.87 (−19) |
|
|
Frequencies of LGA,%: G1: 5.3 G2: 10.0 G3: 12.3 G4: 12.2 G5: 11.7 G6: 22.2 G7: 0 G8: 1.8 G9: 9.1 G10: 4.4 G11: 8.1 G12: 14.3 |
Maternal age, pregravid BMI, infant sex, race, parity, prenatal alcohol use, prenatal illicit drug use, adequacy of prenatal care, gestational hypertension, GDM, gestational age |
|
G13: 9.3 G14: 10.5 G15: 11.3 G16: 17.5 G17: 21.8 P = 0.001 for G13-G17 |
|
|
G18: 2.8 G19: 6.7 G20: 13.1 P < 0.001 for G18-G20 |
|
|
Compared with infants of obese nonsmokers who gained 7-11.5kg, the only group at significantly higher risk of LGA was non smokers who gained > 11.5kg: AOR: 2.3 (95% CI, 1.2-4.5) |
|
Author, Year Country, Setting Sample Size Baseline BMI Quality |
Pregravid Weight (How Measured) Total Weight Gain (How Measured) |
Definition of Groups |
|
Devader et al., 200725 |
Pregravid weight: Self-report |
Maternal weight gain categories: G1: < 25 lbs G2: 25-35 lbs G3: > 35 lbs |
|
USA, birth certificate data |
Total weight gain: Measured |
|
|
94,696 |
||
|
Normal weight/BMI 19.8-26 |
||
|
Fair |
||
|
Kiel et al., 20074 |
Pregravid weight: Self-report |
Maternal weight gain categories stratified by prepregnancy obesity status, Obese Class I (BMI 30-34.9), Obese Class II (BMI 35-39.9), Obese Class III (> = BMI 40): G1: ≤ − 10 lbs G2: −2 to −9 lbs G3: No change G4: 2-9 lbs G5: 10-14 lbs G6: 15-25 lbs G7: 26-35 lbs G8: > 35 lbs |
|
USA, birth registry |
||
|
120,170 |
Total weight gain: Medical record |
|
|
Obese BMI > 30 |
||
|
Fair |
||
|
Parker and Abrams, 1992118 |
Pregravid weight: Self-report |
Maternal weight gain categories: G1: < IOM range G2: Within IOM range G3: > IOM |
|
USA, hospital |
Total weight gain: Measured |
|
|
USA, Hospital database (California) |
BMI IOM |
|
|
6,690 |
||
|
All weight/BMI |
||
|
Fair |
||
|
Stevens-Simon and McAnarney, 1992154 |
Pregravid weight: Self-report |
Maternal weight gain categories (kg/wk): G1: < 0.23 G2: 0.23-0.40 G3: > 0.40 |
|
Total weight gain: Measured |
||
|
USA, adolescent maternity program |
||
|
141 |
||
|
Fair |
|
Results |
Confounders and Effect Modifiers Included in Analysis |
|
AOR (95% CI) for LGA: G1: 0.40 (0.37-0.44) G2: 1.00 (reference) G3: 2.43 (2.30-2.56) |
Age, race, education, income, alcohol use, height, prior pregnancy, inadequate prenatal care use, smoking, child’s gender, birth year |
|
For Obese Class I: OR (95% CI) for LGA were significantly lower (< 1.00, G6 was reference) for G1-G5 and significantly higher for G7-G8. |
Age, race, parity, education, poverty (enrollment in Medicaid, WIC, food stamp programs), tobacco use, chronic hypertension |
|
For Obese Class II: OR (95% CI) for LGA were significantly lower (< 1.00, G6 was reference) for G1-G5 and significantly higher for G7-G8. |
|
|
For Obese Class III:OR (95% CI) for LGA were significantly lower (< 1.00, G6 was reference) for G1-G4 and significantly higher for G7-G8 |
|
|
AOR (95% CI) for LGA: G3: 1.92 (1.52-2.43) G2: 1.00 (reference) |
Age, race, parity, pregravid BMI, height, maternal high and low weight gain, smoking, gestational age, birthweight |
|
Incidence of LGA in nonobese women,%: G1: 3.25 G2: 6.14 G3: 13.11 |
|
|
Incidence of LGA in obese women,%: G1: 5.88 G2: 17.53 |
|
|
Distribution of LGA,%: G1: 3.6 G2: 4.5 G3: 12.8 P = NS |
NA |
|
Author, Year Country, Setting Sample Size Baseline BMI Quality |
Pregravid Weight (How Measured) Total Weight Gain (How Measured) |
Definition of Groups |
|
Stotland et al., 2006129 |
Pregravid weight: Self-report |
Maternal weight gain categories: G1: < IOM G2: Within IOM G3: > IOM G4: weight gain < 7kg G5: weight gain > 18kg |
|
USA, university hospital |
Total weight gain: Prenatal record |
|
|
20,465 |
||
|
All weight/BMI |
BMI IOM |
|
|
Fair |
||
|
Bianco et al., 199854 |
Pregravid weight: Self-report |
Maternal weight gain categories among morbidly obese (BMI > 35): G1: Weight loss/no change G2: 1-15 lbs G3: 16-25 lbs G4: 26-35 lbs G5: > 35 lbs |
|
USA, Medical Center |
||
|
Total weight gain: Measured |
||
|
11,926 |
||
|
Nonobese (BMI 19-27) and morbidly obese (BMI > 35) |
||
|
Poor |
||
|
LGA as birthweight > 4,500 gm 275 |
||
|
Hedderson et al., 2006110 |
Pregravid weight: Self-report |
Maternal weight gain categories: G1: < IOM G2: Within IOM G3: > IOM |
|
USA, Kaiser Permanente Medical Care Program |
Total weight gain: Measured |
|
|
BMI IOM |
||
|
45,245 |
||
|
All weight/BMI |
||
|
Good |
||
|
Results |
Confounders and Effect Modifiers Included in Analysis |
|
Unadjusted Rates of LGA: G1: 3.85 P < 0.001 vs. G2 G2: 6.62 G3:13.76 P < 0.001 vs. G2 G4: 5.26 G5: 14.60 P < 0.05 vs. G2 |
Age, race, parity, pregravid BMI, pregnancy-induced hypertension, date of delivery, mode of delivery, length of first and second stage of labor, smoking, gestational age, birthweight |
|
AOR (95% CI) for LGA: G1: 0.58 (0.47-0.72) G2: 1.00 (reference) G3: 1.98 (1.74-2.25) G4: 0.50 (0.33-0.78) G5: 2.28 (2.00-2.62) |
|
|
Distribution of LGA,%: G1: 12.0 G2: 11.8 G3: 18.8 G4: 25.8 G5: 23.8 P < 0.01 |
Race, parity, clinic service, substance abuse, preexisting medical condition |
|
% Distribution of maternal weight gain categories among women with macrosomia: G1: 4.0 G2: 16.3 G3: 79.7 P < 0.05 (compared to controls) |
Age, race, parity, pregravid BMI, screening glucose value from 1 hour after the 50g oral glucose challenge test, difference between age at delivery and gestational age at last weight measured |
|
AOR (95% CI) for macrosomia: G1: 0.38 (0.20-0.70) G2: 1.00 reference G3: 3.05 (2.19-4.26) |
|
|
OR (95% CI) for macrosomia: Underweight women (BMI < 19.8) G2: 1.00 (reference) G3: 2.70 (0.83-8.61) |
|
|
Normal weight women(BMI 19.8-26.0) G2: 1.00 (reference) G3: 3.60 (2.27-5.83) |
|
|
Overweight/obese women (BMI > 26.0) G2: 1.00 (reference) G3: 2.00 (1.14-3.47) |
|
Author, Year Country, Setting Sample Size Baseline BMI Quality |
Pregravid Weight (How Measured) Total Weight Gain (How Measured) |
Definition of Groups |
|
Schieve et al., 1998160 |
Pregravid weight: Self-report |
Maternal weight gain categories stratified by pregravid BMI (IOM-underweight, normal weight, overweight, and obese) and race (non-Hispanic white, non-Hispanic black, and Hispanic): |
|
USA Pregnancy Nutrition Surveillance System—data from WIC clinics |
Total weight gain: Self report |
|
|
G1: ≥ 10 lbs below IOM G2: 1-9 lbs below IOM G3: Lower half of IOM G4: Upper half of IOM G5: 1-9 lbs above IOM G6: ≥ 10 lbs above IOM |
||
|
173,006 |
||
|
All weight/BMI |
||
|
Good |
||
|
Cogswell et al., 19952 |
Pregravid weight: Self-report |
Maternal weight gain categories (lbs) stratified by pregravid BMI: |
|
USA, Pregnancy Nutrition Surveillance System |
Total weight gain: Self-report |
Normal weight (BMI 19.8-26.0): G1: < 15 G2: 15-19 G3: 20-24 G4: 25-29 G5: 30-34 G6: 35-39 G7: ≥ 40 |
|
53,541 |
||
|
Normal/Overweight/Obese |
||
|
Fair |
||
|
Overweight (BMI > 26.0-29.0): G8: < 15 G9: 15-19 G10: 20-24 G11: 25-29 G12: 30-34 G13: 35-39 G14: ≥ 40 |
||
|
Obese (BMI > 29.0): G15: < 15 G16: 15-19 G17: 20-24 G18: 25-29 G19: 30-34 G20: 35-39 G21: ≥ 40 |
|
Results |
Confounders and Effect Modifiers Included in Analysis |
|
Within every BMI-race ethnicity stratum, the odds of delivering a > 4,500g infant tended to increase as weight gain increased. This trend was statistically significant for all strata; however, the trend diminished with decreasing BMI. Women in G6 were 2.2-10.8 times more likely to deliver a > 4,500 g infant compared to women in G3, irrespective of BMI status. |
Age, height, education, trimester of the Special Supplemental Nutrition Program for WIC |
|
AOR (95% CI) for high birthweight: G1: 1.0 (0.5-2.0) G2: 0.4 (0.2-1.0) G3: 0.6 (0.3-1.1) G4: 1.0 (reference) G5: 1.1 (0.7-1.8) G6: 1.5 (1.0-2.3) G7: 3.3 (2.3-4.7) |
Age, race, height, smoking, gestational age, sex of infant |
|
G8: 0.8 (0.2-2.6) G9: 1.0 (reference) G10: 1.1 (0.4-3.5) G11: 2.1 (0.8-5.7) G12: 2.4 (0.9-6.4) G13: 1.6 (0.6-4.6) G14: 4.0 (1.6-10.1) |
|
|
G15:0.7 (0.5-1.1) G16: 1.0 (reference) G17: 1.1 (0.7-1.7) G18: 1.3 (0.8-2.0) G19: 1.9 (1.3-2.9) G20: 2.1 (1.3-3.2) G21: 2.3 (1.6-3.3) |
|
Author, Year Country, Setting Sample Size Baseline BMI Quality |
Pregravid Weight (How Measured) Total Weight Gain (How Measured) |
Definition of Groups |
|
Thorsdottir, 200253 |
Pregravid weight: Self-report |
Maternal weight gain categories: |
|
Iceland, Hospital records |
G1: < 11.5 kg G2: 11.5-16.0 kg G3: 16.1-20.0 kg G4: > 20.0 kg |
|
|
Total weight gain: Maternity records |
||
|
614 |
||
|
Normal weight/BMI 19.5-25.5 |
||
|
G5: 12.5-15.5 kg G6: > 17.8-20.8 kg |
||
|
Fair |
||
|
LGA as birthweight > 4,000 gm |
||
|
Edwards et al., 199655 |
Pregravid weight: Self-report |
Maternal weight gain categories (kg) Obese > 29: G1: Lost weight/no change G2: 0.5-6.5 G3: 7-11.5 G4: 12-16 G5: > 16 Normal BMI 19.8-26 G6: < 11.5 kg G7: 11.5-16 G8: > 16 kg |
|
USA, Hospital |
Total weight gain: Measured |
|
|
1,443 |
||
|
Normal/Obese weight/BMI |
||
|
Fair |
||
|
Results |
Confounders and Effect Modifiers Included in Analysis |
|
Birthweight > 4,500g,% G1: 4.3 G2: 4.1 (P < 0.05 between groups) G3: 9.1 (P < 0.05 between groups) G4: 10.2 (P < 0.05 between groups) P for trend < 0.015 |
Age, parity, height, gestational age, birthweight |
|
RR (95% CI) for > 4,500g: G5: 1.00 (reference) G6: 3.54 (1.26-9.97) |
|
|
Birthweight ≥ 4,000g,%: G1:12.0 G2: 12.5 G3: 13.3 G4: 15.4 G5: 24.4 P (for G1-G5) = 0.026 |
Age, parity, pregravid BMI, GDM, pregnancy-induced hypertension, prenatal adequacy, alcohol use, drug use, smoking, gestational age |
|
G6: 5.7 G7: 6.6 G8: 16.9 P (for G6-G8) < 0.001 |
|
|
AOR (95% CI) for birthweight ≥ 4,000g among obese women (BMI > 29.0): G3: 1.0 (reference) G8: 2.8 (1.4-5.6) |
|
|
AOR (95% CI) for birthweight ≥ 4,000g among normal weight women (BMI 19.8-26.0): G7: 1.0 (reference) G8: 2.4 (1.3-4.7) |
|
Author, Year Country, Setting Sample Size Baseline BMI Quality |
Pregravid Weight (How Measured) Total Weight Gain (How Measured) |
Definition of Groups |
|
Rode et al., 2007164 |
Pregravid weight: Self report |
Maternal weight gain categories stratified by pregravid BMI status: |
|
Denmark Smoke-free Newborn Study, University Hospital |
||
|
Total weight gain: Self report |
BMI less than 19.8 G1: < IOM G2: Within IOM G3: > IOM |
|
|
2,248 |
||
|
All weight/BMI |
||
|
BMI 19.8-26.0 G4: < IOM G5: Within IOM G6: > IOM |
||
|
Fair |
||
|
BMI 26.1-29.0 G7: < IOM G8: Within IOM G9: > IOM |
||
|
BMI greater than 29.0 G10: < IOM G11: Within IOM G12: > IOM |
||
|
Kabali et al., 2007165 |
Pregravid weight: Self-report |
G1: < IOM G2: within IOM G3: > IOM |
|
USA/Canada, Pediatric practice |
Total weight: Self-report |
|
|
BMI IOM |
||
|
815 |
||
|
All weight/BMI |
||
|
Poor |
||
|
AOR, adjusted odds ratio; BMI, body mass index; CI, confidence interval; g, gram; G, group; GDM, gestational diabetes; IOM, Institute of Medicine; kg/wk, kilogram per week; lbs, pounds; LBW, low birthweight; NICU, neonatal intensive care unit; PRAMS, Pregnancy Risk Assessment Monitoring System; USA, United States of America; WIC, The Special Supplemental Nutrition Program for Women, Infants, and Children. |
||
|
Results |
Confounders and Effect Modifiers Included in Analysis |
|
AOR (95% CI) for birthweight ≥ 4,000g: G1: 0.8 (0.4-1.6) G2: 1.0 (reference) G3: 1.7 (0.8-3.6) |
Preeclampsia, caffeine consumption, gestational age, smoking |
|
G4: 0.7 (0.5-0.999) G5: 1.0 (reference) G6: 1.9 (1.5-2.5) |
|
|
G7: 0.6 (0.1-3.1) G8: 1.0 (reference) G9: 1.8 (0.8-3.9) |
|
|
G10: 0.8 (0.4-1.7) G11: 1.0 (reference) G12: 0.9 (0.4-2.0) |
|
|
AOR G1: 1.0 (0.4, 1.9) G2: ref G3: 1.5 (0.7, 2.5) |
Maternal age, marital status, race/ethnicity, family income, years of education, smoking, alcohol, sex of child, parity, gestational age |
|
Combined effect with BMI OR (AOR similar but not all could be calculated) Underweight/G1: 0.7 (0.2, 3.3) Underweight/G2: 1.0 (0.3, 3.5) Underweight/G3: 1.7 (0.4, 6.4) |
|
|
Normal/G1: 0.7 (0.3, 1.8) Normal/G2 Ref Normal/G3: 1.1 (0.5, 2.3) |
|
|
Overweight/G1: 1.2 (0.4, 3.8) Overweight/G2: 0.8 (0,2, 2.7) Overweight/G3: 2.4 (1.2, 4.8) |
among obese smokers.55,159 In a study that grouped women into classes of obesity,4 the odds of LGA increased with weight gains above 25 pounds for all classes of obesity.
Two studies examined the impact of rate of weight gain according to the IOM guidelines on having an LGA infant.116,154 One good study defined the rate of weight gain in increments of 50 g per week.116 The AORs associated with having an LGA infant for each increment were as follows: 1.25 for normal-weight women, 1.14 for overweight women, and 1.13 for obese women. Using these AORs, the authors calculated the expected change in the incidence of LGA if weight gains remained within the IOM guidelines. These changes were −0.77 percent for black women and −2.87 percent for white women; baseline LGA incidence rates were 4.8 percent and 14.8 percent, respectively. The other study investigated rate of weight gain among black adolescents with no difference in pregravid weight status.154 In bivariate analysis the prevalence of LGA did not differ between mothers who were slow weight gainers (< 0.23 kg/week) or rapid weight gainers (> 0.4 kg/week) and mothers who were average weight gainers (0.23 to 0.4 kg/week).
With respect to LGA defined as > 4,500 g, the one study reporting risk estimates for women of all weight groups found that weight gain above the IOM guidelines was associated with a threefold increased risk of LGA after adjustment for various confounders.110 Women who gained less than the recommendation were 62 percent less likely to have an LGA infant than women who gained within the recommended range.
Analyses for normal-weight women showed a threefold increased risk of LGA with weight gains above the IOM guidelines110 or at > 40 pounds2,53 after adjusting for multiple confounders. Overweight and obese women who gained more than the IOM guidelines had twice the risk of having an LGA infant in one study,110 and in another study,2 they did not have a significantly increased risk until weight gains exceeded 40 pounds for overweight women (AOR, 4.0; 95% CI, 1.6-10.1) and 30 pounds for obese women (AOR ranged from 1.9 to 2.3).
Low weight gains were not significantly associated with LGA risk in any of these studies.2,53,110,160 In one study that stratified results by weight status and race across all BMI and racial groups,160 the risk of LGA was significantly higher with total weight gains 10 pounds more than the IOM recommendation. Weight gains below the IOM guidelines were protective only among white women across all BMI weight status groups.
Detailed results for high birthweight or macrosomia Three studies (1 poor-quality165) defined high birthweight or macrosomia as > 4,000 g.55,164 All stratified results by pregravid weight status. For normal-weight women, those who gained more than the IOM guidelines were at a statistically
significant increased risk in the two studies of fair quality.55,164 Normal-weight women who gained below the guidelines were at decreased risk in one study.164 For obese women, one study found no difference in the risk of macrosomia with weight gains either above or below the IOM guidelines;164 the other found that those who gained above the IOM guidelines had 2.8 times the risk for a macrosomic infant relative to those who gained within the recommended range.55 For underweight and overweight women, weight gains above or below the IOM guidelines were not associated with delivering a macrosomic infant,164 although women with weight gains above the guidelines appeared to have a slightly increased risk.
Fetal growth (small for gestational age)
Study characteristics Ten articles examined the association of gaining weight according to the IOM guidelines and having an SGA infant (Evidence Table 45, Table 35).4,25,54,55,116,118,129,153,154,159 Two studies were conducted among black adolescents.153,154 The majority used hospital databases54,55,116,118,129,153,159 or clinic databases153 as the source of their information; one study (2 articles) used birth certificate information;4,25 and one was a cohort study.154 All studies used a definition of < 10th percentile to define SGA, but reference populations differed across these studies.
Overview of results for SGA infant weight Evidence from 10 studies (3 good,116,153,159 6 fair,4,25,55,118,129,154 one poor54) supports an association between weight gains below the recommended IOM guidelines and the risk of having an SGA infant.
Detailed results of SGA infant weight With respect to gaining less than the IOM guidelines, two studies found statistically significant higher odds for women giving birth to an SGA infant across all pregravid BMI categories.118,129 One of these studies also examined the odds for excessive weight gain, which was statistically significantly protective.129
Among normal-weight women, two studies found that excessive weight gain decreased the SGA risk by half, whereas inadequate weight gain doubled the SGA risk.25,55 Among obese women, those who gained below the IOM guidelines were at nearly three times the risk of having an SGA infant55,118,159 compared with those who gained within the recommended range. In the one study that was able to examine classes of obesity (Class I, BMI 30.0-34.9; Class II, BMI 35.0-39; and Class III, BMI ≥ 40), the risk of SGA increased for all classes in a linear fashion as weight gain fell below the IOM recommendation of at least 15 to 25 pounds.4
The good study conducted among black adolescents that examined total weight gain153 found an increased odds for SGA associated with gaining less than the IOM guidelines compared with gaining at the lower half of the
TABLE 35. Weight Change Relative to IOM Thresholds and Small-for-Gestational-Age
|
Author, Year Country, Setting Sample Size Baseline BMI Quality |
Pregravid Weight (How Measured) Total Weight Gain (How Measured) |
Definition of Groups |
|
Caulfield et al., 1998116 |
Pregravid weight: Self report |
G1: Underweight, BMI < 19.8 G2: Normal weight, BMI 19.8-26.0 G3: Overweight, BMI > 26.0 |
|
USA, University Hospital |
Total weight gain: Measured |
|
|
Black women: G4: No weight gain < IOM G5: No weight gain > IOM |
||
|
3,870 |
||
|
All weight/BMI |
||
|
White women: G6: No weight gain < IOM G7: No weight gain > IOM |
||
|
Good |
||
|
Hellerstedt et al., 1997159 |
Pregravid weight: Self-report |
Maternal weight gain categories stratified by pregravid BMI and smoking status: |
|
USA, medical center |
Total weight gain: Measured |
Obese (BMI > 29.0): G1: Smokers, < IOM G2: Smokers, within IOM G3: Smokers, > IOM |
|
1,343 |
||
|
Normal/obese BMI |
||
|
G4: Nonsmokers, < IOM G5: Nonsmokers, within IOM G6: Nonsmokers, > IOM |
||
|
Good |
||
|
Normal weight (BMI 19.8-26.0): G7: Smokers, < IOM G8: Smokers, within IOM G9: Smokers, > IOM |
||
|
G10: Nonsmokers, < IOM G11: Nonsmokers, within IOM G12: Nonsmokers, > IOM |
||
|
Obese: G13: Lost/no gain G14: 0.5-6.5 kg G15: 7-11.5 kg G16: 12-16 kg G17: > 16 kg |
||
|
Normal weight: G18: < 11.5 kg G19: 11.5-16 kg G20: > 16 kg |
|
Results |
Confounders and Effect Modifiers Included in Analysis |
|
AOR (95% CI) for SGA and rate of weight gain (per 50 g/wk): G1: 0.87 (0.78-0.97) G2: 0.90 (0.84-0.96) G3: 0.93 (0.86-1.01) |
Age, race, parity, pregravid BMI, height, hypertension, provider type, smoking, female infant |
|
Expected absolute change (as % of baseline) in Incidence of SGA associated with modifiable risk factors (G4-G7): G4: −1.17 (−16) G5: +0.97 (+13) G6: −0.44 (−11) G7: +0.60 (+15) |
|
|
Frequencies of SGA,%: G1: 13.3 G2: 10.0 G3: 7.7 G4: 5.5 G5: 4.7 G6: 3.6 G7: 28.6 G8: 10.9 G9: 3.6 G10: 8.9 G11: 6.5 G12: 6.4 |
Maternal age, pregravid BMI, infant sex, race, parity, prenatal alcohol use, prenatal illicit drug use, adequacy of prenatal care, gestational hypertension, GDM, gestational age |
|
G13: 10.7 G14: 6.6 G15: 6.0 G16: 4.0 G17: 5.3 P = 0.115 for G13-G17 |
|
|
G18: 15.9 G19: 7.5 G20: 5.7 P = 0.001 for G18-G20 |
|
|
For obese women, compared to nonsmokers who gained 7-11.5 kg, smokers who gained < 7 kg were at significantly higher risk of SGA OR: 3.2 (95% CI, 1.1-10.1) |
|
|
For normal weight women, compared to nonsmokers who gained 11.5-16 kg, smokers who gained < 11.5 kg were at significantly higher risk of SGA OR: 4.3 (95% CI, 1.8-10.3) |
|
Author, Year Country, Setting Sample Size Baseline BMI Quality |
Pregravid Weight (How Measured) Total Weight Gain (How Measured) |
Definition of Groups |
|
Nielsen et al., 2006153 |
Pregravid weight: Self-report |
G1: BMI < 19.8 G2: BMI 19.8-26.0 G3: BMI > 26.0 |
|
USA, hospitals (African American adolescents) |
Total weight gain: Measured |
|
|
G4: < IOM G5: Lower half of IOM G6: Upper half of IOM G7: > IOM |
||
|
815 |
||
|
All weight/BMI |
||
|
Good |
||
|
Devader et al., 200725 |
Pregravid weight: Self-report |
Maternal weight gain categories (lbs): G1: < 25 G2: 25-35 G3: > 35 |
|
USA, birth certificate data |
Total weight gain: Measured |
|
|
94,696 |
||
|
Normal weight/BMI 19.8-26 |
||
|
Fair |
||
|
Edwards et al., 199655 |
Pregravid weight: Self-report |
Obese BMI > 29 (kg): G1: Lost weight/no change G2: 0.5-6.5 G3: 7-11.5 G4: 12-16 G5: > 16 |
|
USA, hospital |
Total weight gain: Measured |
|
|
1,443 |
||
|
Normal/Obese weight/BMI |
Normal weight 19.8-26 G6: < 11.5 G7: 11.5-16 G8: > 16 |
|
|
Fair |
|
Results |
Confounders and Effect Modifiers Included in Analysis |
|
SGA,%: G1: 22.3 G2: 15.6 G3: 11.5 P < 0.01 for G1-G3 |
Parity, pregravid BMI, time between last weight measure and delivery, height |
|
AOR (95% CI) for SGA: G4: 2.31 (1.22-4.37) G5: 1.00 (reference) G6: 0.88 (0.41-1.89) G7: 0.68 (0.34-1.35) P < 0.01 for G4-G7 |
|
|
AOR (95% CI) for SGA: G1: 2.14 (2.01-2.27) G2: 1.0 (reference) G3: 0.48 (0.45-0.50) |
Age, race, education, income, alcohol use, height, prior pregnancy, inadequate prenatal care use, smoking, child’s gender, birth year |
|
% SGA for obese: G1: 10.7% G2: 6.6% G3: 6.0% G4: 4.0% G5: 5.3% P = 0.11 |
Age, parity, pregravid BMI, GDM, PIH, prenatal adequacy, alcohol use, drug use, smoking, gestational age |
|
For normal weight: G6: 15.9% G7: 7.5% G8: 5.7% P = 0.001 |
|
|
AOR (95% CI) Obese: G1 vs. G3 2.9 (1.1-8.4) Normal weight: G6 vs. G7 1.7 (0.9-3.4) |
|
Author, Year Country, Setting Sample Size Baseline BMI Quality |
Pregravid Weight (How Measured) Total Weight Gain (How Measured) |
Definition of Groups |
|
Kiel et al., 20074 |
Pregravid weight: Self-report |
Maternal weight gain categories stratified by prepregnancy obesity status, Obese Class I (BMI 30-34.9), Obese Class II (BMI 35-39.9), Obese Class III (BMI ≥ 40): G1: ≤ −10 lbs G2: −2 to −9 lbs G3: No change G4: 2-9 lbs G5: 10-14 lbs G6: 15-25 lbs G7: 26-35 lbs G8: > 35 lbs |
|
USA, birth registry |
Total weight gain: Medical record |
|
|
120,170 |
||
|
Obese BMI > 30 |
||
|
Fair |
||
|
Parker and Abrams, 1992118 |
Pregravid weight: Self-report |
Maternal weight gain categories: |
|
Total weight gain: Measured |
G1: < IOM G2: Within IOM G3: > IOM |
|
|
USA, hospital (California) |
||
|
6,690 |
BMI IOM |
|
|
All weight/BMI |
||
|
Fair |
||
|
Stevens-Simon and McAnarney, 1992154 |
Pregravid weight: Self-report |
Maternal weight gain categories (kg/wk): |
|
Total weight gain: Measured |
G1: < 0.23 G2: 0.23-0.40 G3: > 0.40 |
|
|
USA, adolescent maternity program |
||
|
141 |
||
|
All weight/BMI |
||
|
Fair |
|
Results |
Confounders and Effect Modifiers Included in Analysis |
|
For Obese Class I: AOR (95% CI) for SGA were significantly greater (> 1.00, G6 was reference) for G1-G5 and significantly lower for G7-G8. |
Age, race, parity, education, poverty (enrollment in Medicaid, WIC, food stamp programs), tobacco use, chronic hypertension |
|
For Obese Class II: AOR (95% CI) for SGA were significantly greater (> 1.00, G6 was reference) for G1-G5 and significantly lower for G7-G8 |
|
|
For Obese Class III: AOR (95% CI) for SGA were significantly greater (> 1.00, G6 was reference) for G1 and G3 and significantly lower for G7-G8 |
|
|
AOR (95% CI) for SGA: G1: 1.78 (1.39-2.27) G2: 1.00 (reference) |
Age, race, parity, pregravid BMI, height, maternal high and low weight gain, smoking, gestational age, birthweight |
|
Incidence of SGA in nonobese women,%: G1: 3.25 G2: 6.14 G3: 13.11 |
|
|
Incidence of SGA in obese women,%: G1: 11.76 G2: 3.09 |
|
|
Distribution of SGA, %: G1: 7.1 G2: 9.1 G3: 2.1 P = NS |
None |
|
Author, Year Country, Setting Sample Size Baseline BMI Quality |
Pregravid Weight (How Measured) Total Weight Gain (How Measured) |
Definition of Groups |
|
Stotland et al., 2006129 |
Pregravid weight: Self-report |
Maternal weight gain categories: |
|
G1: < IOM G2: Within IOM G3: > IOM G4: < 7 kg G5: > 18 kg |
||
|
USA, university hospital |
Total weight gain: Prenatal record |
|
|
20,465 |
||
|
All weight/BMI |
||
|
Fair |
||
|
Bianco et al., 199854 |
Pregravid weight: Self-report |
Maternal weight gain categories among morbidly obese (BMI > 35): G1: Weight loss/no change G2: 1-15 lbs G3: 16-25 lbs G4: 26-35 lbs G5: > 35 lbs |
|
USA, medical center |
Total weight gain: Measured |
|
|
11,926 |
||
|
Nonobese (BMI 19-27) and morbidly obese (BMI > 35) |
||
|
Poor |
||
|
AOR, adjusted odds ratio; BMI, body mass index; CI, confidence interval; G, group; GDM, gestational diabetes mellitus; IOM, Institute of Medicine; kg, kilogram; NS, not sufficient; OR, odds ratio; PIH, pregnancy-induced hypertension; SGA, small-for-gestational age; USA, United States of America; WIC, The Special Supplemental Nutrition Program for Women, Infants, and Children. |
||
guidelines (AOR, 2.31; 95% CI, 1.22-4.37) and no significantly protective effect with weight gains in the upper half or greater than the IOM.
Two studies examined the rate of weight gain.116,154 One, among black adolescents,154 found no difference in the prevalence of SGA among rate of weight gain categories (slow, < 0.23 kg/week; average, 0.23 to 0.40 kg/week; and rapid, > 0.4 kg/week). In the other study, after adjustment for multiple confounders, increasing rates of weight gain were associated with a reduced risk of SGA.116 This study calculated the expected change in the
|
Results |
Confounders and Effect Modifiers Included in Analysis |
|
Unadjusted rates of SGA: G1: 11.74 P < 0.001 vs. G2 G2: 7.05 G3: 3.70 P < 0.001 vs. G2 G4: 13.99 P < 0.05 vs. G2 G5: 3.87 P < 0.05 vs. G2 |
Age, race, parity, pregravid BMI, PIH, date of delivery, mode of delivery, length of first and second stages of labor, smoking, gestational age, birthweight |
|
AOR (95% CI) for SGA: G1: 1.66 (1.44-1.92) G2: 1.00 (reference) G3: 0.51 (0.44-0.59) G4: 2.26 (1.76-2.90) G5: 0.50 (0.42-0.60) |
|
|
Distribution of SGA,%: G1: 4.0 G2: 3.9 G3: 5.6 G4: 3.1 G5: 3.8 P = No testing due to small numbers in each cell |
Race, parity, clinic service, substance abuse, preexisting medical condition |
incidence of SGA by preventing inadequate weight gain to be −1.17 percent and −0.44 percent for black and white women, respectively.
Apgar Scores
Study characteristics Three studies, all rated fair quality, dealt with Apgar scores (Evidence Table 46; Table 36).125,129,154
TABLE 36. Weight Change Relative to IOM Thresholds and Apgar Scores
|
Author, Year Country, Setting Sample Size Baseline BMI Quality |
Pregravid Weight (How Measured) Total Weight Gain (How Measured) |
Definition of Groups |
|
Nixon et al., 1998125 |
Pregravid weight: Self-report |
Gestational weight gain categorized by IOM recommendations |
|
USA, county nurse-midwifery services |
||
|
2,228 |
Total weight gain: Data records |
BMI IOM |
|
All weight/BMI |
||
|
Fair |
||
|
Stevens-Simon and McAnarney, 1992154 |
Pregravid weight: Self-report |
Maternal weight gain categories (kg/wk): |
|
USA, adolescent maternity program |
||
|
141 |
Total weight gain: Measured |
G1: < 0.23 G2: 0.23-0.40 G3: > 0.40 |
|
All weight/BMI |
||
|
Fair |
||
|
Stotland et al., 2006129 |
Pregravid weight: Self-report |
Maternal weight gain categories: |
|
USA, university hospital |
||
|
20,465 |
Total weight gain: Prenatal records |
G1: < IOM G2: Within IOM G3: > IOM G4: < 7 kg G5: > 18 kg |
|
All weight/BMI (using IOM definitions) |
||
|
Fair |
||
|
BMI, body mass index; G, group; IOM, Institute of Medicine; kg/wk, kilogram per week; NS, not significant; USA, United States of America. |
||
Overview of results Three fair studies provide insufficient evidence to support an association between weight gain and low Apgar scores.
Detailed Results on Apgar Scores Three studies included investigation of Apgar scores and adherence to the IOM recommendations.125,129,154 In one study,129 total weight gain above the IOM guidelines increased the risk
|
Results |
Confounders and Effect Modifiers Included in Analysis |
|
Maternal weight gain by IOM guidelines was not not a signigicant predictor of Apgar scores (details—none reported) |
None |
|
Distribution of 1-minute Apgar score ≤ 4,%: G1: 25.0 G2: 4.5 G3: 14.9 P = 0.02 for G1 vs. G2 or G3 |
None |
|
Distribution of 5-minute Apgar score ≤ 4,%: G1: 3.5 G2: 0 G3: 0 P = NS |
|
|
Unadjusted rates of 5-minute Apgar score < 7: G1: 1.94 G2: 1.58 G3: 2.14 (P < 0.05, G3 vs. G2) |
Age, race, parity, pregravid BMI, pregnancy-induced hypertension, date of delivery, mode of delivery, length of first and second stage of labor, smoking, gestational age, birthweight |
|
G4: 2.39 G5: 2.16 (P < 0.05, G5 vs. G2) |
|
|
AOR (95% CI) for 5-minute Apgar score < 7: G1: 1.18 (0.84-1.66) G2: 1.00 (reference) G3: 1.33 (1.01-1.76) G4: 1.29 (0.70-2.39) G5: 1.30 (0.95-1.77) |
of having a 5-minute Apgar score of < 7 by 33 percent (AOR, 1.33; 95% CI, 1.01-1.76), whereas a weight gain below the IOM guidelines was not associated with a low 5-minute Apgar score (AOR, 1.18; 95% CI, 0.84-1.66). Another study125 found no effect of maternal weight gain with the outcome defined as a 1-minute Apgar score of < 7. The third study154was
conducted among black adolescents and found a slow rate of weight gain (< 0.23 kg/week) to be associated with a 1-minute Apgar score of ≤ 4 compared to higher rates of weight gain (> 0.23 kg/week).
Infant Outcomes
Perinatal mortality
Study characteristics One US study of a hospital database examined perinatal mortality (Evidence Table 47).127 The study included overall perinatal mortality and adverse perinatal outcome, which was defined as an infant death between delivery and discharge, delivery before 37 completed weeks of gestation, LBW, or stillbirth.127
Overview of results One fair study did not conduct multivariable modeling using the IOM cutpoints, and therefore provides weak evidence on the association between weight gain and perinatal mortality.127
Detailed results The authors reported, using only bivariate analysis, that infants of mothers who gained below the IOM recommendations had a significantly higher proportion of adverse perinatal outcomes (14 percent) and perinatal mortality (1.1 percent) than the infants whose mothers gained within or above the recommendations (8.5 percent and 0.4 percent respectively; P < 0.001 for all comparisons).
Infant hypoglycemia
Study characteristics Two studies from hospital databases examined hypoglycemia in the infant (Evidence Table 48).110,129 One study had many other outcomes such as birth trauma, admission to the special care nursery, neonatal infection, seizure, polycythemia, meconium aspiration syndrome, respiratory distress syndrome, and a hospital stay of 5 and 10 days.129
Overview of results Two studies, of good110 and fair quality,129 respectively, found moderate evidence that high maternal weight gain is associated with an increased risk of neonatal hypoglycemia for weight gain above IOM recommendations and were consistent in demonstrating a lack of association between weight gain below IOM recommendations and neonatal hypoglycemia.
Detailed results Two studies included infant hypoglycemia as an outcome of interest.110,129 The good study used a case-control design for women who delivered singletons at Kaiser Permanente Medical Center from 1996 to 1998.110 Cases (N = 328) were defined as infants with plasma glucose < 40 mg/dl; controls were infants born to women with no GDM. Cases had a significantly higher odds of having mothers who gained more
than the IOM guidelines (AOR, 1.38; 95% CI, 1.01-1.89); weight gains below the IOM were not associated with infant hypoglycemia.
Stratification by race (in the good study) showed that among infants born to non-Hispanic white women, a pregnancy weight gain below the IOM guidelines was significantly associated with a decreased odds of hypoglycemia (OR, 0.39; 95% CI, 0.18-0.84); among infants born to women of minority groups (undefined), weight gain below the IOM guidelines was significantly associated with an increased risk of hypoglycemia (OR, 1.69; 95% CI, 1.08-2.64).110 This study also stratified by pregravid BMI and did not find any significant effect that suggested the effect of weight gain varied by pregravid BMI.
The second study reported that women who gained above the IOM guidelines were significantly more likely to have an infant with hypoglycemia (AOR, 1.52; 95% CI, 1.06-2.16)129 but that women with weight gain below the guidelines had no such association. This study found significant associations only for weight gains above the IOM and the following outcomes: infant seizure (AOR, 6.5; 95% CI, 1.43-29.65), polycythemia (AOR, 1.44; 95% CI, 1.06-1.94), and meconium aspiration (AOR; 1.79, 95% CI, 1.12-2.86). Data were adjusted for maternal race, prepregnancy BMI, parity, age, gestational hypertension, smoking, gestational age at delivery, model of delivery, length of each stage of labor, and birthweight.
NICU admissions
Study characteristics Two studies, rated fair, dealt with admission to the neonatal intensive care unit (NICU); (Evidence Table 49).129,154 One study was a cohort of black adolescents.154
Overview of results Two fair studies using different measures of weight gain provided weak inconsistent evidence on neonatal hospitalization.
Detailed results on admission to NICU One study found that decreased risk of NICU admission was significantly associated with weight gain below IOM guidelines (AOR, 0.66; 95% CI, 0.46-0.96) but not with weight gains above the IOM guidelines (AOR, 1.03; 95% CI, 0.79-1.35).129 In the other study, among black adolescents a slow rate of weight gain (< 0.23 kg/week) was significantly associated with NICU admission (P = 0.01).154
Child Outcomes
Childhood weight status
Study characteristics Only one study of fair quality was found24 that examined weight gain according to the IOM and childhood weight status
(Evidence Table 50). This study involved 1,585 women from a single HMO in Boston who were part of pregnancy study and then enrolled in a followup study. A total of 1,110 children completed a visit at age 3, at which time study staff measured their weight and height; maternal weight and pregravid weight status were obtained via questionnaire. This study did not specify singleton-only births, but it did note that preterm births and infants weighing < 2,500 kg were excluded because of their different growth trajectories in the first year of life. Maternal weight gain was calculated as the difference between weight measured near delivery obtained from the prenatal record and self-reported pregravid weight. The study reported on the effect of total weight gain, net weight gain (excluding infant birthweight) and weight gain classified by IOM guidelines. Child BMI percentiles were grouped as follows: below 50th (referent category), 50th to 84th, 85th to 94th, and 95th or higher.
Results Using children born to women who gained inadequately as the referent, children born to women who gained adequately or excessively had higher odds of being in higher percentile categories. The AORs for children born to women who gained adequately were as follows: 50th to 84th percentile, 1.85 (1.17-2.92); 85th to 94th percentile, 2.09 (1.12-3.92), and 95th percentile and above, 3.77 (1.38-10.27). AORs for children born to mothers who gained excessively were similar: respectively, 1.84 (1.17-2.88), 2.03 (1.11-3.72) and 4.35 (1.69-11.24) Both models adjusted for maternal pregravid BMI, prenatal smoking, race/ethnicity, household income, martial status, glucose tolerance, paternal BMI, gestational length, and child’s sex.
Short- and Long-Term Maternal Outcomes
Lactation performance
Study characteristics Three studies (four articles) reported on the effects of weight gain on lactation performance (Evidence Table 51, Table 37).166-169 One study was done using the Danish National Birth Cohort;166 another study (2 articles) used a U.S. hospital database for years 1988 to 1997;168,169 and the third used data from the U.S. Pediatric Nutrition Surveillance System and the Pregnancy Nutrition Surveillance System.167 Lactation performance was defined as initiated breastfeeding,167,168 duration of any breastfeeding,166-168 and exclusive breastfeeding.166,168,169 Weight gain was defined as the difference between weight at delivery and self-reported pregravid weight168,169 or was based simply on self-reported total weight gain.166,167 The two U.S. studies used total weight gain as categorical variables corresponding to the IOM guidelines;167-169 the Danish
TABLE 37. Weight Change Relative to IOM Thresholds and Breastfeeding
|
Author, Year Country, Setting Sample Size Baseline BMI Quality |
Pregravid Weight (How Measured) Total Weight Gain (How Measured) |
Definition of Groups |
Results |
Confounders and Effect Modifiers Included in Analysis |
|
Baker et al., 2007166 |
Pregravid weight: Prepregnant weight Self reported |
G1: < 8 kg G2: 8-15.9 kg G3: ≥ 16 kg |
Overall higher risk of terminating full or any breastfeeding with higher pregravid BMI. |
BMI |
|
Denmark-National Birth |
||||
|
37,459 |
Total weight gain: Self-reported |
Unadjusted RR full BF G1: 1.13 (95% 1.08-1.18) G3: 1.05 (1.03-1.08). |
||
|
All wt/BMI Under wt BMI < 18.5 Normal BMI 18.5-24.9 Overweight BMI 25-29 Obese BMI ≥ 30 |
||||
|
Any BF G1: RR 1.16 (1.11-1.22) G3: 1.05 (1.03-1.08) |
||||
|
Fair |
GWG not a predictor of full or any when BMI was in the model. |
|||
|
Li et al., 2003167 |
Pregravid weight: Prepregnant weight Self reported |
G1: < IOM G2: within IOM G3: > IOM |
Adjusted OR for failure to initiate BF by BMI: |
Age, race, parity, pregravid BMI, maternal education, marital status, prenatal care, poverty-income ratio, gestational weight gain, smoking, gestational age, birthweight |
|
USA WIC clinics |
Under, normal and overweight G1: groups had a significant increased odds of failure to initiate BF compared to G2: within BMI strata. Obese women regardless of weight gain had increased odds of failure to initiate compared to normal wt G2. |
|||
|
51,329 |
Total weight gain: Self-reported |
|||
|
All wt/BMI (using IOM definitions) |
||||
|
Fair |
||||
|
Adjusted mean duration of BF (P < 0.01)* G1: 12.9 wk* G2: 13.6 wk (ref) G3: 12.8 wk* |
|
Author, Year Country, Setting Sample Size Baseline BMI Quality |
Pregravid Weight (How Measured) Total Weight Gain (How Measured) |
Definition of Groups |
Results |
Confounders and Effect Modifiers Included in Analysis |
|
Rasmussen et al., 2002168 |
Pregravid weight: Prepregnant weight Self reported |
G1: < IOM G2: within IOM G3: > IOM |
OR unsuccessful initiation of BF (normal wt G2: ref) Underweight no significant diff Normal wt G3: 1.66 (1.05-2.63) Overwt no significant diff Obese G3: 2.89 (1.78-4.69) |
Age, parity, participation in WIC/PCAP, type of delivery, mother attended college, smoking |
|
Hilson et al., 2006169 |
||||
|
USA, hospital |
||||
|
2,494 |
Total weight gain: Prenatal records |
|||
|
All wt/BMI (using IOM definitions) |
||||
|
Fair |
Hazard OR discontinuing exclusive BF (normal wt G2: ref) Underwt G3: 1.39 (1.01-1.92) Normal wt-no signif differences Overwt G3: 1.27 (1.03-1.56) Obese G1: 1.37 (1.01-1.84) G2: 1.50 (1.11-2.03) G3: 1.78 (1.48-2.14) Hazard OR discontinuing any BF (normal wt G2: ref) Underwt-no sign difference Normal wt-no sign difference Overwt-no sign difference Obese G2: 1.57 (1.14-2.18), G3: 1.99 (1.64-2.43) |
|||
|
BF, breastfeeding; BMI, body mass index; G, group; IOM, Institute of Medicine; OR, odds ratio; overwt, over weight; PCAP, Prenatal Care Assistance Program; RR, relative risk; WIC, The Special Supplemental Nutrition Program for Women, Infants, and Children; wt, weight. |
||||
study used categories corresponding to the following cutpoints: < 8 kg, 8 to 15.9 kg (the reference group), and ≥ 16 kg.166
Overview of results These studies (all fair quality) support an association between weight gains below the IOM guidelines and lower likelihood of breastfeeding initiation; they also suggest a shorter duration of exclusive breastfeeding among obese women. They provide only inconsistent evidence of an association between weight gain in relation to the IOM guidelines and initiation of breastfeeding.
Detailed results on breastfeeding initiation Obese women, regardless of weight gain, had higher odds of never initiating breastfeeding than women of normal weight in one U.S. study.167 For women who were underweight or of normal weight, greater weight gain was associated with a lower odds of never initiating breastfeeding; for overweight and obese women, there was no such association.167 Finally, for all three categories of women classified by BMI, weight gain below the IOM guidelines (as compared with weight gain within the guidelines) was associated with higher odds of never initiating breastfeeding.
The second study (2 articles) examined initiation of breastfeeding at 4 days postpartum among women who intended to breastfeed.168,169 Compared with normal-weight women who gained within the IOM guidelines, normal-weight women who gained more than the IOM guidelines and obese women regardless of weight gain had significantly higher odds of not breastfeeding.168 Among obese women, unsuccessful initiation of breast-feeding was limited to those who gained more than IOM guidelines169 compared with normal-weight women who gained within the guidelines. This study also reported a nonsignificant tendency of failing to initiate breastfeeding successfully with weight gain less than the IOM guidelines.
Detailed results on duration of exclusive breastfeeding The two studies (three articles) examining the length of exclusive breastfeeding all showed statistically significant shorter durations among obese women.166,168,169 The association between weight gain and duration of full breastfeeding did not differ by BMI status in two studies.166,169
U.S. women who gained above the IOM guidelines had a statistically significant shorter median duration of exclusive breastfeeding than women who gained within the guidelines according to multivariate models.169 For those who gained above the guidelines, the median duration of exclusive breastfeeding was 1 week shorter for underweight and overweight women and 3 weeks shorter for obese women.
In the Danish study,166 weight gain was a statistically significant predictor of full breastfeeding at 1, 16, and 20 weeks postpartum. In unadjusted models, both low weight gain (< 8 kg) and high weight gain (≥ 16 kg)
were associated with early termination of full breastfeeding Once the authors adjusted for pregravid BMI, however, this association was no longer significant.
Detailed results on duration of any breastfeeding Shorter duration of any breastfeeding was associated with maternal obesity.166,167,169
In the two U.S. studies, gaining weight above the IOM guidelines was associated with shorter duration of any breastfeeding (in the range of 1 to 2.5 weeks less) in bivariate and multivariate analysis.167,169 In one study, gaining weight below the IOM guidelines was also associated with shorter length of any breastfeeding (~1 week).167
In the Danish study, weight gain was a statistically significant predictor of terminating any breastfeeding at 16 and 20 weeks postpartum but not at 1 week.166 In unadjusted models, both low and high weight gains were associated with early termination of any breastfeeding. Once models were adjusted for pregravid BMI, this finding was no longer significant.
Fat retention
Study characteristics Two studies in the United States examined differences in the amount of fat retained in the postpartum period by IOM categories of weight gain (Evidence Table 52).16,97 One study reported on 63 pregnant women (17 underweight, 34 normal weight, 12 overweight/obese) from a convenience sample of 124 nonsmoking women ages 18 to 40.97 The study conducted body composition measurements using dual-energy x-ray absorptiometry both before and after pregnancy and weighed the women before, during, and after pregnancy. The second study was conducted among a convenience sample of 196 nonsmoking women between 19 and 36 years recruited from three prenatal clinics. These investigators used self-reported pregravid weight and conducted body composition measurements starting at 12 to 16 weeks of gestation, at 37 weeks, and/or at 2 to 4 weeks postpartum with hydrodensitometry (underwater weighing) and deuterium dilution volume.16 Total body bone mineral was measured at 2 to 4 weeks postpartum using dual-energy absorptiometery. They applied a four-compartment model (incorporating measurements of total body water, body density, body weight, and bone mineral content) to estimate total body fat.
Overview of results Evidence from two fair studies suggests that fat retention was higher among women whose weight gains exceeded IOM guidelines.
Detailed results In one study, fat retention was significantly higher among women who gained above the IOM guidelines (5.3 kg) than among women who gained within (2.3 kg) or below (−0.5kg).97 In the second
study, changes in body fat from 14 to 37 weeks of gestation stratified by pregravid BMI showed that women who gained below the IOM guidelines had the lowest amount of fat gain; those within an intermediate level and those above had the highest fat gain.16 The investigators did not report significance tests. Among obese women who gained within the IOM guidelines, the percentage of body fat change (−0.6 kg) was significantly lower than among other BMI groups who also gained within the recommendations (6.0 kg for underweight, 3.8 kg for normal weight, and 2.8 kg for overweight women).
Short-term weight retention
Study characteristics Four studies examined weight gain and weight retention in the short term104,154,158,170 (Evidence Table 53, Table 38). Three studies reported on results at 6 weeks postpartum.154,158,170 All used a cohort design involving mostly low-income women; two included Hispanic, black, and white women,158,170 and the third included only black adolescents.154 One study used total weight gain as the exposure;170 two examined the rate of weight gain.154,158 A fourth study examined the possible association 2 days after term delivery (37 to 43 weeks’ gestation).104
Overview of results Evidence from four fair studies supports an association between weight gain in excess of the IOM recommendations and higher weight retention in the immediate postpartum period.104,154,158,170
Detailed results In one study, women who gained more than recommended levels retained, at 6 weeks, statistically significantly more weight than women who gained within or below IOM guidelines.170 The 2-day post-delivery analyses, stratified by pregravid BMI, showed that for each BMI grouping, women who gained above the IOM guidelines retained statistically significantly more weight than women who gained within the guidelines; women who gained below the IOM guidelines retained significantly less than those who gained within them.104
Two studies examined the rate of weight gain. One defined < 0.23 kg per week as slow weight gain and > 0.4 kg per week as rapid,154 and the other defined low as < 0.34 kg per week and excessive as > 0.68 kg week.158 In both studies, the amount of weight retained was highest among women who had an excessive rate of weight gain compared with women who had lower rates.154,158
Weight retention during the first year postpartum
Study characteristics Six studies examined the effect of weight gain according to IOM classifications on weight retained during the first year postpartum (Evidence Table 54, Table 39).158,171-175 Five studies were from
TABLE 38. Weight Change Relative to IOM Thresholds and Short-Term Weight Retention
|
Author, Year Country, Setting Sample Size Baseline BMI Quality |
Pregravid Weight (How Measured) Total Weight Gain (How Measured) |
Definition of Groups |
Results |
Confounders and Effect Modifiers Included in Analysis |
|
Luke et al., 1996104 |
Pregravid weight: Self-report |
Maternal weight gain < IOM recommendations: G1: BMI < 19.8 G2: BMI 19.8-26.0 G3: BMI > 26.0 |
Mean (SEM) retained weight (defined as 2-day postpartum weight minus pregravid weight, kg): G1: 3.2 (0.5) P < 0.05 compared to G4 G2: 0.8 (0.4) P < 0.05 compared to G5 G3: −5.0 (0.7) P < 0.05 compared to G6 |
Age, parity, race, smoking, gestation duration, fetal sex |
|
USA, clinic |
||||
|
487 |
Total weight gain: Measured |
|||
|
All weight/BMI |
||||
|
Fair |
Maternal weight gain within IOM recommendations: G4: BMI < 19.8 G5: BMI 19.8-26.0 G6: BMI > 26.0 |
G4: 8.2 (0.7) G5: 7.0 (0.4) G6: 1.4 (0.8) |
||
|
G7: 15.5 (0.9) P < 0.05 compared to G4 G8: 12.9 (0.4) P < 0.05 compared to G5 G9: 9.5 (0.5) P < 0.05 compared to G6 |
||||
|
Maternal weight gain > IOM recommendations: G7: BMI < 19.8 G8: BMI 19.8-26.0 G9: BMI > 26.0 |
||||
|
Scholl et al., 1995158 |
Pregravid weight: Self report |
Maternal weight gain categories (kg/wk): |
Mean (SEM) change in weight (kg) from pregravid to 6 weeks postpartum: G1: 3.1 (0.80) G2: 3.9 (0.51) G3: 9.4 (0.70) P < 0.001, G3 vs. G1,G2 |
Age, parity, race, height, lactation status, smoking |
|
USA, Camden Study |
||||
|
274 |
Total weight gain: Measured |
G1: ≤ 0.34 G2: > 0.34-0.68 G3: > 0.68 |
||
|
Normal weight/BMI 19.8-26 |
||||
|
Fair |
|
Stevens-Simon and McAnarney, 1992154 |
Pregravid weight: Self-report |
Maternal weight gain categories (kg/wk): |
Short term weight retention (2-11 weeks postpartum), total kg: G1: −1.7 (SD 2.9) G2: 2.9 (SD 2.9) G3: 9.6 (SD 5.6) P < 0.0001 |
Age, pregravid BMI, level of physical activity, timing of first prenatal and postpartum visits substance use, body habitus |
|
USA, adolescent maternity program |
Total weight gain: Measured |
G1: < 0.23 G2: 0.23-0.40 G3: > 0.40 |
||
|
141 |
||||
|
All weight/BMI |
AOR (95% CI) for subsequent maternal obesity (> 120% ideal weight for height): G3: 190.94 (7.55-4,779.02) |
|||
|
Fair |
||||
|
Walker et al., 2004170 |
Pregravid weight: Self-report |
Maternal weight gain categories: |
Mean (SD) weight (kg) retained at 6 weeks postpartum: G1: −0.34 (3.44) G2: 3.86 (3.45) G3: 10.55 (6.14) P = 0.000 |
Race, parity, pregravid BMI, gestational weight gain, gestational age |
|
USA, Austin New Mothers Study |
Total weight gain: Self-report |
G1: < IOM G2: Within IOM G3: > IOM |
||
|
419 |
||||
|
All weight/BMI (using IOM definitions) |
% Women who attained pregravid weight at 6 weeks postpartum: G1: 48.8 G2: 14.3 G3: 2.3 |
|||
|
Fair |
||||
|
Correlation of gestational weight gain, excluding infant weight, (continuous variable) and weight retained at 6 weeks postpartum: r = 0.90 P = 0.000 |
||||
|
Multiple regression analysis predicted a mean increase in retained weight of 0.88 kg for each 1 kg increase in maternal weight gain (B = 0.88, SE = 0.02, P = 0.000) |
||||
|
B, beta; BMI, body mass index; CI, confidence interval; G, group; IOM, Institute of Medicine; kg, kilogram; kg/wk, kilogram per week; SD, standard deviation; SE, standard error; SEM, standard error of mean. |
||||
TABLE 39. Weight Change Relative to IOM Thresholds and Weight Retention During the First Year Postpartum
|
Author, Year Country, Setting Sample Size Baseline BMI Quality |
Pregravid Weight (How Measured) Total Weight Gain (How Measured) |
Definition of Groups |
|
Amorim et al., 2007171 |
Pregravid weight: Self-report |
Maternal weight gain categories: < IOM Within IOM > IOM |
|
Sweden, hospital |
||
|
483 |
Total weight gain: Obstetric records |
|
|
All weight/BMI |
||
|
Fair |
||
|
Rooney et al., 2002174 |
Pregravid weight: Measured at first visit |
Maternal weight gain categories: |
|
USA, hospital |
||
|
540 |
Total weight gain: Measured |
G1: < IOM G2: Within IOM G3: > IOM |
|
All weight/BMI |
||
|
Fair |
BMI IOM |
|
|
Scholl et al., 1995158 |
Pregravid weight: Self report |
Maternal weight gain categories (kg/wk): |
|
USA, Camden Study |
||
|
274 |
Total weight gain: Measured |
G1: ≤ 0.34 G2: > 0.34-0.68 G3: > 0.68 |
|
Normal weight/BMI 19.8-26 |
||
|
Fair |
|
Results |
Confounders and Effect Modifiers Included in Analysis |
|
A mixed ANOVA with one repeated measures factor (weight before pregnancy, 6 months, 1, and 15 years) and one between-subjects factor (< IOM, within IOM, > IOM) showed a main effect of time [F (9.024) = 113.7, P = 0.000] and a significant time group interaction [F(6,12) = 77.23, P = 0.000] |
Pregravid BMI |
|
The weight of women who gained excessive during pregnancy was significantly greater at each time-point [main effect of group: F (10.55) = 870.0, P = 0.000] |
|
|
Average weight change between prepregnancy and 6 months postpartum (kg): G1: − 0.61 G2: 1.8 G3: 4.2 P = 0.01 |
Duration of breastfeeding, postpartum aerobic exercise, weight loss by 6 months |
|
Regression coefficient (95% CI) for weight at 6 months postpartum: G1: −1.53 (3.36-0.30) G2: Reference G3: 1.24 (−0.63-3.11) |
|
|
Mean (SEM) change in weight (kg) from pregravid to 6 months postpartum: G1: 3.2 (0.95) G2: 3.8 (0.61) G3: 7.9 (0.83) P < 0.001, G3 vs. G1, G2 |
Age, race, parity, pregravid BMI, lactation, height, smoking |
|
Mean (SEM) change in weight (kg) from 6 weeks to 6 months postpartum: G1: 0.13 (0.64) G2: −0.05 (0.41) G3: −1.48 (0.56) P < 0.05, G3 vs. G1, G2 |
|
|
AOR (95% CI) for becoming overweight (BMI > 26.0) at 6 months postpartum: G1, G2: 1.0 (reference) G3: 2.89 (1.36-6.00) |
|
Author, Year Country, Setting Sample Size Baseline BMI Quality |
Pregravid Weight (How Measured) Total Weight Gain (How Measured) |
Definition of Groups |
|
Walker, 1996172 |
Pregravid weight: Self report |
Maternal weight gain categories: |
|
USA, mail survey |
||
|
88 |
Total weight gain: Self report |
G1: < IOM G2: Within IOM G3: > IOM |
|
Underweight/Normal/Overweight (using IOM definitions) |
||
|
Fair |
||
|
Olson, 2002175 |
Pregravid weight: Measured during first trimester |
Maternal weight gain categories: |
|
USA, hospital and primary care clinic system |
G1: < IOM G2: Within IOM G3: > IOM G4: Interaction for > IOM and income ≤ 185% federal poverty line |
|
|
622 |
Total weight gain: Measured |
|
|
All weight/BMI |
||
|
Fair |
||
|
Keppel, 1993173 |
Pregravid weight: Self-report |
Categories of amount of weight retained (lbs) at 10-18 months postpartum: G1: Lost weight G2: 0-3 G3: 4-8 G4: 9-13 G5: ≥ 14 |
|
USA, 1988 National Maternal and Infant Health Survey |
Total weight gain: Self-report |
|
|
2,944 |
||
|
Non obese/BMI < 29 |
||
|
Poor |
||
|
ANOVA, analysis of variance; BMI, body mass index; CI, confidence interval; G, group; kg, kilogram; kg/wk, kilogram per week; SE, standard error. |
||
|
Results |
Confounders and Effect Modifiers Included in Analysis |
|
Mean weight retention at 6 months postpartum, lbs: G1: 0.4 G2: 3.7 G3: 13.5 P < 0.001 |
Mode of delivery, infant sex, breastfeeding, infant birthweight, pregravid BMI |
|
Maternal weight gain was significantly related to weight at 6 months postpartum: r = 0.60, P < 0.001 Mean weight retention at 18 months postpartum, lbs: G1, G2: 0.7 G3: 11.0 P < 0.01 |
|
|
Maternal weight gain was significantly related to weight at 18 months postpartum: r = 0.49, P < 0.001 |
|
|
Regression coefficient (SE) for weight change from early pregnancy to 1 year postpartum (kg): G1: −1.50 (0.62) P = 0.016 G2: reference G3: 0.32 (0.65) P = 0.621 G4: 3.41 (0.91) P < 0.001 |
Exercise, food intake, breastfeeding, pregravid BMI, age, marital status, income, postpartum month that weight was measured |
|
AOR (95% CI) for major weight gain (≥ 10 lbs) at 1 year postpartum: G1: 0.33 (0.13-0.83) G2: 1.00 (reference) G3: 1.47 (0.73-2.94) G4: 3.23 (1.25-9.08) |
|
|
Compared to normal-weight women (BMI 19.8-26.0) in G2, normal weight, overweight (BMI 26.1-29.0) and obese (BMI > 29.0) women in G3 retained significantly more weight at 1 year postpartum (all P < 0.01) |
|
|
The percent distribution of women in G1-G5 stratified by maternal weight gain categories showed that both black and white women who gained < IOM or within the IOM guidelines retained less weight (10-18 months postpartum) than women who gained > IOM recommendations. Irrespective of maternal weight gain, black women retained more weight than white women |
None |
the United States, and one was from Sweden.171 Five used a cohort design;158,171,172,174,175 one U.S. study was done in a representative sample of births.173
Overview of results The evidence from five fair studies158,171,172,174,175 and one poor study173 supports an association between excessive weight gain and weight retention within the first year postpartum.
Detailed results Regardless of when postpartum weight was measured—at 6158,171,172,174 or at 10 to 18 months171,173,175—women who gained above the IOM recommendations retained more weight than those who gained within them. Women who gained below recommendations did not always retain less weight than those who gained within them, according to one fair158 and one poor study.173 In the poor study, which stratified results by race, this pattern of weight retention by weight gain held true for white and black women.173 One study calculated women had statistically significant odds of becoming overweight at 6 months given rates of weight gain above IOM guidelines.158
Another study used a mixed ANOVA with a one-repeated-measure factor (time of the weight measurement: before pregnancy, 6 months, 1 year, and 15 years after) and one between-subject factor (below, within, above the IOM guidelines).171 The weight of women who gained excessively during pregnancy was statistically significantly higher at each time point adjusted for pregravid BMI.
Long-term weight retention
Study characteristics Four articles from three databases examined weight retention after several years171,174,176 or until the second pregnancy177 (Evidence Table 55, Table 40). One study (2 articles) was in a U.S. medical center in Wisconsin,174,176 one was done in another U.S. hospital;177 and one was conducted in Sweden.171 Three studies were rated fair quality; one was rated good.177
Overview of results Evidence from one good article177 and three fair articles171,174,176 supports an association between excessive weight gain and higher weights later in life.
Detailed results The results for the Sweden study were reported above.171 In the Wisconsin study, the average amount of weight retained at a mean of 8.5 years later was statistically significantly higher among women who gained more than recommended guidelines than among women who gained within or below guidelines.174,176 In the regression model predicting long-term weight (at 8.5 years and 14.7 years), weight gain during pregnancy was a significant predictor of weight retention.
TABLE 40. Weight Change Relative to IOM Thresholds and Long-Term Weight Retention
|
Author, Year Country, Setting Sample Size Baseline BMI Quality |
Pregravid Weight (How Measured) Total Weight Gain (How Measured) |
Definition of Groups |
Results |
Confounders and Effect Modifiers Included in Analysis |
|
Gunderson, 2000177 |
Pregravid weight: Self-report |
Maternal weight gain categories: G1: < IOM/within IOM G2: > IOM |
AOR (95% CI) for becoming overweight between baseline (pregravid weight at start of index pregnancy) and start of second study pregnancy (median interval time = 1.5 years): G1: Reference G2: 2.95 (1.67-5.24) |
Smoking, PIH, education, parity, marital status, age at menarche, interval to first birth |
|
USA, hospital |
Total weight gain: Measured |
|||
|
1,300 |
||||
|
All weight/BMI (using IOM definitions) |
||||
|
Good |
||||
|
Rooney, 2005176 |
Pregravid weight: Measured at first prenatal visit |
Categories of maternal weight gain: G1: < IOM G2: within IOM G3: > IOM |
Multivariable regression coefficient (95% CI) for BMI at 15 years postpartum: G1: −0.57 (−0.57-1.21) G2: reference G3: 1.69 (0.79-2.58) |
Marital status at delivery, change in marital status, current parity, insurance status at delivery, current insurance status, baseline BMI, weight gain at index pregnancy, retained weight at 6 months postpartum, participation in postpartum aerobic exercise, duration of breastfeeding |
|
USA, hospital |
||||
|
484 |
Total weight gain: Measured |
|||
|
All weight/BMI |
Multivariable regression coefficient (95% CI) for change in weight between baseline and 15 years postpartum: G1: 0.43 (−1.87-2.73) G2: reference G3: 4.19 (1.88-6.51) |
|||
|
Fair |
|
Author, Year Country, Setting Sample Size Baseline BMI Quality |
Pregravid Weight (How Measured) Total Weight Gain (How Measured) |
Definition of Groups |
Results |
Confounders and Effect Modifiers Included in Analysis |
|
Amorim et al., 2007171 |
Pregravid weight: Self-report |
Maternal weight gain categories: G1: < IOM G2: Within IOM G3: > IOM |
Mean (SD) change in weight at 15 years postpartum, kg: G1: 6.2 (6.8) G2: 6.7 (6.8) G3: 10.3 (8.5) P = 0.000 |
Education, lactation, weight retention at 6 months postpartum, weight gain between 6 months and 1 year postpartum, pregravid BMI |
|
Sweden, hospital |
Total weight gain: Obstetric records |
|||
|
483 |
||||
|
All weight/BMI (using IOM definitions) |
Mean (SD) BMI at 15 years postpartum: G1: 23.5 (3.7) G2: 23.6 (3.0) G3: 25.9 (3.9) P = 0.000 |
|||
|
Fair |
||||
|
Multiple regression coefficient, B (95% CI) for 15 year BMI status: G1: 0.01 (−0.56-0.59) G2: Reference G3: 0.72 (0.15-1.30) P = 0.033 |
||||
|
Multiple regression coefficient (95% CI) for change in BMI status between pregravid and 15 years postpartum: G1: 0.02 (−0.56-0.59) G2: Reference G3: 0.68 (0.11-1.24) P = 0.042 |
|
Rooney et al., 2002174 |
Pregravid weight: Measured at first visit |
Maternal weight gain categories: |
Average weight change between prepregnancy and ~8.5 years postpartum (kg): G1: 4.1 G2: 6.5 G3: 8.4 P = 0.01 |
Duration of breastfeeding, postpartum aerobic exercise, weight loss by 6 months |
|
USA, hospital |
G1: < IOM G2: Within IOM G3: > IOM |
|||
|
540 |
Total weight gain: Measured |
|||
|
All weight/BMI (using IOM definitions) |
Regression coefficients (95% CI) for BMI at ~8.5 years postpartum: G1: −3.86 (−5.56 to −2.16) G2: Reference G3: −0.70 (−2.13-0.74) |
|||
|
Fair |
||||
|
AOR, adjusted odds ratio; B, beta; BMI, body mass index; CI, confidence interval; G, group; IOM, Institute of Medicine; PHI, pregnancy-induced hypertension; SD, standard deviation; USA, United States of America. |
||||
In the other U.S. study, the incidence of overweight at the second pregnancy was statistically significantly higher among women who had gained above the IOM in the prior pregnancy than among those who gained within or below IOM recommendations.177 The adjusted odds of becoming overweight between baseline and the start of the second pregnancy was nearly threefold for women gaining above recommendations.
KQ 5: Anthropometrics of Weight Measurement
Nearly all of the 150 studies included in this review estimated adiposity using body weight or BMI. Ten studies collected data from other anthropometric measurements and incorporated them into varying body composition equations or models to estimate body fat (Evidence Table 56).16,97,102,115,143,178-182 These measurements included bioelectrical impedance analysis (BIA),178 dual energy X-ray absorptiometry (DEXA, formerly referred to as DXA),16,97,180 skinfold thicknesses,102,143,180 circumferences (arm, thigh, radius, upper chest, chest, elbow, waist, upper iliac, wrist, knee, calf, and ankle),102,115,143,178,180 total body water,16,97,178,180 total body nitrogen,97 total body potassium,97 magnetic resonance imaging (MRI),179,181 and underwater weighing.16,97,180 Studies that used DEXA or MRI methods16,97,179,180 recorded measurements only during the postpartum period.
Collectively, these studies do not provide sufficient evidence to judge whether alternate methods of weight measurement are more informative or predictive of infant and maternal outcomes than standard body weight and height measurements.
REFERENCES
1. Institute of Medicine. Nutrition during pregnancy. Part I, weight gain. Washington, DC: National Academy Press 1990.
2. ME Cogswell, MK Serdula, DW Hungerford, and R Yip. Gestational weight gain among average-weight and overweight women—what is excessive? Am J Obstet Gynecol 1995. Feb. 172: (2 Pt 1) 705-12. (PubMed)
3. Saldana TM, Siega-Riz AM, Adair LS, Suchindran C. The relationship between pregnancy weight gain and glucose tolerance status among black and white women in central North Carolina. Am J Obstet Gynecol. 2006 12;195(6):1629-35.
4. DW Kiel, EA Dodson, R Artal, TK Boehmer, and TL Leet. Gestational weight gain and pregnancy outcomes in obese women: how much is enough? Obstet Gynecol 2007. Oct. 110: (4) 752-8. (PubMed)
5. Finkelstein EA, Fiebelkorn IC, Wang G. National medical expenditures attributable to overweight and obesity: how much and who’s paying. Health Affairs. 2003;(Web exclusive): W3-219-W3-226.
6. Finkelstein EA, Ruhm CJ, Kosa KM. Economic causes and consequences of obesity. Annual Review of Public Health. Palo Alto, CA: Annual Reviews 2004.
7. AA Hedley, CL Ogden, CL Johnson, MD Carroll, LR Curtin, and KM Flegal. Prevalence of overweight and obesity among US children, adolescents, and adults, 1999-2002 J Am Med Assoc 2004. Jun 16. 291: (23) 2847-50.
8. CL Ogden, MD Carroll, LR Curtin, MA McDowell, CJ Tabak, and KM Flegal. Prevalence of overweight and obesity in the United States, 1999-2004 J Am Med Assoc 2006. Apr 5. 295: (13) 1549-55.
9. Institute of Medicine. Influence of Pregnancy Weight on Maternal and Child Health: Workshop Report Committee on the Impact of Pregnancy Weight on Maternal and Child Health. Washington, DC: National Academy Press 2007.
10. MS Kramer, I Morin, H Yang, RW Platt, R Usher, and H McNamara, et al. Why are babies getting bigger? Temporal trends in fetal growth and its determinants J Pediatr 2002. Oct. 141: (4) 538-42. (PubMed)
11. Martin JA, Hamilton BE, Menacker F, Sutton PD, Mathews TJ. Preliminary births for 2004: Infant and maternal health. Health E-stats. Hyattsville, MD: National Center for Health Statistics. Released November 15, 2005.
12. NJ Eastman and E Jackson. Weight relationships in pregnancy. I. The bearing of maternal weight gain and pre-pregnancy weight on birth weight in full term pregnancies Obstet Gynecol Surv 1968. Nov. 23: (11) 1003-25. (PubMed)
13. B Abrams. Prenatal weight gain and postpartum weight retention: a delicate balance Am J Pub Health 1993. 83: (8) 1082-4. (PubMed) (Full Text in PMC)
14. Suitor CW. Maternal weight gain: a report of an expert work group PDF Full Text. Rockville, MD: United States Department of Health and Human Services Public Health Service 1997.
15. LA Schieve, ME Cogswell, and KS Scanlon. Trends in pregnancy weight gain within and outside ranges recommended by the Institute of Medicine in a WIC population Matern Child Health J 1998. Jun. 2: (2) 111-6. (PubMed)
16. SA Lederman, A Paxton, SB Heymsfield, J Wang, J Thornton, and RN Pierson Jr. Body fat and water changes during pregnancy in women with different body weight and weight gain Obstet Gynecol 1997. Oct. 90: (4 Pt 1) 483-8. (PubMed)
17. S Carmichael, B Abrams, and S Selvin. The pattern of maternal weight gain in women with good pregnancy outcomes Am J Public Health 1997. Dec. 87: (12) 1984-8. (PubMed) (Full Text in PMC)
18. LE Caulfield, FR Witter, and RJ Stoltzfus. Determinants of gestational weight gain outside the recommended ranges among black and white women Obstet Gynecol 1996. May. 87: (5 Pt 1) 760-6. (PubMed)
19. Pregnancy-related behaviors among migrant farm workers—four states, 1989-1993. MMWR Morb Mortal Wkly Rep. 1997 Apr 4; 46(13):283-6.
20. CA Hickey, SF McNeal, L Menefee, and S Ivey. Prenatal weight gain within upper and lower recommended ranges: effect on birth weight of black and white infants Obstet Gynecol 1997. Oct. 90: (4 Pt 1) 489-94. (PubMed)
21. AM Siega-Riz and CJ Hobel. Predictors of poor maternal weight gain from baseline anthropometric, psychosocial, and demographic information in a Hispanic population J Am Diet Assoc 1997. Nov. 97: (11) 1264-8. (PubMed)
22. AM Siega-Riz, LS Adair, and CJ Hobel. Institute of Medicine maternal weight gain recommendations and pregnancy outcome in a predominantly Hispanic population Obstet Gynecol 1994. Oct. 84: (4) 565-73. (PubMed)
23. PM Dietz, WM Callaghan, ME Cogswell, B Morrow, C Ferre, and LA Schieve. Combined effects of prepregnancy body mass index and weight gain during pregnancy on the risk of preterm delivery Epidemiology 2006. Mar. 17: (2) 170-7. (PubMed)
24. E Oken, EM Taveras, KP Kleinman, JW Rich-Edwards, and MW Gillman. Gestational weight gain and child adiposity at age 3 years Am J Obstet Gynecol 2007. Apr. 196: (4) 322. e1-8 (PubMed) (Full Text in PMC)
25. SR Devader, HL Neeley, TD Myles, and TL Leet. Evaluation of gestational weight gain guidelines for women with normal prepregnancy body mass index Obstet Gynecol 2007. Oct. 110: (4) 745-51. (PubMed)
26. NE Stotland, JS Haas, P Brawarsky, RA Jackson, E Fuentes-Afflick, and GJ Escobar. Body mass index, provider advice, and target gestational weight gain Obstet Gynecol 2005. Mar. 105: (3) 633-8. (PubMed)
27. CM Olson and MS Strawderman. Modifiable behavioral factors in a biopsychosocial model predict inadequate and excessive gestational weight gain J Am Diet Assoc 2003. Jan. 103: (1) 48-54. (PubMed)
28. ME Cogswell, KS Scanlon, SB Fein, and LA Schieve. Medically advised, mother’s personal target, and actual weight gain during pregnancy Obstet Gynecol 1999. Oct. 94: (4) 616-22. (PubMed)
29. SM Taffel, KG Keppel, and GK Jones. Medical advice on maternal weight gain and actual weight gain. Results from the 1988 National Maternal and Infant Health Survey Ann N Y Acad Sci 1993. Mar 15. 678: 293-305. (PubMed)
30. P Brawarsky, NE Stotland, RA Jackson, E Fuentes-Afflick, GJ Escobar, and N Rubashkin, et al. Pre-pregnancy and pregnancy-related factors and the risk of excessive or inadequate gestational weight gain Int J Gynaecol Obstet 2005. Nov. 91: (2) 125-31. (PubMed)
31. CA Hickey, SP Cliver, RL Goldenberg, SF McNeal, and HJ Hoffman. Relationship of psychosocial status to low prenatal weight gain among nonobese black and white women delivering at term Obstet Gynecol 1995. Aug. 86: (2) 177-83. (PubMed)
32. CA Hickey. Sociocultural and behavioral influences on weight gain during pregnancy Am J Clin Nutr 2000. May. 71: (5 Suppl) 1364S-70S. (PubMed)
33. LO Walker and M Kim. Psychosocial thriving during late pregnancy: relationship to ethnicity, gestational weight gain, and birth weight J Obstet Gynecol Neonatal Nurs 2002. May-Jun. 31: (3) 263-74.
34. King JC. Maternal obesity, glucose intolerance, and inflammation in pregnancy. In: Packer L, Sies H, eds. Oxidative Stress and Inflammatory Mechanisms in Obesity, Diabetes, and the Metabolic Syndrome : Taylor & Francis CRC Press 2007:90-106.
35. Berkman N, Viswanathan M. Model Form for the Evaluation of Observational Studies Included in Systematic Literature Reviews. Durham, NC: RTI International 2007.
36. Deeks JJ, Dinnes J, D’Amico R, Sowden AJ, Sakarovitch C, Song F, et al. Evaluating non-randomised intervention studies. Health Technol Assess. 2003;7:iii-x. [PMID: 14499048].
37. SH Downs and N Black. The feasibility of creating a checklist for the assessment of the methodological quality both of randomised and non-randomised studies of health care interventions J Epidemiol Community Health 1998. 52: 377-84. (PubMed) (Full Text in PMC)
38. LR Brunner Huber. Validity of self-reported height and weight in women of reproductive age Matern Child Health J 2007. 11: 137-44. (PubMed)
39. RF Gillum and CT Sempos. Ethnic variation in validity of classification of overweight and obesity using self-reported weight and height in American women and men: the Third National Health and Nutrition Examination Survey Nutr J 2005. 4: 27. (PubMed) (Full Text in PMC)
40. West SL, King V, Carey TS, McKoy JN, Lohr K, Sutton SF, et al. Systems to rate the strength of scientific evidence. Evidence Report, Technology Assessment No. 47. Rockville, Md.: Agency for Healthcare Research and Quality. AHRQ Publication No. 02-E016 2002.
41. A Rodriguez, G Bohlin, and G Lindmark. Symptoms across pregnancy in relation to psychosocial and biomedical factors Acta Obstet Gynecol Scand 2001. Mar. 80: (3) 213-23. (PubMed)
42. L Tulman, KH Morin, and J Fawcett. Prepregnant weight and weight gain during pregnancy: relationship to functional status, symptoms, and energy J Obstet Gynecol Neonatal Nurs 1998. Nov-Dec. 27: (6) 629-34.
43. DJ Madlon-Kay. Striae gravidarum. Folklore and fact Arch Fam Med 1993. May. 2: (5) 507-11. (PubMed)
44. GS Atwal, LK Manku, CE Griffiths, and DW Polson. Striae gravidarum in primiparae Br J Dermatol 2006. Nov. 155: (5) 965-9. (PubMed)
45. JM Marrero, PM Goggin, JS de Caestecker, JM Pearce, and JD Maxwell. Determinants of pregnancy heartburn Br J Obstet Gynaecol 1992. Sep. 99: (9) 731-4. (PubMed)
46. H Vallianatos, EA Brennand, K Raine, Q Stephen, B Petawabano, and D Dannenbaum, et al. Beliefs and practices of First Nation women about weight gain during pregnancy and lactation: implications for women’s health Can J Nurs Res 2006. Mar. 38: (1) 102-19. (PubMed)
47. L Dodds, DB Fell, KS Joseph, VM Allen, and B Butler. Outcomes of pregnancies complicated by hyperemesis gravidarum Obstet Gynecol 2006. Feb. 107: (2 Pt 1) 285-92. (PubMed)
48. EC Kieffer, BP Tabaei, WJ Carman, GH Nolan, JR Guzman, and WH Herman. The influence of maternal weight and glucose tolerance on infant birthweight in Latino mother-infant pairs Am J Public Health 2006. Dec. 96: (12) 2201-8. (PubMed)
49. EA Brennand, D Dannenbaum, and ND Willows. Pregnancy outcomes of First Nations women in relation to pregravid weight and pregnancy weight gain J Obstet Gynaecol Can 2005. Oct. 27: (10) 936-44. (PubMed)
50. G Seghieri, A De Bellis, R Anichini, L Alviggi, F Franconi, and MC Breschi. Does parity increase insulin resistance during pregnancy? Diabet Med 2005. Nov. 22: (11) 1574-80. (PubMed)
51. W Kabiru and BD Raynor. Obstetric outcomes associated with increase in BMI category during pregnancy Am J Obstet Gynecol 2004. Sep. 191: (3) 928-32. (PubMed)
52. M Murakami, M Ohmichi, T Takahashi, A Shibata, A Fukao, and N Morisaki, et al. Prepregnancy body mass index as an important predictor of perinatal outcomes in Japanese Arch Gynecol Obstet 2005. Apr. 271: (4) 311-5. (PubMed)
53. I Thorsdottir, JE Torfadottir, BE Birgisdottir, and RT Geirsson. Weight gain in women of normal weight before pregnancy: complications in pregnancy or delivery and birth outcome Obstet Gynecol 2002. May. 99: (5 Pt 1) 799-806. (PubMed)
54. AT Bianco, SW Smilen, Y Davis, S Lopez, R Lapinski, and CJ Lockwood. Pregnancy outcome and weight gain recommendations for the morbidly obese woman Obstet Gynecol 1998. Jan. 91: (1) 97-102. (PubMed)
55. LE Edwards, WL Hellerstedt, IR Alton, M Story, and JH Himes. Pregnancy complications and birth outcomes in obese and normal-weight women: effects of gestational weight change Obstet Gynecol 1996. Mar. 87: (3) 389-94. (PubMed)
56. Kieffer EC, Carman WJ, Gillespie BW, Nolan GH, Worley SE, Guzman JR. Obesity and gestational diabetes among African-American women and Latinas in Detroit: implications for disparities in women’s health. J Am Med Womens Assoc. 2001 Fall;56(4):181-7, 96.
57. R Hackmon, R James, C O’Reilly Green, A Ferber, Y Barnhard, and M Divon. The impact of maternal age, body mass index and maternal weight gain on the glucose challenge test in pregnancy J Matern Fetal Neonatal Med 2007. Mar. 20: (3) 253-7. (PubMed)
58. M Cedergren. Effects of gestational weight gain and body mass index on obstetric outcome in Sweden Int J Gynaecol Obstet 2006. Jun. 93: (3) 269-74. (PubMed)
59. DM Jensen, P Ovesen, H Beck-Nielsen, L Molsted-Pedersen, B Sorensen, and C Vinter, et al. Gestational weight gain and pregnancy outcomes in 481 obese glucose-tolerant women Diabet Care 2005. Sep. 28: (9) 2118-22.
60. D Ogunyemi, S Hullett, J Leeper, and A Risk. Prepregnancy body mass index, weight gain during pregnancy, and perinatal outcome in a rural black population J Matern Fetal Med 1998. Jul-Aug. 7: (4) 190-3. (PubMed)
61. K Wataba, T Mizutani, K Wasada, M Morine, T Sugiyama, and N Suehara. Impact of prepregnant body mass index and maternal weight gain on the risk of pregnancy complications in Japanese women Acta Obstet Gynecol Scand 2006. 85: (3) 269-76. (PubMed)
62. CW Ko. Risk factors for gallstone-related hospitalization during pregnancy and the postpartum Am J Gastroenterol 2006. Oct. 101: (10) 2263-8. (PubMed)
63. G Lindseth and MY Bird-Baker. Risk factors for cholelithiasis in pregnancy Res Nurs Health 2004. 27: (6) 382-91. (PubMed)
64. CA Gosselink, EE Ekwo, RF Woolson, A Moawad, and CR Long. Dietary habits, prepregnancy weight, and weight gain during pregnancy. Risk of pre term rupture of amniotic sac membranes Acta Obstet Gynecol Scand 1992. Aug. 71: (6) 425-38. (PubMed)
65. EA Nohr, BH Bech, M Vaeth, KM Rasmussen, TB Henriksen, and J Olsen. Obesity, gestational weight gain and preterm birth: a study within the Danish National Birth Cohort Paediatr Perinat Epidemiol 2007. Jan. 21: (1) 5-14. (PubMed)
66. JM Lang, E Lieberman, and A Cohen. A comparison of risk factors for preterm labor and term small-for-gestational-age birth Epidemiology 1996. Jul. 7: (4) 369-76. (PubMed)
67. BW Graves, SA DeJoy, A Heath, and P Pekow. Maternal body mass index, delivery route, and induction of labor in a midwifery caseload J Midwifery Womens Health 2006. Jul-Aug. 51: (4) 254-9. (PubMed)
68. U Ekblad and S Grenman. Maternal weight, weight gain during pregnancy and pregnancy outcome Int J Gynaecol Obstet 1992. Dec. 39: (4) 277-83. (PubMed)
69. P Purfield and K Morin. Excessive weight gain in primigravidas with low-risk pregnancy: selected obstetric consequences J Obstet Gynecol Neonatal Nurs 1995. Jun. 24: (5) 434-9.
70. JW Johnson, JA Longmate, and B Frentzen. Excessive maternal weight and pregnancy outcome Am J Obstet Gynecol 1992. Aug. 167: (2) 353-70. discussion 70-2 (PubMed)
71. TJ Rosenberg, S Garbers, H Lipkind, and MA Chiasson. Maternal obesity and diabetes as risk factors for adverse pregnancy outcomes: differences among 4 racial/ethnic groups Am J Public Health2005. Sep.95: (9) 1545-51. (PubMed) (Full Text in PMC)
72. KS Joseph, DC Young, L Dodds, CM O’Connell, VM Allen, and S Chandra, et al. Changes in maternal characteristics and obstetric practice and recent increases in primary cesarean delivery Obstet Gynecol 2003. Oct. 102: (4) 791-800. (PubMed)
73. G Chen, S Uryasev, and TK Young. On prediction of the cesarean delivery risk in a large private practice Am J Obstet Gynecol 2004. Aug. 191: (2) 616-24. discussion 24-5 (PubMed)
74. TK Young and B Woodmansee. Factors that are associated with cesarean delivery in a large private practice: the importance of prepregnancy body mass index and weight gain Am J Obstet Gynecol 2002. Aug. 187: (2) 312-8. discussion 8-20 (PubMed)
75. MJ Shepard, AF Saftlas, L Leo-Summers, and MB Bracken. Maternal anthropometric factors and risk of primary cesarean delivery Am J Public Health 1998. Oct. 88: (10) 1534-8. (PubMed) (Full Text in PMC)
76. FR Witter, LE Caulfield, and RJ Stoltzfus. Influence of maternal anthropometric status and birth weight on the risk of cesarean delivery Obstet Gynecol 1995. Jun. 85: (6) 947-51. (PubMed)
77. NJ Jain, CE Denk, LK Kruse, and V Dandolu. Maternal obesity: can pregnancy weight gain modify risk of selected adverse pregnancy outcomes? Am J Perinatol 2007. May. 24: (5) 291-8. (PubMed)
78. A Sherrard, RW Platt, D Vallerand, RH Usher, X Zhang, and MS Kramer. Maternal anthropometric risk factors for caesarean delivery before or after onset of labour BJOG 2007. Sep. 114: (9) 1088-96. (PubMed)
79. G Juhasz, C Gyamfi, P Gyamfi, K Tocce, and JL Stone. Effect of body mass index and excessive weight gain on success of vaginal birth after cesarean delivery Obstet Gynecol 2005. Oct. 106: (4) 741-6. (PubMed)
80. M Geary, P McParland, H Johnson, and J Stronge. Shoulder dystocia—is it predictable? Eur J Obstet Gynecol Reprod Biol 1995. Sep. 62: (1) 15-8. (PubMed)
81. VA Marshall. Maternal health practices and complications of term labor J Nurse-Midwifery 1991. 36: (3) 168-73. (PubMed)
82. S Carmichael, B Abrams, and S Selvin. The association of pattern of maternal weight gain with length of gestation and risk of spontaneous preterm delivery Paediatr Perinat Epidemiol 1997. Oct. 11: (4) 392-406. (PubMed)
83. EG Velonakis, P Maghiorakos, A Tzonou, J Barrat, J Proteau, and I Ladopoulos. The relation of birth weight and gestational age to biological, occupational and socioeconomic factors Clin Exp Obstet Gynecol 1997. 24: (4) 232-6. (PubMed)
84. AM Siega-Riz, LS Adair, and CJ Hobel. Maternal underweight status and inadequate rate of weight gain during the third trimester of pregnancy increases the risk of preterm delivery J Nutr 1996. Jan. 126: (1) 146-53. (PubMed)
85. NE Stotland, AB Caughey, M Lahiff, and B Abrams. Weight gain and spontaneous preterm birth: the role of race or ethnicity and previous preterm birth Obstet Gynecol 2006. Dec. 108: (6) 1448-55. (PubMed)
86. LA Schieve, ME Cogswell, and KS Scanlon. Maternal weight gain and preterm delivery: differential effects by body mass index Epidemiology 1999. Mar. 10: (2) 141-7. (PubMed)
87. A Spinillo, E Capuzzo, G Piazzi, A Ferrari, V Morales, and M Di Mario. Risk for spontaneous preterm delivery by combined body mass index and gestational weight gain patterns Acta Obstet Gynecol Scand 1998. Jan. 77: (1) 32-6. (PubMed)
88. MS Kramer, AL Coates, MC Michoud, S Dagenais, EF Hamilton, and A Papageorgiou. Maternal anthropometry and idiopathic preterm labor Obstet Gynecol 1995. Nov. 86: (5) 744-8. (PubMed)
89. SW Wen, RL Goldenberg, GR Cutter, HJ Hoffman, and SP Cliver. Intrauterine growth retardation and preterm delivery: prenatal risk factors in an indigent population Am J Obstet Gynecol 1990. Jan. 162: (1) 213-8. (PubMed)
90. JD Paauw, S Bierling, CR Cook, and AT Davis. Hyperemesis gravidarum and fetal outcome J Parenter Enteral Nutr 2005. Mar-Apr. 29: (2) 93-6.
91. G Di Cianni, R Miccoli, L Volpe, C Lencioni, A Ghio, and MG Giovannitti, et al. Maternal triglyceride levels and newborn weight in pregnant women with normal glucose tolerance Diabet Med 2005. Jan. 22: (1) 21-5.
92. AM Guihard-Costa, E Papiernik, and S Kolb. Maternal predictors of subcutaneous fat in the term newborn Acta Paediatr 2004. Mar. 93: (3) 346-9. (PubMed)
93. S Kirchengast and B Hartmann. Impact of maternal age and maternal somatic characteristics on newborn size Am J Hum Biol 2003. Mar-Apr. 15: (2) 220-8. (PubMed)
94. C Shapiro, VG Sutija, and J Bush. Effect of maternal weight gain on infant birth weight J Perinat Med 2000. 28: (6) 428-31. (PubMed)
95. FF Cherry, HH Sandstead, and AR Wickremasinghe. Adolescent pregnancy. Weight and zinc supplementation effects Ann N Y Acad Sci 1993. Mar 15. 678: 334-7. (PubMed)
96. NS Springer, K Bischoping, CM Sampselle, FL Mayes, and BA Petersen. Using early weight gain and other nutrition-related risk factors to predict pregnancy outcomes J Am Diet Assoc1992. Feb. 92: (2) 217-9. (PubMed)
97. NF Butte, KJ Ellis, WW Wong, JM Hopkinson, and EO Smith. Composition of gestational weight gain impacts maternal fat retention and infant birth weight Am J Obstet Gynecol 2003. Nov. 189: (5) 1423-32. (PubMed)
98. JE Brown, MA Murtaugh, DR Jacobs Jr, and HC Margellos. Variation in newborn size according to pregnancy weight change by trimester Am J Clin Nutr 2002. Jul. 76: (1) 205-9. (PubMed)
99. B Zaren, S Cnattingius, and G Lindmark. Fetal growth impairment from smoking—is it influenced by maternal anthropometry? Acta Obstet Gynecol Scand Suppl 1997. 165: 30-4. (PubMed)
100. A Pezzarossa, N Orlandi, V Baggi, D Dazzi, E Ricciarelli, and F Coppola. Effects of maternal weight variations and gestational diabetes mellitus on neonatal birth weight J Diabetes Complications 1996. Mar-Apr. 10: (2) 78-83. (PubMed)
101. B Abrams and S Selvin. Maternal weight gain pattern and birth weight Obstet Gynecol 1995. Aug. 86: (2) 163-9. (PubMed)
102. ML Hediger, TO Scholl, JI Schall, MF Healey, and RL Fischer. Changes in maternal upper arm fat stores are predictors of variation in infant birth weight J Nutr 1994. Jan. 124: (1) 24-30. (PubMed)
103. JY Groff, PD Mullen, M Mongoven, and K Burau. Prenatal weight gain patterns and infant birthweight associated with maternal smoking Birth: Issues in Perinatal Care 1997. 24: (4) 234-9.
104. B Luke, ML Hediger, and TO Scholl. Point of diminishing returns: when does gestational weight gain cease benefiting birthweight and begin adding to maternal obesity? J Maternal-Fetal Med 1996. 5: (4) 168-73.
105. SK Muscati, K Gray-Donald, and KG Koski. Timing of weight gain during pregnancy: promoting fetal growth and minimizing maternal weight retention Int J Obes Relat Metab Disord 1996. Jun. 20: (6) 526-32. (PubMed)
106. CA Hickey, R Uauy, LM Rodriguez, and LW Jennings. Maternal weight gain in low-income black and Hispanic women: evaluation by use of weight-for-height near term Am J Clin Nutr 1990. Nov. 52: (5) 938-43. (PubMed)
107. E Desjardins and D Hardwick. How many visits by health professionals are needed to make a difference in low birthweight? A dose-response study of the Toronto Healthiest Babies Possible program Can J Public Health 1999. Jul-Aug. 90: (4) 224-8. (PubMed)
108. W Zhou and J Olsen. Gestational weight gain as a predictor of birth and placenta weight according to pre-pregnancy body mass index Acta Obstet Gynecol Scand 1997. Apr. 76: (4) 300-7. (PubMed)
109. JN Lasker, B Coyle, K Li, and M Ortynsky. Assessment of risk factors for low birth weight deliveries Health Care for Women International 2005. 26: (3) 262-80. (PubMed)
110. MM Hedderson, NS Weiss, DA Sacks, DJ Pettitt, JV Selby, and CP Quesenberry, et al. Pregnancy weight gain and risk of neonatal complications: macrosomia, hypoglycemia, and hyperbilirubinemia Obstet Gynecol 2006. Nov. 108: (5) 1153-61. (PubMed)
111. H Takimoto, T Sugiyama, H Fukuoka, N Kato, and N Yoshiike. Maternal weight gain ranges for optimal fetal growth in Japanese women Int J Gynaecol Obstet 2006. Mar. 92: (3) 272-8. (PubMed)
112. RL Bergmann, R Richter, KE Bergmann, A Plagemann, M Brauer, and JW Dudenhausen. Secular trends in neonatal macrosomia in Berlin: influences of potential determinants Paediatr Perinat Epidemiol 2003. Jul. 17: (3) 244-9. (PubMed)
113. T Clausen, TK Burski, N Oyen, K Godang, J Bollerslev, and T Henriksen. Maternal anthropometric and metabolic factors in the first half of pregnancy and risk of neonatal macrosomia in term pregnancies. A prospective study Eur J Endocrinol 2005. Dec. 153: (6) 887-94. (PubMed)
114. DK Steward and DK Moser. Intrauterine growth retardation in full-term newborn infants with birth weights greater than 2,500 g Res Nurs Health 2004. Dec. 27: (6) 403-12. (PubMed)
115. S Bo, G Menato, A Signorile, C Bardelli, A Lezo, and ML Gallo, et al. Obesity or diabetes: what is worse for the mother and for the baby? Diabet Metab 2003. Apr. 29: (2 Pt 1) 175-8.
116. LE Caulfield, RJ Stoltzfus, and FR Witter. Implications of the Institute of Medicine weight gain recommendations for preventing adverse pregnancy outcomes in black and white women Am J Public Health 1998. Aug. 88: (8) 1168-74. (PubMed) (Full Text in PMC)
117. MJ Shepard, LS Bakketeig, G Jacobsen, T O‘Connor, and MB Bracken. Maternal body mass, proportional weight gain, and fetal growth in parous women Paediatr Perinat Epidemiol 1996. Apr. 10: (2) 207-19. (PubMed)
118. JD Parker and B Abrams. Prenatal weight gain advice: an examination of the recent prenatal weight gain recommendations of the Institute of Medicine Obstet Gynecol 1992. May. 79: (5(Pt 1)) 664-9. (PubMed)
119. MG Dawes and JG Grudzinskas. Repeated measurement of maternal weight during pregnancy. Is this a useful practice? Br J Obstet Gynaecol 1991. Feb. 98: (2) 189-94. (PubMed)
120. A Sunehag, C Berne, G Lindmark, and U Ewald. Gestational diabetes-perinatal outcome with a policy of liberal and intensive insulin therapy Ups J Med Sci 1991. 96: (3) 185-98. (PubMed)
121. M Kitajima, S Oka, I Yasuhi, M Fukuda, Y Rii, and T Ishimaru. Maternal serum triglyceride at 24-32 weeks‘ gestation and newborn weight in nondiabetic women with positive diabetic screens Obstet Gynecol 2001. May. 97: (5 Pt 1) 776-80. (PubMed)
122. MS Kramer, M Olivier, FH McLean, GE Dougherty, DM Willis, and RH Usher. Determinants of fetal growth and body proportionality Pediatrics 1990. Jul. 86: (1) 18-26. (PubMed)
123. S Cnattingius, R Bergstrom, L Lipworth, and MS Kramer. Prepregnancy weight and the risk of adverse pregnancy outcomes N Eng J Med 1998. 338: (3) 147-52.
124. CJ Cheng, K Bommarito, A Noguchi, W Holcomb, and T Leet. Body mass index change between pregnancies and small for gestational age births Obstet Gynecol 2004. Aug. 104: (2) 286-92. (PubMed)
125. SA Nixon, MD Avery, and K Savik. Outcomes of macrosomic infants in a nurse-midwifery service J Nurse Midwifery 1998. Jul-Aug. 43: (4) 280-6. (PubMed)
126. EA Nohr, BH Bech, MJ Davies, M Frydenberg, TB Henriksen, and J Olsen. Prepregnancy obesity and fetal death: a study within the Danish National Birth Cohort Obstet Gynecol 2005. Aug. 106: (2) 250-9. (PubMed)
127. LA Bracero and DW Byrne. Optimal maternal weight gain during singleton pregnancy Gynecol Obstet Invest 1998. 46: (1) 9-16. (PubMed)
128. RL Naeye. Maternal body weight and pregnancy outcome Am J Clin Nutr 1990. Aug. 52: (2) 273-9. (PubMed)
129. NE Stotland, YW Cheng, LM Hopkins, and AB Caughey. Gestational weight gain and adverse neonatal outcome among term infants Obstet Gynecol 2006. Sep. 108: (3 Pt 1) 635-43. (PubMed)
130. LG Spector, SM Davies, LL Robison, JM Hilden, M Roesler, and JA Ross. Birth characteristics, maternal reproductive history, and the risk of infant leukemia: a report from the Children‘s Oncology Group Cancer Epidemiol Biomarkers Prev 2007. Jan. 16: (1) 128-34. (PubMed)
131. BR Vohr, ST McGarvey, and CG Coll. Effects of maternal gestational diabetes and adiposity on neonatal adiposity and blood pressure Diabet Care 1995. Apr. 18: (4) 467-75.
132. NA Sowan and ML Stember. Parental risk factors for infant obesity Am J Matern Child Nurs 2000. 25: (5) 234-41.
133. KK Ong, ML Ahmed, PM Emmett, MA Preece, and DB Dunger. Association between postnatal catch-up growth and obesity in childhood: prospective cohort study Br Med J 2000. Apr 8. 320: (7240) 967-71. (PubMed) (Full Text in PMC)
134. C Li, MI Goran, H Kaur, N Nollen, and JS Ahluwalia. Developmental trajectories of overweight during childhood: role of early life factors Obesity (Silver Spring) 2007. Mar. 15: (3) 760-71. (PubMed)
135. W Yuan, O Basso, HT Sorensen, and J Olsen. Maternal prenatal lifestyle factors and infectious disease in early childhood: a follow-up study of hospitalization within a Danish birth cohort Pediatrics 2001. Feb. 107: (2) 357-62. (PubMed)
136. Y Linne, L Dye, B Barkeling, and S Rossner. Weight development over time in parous women—the SPAWN study—15 years follow-up Int J Obes Relat Metab Disord 2003. Dec. 27: (12) 1516-22. (PubMed)
137. HE Harris, GT Ellison, and M Holliday. Is there an independent association between parity and maternal weight gain? Ann Hum Biol 1997. Nov-Dec. 24: (6) 507-19. (PubMed)
138. HE Harris, GT Ellison, M Holliday, and E Lucassen. The impact of pregnancy on the long-term weight gain of primiparous women in England Int J Obes Relat Metab Disord 1997. Sep. 21: (9) 747-55. (PubMed)
139. SC Hunt, MM Daines, TD Adams, EM Heath, and RR Williams. Pregnancy weight retention in morbid obesity Obes Res 1995. Mar. 3: (2) 121-30. (PubMed)
140. ES Parham, MF Astrom, and SH King. The association of pregnancy weight gain with the mother‘s postpartum weight J Am Diet Assoc 1990. Apr. 90: (4) 550-4. (PubMed)
141. L Walker, JH Freeland-Graves, T Milani, G George, H Hanss-Nuss, and M Kim, et al. Weight and behavioral and psychosocial factors among ethnically diverse, low-income women after childbirth: II. Trends and correlates Women Health 2004. 40: (2) 19-34.
142. Y Linne, L Dye, B Barkeling, and S Rossner. Long-term weight development in women: a 15-year follow-up of the effects of pregnancy Obes Res 2004. Jul. 12: (7) 1166-78. (PubMed)
143. H Soltani and RB Fraser. A longitudinal study of maternal anthropometric changes in normal weight, overweight and obese women during pregnancy and postpartum Br J Nutr 2000. Jul. 84: (1) 95-101. (PubMed)
144. HE Harris, GT Ellison, and S Clement. Relative importance of heritable characteristics and lifestyle in the development of maternal obesity J Epidemiol Community Health 1999. Feb. 53: (2) 66-74. (PubMed) (Full Text in PMC)
145. A Ohlin and S Rossner. Maternal body weight development after pregnancy Int J Obes 1990. Feb. 14: (2) 159-73.
146. LK Callaway, HD McIntyre, M O’Callaghan, GM Williams, JM Najman, and DA Lawlor. The association of hypertensive disorders of pregnancy with weight gain over the subsequent 21 years: findings from a prospective cohort study Am J Epidemiol 2007. Aug 15. 166: (4) 421-8. (PubMed)
147. LL Kaiser and L Allen. Position of the American Dietetic Association: nutrition and life-style for a healthy pregnancy outcome J Am Diet Assoc 2002. Oct. 102: (10) 1479-90. (PubMed)
148. L Hilakivi-Clarke, R Luoto, T Huttunen, and M Koskenvuo. Pregnancy weight gain and premenopausal breast cancer risk J Reprod Med 2005. Nov. 50: (11) 811-6. (PubMed)
149. NE Stotland, LM Hopkins, and AB Caughey. Gestational weight gain, macrosomia, and risk of cesarean birth in nondiabetic nulliparas Obstet Gynecol 2004. Oct. 104: (4) 671-7. (PubMed)
150. PS Kaiser and RS Kirby. Obesity as a risk factor for cesarean in a low-risk population Obstet Gynecol 2001. Jan. 97: (1) 39-43. (PubMed)
151. CA Hickey, SP Cliver, SF McNeal, HJ Hoffman, and RL Goldenberg. Prenatal weight gain patterns and spontaneous preterm birth among nonobese black and white women Obstet Gynecol 1995. Jun. 85: (6) 909-14. (PubMed)
152. LA Schieve, ME Cogswell, KS Scanlon, G Perry, C Ferre, and C Blackmore-Prince, et al. Prepregnancy body mass index and pregnancy weight gain: associations with preterm delivery. The NMIHS Collaborative Study Group Obstet Gynecol 2000. Aug. 96: (2) 194-200. (PubMed)
153. JN Nielsen, KO O’Brien, FR Witter, SC Chang, J Mancini, and MS Nathanson, et al. High gestational weight gain does not improve birth weight in a cohort of African American adolescents Am J Clin Nutr 2006. Jul. 84: (1) 183-9. (PubMed)
154. C Stevens-Simon and ER McAnarney. Adolescent pregnancy. Gestational weight gain and maternal and infant outcomes Am J Dis Child 1992. Nov. 146: (11) 1359-64. (PubMed)
155. CA Hickey, SP Cliver, SF McNeal, HJ Hoffman, and RL Goldenberg. Prenatal weight gain patterns and birth weight among nonobese black and white women Obstet Gynecol 1996. Oct. 88: (4 Pt 1) 490-6. (PubMed)
156. CA Hickey, SP Cliver, RL Goldenberg, J Kohatsu, and HJ Hoffman. Prenatal weight gain, term birth weight, and fetal growth retardation among high-risk multiparous black and white women Obstet Gynecol 1993. Apr. 81: (4) 529-35. (PubMed)
157. R May. Prepregnancy weight, inappropriate gestational weight gain, and smoking: Relationships to birth weight Am J Hum Biol 2007. May-Jun. 19: (3) 305-10. (PubMed)
158. TO Scholl, ML Hediger, JI Schall, IG Ances, and WK Smith. Gestational weight gain, pregnancy outcome, and postpartum weight retention Obstet Gynecol 1995. Sep. 86: (3) 423-7. (PubMed)
159. WL Hellerstedt, JH Himes, M Story, IR Alton, and LE Edwards. The effects of cigarette smoking and gestational weight change on birth outcomes in obese and normal-weight women Am J Public Health 1997. Apr. 87: (4) 591-6. (PubMed) (Full Text in PMC)
160. LA Schieve, ME Cogswell, and KS Scanlon. An empiric evaluation of the Institute of Medicine’s pregnancy weight gain guidelines by race Obstet Gynecol 1998. Jun. 91: (6) 878-84. (PubMed)
161. RS Strauss and WH Dietz. Low maternal weight gain in the second or third trimester increases the risk for intrauterine growth retardation J Nutr 1999. May. 129: (5) 988-93. (PubMed)
162. TC Hulsey, D Neal, SC Bondo, T Hulsey, and R Newman. Maternal prepregnant body mass index and weight gain related to low birth weight in South Carolina South Med J 2005. Apr. 98: (4) 411-5. (PubMed)
163. Prenatal weight gain and birth weight among Oklahoma mothers. J Okla State Med Assoc. 1996 Dec;89(12):435-8.
164. L Rode, HK Hegaard, H Kjaergaard, LF Moller, A Tabor, and B Ottesen. Association between maternal weight gain and birth weight Obstet Gynecol 2007. Jun. 109: (6) 1309-15. (PubMed)
165. C Kabali and MM Werler. Pre-pregnant body mass index, weight gain and the risk of delivering large babies among non-diabetic mothers Int J Gynaecol Obstet 2007. May. 97: (2) 100-4. (PubMed) (Full Text in PMC)
166. JL Baker, KF Michaelsen, TI Sorensen, and KM Rasmussen. High prepregnant body mass index is associated with early termination of full and any breastfeeding in Danish women Am J Clin Nutr 2007. Aug. 86: (2) 404-11. (PubMed)
167. R Li, S Jewell, and L Grummer-Strawn. Maternal obesity and breast-feeding practices Am J Clin Nutr 2003. Apr. 77: (4) 931-6. (PubMed)
168. KM Rasmussen, JA Hilson, and CL Kjolhede. Obesity as a risk factor for failure to initiate and sustain lactation Adv Exp Med Biol 2002. 503: 217-22. (PubMed)
169. JA Hilson, KM Rasmussen, and CL Kjolhede. Excessive weight gain during pregnancy is associated with earlier termination of breast-feeding among White women J Nutr 2006. Jan. 136: (1) 140-6. (PubMed)
170. LO Walker, GM Timmerman, BS Sterling, M Kim, and P Dickson. Do low-income women attain their pre-pregnant weight by the 6th week of postpartum? Ethn Dis 2004. Winter. 14: (1) 119-26. (PubMed)
171. AR Amorim, S Rossner, M Neovius, PM Lourenco, and Y Linne. Does excess pregnancy weight gain constitute a major risk for increasing long-term BMI? Obesity (Silver Spring) 2007. May. 15: (5) 1278-86. (PubMed)
172. LO Walker. Predictors of weight gain at 6 and 18 months after childbirth: a pilot study J Obstet Gynecol Neonat Nurs 1996. 25: (1) 39-48.
173. Keppel KG, Taffel SM. Pregnancy-related weight gain and retention: implications of the 1990 Institute of Medicine guidelines. Am J Pub Health.83(8):1100-3.
174. BL Rooney and CW Schauberger. Excess pregnancy weight gain and long-term obesity: one decade later Obstet Gynecol 2002. Aug. 100: (2) 245-52. (PubMed)
175. CM Olson, MS Strawderman, PS Hinton, and TA Pearson. Gestational weight gain and postpartum behaviors associated with weight change from early pregnancy to 1 y postpartum Int J Obes Relat Metab Disord 2003. Jan. 27: (1) 117-27. (PubMed)
176. BL Rooney, CW Schauberger, and MA Mathiason. Impact of perinatal weight change on long-term obesity and obesity-related illnesses Obstet Gynecol 2005. 106: (6) 1349-56. (PubMed)
177. EP Gunderson, B Abrams, and S Selvin. The relative importance of gestational gain and maternal characteristics associated with the risk of becoming overweight after pregnancy Int J Obes Relat Metab Disord 2000. Dec. 24: (12) 1660-8. (PubMed)
178. G Larciprete, H Valensise, B Vasapollo, F Altomare, R Sorge, and B Casalino, et al. Body composition during normal pregnancy: reference ranges Acta Diabetol 2003. Oct. 40: Suppl 1 S225-32. (PubMed)
179. A Sohlstrom, LO Wahlund, and E Forsum. Total body fat and its distribution during human reproduction as assessed by magnetic resonance imaging Basic Life Sci 1993. 60: 181-4. (PubMed)
180. A Paxton, SA Lederman, SB Heymsfield, J Wang, JC Thornton, and RN Pierson Jr. Anthropometric equations for studying body fat in pregnant women Am J Clin Nutr 1998. Jan. 67: (1) 104-10. (PubMed)
181. L Jovanovic-Peterson, J Crues, E Durak, and CM Peterson. Magnetic resonance imaging in pregnancies complicated by gestational diabetes predicts infant birthweight ratio and neonatal morbidity Am J Perinatol 1993. Nov. 10: (6) 432-7. (PubMed)
182. JL Bartha, P Marin-Segura, NL Gonzalez-Gonzalez, F Wagner, M Aguilar-Diosdado, and B Hervias-Vivancos. Ultrasound evaluation of visceral fat and metabolic risk factors during early pregnancy Obesity (Silver Spring) 2007. Sep. 15: (9) 2233-9. (PubMed)
183. DF Williamson, J Madans, RF Anda, JC Kleinman, GA Giovino, and T Byers. Smoking cessation and severity of weight gain in a national cohort N Engl J Med 1991. Mar 14. 324: (11) 739-45. (PubMed)
184. M Viswanathan, AG Visco, K Hartmann, ME Wechter, G Gartlehner, and JM Wu, et al. Cesarean delivery on maternal request Evid Rep Technol Assess (Full Rep) 2006. Mar. (133) 1-138.
185. MW Carpenter, SP Sady, MA Sady, B Haydon, DR Coustan, and PD Thompson. Effect of maternal weight gain during pregnancy on exercise performance J Appl Physiol 1990. Mar. 68: (3) 1173-6. (PubMed)
186. CS Johnston, FS Christopher, and LA Kandell. Pregnancy weight gain in adolescents and young adults J Am Coll Nutr 1991. Jun. 10: (3) 185-9. (PubMed)
187. S Groth. Are the Institute of Medicine recommendations for gestational weight gain appropriate for adolescents? J Obstet Gynecol Neonatal Nurs 2007. Jan-Feb. 36: (1) 21-7.
188. MI Cedergren. Optimal gestational weight gain for body mass index categories Obstet Gynecol 2007. Oct. 110: (4) 759-64. (PubMed)
189. E von Elm, DG Altman, M Egger, SJ Pocock, PC Gotzsche, and JP Vandenbroucke. The Strengthening the Reporting of Observational Studies in Epidemiology (STROBE) statement: guidelines for reporting observational studies J Clin Epidemiol 2008. Apr. 61: (4) 344-9. (PubMed)


