
APPENDIX G
Consultant Reports
As part of its approach, the committee commissioned analyses from consultants to aid in decision making by providing information not readily available in current literature. Dr. Ellen Nohr from Aarhus University, Denmark, provided analyses from the Danish National Birth Cohort on low and very high categories of gestational weight gain (GWG), as well as data for obese class I, II and III women. Additionally, she provided information on subgroups pregnant women, such as primiparous, short and young women, and smokers (see Part I). Dr. Amy Herring, University of North Carolina, provided data from the 1988 National Maternal and Infant Health Survey (NMIHS) on the association between GWG and pregnancy outcomes by race. She provided additional analyses on the association between GWG and postpartum weight retention by linking the 1988 NMIHS to its 1991 follow-up (see Part II). Dr. Cheryl Stein, Mount Sanai School of Medicine, provided data on adverse outcomes associated with GWG stratified by racial/ethnic group using births data from 1995-2003 in New York City (see Part III). Dr. James Hammitt, Harvard University, conducted a quantitative analysis of risk trade-offs between maternal and child health outcomes associated with GWG (see Part IV).
PART I:
ANALYSES FROM DR. NOHR
COMBINED ASSOCIATIONS OF PREPREGNANCY BODY MASS INDEX AND GESTATIONAL WEIGHT GAIN WITH THE OUTCOME OF PREGNANCY. ANALYSES BASED ON THE DANISH NATIONAL BIRTH COHORT
Ellen Aagaard Nohr, PhD
Associate Professor of Epidemiology
University of Aarhus, Denmark
The combined associations of prepregnancy body mass index (BMI) and gestational weight gain on pregnancy outcomes have until recent years mostly focused on birth weight. Large data collections with detailed information about maternal characteristics and pregnancy outcomes are now available which makes it possible to investigate these associations in a broader range of maternal and neonatal outcomes while adjusting for important maternal life style factors. Such a study based on the Danish National Birth Cohort (DNBC) (Nohr et al., 2008) was presented to the Committee to Reexamine IOM Pregnancy Weight Guidelines in June 2008 along with a number of analyses that focused on the BMI-specific association between GWG and all outcomes included in the study. These supplementary analyses are presented in the following in the “First DNBC Report.” At the meeting in June, the IOM committee requested new analyses for some outcomes where very low and very high categories of GWG as well as obese class I and obese class II + III were included. This work is presented in the “Second DNBC Report.” In August 2008, additional analyses were presented for the IOM committee that provided information in subgroups of women defined by parity, height, smoking and young age. These results are presented in the “Third DNBC Report.”
First DNBC Report
Study Population
The Danish National Birth Cohort (DNBC) is a nationwide study of 100,419 pregnancies among 92,274 women recruited 1996-2002. More detailed descriptions of the study methods and the recruitment were previously published (Olsen et al., 2001; Nohr et al., 2006; Danish National Birth Cohort homepage, available online: http://www.ssi.dk/sw9314.asp [accessed February 2009]). Briefly, data were collected during two telephone interviews during pregnancy at approximately 16 and 30 weeks of
gestation, and two telephone interviews after birth when the child was approximately 6 and 18 months old. The women included in the cohort were mostly Caucasians as only 4 percent were born outside Scandinavia.
This study used information about 60,892 liveborn, full-term singleton (≥ 37 wk of gestation) infants whose mothers had participated in the first pregnancy and the first postpartum interview and provided information about prepregnancy BMI, GWG and postpartum weight retention 6 months after birth. In the following, the data and methods of the study will be shortly presented. A more detailed description has been published (Nohr et al., 2008).
Independent Variables
The main exposures were prepregnancy BMI and GWG. In the first pregnancy interview, the women reported their prepregnancy weight and height, which was used to calculate their prepregnancy BMI and categorize them according to the World’s Health Organization’s definitions as underweight (BMI < 18.5 kg/m2), normal weight (18.5 ≤ BMI < 25 kg/m2), overweight (25 ≤ BMI < 30 kg/m2), and obese (BMI ≥ 30 kg/m2) (WHO, 2000). Gestational weight gain was based on information from the telephone interview 6 months after birth. At this time, the woman was asked “How much (in kg) was your total gain in pregnancy?” Her response was divided into four categories: low (< 10 kg) medium (10-15 kg), high (16-19 kg, and very high (≥ 20 kg). The medium category, which has been associated with minimum infant mortality in other populations (IOM, 1990) was used as reference.
From the first pregnancy interview, we also used information about the mother’s age at conception, parity, smoking, alcohol intake and physical exercise during pregnancy, and social status defined by education and occupation. Information about duration of breastfeeding was reported by the women in the first postpartum interview. The categorization of these variables is described in greater detail elsewhere (Nohr et al., 2008).
Maternal Outcomes
Pregnancy outcomes during late pregnancy included preeclampsia/eclampsia, chronic/gestational hypertension and gestational diabetes and were identified through linkage to the National Hospital Discharge Register. Because we suspected some underreporting of gestational diabetes, we added self-reported information about this disease from the pregnancy interviews.
Birth complications were also identified in the National Hospital Discharge Register and included instrumental deliveries, which in nearly all
cases covered vacuum extraction, and planned and emergency cesarean deliveries. The latter type covered cesarean section carried out when the woman was in labor.
Postpartum weight retention was calculated as the difference between the woman’s prepregnancy weight and her weight 6 months postpartum as reported in the first postpartum interview. Postpartum weight retention was summarized by two variables defined as postpartum weight loss (loss ≥ 2 kg) and postpartum weight retention (gain of ≥ 5 kg) relative to a woman’s prepregnancy weight. In the same way, postpartum weight retention at 18 months was calculated for those women in the study population who participated in the second postpartum interview, who had not given birth again and who were not pregnant again (39,776 women).
Neonatal Outcomes
Neonatal outcomes were identified in the National Birth Register and included birth weight, length, gestational age as recorded at birth, and Apgar score after 5 minutes. Birth weight was standardized by gestational age according to the reference curve of Marsal et al. (1996). Standardized birth weight was dicotomized into either a small-for-gestational age (SGA) infant (z-score < 10th percentile) or a large-for-gestational age (LGA) infant (z-score > 90th percentile). Additionally, results for SGA defined as a z-score < 2.5th percentile and for birth weight > 4000 gram were presented.
To estimate the relative fat tissue of the infant, we calculated ponderal index of the newborn (birth weight in grams divided by the birth length in cm cubed). We defined low ponderal index as values < 10th percentile and high ponderal index as values > 90th percentile. Low Apgar score was defined as a value < 8 after 5 min.
Statistical Methods
A BMI- and GWG-specific variable was generated by cross-classifying BMI group (four categories) and GWG group (four categories). In multiple logistic regression models, the associations between this variable and pregnancy outcomes were estimated. This corresponds to the full model with an interaction term between the original BMI and GWG variables. Normal weight women with medium GWG (10-15 kg) were used as reference. These models were adjusted for a number of maternal characteristics and lifestyle factors and for gestational age at birth. In the analyses of birth complications, neonatal complications, and postpartum weight retention, women with preeclampsia and gestational diabetes were excluded (n = 1,787). In the analyses of emergency cesarean deliveries, women with a planned cesarean were excluded, and in the analyses of instrumental de-
liveries, all women with cesarean deliveries were excluded. In all adjusted models, Wald’s test with nine degrees of freedom and a significance level of 0.05 (two sided p-value) was used to assess the hypothesis that there was no effect modification by BMI group of the association between GWG and pregnancy outcomes.
Because we observed that background risks of most pregnancy outcomes increased with increasing BMI groups in a way that was not well reflected in a multiplicative model, we also used an additive approach to the data. Thus, we used the calculated odds ratios from the above models to compute 16 absolute adjusted risks for each pregnancy outcome according to each category within the BMI- and GWG-specific variable for a woman with a given set of confounder categories: She was primiparous, 25-29 years old, 1.60-1.69 m tall, reported no smoking, no alcohol intake and no exercise during pregnancy, was of high social status and gave birth after 280 days of conception. For postpartum weight retention, she breastfed < 14 weeks.
Results
Figures G-1 through G-18 (and corresponding tables, G-1 through G-18) in this report are supplementary to the study by Nohr et al. (2008). The first 17 figures display odds ratios and adjusted absolute risks for different outcomes. In Figure G-18, the absolute risks for four important outcomes are stratified on BMI group and combined to evaluate the “trade-off” between mother and infant according to GWG:
-
Figures G-2A/G-2B (Tables G-2A/G-2B): Other hypertensive disorders
-
Figures G-4A/G-4B (Tables G-4A/G-4B): SGA infant (< 2.5th percentile)
-
Figures G-5A/G-5B (Tables G-5A/G-5B): SGA infant (< 10th percentile)
-
Figures G-6A/G-6B (Tables G-6A/G-6B): LGA infant (> 90th percentile)
-
Figures G-8A/G-8B (Tables G-8A/G-8B): High ponderal index (> 90th percentile)
-
Figures G-9A/G-9B (Tables G-9A/G-9B): Low ponderal index (< 10th percentile)
-
Figures G-10A/G-10B (Tables G-10A/G-10B): Caesarean delivery before labor (planned)
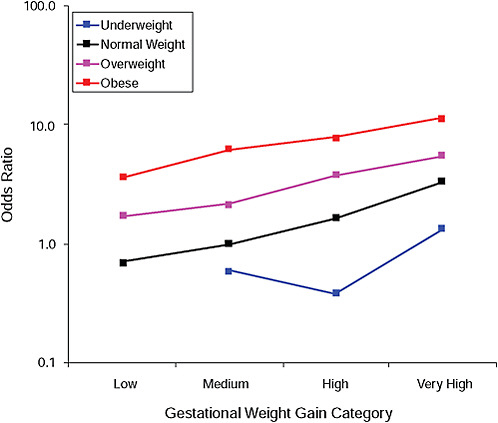
FIGURE G-1A Preeclampsia.
NOTE: Full model. Odds ratios adjusted for age, parity, height, smoking, alcohol consumption, social status, exercise, gestational age (days).
TABLE G-1A Preeclampsia, Adjusted Odds Ratios (gestational weight gain by BMI)
|
|
Low |
Moderate |
High |
Very High |
|
Underweight |
0.0 |
0.6 |
0.4 |
1.3 |
|
Normal weight |
0.7 |
1.0 |
1.6 |
3.3 |
|
Overweight |
1.7 |
2.1 |
3.8 |
5.4 |
|
Obese |
3.6 |
6.1 |
7.7 |
11.2 |
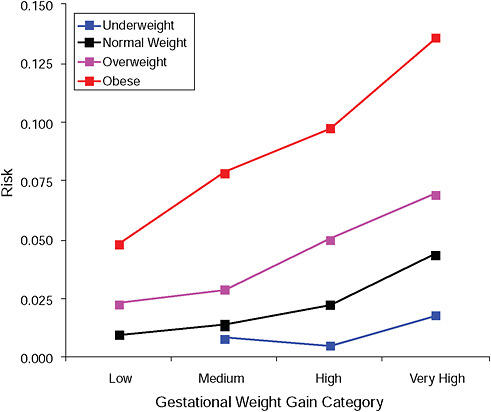
FIGURE G-1B Preeclampsia.
NOTE: Absolute risks derived from odds ratios. Presents risk of a primiparous woman, age 25-29, height 1.60-1.69, nonsmoker, no alcohol consumption, high social status, no exercise, 280 days of gestation.
TABLE G-1B Preeclampsia, Adjusted Risks (gestational weight gain by BMI)
|
|
Low |
Moderate |
High |
Very High |
|
Underweight |
|
0.8% |
0.5% |
0.8% |
|
Normal weight |
1.0% |
1.4% |
2.2% |
4.4% |
|
Overweight |
2.3% |
2.9% |
5.0% |
7.0% |
|
Obese |
4.8% |
7.9% |
9.7% |
13.6% |
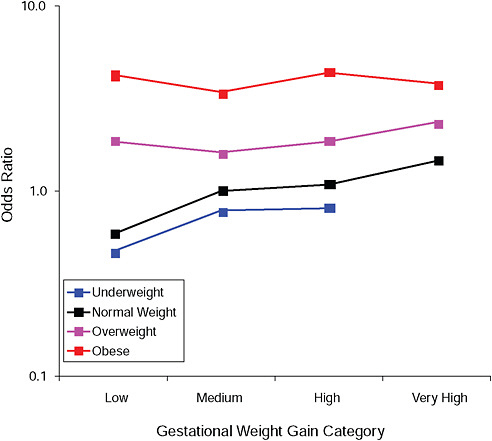
FIGURE G-2A Hypertensive disorders.
NOTE: Full model. Odds ratios adjusted for age, parity, height, smoking, alcohol consumption, social status, exercise, gestational age (days).
TABLE G-2A Hypertensive Disorders, Adjusted Odds Ratios (gestational weight gain by BMI)
|
|
Low |
Moderate |
High |
Very High |
|
Underweight |
0.5 |
0.8 |
0.8 |
0.0 |
|
Normal weight |
0.6 |
1.0 |
1.1 |
1.5 |
|
Overweight |
1.8 |
1.6 |
1.8 |
2.3 |
|
Obese |
4.2 |
3.4 |
4.3 |
3.8 |
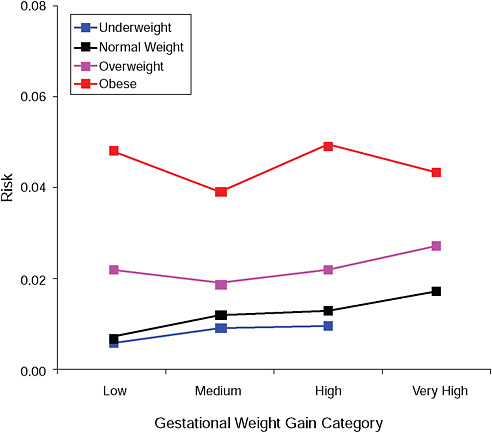
FIGURE G-2B Hypertensive disorders.
NOTE: Absolute risks derived from odds ratios. Presents risk of a primiparous woman, age 25-29, height 1.60-1.69, nonsmoker, no alcohol consumption, high social status, no exercise, 280 days of gestation.
TABLE G-2B Hypertensive Disorders, Adjusted Risks (gestational weight gain by BMI)
|
|
Low |
Moderate |
High |
Very High |
|
Underweight |
0.6% |
0.9% |
1.0% |
|
|
Normal weight |
0.7% |
1.2% |
1.3% |
1.7% |
|
Overweight |
2.2% |
1.9% |
2.2% |
2.7% |
|
Obese |
4.8% |
3.9% |
4.9% |
4.3% |
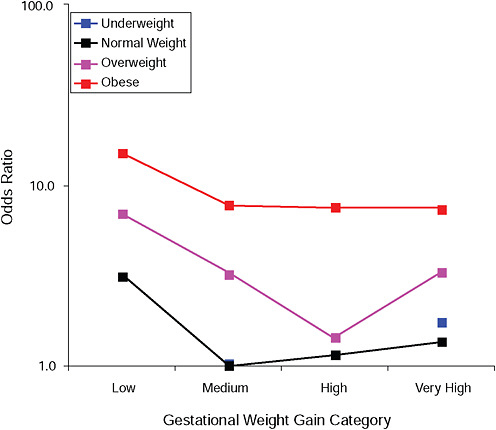
FIGURE G-3A Gestational diabetes.
NOTE: Full model. Odds ratios adjusted for age, parity, height, smoking, alcohol consumption, social status, exercise, gestational age (days).
TABLE G-3A Gestational Diabetes, Adjusted Odds Ratios (gestational weight gain by BMI)
|
|
Low |
Moderate |
High |
Very High |
|
Underweight |
0.0 |
1.0 |
0.0 |
1.7 |
|
Normal weight |
3.2 |
1.0 |
1.2 |
1.4 |
|
Overweight |
7.0 |
3.2 |
1.4 |
3.2 |
|
Obese |
15.1 |
7.7 |
7.5 |
7.4 |
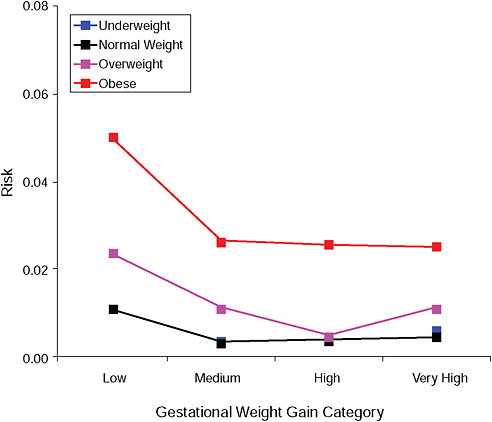
FIGURE G-3B Gestational diabetes.
NOTE: Absolute risks derived from odds ratios. Presents risk of a primiparous woman, age 25-29, height 1.60-1.69, nonsmoker, no alcohol consumption, high social status, no exercise, 280 days of gestation.
TABLE G-3B Gestational Diabetes, Adjusted Risks (gestational weight gain by BMI)
|
|
Low |
Moderate |
High |
Very High |
|
Underweight |
|
0.4% |
|
0.6% |
|
Normal weight |
1.1% |
0.4% |
0.4% |
0.5% |
|
Overweight |
2.4% |
1.1% |
0.5% |
1.1% |
|
Obese |
5.0% |
2.6% |
2.6% |
2.5% |
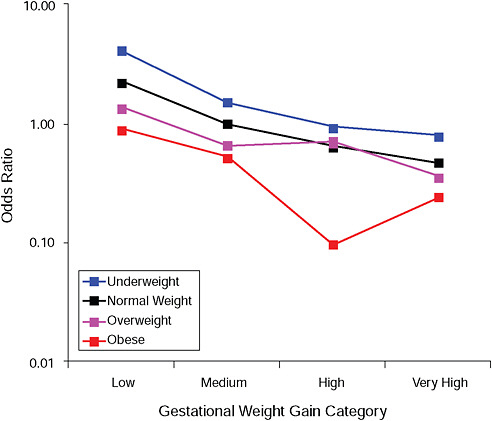
FIGURE G-4A Small-for-gestational-age infant (< 2.5 percent).
NOTE: Full model. Odds ratios adjusted for age, parity, height, smoking, alcohol consumption, social status, exercise, gestational age (days).
TABLE G-4A Small-for-Gestational-Age Infant (< 2.5 percent), Adjusted Odds Ratios (gestational weight gain by BMI)
|
|
Low |
Moderate |
High |
Very High |
|
Underweight |
4.1 |
1.5 |
0.9 |
0.8 |
|
Normal weight |
2.2 |
1.0 |
0.6 |
0.5 |
|
Overweight |
1.4 |
0.7 |
0.7 |
0.4 |
|
Obese |
0.9 |
0.5 |
0.1 |
0.2 |
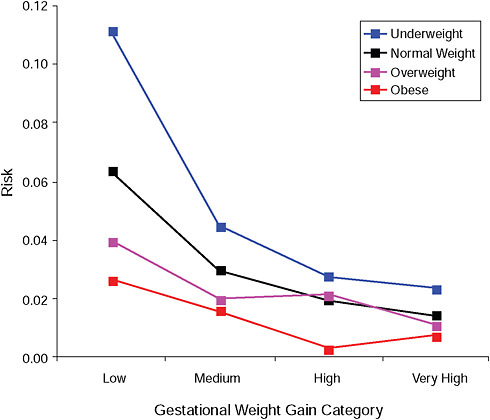
FIGURE G-4B Small-for-gestational-age infant (< 2.5 percent).
NOTE: Absolute risks derived from odds ratios. Presents risk of a primiparous woman, age 25-29, height 1.60-1.69, nonsmoker, no alcohol consumption, high social status, no exercise, 280 days of gestation.
TABLE G-4B Small-for-Gestational-Age Infant (< 2.5 percent), Adjusted Risks (gestational weight gain by BMI)
|
|
Low |
Moderate |
High |
Very High |
|
Underweight |
11.1% |
4.5% |
2.8% |
2.4% |
|
Normal weight |
6.3% |
3.0% |
1.9% |
1.4% |
|
Overweight |
4.0% |
2.0% |
2.1% |
1.1% |
|
Obese |
2.7% |
1.6% |
0.3% |
0.7% |
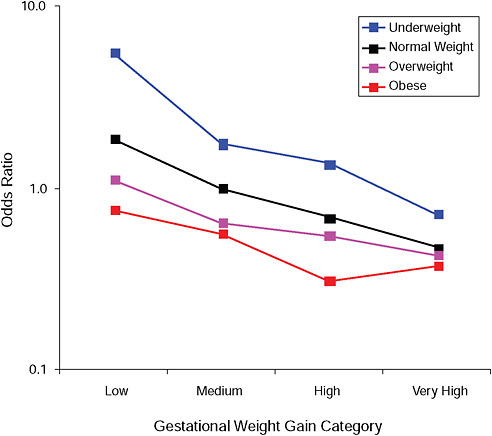
FIGURE G-5A Small-for-gestational-age infant (< 10 percent).
NOTE: Full model. Odds ratios adjusted for age, parity, height, smoking, alcohol consumption, social status, exercise, gestational age (days).
TABLE G-5A Small-for-Gestational-Age Infant (< 10 percent), Adjusted Odds Ratios (gestational weight gain by BMI)
|
|
Low |
Moderate |
High |
Very High |
|
Underweight |
5.5 |
1.7 |
1.4 |
0.7 |
|
Normal weight |
1.9 |
1.0 |
0.7 |
0.5 |
|
Overweight |
1.1 |
0.6 |
0.5 |
0.4 |
|
Obese |
0.8 |
0.6 |
0.3 |
0.4 |
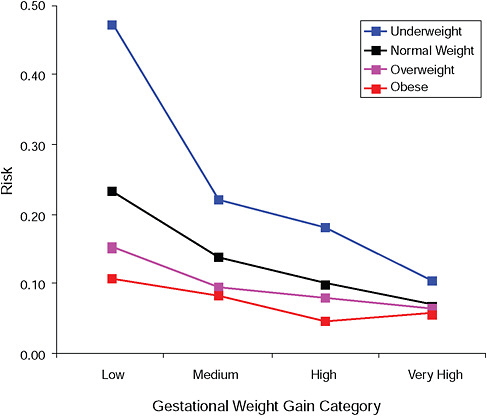
FIGURE G-5B Small-for-gestational-age infant (< 10 percent).
NOTE: Absolute risks derived from odds ratios. Presents risk of a primiparous woman, age 25-29, height 1.60-1.69, nonsmoker, no alcohol consumption, high social status, no exercise, 280 days of gestation.
TABLE G-5B Small-for-Gestational-Age Infant (< 10 percent), Adjusted Risks (gestational weight gain by BMI)
|
|
Low |
Moderate |
High |
Very High |
|
Underweight |
47.3% |
22.1% |
18.2% |
10.5% |
|
Normal weight |
23.3% |
14.0% |
10.1% |
7.1% |
|
Overweight |
15.4% |
9.5% |
8.2% |
6.5% |
|
Obese |
10.9% |
8.4% |
4.8% |
5.8% |
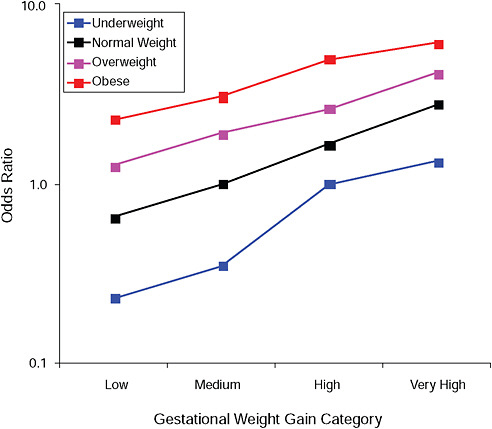
FIGURE G-6A Large-for-gestational-age infant (> 90 percent).
NOTE: Full model. Odds ratios adjusted for age, parity, height, smoking, alcohol consumption, social status, exercise, gestational age (days).
TABLE G-6A Large-for-Gestational-Age Infant (> 90 percent), Adjusted Odds Ratios (gestational weight gain by BMI)
|
|
Low |
Moderate |
High |
Very High |
|
Underweight |
0.2 |
0.3 |
1.0 |
1.3 |
|
Normal weight |
0.6 |
1.0 |
1.6 |
2.8 |
|
Overweight |
1.3 |
1.9 |
2.6 |
4.1 |
|
Obese |
2.3 |
3.1 |
5.0 |
6.1 |
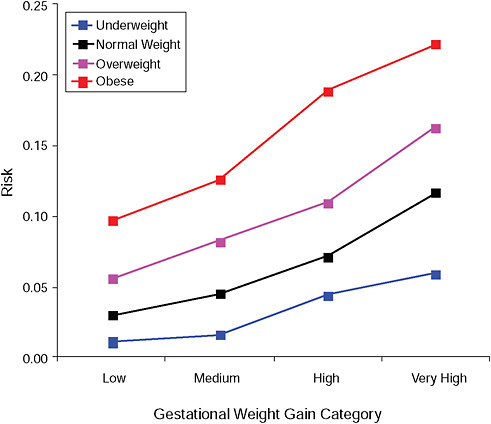
FIGURE G-6B Large-for-gestational-age infant (> 90 percent).
NOTE: Absolute risks derived from odds ratios. Presents risk of a primiparous woman, age 25-29, height 1.60-1.69, nonsmoker, no alcohol consumption, high social status, no exercise, 280 days of gestation.
TABLE G-6B Large-for-Gestational-Age Infant (> 90 percent), Adjusted Risks (gestational weight gain by BMI)
|
|
Low |
Moderate |
High |
Very High |
|
Underweight |
1.1% |
1.6% |
4.4% |
5.9% |
|
Normal weight |
2.9% |
4.5% |
7.2% |
11.6% |
|
Overweight |
5.6% |
8.2% |
11.0% |
16.3% |
|
Obese |
9.7% |
12.6% |
18.9% |
22.2% |
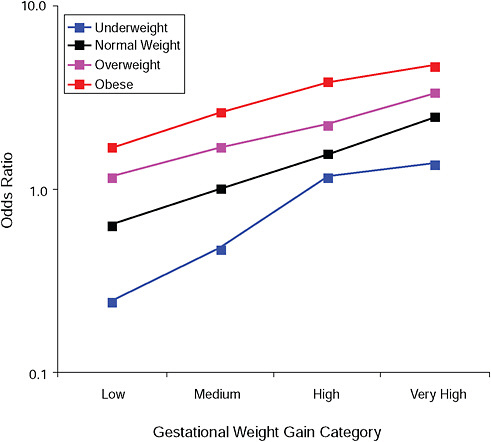
FIGURE G-7A Birth weight > 4,000 g.
NOTE: Full model. Odds ratios adjusted for age, parity, height, smoking, alcohol consumption, social status, exercise, gestational age (days).
TABLE G-7A Birth Weight > 4,000 g, Adjusted Odds Ratios (gestational weight gain by BMI)
|
|
Low |
Moderate |
High |
Very High |
|
Underweight |
0.2 |
0.5 |
1.2 |
1.4 |
|
Normal weight |
0.6 |
1.0 |
1.6 |
2.5 |
|
Overweight |
1.2 |
1.7 |
2.6 |
3.4 |
|
Obese |
1.7 |
2.6 |
3.8 |
4.7 |
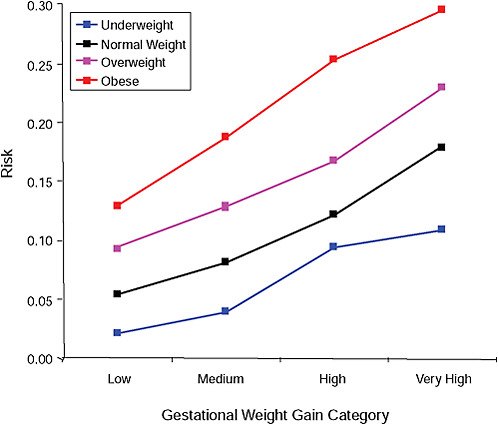
FIGURE G-7B Birth weight > 4,000 g.
NOTE: Absolute risks derived from odds ratios. Presents risk of a primiparous woman, age 25-29, height 1.60-1.69, nonsmoker, no alcohol consumption, high social status, no exercise, 280 days of gestation.
TABLE G-7B Adjusted Risks (gestational weight gain by BMI)
|
|
Low |
Moderate |
High |
Very High |
|
Underweight |
2.1% |
4.0% |
9.4% |
10.9% |
|
Normal weight |
5.4% |
8.2% |
12.3% |
17.9% |
|
Overweight |
9.4% |
12.9% |
16.7% |
23.0% |
|
Obese |
12.9% |
18.8% |
25.4% |
29.5% |
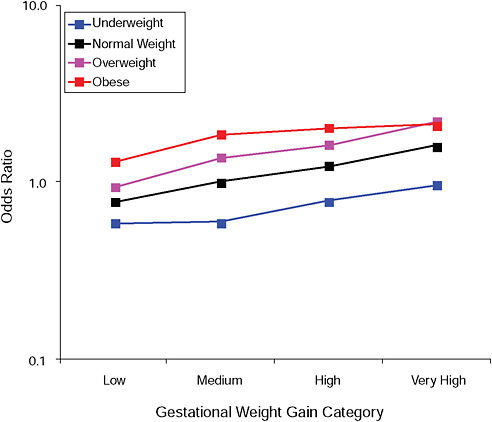
FIGURE G-8A High Ponderal Index (> 90 percent).
NOTE: Full model. Odds ratios adjusted for age, parity, height, smoking, alcohol consumption, social status, exercise, gestational age (days).
TABLE G-8A High Ponderal Index (> 90 percent), Adjusted Odds Ratios (gestational weight gain by BMI)
|
|
Low |
Moderate |
High |
Very High |
|
Underweight |
0.6 |
0.6 |
0.8 |
1.0 |
|
Normal weight |
0.8 |
1.0 |
1.2 |
1.6 |
|
Overweight |
0.9 |
1.4 |
1.6 |
2.2 |
|
Obese |
1.3 |
1.9 |
2.0 |
2.1 |
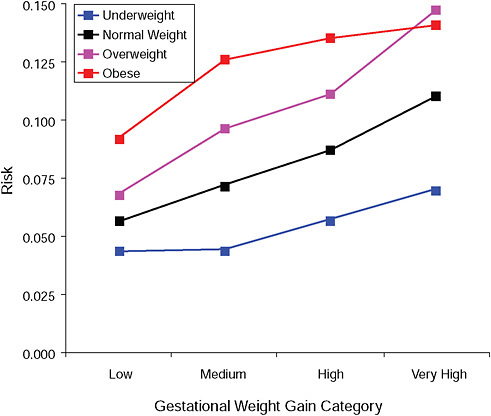
FIGURE G-8B High Ponderal Index (> 90 percent).
NOTE: Absolute risks derived from odds ratios. Presents risk of a primiparous woman, age 25-29, height 1.60-1.69, nonsmoker, no alcohol consumption, high social status, no exercise, 280 days of gestation.
TABLE G-8B High Ponderal Index (> 90 percent), Adjusted Risks (gestational weight gain by BMI)
|
|
Low |
Moderate |
High |
Very High |
|
Underweight |
4.4% |
4.4% |
5.7% |
7.0% |
|
Normal weight |
5.7% |
7.2% |
8.8% |
11.0% |
|
Overweight |
6.8% |
9.7% |
11.1% |
14.7% |
|
Obese |
9.2% |
12.6% |
13.6% |
14.1% |
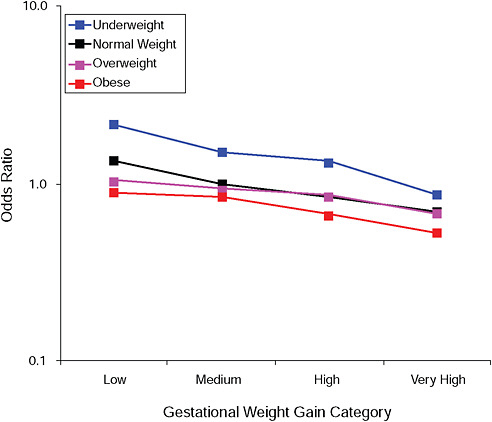
FIGURE G-9A Low Ponderal Index (< 10 percent).
NOTE: Full model. Odds ratios adjusted for age, parity, height, smoking, alcohol consumption, social status, exercise, gestational age (days).
TABLE G-9A Low Ponderal Index (< 10 percent), Adjusted Odds Ratios (gestational weight gain by BMI)
|
|
Low |
Moderate |
High |
Very High |
|
Underweight |
2.1 |
1.5 |
1.3 |
0.9 |
|
Normal weight |
1.3 |
1.0 |
0.8 |
0.7 |
|
Overweight |
1.0 |
0.9 |
0.9 |
0.7 |
|
Obese |
0.9 |
0.8 |
0.7 |
0.5 |
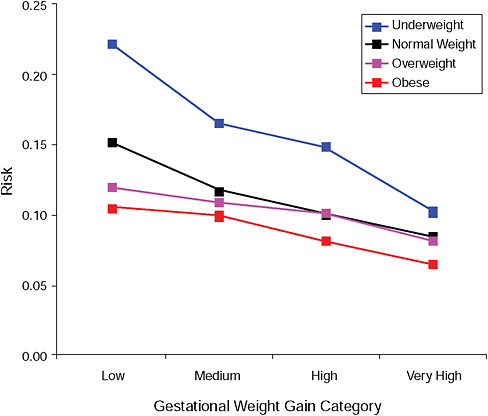
FIGURE G-9B Low Ponderal Index (< 10 percent).
NOTE: Absolute risks derived from odds ratios. Presents risk of a primiparous woman, age 25-29, height 1.60-1.69, nonsmoker, no alcohol consumption, high social status, no exercise, 280 days of gestation.
TABLE G-9B Adjusted Risks (gestational weight gain by BMI)
|
|
Low |
Moderate |
High |
Very High |
|
Underweight |
22.2% |
16.6% |
14.9% |
10.3% |
|
Normal weight |
15.2% |
11.7% |
10.1% |
8.4% |
|
Overweight |
12.0% |
10.9% |
10.2% |
8.2% |
|
Obese |
10.5% |
9.9% |
8.1% |
6.5% |
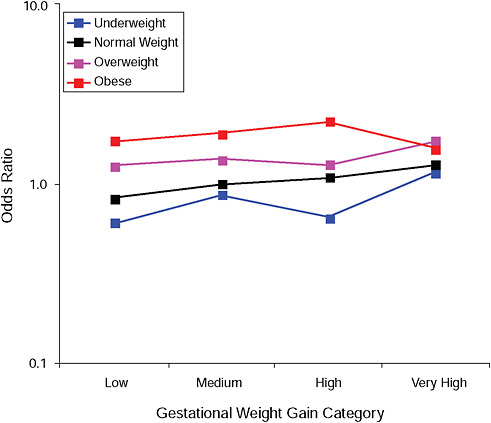
FIGURE G-10A Cesarean delivery before labor.
NOTE: Full model. Odds ratios adjusted for age, parity, height, smoking, alcohol consumption, social status, exercise, gestational age (days).
TABLE G-10A Cesarean Delivery Before Labor, Adjusted Odds Ratios (gestational weight gain by BMI)
|
|
Low |
Moderate |
High |
Very High |
|
Underweight |
0.6 |
0.9 |
0.6 |
1.2 |
|
Normal weight |
0.8 |
1.0 |
1.1 |
1.3 |
|
Overweight |
1.2 |
1.4 |
1.3 |
1.7 |
|
Obese |
1.7 |
1.9 |
2.2 |
1.6 |
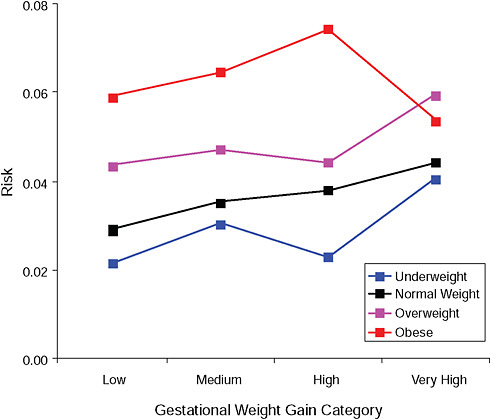
FIGURE G-10B Cesarean delivery before labor.
NOTE: Absolute risks derived from odds ratios. Presents risk of a primiparous woman, age 25-29, height 1.60-1.69, nonsmoker, no alcohol consumption, high social status, no exercise, 280 days of gestation.
TABLE G-10B Cesarean Delivery Before Labor, Adjusted Risks (gestational weight gain by BMI)
|
|
Low |
Moderate |
High |
Very High |
|
Underweight |
2.2% |
3.1% |
2.3% |
4.1% |
|
Normal weight |
2.9% |
3.5% |
3.8% |
4.4% |
|
Overweight |
4.4% |
4.7% |
4.4% |
6.0% |
|
Obese |
5.9% |
6.5% |
7.4% |
5.4% |
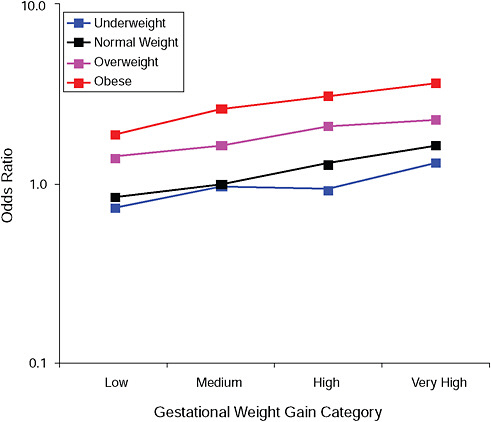
FIGURE G-11A Cesarean delivery during labor.
NOTE: Full model. Odds ratios adjusted for age, parity, height, smoking, alcohol consumption, social status, exercise, gestational age (days).
TABLE G-11A Cesarean Delivery During Labor, Adjusted Odds Ratios (gestational weight gain by BMI)
|
|
Low |
Moderate |
High |
Very High |
|
Underweight |
0.7 |
1.0 |
0.9 |
1.3 |
|
Normal weight |
0.8 |
1.0 |
1.3 |
1.6 |
|
Overweight |
1.4 |
1.6 |
2.1 |
2.3 |
|
Obese |
1.9 |
2.6 |
3.0 |
3.6 |
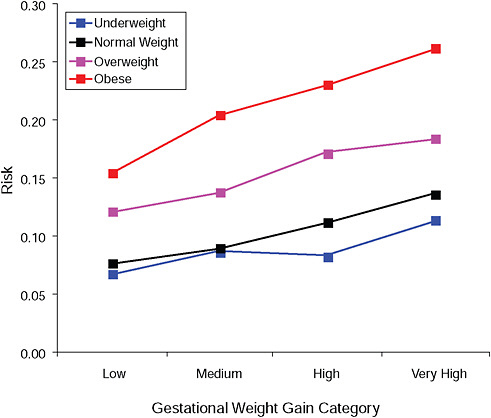
FIGURE G-11B Cesarean delivery during labor.
NOTE: Absolute risks derived from odds ratios. Presents risk of a primiparous woman, age 25-29, height 1.60-1.69, nonsmoker, no alcohol consumption, high social status, no exercise, 280 days of gestation.
TABLE G-11B Cesarean Delivery During Labor, Adjusted Risks (gestational weight gain by BMI)
|
|
Low |
Moderate |
High |
Very High |
|
Underweight |
6.7% |
8.7% |
8.3% |
11.4% |
|
Normal weight |
7.6% |
9.0% |
11.2% |
13.7% |
|
Overweight |
12.1% |
13.8% |
17.2% |
18.4% |
|
Obese |
15.5% |
20.4% |
23.1% |
26.2% |
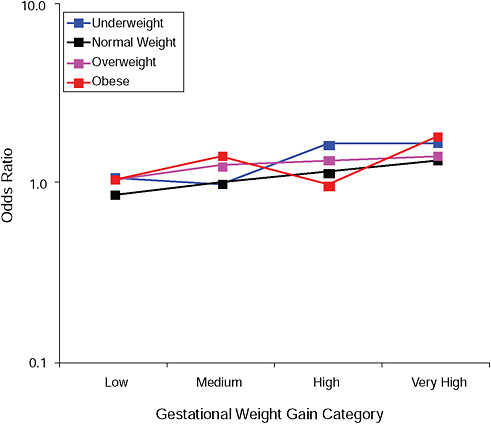
FIGURE G-12A Instrumental deliveries.
NOTE: Full model. Odds ratios adjusted for age, parity, height, smoking, alcohol consumption, social status, exercise, gestational age (days).
TABLE G-12A Instrumental Deliveries, Adjusted Odds Ratios (gestational weight gain by BMI)
|
|
Low |
Moderate |
High |
Very High |
|
Underweight |
1.1 |
1.0 |
1.7 |
1.7 |
|
Normal weight |
0.9 |
1.0 |
1.1 |
1.3 |
|
Overweight |
1.0 |
1.3 |
1.4 |
1.4 |
|
Obese |
1.0 |
1.4 |
1.0 |
1.8 |
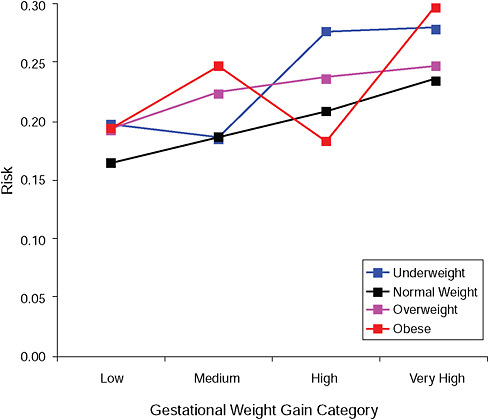
FIGURE G-12B Instrumental deliveries.
NOTE: Absolute risks derived from odds ratios. Presents risk of a primiparous woman, age 25-29, height 1.60-1.69, nonsmoker, no alcohol consumption, high social status, no exercise, 280 days of gestation.
TABLE G-12B Instrumental Deliveries, Adjusted Risks (gestational weight gain by BMI)
|
|
Low |
Moderate |
High |
Very High |
|
Underweight |
19.7% |
18.6% |
27.6% |
27.9% |
|
Normal weight |
16.4% |
18.7% |
20.9% |
23.6% |
|
Overweight |
19.3% |
22.4% |
23.8% |
24.7% |
|
Obese |
19.4% |
24.7% |
18.3% |
29.6% |
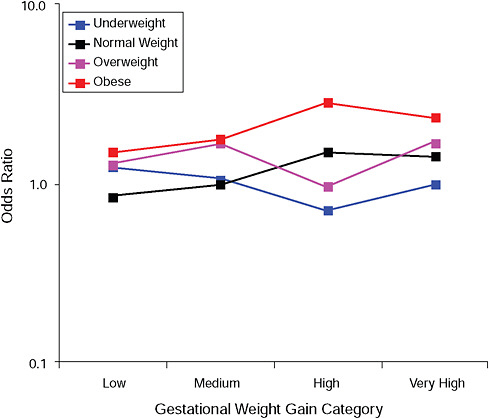
FIGURE G-13A Low Apgar score (< 8 after 5 minutes).
NOTE: Full model. Odds ratios adjusted for age, parity, height, smoking, alcohol consumption, social status, exercise, gestational age (days).
TABLE G-13A Low Apgar Score (< 8 after 5 minutes), Adjusted Odds Ratios (gestational weight gain by BMI)
|
|
Low |
Moderate |
High |
Very High |
|
Underweight |
1.2 |
1.1 |
0.7 |
1.0 |
|
Normal weight |
0.8 |
1.0 |
1.5 |
1.4 |
|
Overweight |
1.3 |
1.7 |
1.0 |
1.7 |
|
Obese |
1.5 |
1.8 |
2.8 |
2.4 |
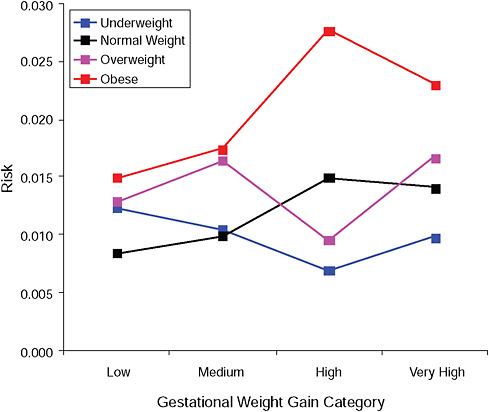
FIGURE G-13B Low Apgar score (< 8 after 5 minutes).
NOTE: Absolute risks derived from odds ratios. Presents risk of a primiparous woman, age 25-29, height 1.60-1.69, nonsmoker, no alcohol consumption, high social status, no exercise, 280 days of gestation.
TABLE G-13B Low Apgar Score (< 8 after 5 minutes), Adjusted Risks (gestational weight gain by BMI)
|
|
Low |
Moderate |
High |
Very High |
|
Underweight |
1.2% |
1.1% |
0.7% |
1.0% |
|
Normal weight |
0.8% |
1.0% |
1.5% |
1.4% |
|
Overweight |
1.3% |
1.7% |
1.0% |
1.7% |
|
Obese |
1.5% |
1.7% |
2.8% |
2.3% |
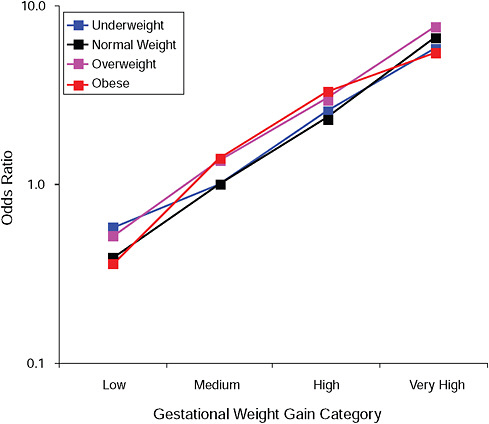
FIGURE G-14A Post partum weight retention ≥ 5 kg at 6 months.
NOTE: Full model. Odds ratios adjusted for age, parity, height, smoking, alcohol consumption, social status, exercise, gestational age (days).
TABLE G-14A Post Partum Weight Retention ≥ 5 kg at 6 Months, Adjusted Odds Ratios (gestational weight gain by BMI)
|
|
Low |
Moderate |
High |
Very High |
|
Underweight |
0.6 |
1.0 |
2.6 |
5.8 |
|
Normal weight |
0.4 |
1.0 |
2.4 |
6.6 |
|
Overweight |
0.5 |
1.4 |
3.0 |
7.6 |
|
Obese |
0.4 |
1.4 |
3.3 |
5.5 |
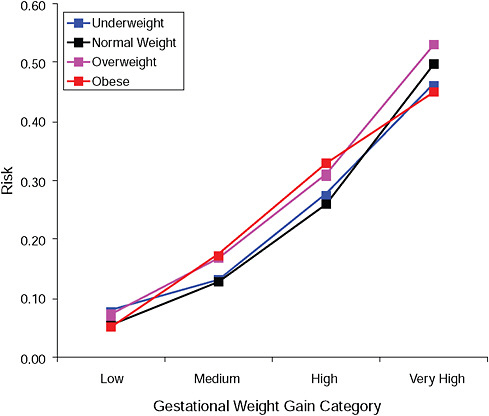
FIGURE G-14B Post partum weight retention ≥ 5 kg at 6 months.
NOTE: Absolute risks derived from odds ratios. Presents risk of a primiparous woman, age 25-29, height 1.60-1.69, nonsmoker, no alcohol consumption, high social status, no exercise, 280 days of gestation.
TABLE G-14B Post Partum Weight Retention ≥ 5 kg at 6 Months, Adjusted Risks (gestational weight gain by BMI)
|
|
Low |
Moderate |
High |
Very High |
|
Underweight |
7.9% |
13.1% |
27.6% |
46.5% |
|
Normal weight |
5.6% |
13.0% |
26.1% |
49.7% |
|
Overweight |
7.2% |
16.9% |
31.1% |
53.2% |
|
Obese |
5.1% |
17.5% |
33.0% |
45.0% |
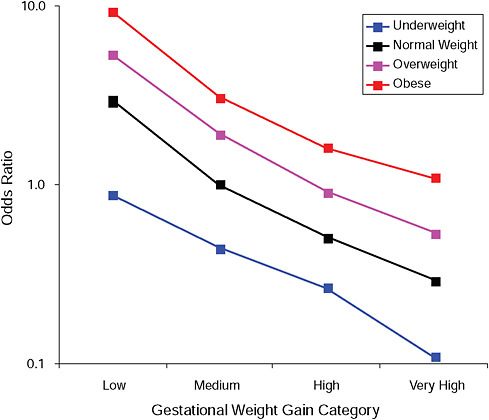
FIGURE G-15A Post partum weight loss ≥ 2 kg at 6 months.
NOTE: Full model. Odds ratios adjusted for age, parity, height, smoking, alcohol consumption, social status, exercise, gestational age (days).
TABLE G-15A Post Partum Weight Loss ≥ 2 kg at 6 Months, Adjusted Odds Ratios (gestational weight gain by BMI)
|
|
Low |
Moderate |
High |
Very High |
|
Underweight |
0.9 |
0.4 |
0.3 |
0.1 |
|
Normal weight |
2.9 |
1.0 |
0.5 |
0.3 |
|
Overweight |
5.3 |
1.9 |
0.9 |
0.5 |
|
Obese |
9.1 |
3.1 |
1.6 |
1.1 |
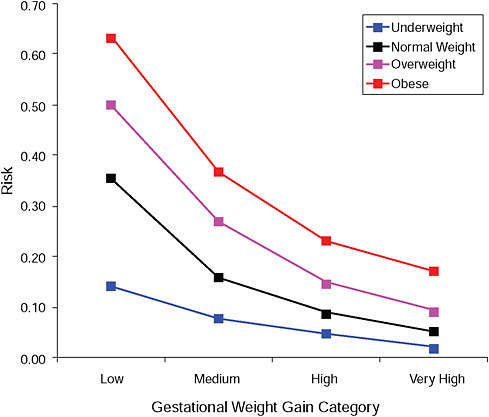
FIGURE G-15B Post partum weight loss ≥ 2 kg at 6 months.
NOTE: Absolute risks derived from odds ratios. Presents risk of a primiparous woman, age 25-29, height 1.60-1.69, nonsmoker, no alcohol consumption, high social status, no exercise, 280 days of gestation.
TABLE G-15B Post Partum Weight Loss ≥ 2 kg at 6 Months, Adjusted Risks (gestational weight gain by BMI)
|
|
Low |
Moderate |
High |
Very High |
|
Underweight |
14.3% |
7.7% |
4.8% |
2.0% |
|
Normal weight |
35.7% |
16.0% |
8.8% |
5.3% |
|
Overweight |
50.1% |
26.9% |
14.8% |
9.3% |
|
Obese |
63.4% |
36.8% |
23.3% |
17.2% |
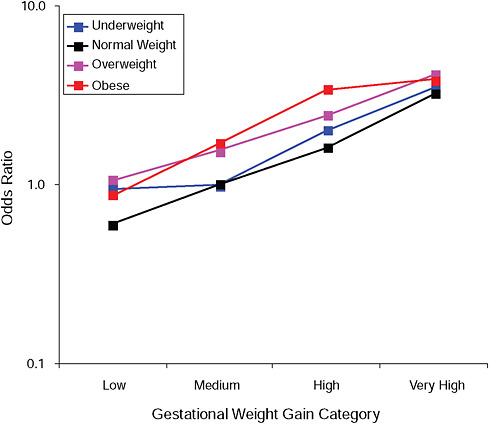
FIGURE G-16A Post partum weight retention ≥ 5 kg at 18 months.
NOTE: Full model. Odds ratios adjusted for age, parity, height, smoking, alcohol consumption, social status, exercise, gestational age (days).
TABLE G-16A Post Partum Weight Retention ≥ 5 kg at 18 Months, Adjusted Odds Ratios (gestational weight gain by BMI)
|
|
Low |
Moderate |
High |
Very High |
|
Underweight |
1.0 |
1.0 |
2.0 |
3.5 |
|
Normal weight |
0.6 |
1.0 |
1.6 |
3.2 |
|
Overweight |
1.1 |
1.5 |
2.4 |
4.2 |
|
Obese |
0.9 |
1.7 |
3.4 |
3.9 |
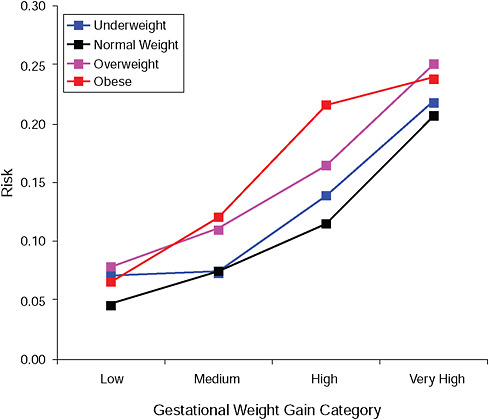
FIGURE G-16B Post partum weight retention ≥ 5 kg at 18 months.
NOTE: Absolute risks derived from odds ratios. Presents risk of a primiparous woman, age 25-29, height 1.60-1.69, nonsmoker, no alcohol consumption, high social status, no exercise, 280 days of gestation.
TABLE G-16B Post Partum Weight Retention ≥ 5 kg at 18 Months, Adjusted Risks (gestational weight gain by BMI)
|
|
Low |
Moderate |
High |
Very High |
|
Underweight |
7.1% |
7.4% |
13.9% |
21.8% |
|
Normal weight |
4.6% |
7.5% |
11.5% |
20.7% |
|
Overweight |
7.8% |
11.0% |
16.5% |
25.1% |
|
Obese |
6.6% |
12.1% |
21.6% |
23.8% |
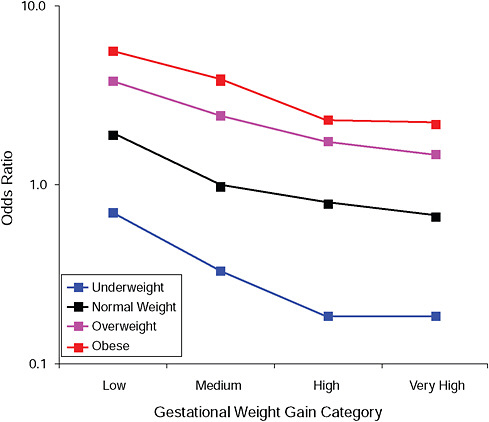
FIGURE G-17A Post partum weight loss ≥ 2 kg at 18 months.
NOTE: Full model. Odds ratios adjusted for age, parity, height, smoking, alcohol consumption, social status, exercise, gestational age (days).
TABLE G-17A Post Partum Weight Loss ≥ 2 kg at 18 Months, Adjusted Odds Ratios (gestational weight gain by BMI)
|
|
Low |
Moderate |
High |
Very High |
|
Underweight |
0.7 |
0.3 |
0.2 |
0.2 |
|
Normal weight |
1.9 |
1.0 |
0.8 |
0.7 |
|
Overweight |
3.8 |
2.4 |
1.7 |
1.5 |
|
Obese |
5.6 |
3.9 |
2.3 |
2.2 |
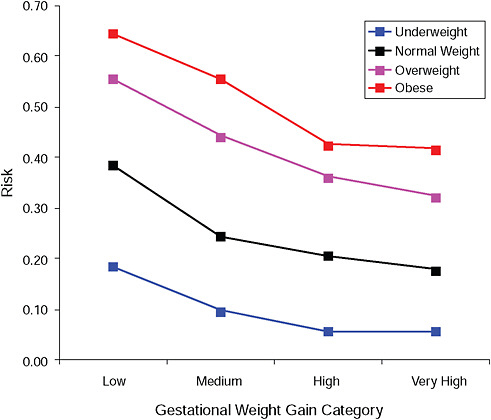
FIGURE G-17B Post partum weight loss ≥ 2 kg at 18 months.
NOTE: Absolute risks derived from odds ratios. Presents risk of a primiparous woman, age 25-29, height 1.60-1.69, nonsmoker, no alcohol consumption, high social status, no exercise, 280 days of gestation.
TABLE G-17B Post Partum Weight Loss ≥ 2 kg at 18 Months, Adjusted Risks (gestational weight gain by BMI)
|
|
Low |
Moderate |
High |
Very High |
|
Underweight |
18.5% |
9.6% |
5.6% |
5.6% |
|
Normal weight |
38.6% |
24.4% |
20.5% |
17.8% |
|
Overweight |
55.4% |
44.1% |
36.1% |
32.3% |
|
Obese |
64.5% |
55.5% |
42.5% |
41.6% |
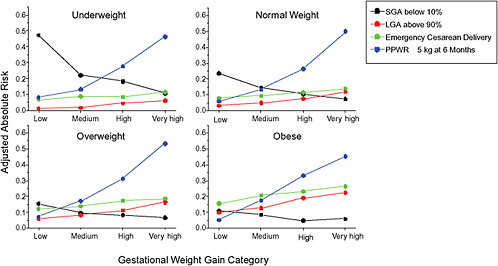
FIGURE G-18 GWG-specific absolute risks for SGA, LGA, emergency cesarean delivery and postpartum weight retention within each group.
NOTE: Points present risks of a primiparous woman, age 25-29, height 1.60-1.69, nonsmoker, no alcohol consumption, high social status, no exercise and 280 days of gestation. For PPWR, she breastfed < 14 weeks.
TABLE G-18A GWG-Specific Absolute Risks for SGA, LGA, Emergency Cesarean Delivery and Postpartum Weight Retention for Underweight Women
TABLE G-18B GWG-Specific Absolute Risks for SGA, LGA, Emergency Cesarean Delivery and Postpartum Weight Retention for Normal Weight Women
TABLE G-18C GWG-Specific Absolute Risks for SGA, LGA, Emergency Cesarean Delivery and Postpartum Weight Retention for Overweight Women
TABLE G-18D GWG-Specific Absolute Risks for SGA, LGA, Emergency Cesarean Delivery and Postpartum Weight Retention for Obese Women
-
Figures G-11A/G-11B (Tables G-11A/G-11B): Caesarean delivery during labor (emergency)
-
Figures G-12A/G-12B (Tables G-12A/G-12B): Instrumental deliveries
-
Figures G-13A/G-13B (Tables G-13A/G-13B): Low Apgar score (< 8 after 5 minutes)
-
Figures G-14A/G-14B (Tables G-14A/G-14B): Postpartum weight retention ≥ 5 kg at 6 months
-
Figures G-15A/G-15B (Tables G-15A/G-15B): Postpartum weight loss ≥ 2 kg at 6 months
-
Figures G-16A/G-16B (Tables G-16A/G-16B): Postpartum weight retention ≥ 5 kg at 18 months
-
Figures G-17A/G-17B (Tables G-17A/G-17B): Postpartum weight loss ≥ 2 kg at 18 months
-
Figure G-18A (Tables G-18A through G-18D): GWG-specific absolute risks for SGA, LGA, emergency caesarean delivery and postpartum weight retention within each BMI group
Odds ratios, displayed in the upper part of all figures, showed that:
-
Except for birth weight and postpartum weight retention, pre-pregnancy BMI was by far the strongest predictor of the outcomes under study.
-
There was little evidence of interaction between BMI and GWG in a multiplicative model. It was only present for birth weight and postpartum weight retention (p < 0.01), and although statistical important, it was judged to be of minor clinical importance.
In the lower part of all figures, BMI- and GWG-specific adjusted absolute risks for all included pregnancy outcomes showed that:
-
Across BMI groups, background risks varied highly, which led to highly varying risk differences when moving from low to high GWG. Especially the risk of SGA and LGA were related to both increasing BMI and increasing GWG (Figures G-4 through G-7). In contrast, the absolute risk of postpartum weight retention was highly responsive to GWG, but not to BMI.
-
These observations support the idea of BMI-specific recommendations. According to figure G-18, especially underweight women may benefit from very high GWG to prevent having a small infant while heavier women may benefit from avoiding high and very high GWG which only brings a slight increase of growth restriction for the infant.
Second DNBC Report
At the IOM workshop in Washington, DC, in June 2008, the IOM committee found the additive approach with presentation of absolute adjusted risks across BMI groups useful and informative. They asked for additional analyses of some of the most important outcomes where one more obese class and two more GWG groups were included.
Methods
The study population and the methods for deriving the adjusted odds ratios and absolute risks were the same as for the First DNBC Report.
The BMI categories were expanded by dividing the obese group into obese class I (30 ≤ BMI > 35) and obese class II and III (BMI ≥ 35) (WHO, 2000). These categories are denoted obese and extremely obese in the figures. The GWG categories were expanded with two groups and included now the six following categories: two low categories (< 5 kg, and 5-9 kg), one medium category (10-15 kg) and three high categories (16-19 kg, 20-24 kg and ≥ 25 kg). The analyses were carried out for the following four outcomes:
-
Figures G-19A/G-19B (Tables G-19A/G-19B): SGA infant (< 10th percentile)
-
Figures G-20A/G-20B (Tables G-20A/G-20B): LGA infant (> 90th percentile)
-
Figures G-21A/G-21B (Tables G-21A/G-21B): Emergency cesarean delivery
-
Figures G-22A/G-22B (Tables G-22A/G-22B): Postpartum weight retention of ≥ 5 kg at 6 months
Finally, the results were stratified on BMI group and combined in one figure to evaluate the “trade-off” between mother and infant:
-
Figure G-23: GWG-specific absolute risks for SGA, LGA, emergency cesarean delivery and postpartum weight retention within each BMI group.
Results
-
In all BMI groups, risk of SGA responded to increasing GWG throughout the entire spectrum of gain categories. The same was seen for LGA except for extremely obese women with GWG ≥ 25 kg, which did not increase risk of LGA further.
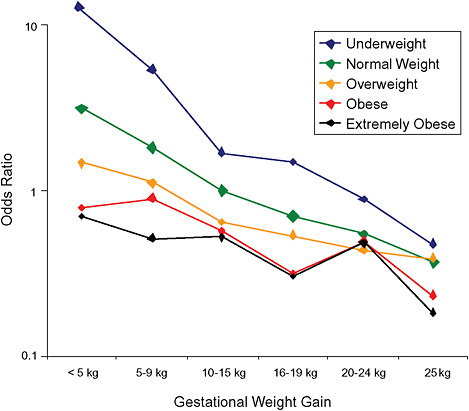
FIGURE G-19A Small-for-gestational-age infant (< 10 percentile).
NOTE: Full model. Odds ratios adjusted for age, parity, height, smoking, alcohol consumption, exercise, social status, gestational age in days (p = 0.0001 [Wald’s test]).
TABLE G-19A Small-for-Gestational-Age Infant, Adjusted Odds Ratios (by BMI and gestational weight gain)
|
|
< 5 kg |
5-9 kg |
10-15 kg |
16-19 kg |
20-24 kg |
≥ 25 kg |
|
< 18.5 |
12.5 |
5.4 |
1.7 |
1.5 |
0.9 |
0.5 |
|
|
(3.9; 39.8) |
(3.9; 7.5) |
(1.4; 2.0) |
(1.1; 1.9) |
(0.6; 1.3) |
(0.2; 0.9) |
|
18.5-24.9 |
3.1 |
1.8 |
1.0 |
0.7 |
0.5 |
0.4 |
|
|
(2.2; 4.5) |
(1.6; 2.0) |
(ref) |
(0.6; 0.8) |
(0.5; 0.6) |
(0.3; 0.4) |
|
25.0-29.9 |
1.5 |
1.1 |
0.6 |
0.5 |
0.4 |
0.4 |
|
|
(1.0; 2.0) |
(0.9; 1.3) |
(0.6; 0.7) |
(0.4; 0.7) |
(0.3; 0.6) |
(0.3; 0.5) |
|
30-34.9 |
0.8 |
0.9 |
0.3 |
0.3 |
0.5 |
0.2 |
|
|
(0.5; 1.1) |
(0.7; 1.2) |
(0.4; 0.7) |
(0.2; 0.6) |
(0.3; 0.9) |
(0.1; 0.5) |
|
35+ |
0.7 |
0.5 |
0.5 |
0.3 |
0.5 |
0.2 |
|
|
(0.4; 1.1) |
(0.3; 0.9) |
(0.3; 0.8) |
(0.1; 1.3) |
(0.1; 1.7) |
(0.0; 1.3) |
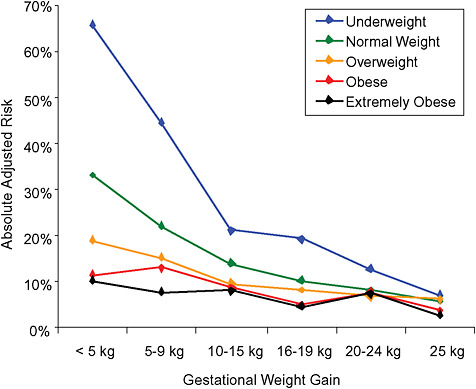
FIGURE G-19B Small-for-gestational-age infant (< 10 percentile).
NOTE: Absolute risks derived from odds ratios. Presents risk of a primiparous woman, age 25-29, height 1.60-1.69, nonsmoker, no alcohol consumption, high social status, no exercise, 280 days of gestation.
TABLE G-19B Small-for-Gestational-Age Infant, Adjusted Risks (by BMI and gestational weight gain)
|
|
< 5 kg |
5-9 kg |
10-15 kg |
16-19 kg |
20-24 kg |
≥ 25 kg |
|
< 18.5 |
66% |
45% |
21% |
19% |
13% |
7% |
|
|
(38-86) |
(37-53) |
(18-24) |
(16-24) |
(9-18) |
(4-13) |
|
18.5-24.9 |
33% |
22% |
14% |
11% |
8% |
6% |
|
|
(26-42) |
(20-25) |
(13-15) |
(9-12) |
(7-10) |
(5-7) |
|
25.0-29.9 |
19% |
15% |
10% |
8% |
7% |
6% |
|
|
(15-25) |
(13-18) |
(9-11) |
(7-10) |
(5-9) |
(5-8) |
|
30-34.9 |
12% |
13% |
9% |
5% |
8% |
4% |
|
|
(8-16) |
(10-17) |
(7-11) |
(3-9) |
(5-13) |
(2-8) |
|
35+ |
10% |
8% |
8% |
5% |
7% |
3% |
|
|
(7-15) |
(5-13) |
(5-13) |
(2-18) |
(2-22) |
(0-18) |
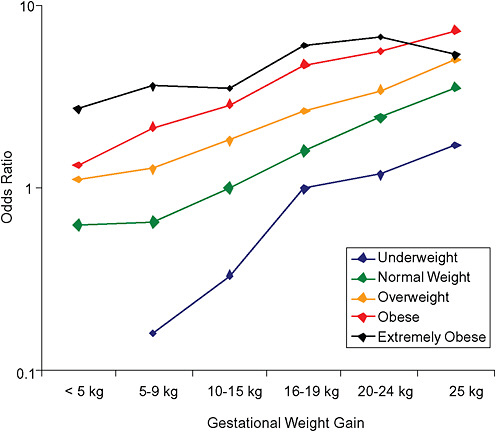
FIGURE G-20A Large-for-gestational-age infant (> 90 percentile).
NOTE: Full model. Odds ratios adjusted for age, parity, height, smoking, alcohol consumption, exercise, social status, gestational age in days (p = 0.0001 [Wald’s test]).
TABLE G-20A Large-for-Gestational-Age Infant, Adjusted Odds Ratios (by BMI and gestational weight gain)
|
|
< 5 kg |
5-9 kg |
10-15 kg |
16-19 kg |
20-24 kg |
≥ 25 kg |
|
< 18.5 |
— |
0.2 |
0.3 |
1.0 |
1.2 |
1.7 |
|
|
|
(0.1; 0.5) |
(0.2; 0.5) |
(0.7; 1.4) |
(0.8; 1.8) |
(1.0; 3.0) |
|
18.5-24.9 |
0.6 |
0.7 |
1.0 |
1.6 |
2.4 |
3.6 |
|
|
(0.3; 1.2) |
(0.6; 0.8) |
(ref) |
(1.5; 1.8) |
(2.2; 2.7) |
(3.2; 4.0) |
|
25.0-29.9 |
1.1 |
1.3 |
1.8 |
2.6 |
3.4 |
5.0 |
|
|
(0.8; 1.6) |
(1.1; 1.5) |
(1.6; 2.0) |
(2.3; 3.0) |
(3.0; 4.0) |
(4.2; 6.0) |
|
30-34.9 |
1.3 |
2.2 |
2.9 |
4.8 |
5.6 |
7.3 |
|
|
(0.9; 1.9) |
(1.7; 2.7) |
(2.4; 3.4) |
(3.7; 6.2) |
(4.1; 7.6) |
(5.0; 10.5) |
|
35+ |
2.7 |
3.6 |
3.5 |
6.0 |
6.6 |
5.3 |
|
|
(1.9; 3.8) |
(2.7; 4.9) |
(2.6; 4.7) |
(3.3; 10.9) |
(3.2; 13.8) |
(2.5; 11.5) |
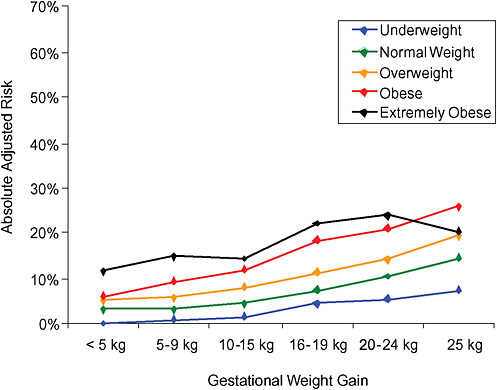
FIGURE G-20B Large-for-gestational-age infant (> 90 percentile).
NOTE: Absolute risks derived from odds ratios. Presents risk of a primiparous woman, age 25-29, height 1.60-1.69, nonsmoker, no alcohol consumption, high social status, no exercise, 280 days of gestation.
TABLE G-20B Large-for-Gestational-Age Infant, Adjusted Risks (by BMI and gestational weight gain)
|
|
< 5 kg |
5-9 kg |
10-15 kg |
16-19 kg |
20-24 kg |
≥ 25 kg |
|
< 18.5 |
— |
1% |
2% |
5% |
5% |
8% |
|
|
|
(0-2) |
(1-2) |
(3-6) |
(4-8) |
(4-12) |
|
18.5-24.9 |
3% |
3% |
5% |
7% |
10% |
15% |
|
|
(1-6) |
(3-4) |
(4-5) |
(7-8) |
(9-11) |
(13-16) |
|
25.0-29.9 |
5% |
6% |
8% |
11% |
14% |
19% |
|
|
(4-7) |
(5-7) |
(7-9) |
(10-13) |
(12-16) |
(17-22) |
|
30-34.9 |
6% |
9% |
12% |
18% |
21% |
26% |
|
|
(4-8) |
(8-11) |
(10-14) |
(15-23) |
(16-27) |
(19-33) |
|
35+ |
11% |
15% |
14% |
22% |
24% |
20% |
|
|
(8-15) |
(11-19) |
(11-18) |
(14-34) |
(13-40) |
(10-35) |
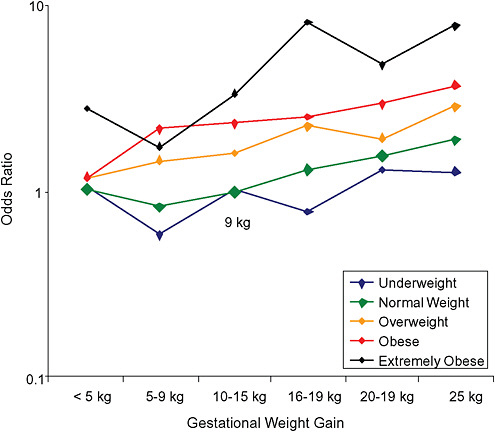
FIGURE G-21A Emergency cesarean deliveries.
NOTE: Full model. Odds ratios adjusted for age, parity, height, smoking, alcohol consumption, exercise, social status, gestational age in days (p = 0.23 [Wald’s test]).
TABLE G-21B Emergency Cesarean Deliveries, Adjusted Risks (by BMI and gestational weight gain)
|
|
< 5 kg |
5-9 kg |
10-15 kg |
16-19 kg |
20-24 kg |
≥ 25 kg |
|
< 18.5 |
9% |
5% |
9% |
7% |
12% |
12% |
|
|
(2-40) |
(2-12) |
(7-12) |
(5-11) |
(8-18) |
(6-21) |
|
18.5-24.9 |
9% |
8% |
9% |
12% |
14% |
17% |
|
|
(5-17) |
(6-9) |
(9-10) |
(11-13) |
(13-16) |
(15-19) |
|
25.0-29.9 |
11% |
13% |
15% |
19% |
17% |
24% |
|
|
(7-17) |
(11-16) |
(13-16) |
(17-22) |
(15-21) |
(20-28) |
|
30-34.9 |
11% |
19% |
20% |
21% |
24% |
29% |
|
|
(8-17) |
(15-23) |
(17-24) |
(16-28) |
(18-32) |
(21-38) |
|
35+ |
23% |
16% |
26% |
46% |
33% |
45% |
|
|
(16-30) |
(10-23) |
(20-34) |
(31-63) |
(17-54) |
(26-65) |
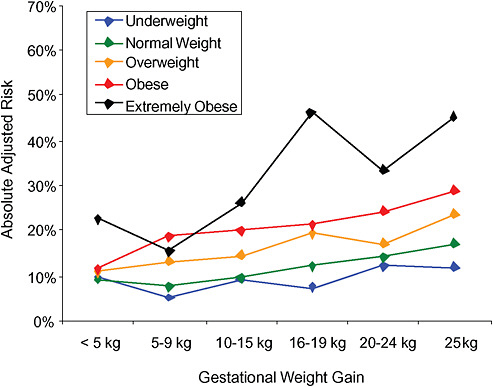
FIGURE G-21B Emergency cesarean deliveries.
NOTE: Absolute risks derived from odds ratios. Presents risk of a primiparous woman, age 25-29, height 1.60-1.69, nonsmoker, no alcohol consumption, high social status, no exercise, 280 days of gestation.
TABLE G-21B Emergency Cesarean Deliveries, Adjusted Risks (by BMI and gestational weight gain)
|
|
< 5 kg |
5-9 kg |
10-15 kg |
16-19 kg |
20-24 kg |
≥ 25 kg |
|
< 18.5 |
9% |
5% |
9% |
7% |
12% |
12% |
|
|
(2-40) |
(2-12) |
(7-12) |
(5-11) |
(8-18) |
(6-21) |
|
18.5-24.9 |
9% |
8% |
9% |
12% |
14% |
17% |
|
|
(5-17) |
(6-9) |
(9-10) |
(11-13) |
(13-16) |
(15-19) |
|
25.0-29.9 |
11% |
13% |
15% |
19% |
17% |
24% |
|
|
(7-17) |
(11-16) |
(13-16) |
(17-22) |
(15-21) |
(20-28) |
|
30-34.9 |
11% |
19% |
20% |
21% |
24% |
29% |
|
|
(8-17) |
(15-23) |
(17-24) |
(16-28) |
(18-32) |
(21-38) |
|
35+ |
23% |
16% |
26% |
46% |
33% |
45% |
|
|
(16-30) |
(10-23) |
(20-34) |
(31-63) |
(17-54) |
(26-65) |
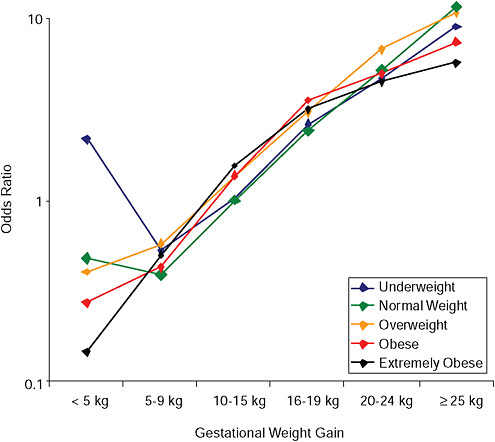
FIGURE G-22A Postpartum weight retention ≥ 5 kg at 6 months.
NOTE: Full model. Odds ratios adjusted for age, parity, height, smoking, alcohol consumption, exercise, social status, gestational age in days (p = 0.001 [Wald’s test]).
TABLE G-22A Postpartum Weight Retention ≥ 5 kg at 6 Months, Adjusted Odds Ratios (by BMI and gestational weight gain)
|
|
< 5 kg |
5-9 kg |
10-15 kg |
16-19 kg |
20-24 kg |
≥ 25 kg |
|
< 18.5 |
2.1 |
0.5 |
1.0 |
2.6 |
4.6 |
8.9 |
|
|
(0.7; 6.6) |
(0.3; 1.0) |
(0.8; 1.2) |
(2.1; 3.2) |
(3.6; 5.8) |
(6.4; 12.4) |
|
18.5-24.9 |
0.5 |
0.4 |
1.0 |
2.4 |
5.1 |
11.3 |
|
|
(0.3; 0.9) |
(0.3; 0.5) |
(ref) |
(2.2; 2.6) |
(4.7; 5.5) |
(10.3; 12.4) |
|
25.0-29.9 |
0.4 |
0.6 |
1.4 |
3.0 |
6.7 |
10.4 |
|
|
(0.3; 0.6) |
(0.5; 0.7) |
(1.2; 1.5) |
(2.7; 3.4) |
(6.0; 7.6) |
(9.0; 12.1) |
|
30-34.9 |
0.3 |
0.4 |
1.4 |
3.5 |
4.9 |
7.4 |
|
|
(0.2; 0.5) |
(0.3; 0.6) |
(1.1; 1.6) |
(2.7; 4.5) |
(3.8; 6.5) |
(5.4; 10.1) |
|
35+ |
0.1 |
0.5 |
1.5 |
3.1 |
4.5 |
5.6 |
|
|
(0.1; 0.3) |
(0.3; 0.8) |
(1.1; 2.1) |
(1.8; 5.5) |
(2.4; 8.2) |
(2.9; 10.9) |
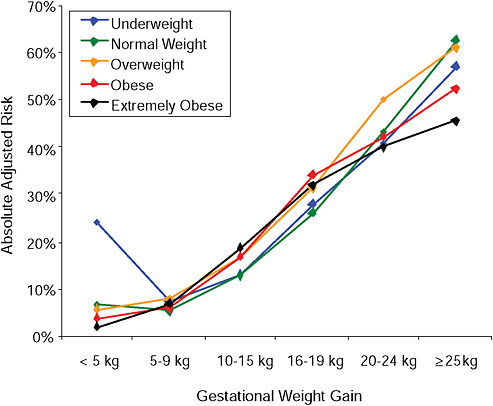
FIGURE G-22B Postpartum weight retention ≥ 5 kg at 6 months.
NOTE: Absolute risks derived from odds ratios. Presents risk of a primiparous woman, age 25-29, height 1.60-1.69, nonsmoker, no alcohol consumption, high social status, no exercise, 280 days of gestation.
TABLE G-22B Postpartum Weight Retention ≥ 5 kg at 6 Months, Adjusted Risks (by BMI and gestational weight gain)
|
|
< 5 kg |
5-9 kg |
10-15 kg |
16-19 kg |
20-24 kg |
≥ 25 kg |
|
< 18.5 |
24% |
7% |
13% |
28% |
41% |
57% |
|
|
(9-50) |
(4-12) |
(11-15) |
(24-32) |
(35-47) |
(48-65) |
|
18.5-24.9 |
7% |
5% |
13% |
26% |
43% |
63% |
|
|
(4-12) |
(5-7) |
(12-14) |
(25-28) |
(41-45) |
(60-65) |
|
25.0-29.9 |
6% |
8% |
17% |
31% |
50% |
61% |
|
|
(4-9) |
(6-10) |
(15-18) |
(28-34) |
(47-53) |
(57-65) |
|
30-34.9 |
4% |
6% |
17% |
34% |
42% |
52% |
|
|
(2-6) |
(4-8) |
(15-19) |
(29-40) |
(36-49) |
(44-60) |
|
35+ |
2% |
7% |
19% |
32% |
40% |
46% |
|
|
(0-5) |
(4-11) |
(15-24) |
(21-45) |
(26-55) |
(30-62) |
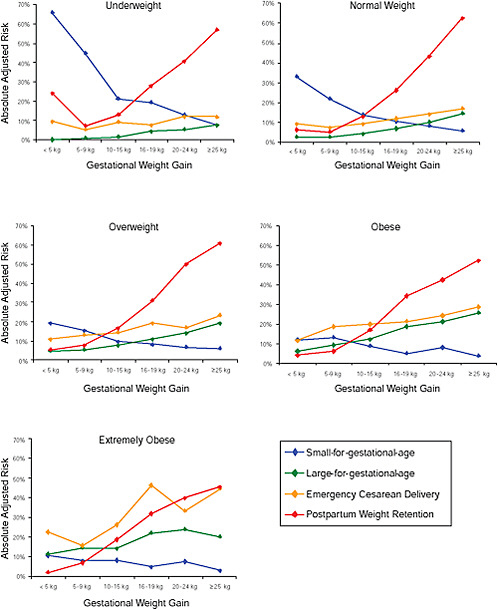
FIGURE G-23 GWG-specific absolute risks for SGA, LGA, emergency cesarean delivery and postpartum weight retention within each BMI group.
NOTE: Absolute risks derived from odds ratios. Presents risk of a primiparous woman, age 25-29, height 1.60-1.69, non smoker, no alcohol consumption, high social status, no exercise, 280 days of gestation. For PPWR, she is breastfeeding less than 14 weeks.
-
Only for underweight, normal weight and overweight women was GWG < 5 kg associated with substantial risk of SGA.
-
Extremely obese women had risks similar to obese women except for emergency cesarean delivery. Here, data indicated high and increasing risk with increasing GWG.
-
The data did not suggest deleterious consequences of GWG < 5 kg in obese and extremely obese women.
Third DNBC Report
Because the 1990 IOM Guidelines did not provide sufficient data about GWG in subpopulations of interest, the committee requested additional information about subgroups of pregnant women, defined by parity, height, age, and smoking. Also, the committee asked for analyses of the association between GWG and emergency cesarean delivery and postpartum weight retention with and without adjustment for birth weight. These results are presented in the Third DNBC Report. The methods and analyses are presented below. More details are available in Nohr et al. (2009).
Study Population
The initial study population was similar to the one used in the First and Second DNBC Report. However, in this study, women < 18 y old (n = 71) were included and women with diagnosed preeclampsia (n = 1,118) and gestational diabetes (n = 690) were excluded. As a result, there were 59,147 women in the final study population.
Independent Variables
The main exposures, self-reported prepregnancy BMI and GWG, were defined in the same way as in the previous reports. For this report, BMI was categorized into four categories: underweight (BMI < 18.5 kg/m2), normal weight (18.5 ≤ BMI < 25 kg/m2), overweight (25 ≤ BMI < 30 kg/m2), and obese (BMI ≥ 30 kg/m2). Gestational weight gain was divided into six categories: two low categories (< 5 kg, and 5-9 kg), one medium category (10-15 kg) and three high categories (16-19 kg, 20-24 kg and ≥ 25 kg). Other covariates in the models were similar to those used in previous analyses.
Pregnancy Outcomes
Pregnancy outcomes used in these analyses were:
-
Small-for-gestational-age infant (< 10th percentile)
-
Large-for-gestational-age infant (> 90th percentile)
-
Emergency cesarean delivery
-
Postpartum weight retention of ≥ 5 kg at 6 months
Information about the definition of these outcomes can be found in the First DNBC report.
Statistical Methods
A BMI- and GWG-specific variable was generated by cross-classifying BMI group (four categories) and GWG group (six categories). Few underweight women reported a low GWG, so for this group the two lowest categories were combined into one category, which was defined as a gain < 10 kg. Thus, this BMI- and GWG-specific variable consisted of 23 categories.
We divided the study population into primiparous (n = 27,030) and multiparous (n = 32,117) women to investigate the associations among BMI, GWG and selected pregnancy outcomes within each of these strata. In multiple logistic regression models, the BMI- and GWG-specific variable and the covariates of age, height and smoking (yes/no) were mutually adjusted to estimate their independent associations with the pregnancy outcomes of interest within each of these subpopulations. The reference category was defined as normal weight women with a medium GWG (10-15 kg), 25-29 years old at conception, height of 1.60-1.69 m who did not smoke during pregnancy. In these models, we also adjusted for alcohol consumption and exercise in pregnancy, social status, and gestational age at delivery in days. In the analysis of postpartum weight retention, duration of breastfeeding was added to the model. In the analysis of emergency cesarean delivery, we excluded women who had a cesarean section before labor (1,485 primiparous and 2,429 multiparous women).
Within the groups of primiparous and multiparous women, we used the calculated odds ratios from these models to compute absolute adjusted risks for pregnancy outcomes according to each category within the BMI- and GWG-specific variable (which produced 23 different absolute risks for each pregnancy outcome). This was done for four different sets of characteristics among primiparous women and three different sets among multiparous women, which created a total of seven different types of women. In each of these models, “a reference woman” was 25-29 years old, 1.60-1.69 m tall and did not smoke or consume alcohol during pregnancy. This woman, which will be denoted “an unexposed woman” in the following, performed a moderate amount of exercise during pregnancy, was of high social status and had a gestational length of 280 days. For postpartum weight reten-
tion, she breastfed < 14 weeks. The same characteristics applied for “a short woman,” only she was < 1.60 m tall. “A smoking woman” was also defined as a reference woman, only she was a smoker. Among primiparous women, we also defined “a young woman,” who was similar to the reference woman, only was she < 20 years old.
Results
First, the absolute risks are presented in seven figures, one for each subtype of woman, to evaluate if the “trade-off” between mother and infant differed across different types of women. Every figure is accompanied with a table with estimates and 95% confidence intervals corresponding to all points in the figure:
-
Figure G-24 (Table G-23): Unexposed primiparae, GWG-specific risks of pregnancy outcomes
-
Figure G-25 (Table G-24): Short primiparae, GWG-specific risks of pregnancy outcomes
-
Figure G-26 (Table G-25): Smoking primiparae, GWG-specific risks of pregnancy outcomes
-
Figure G-27 (Table G-26): Young primiparae, GWG-specific risks of pregnancy outcomes
-
Figure G-28 (Table G-27): Unexposed multiparae, GWG-specific risks of pregnancy outcomes
-
Figure G-29 (Table G-28): Short multiparae: GWG-specific risks of pregnancy outcomes
-
Figure G-30 (Table G-29): Smoking multiparae: GWG-specific risks of pregnancy outcomes
To evaluate the differences between subtypes of women within each BMI group, these results were also combined in four new figures, one for each BMI group:
-
Figure G-31: GWG-specific risk of pregnancy outcomes in subtypes of underweight women
-
Figure G-32: GWG-specific risk of pregnancy outcomes in subtypes of normal weight women
-
Figure G-33: GWG-specific risk of pregnancy outcomes in subtypes of overweight women
-
Figure G-34: GWG-specific risk of pregnancy outcomes in subtypes of obese women
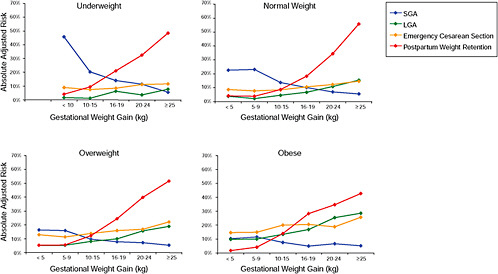
TABLE G-23 Unexposed Primiparae, GWG–Specific Risks of Pregnancy Outcomes
|
|
< 5 kg |
< 10 kg |
10-15 kg |
16-19 kg |
20-24 kg |
≥ 25 kg |
|
Underweight |
||||||
|
SGA |
|
0.46 |
0.20 |
0.14 |
0.11 |
0.06 |
|
|
(0.36; 0.56) |
(0.17; 0.24) |
(0.10; 0.19) |
(0.08; 0.17) |
(0.03; 0.11) |
|
|
LGA |
|
0.02 |
0.01 |
0.06 |
0.04 |
0.08 |
|
|
(0.00; 0.07) |
(0.01; 0.03) |
(0.04; 0.10) |
(0.02; 0.08) |
(0.04; 0.16) |
|
|
Emergency CS |
|
0.09 |
0.08 |
0.09 |
0.11 |
0.12 |
|
|
(0.04; 0.18) |
(0.05; 0.10) |
(0.06; 0.13) |
(0.07; 0.17) |
(0.06; 0.21) |
|
|
PPWR |
|
0.04 |
0.09 |
0.21 |
0.32 |
0.48 |
|
|
(0.02; 0.10) |
(0.07; 0.12) |
(0.17; 0.26) |
(0.26; 0.40) |
(0.38; 0.59) |
|
|
Normal weight |
||||||
|
SGA |
0.23 |
0.23 |
0.14 |
0.10 |
0.07 |
0.06 |
|
(0.15; 0.34) |
(0.20; 0.26) |
(0.13; 0.15) |
(0.09; 0.11) |
(0.06; 0.08) |
(0.05; 0.07) |
|
|
LGA |
0.04 |
0.02 |
0.04 |
0.07 |
0.11 |
0.16 |
|
(0.01; 0.11) |
(0.02; 0.03) |
(0.04; 0.05) |
(0.06; 0.08) |
(0.09; 0.12) |
(0.13; 0.18) |
|
|
Emergency CS |
0.09 |
0.08 |
0.08 |
0.11 |
0.12 |
0.15 |
|
(0.04; 0.19) |
(0.06; 0.10) |
(0.08; 0.09) |
(0.09; 0.12) |
(0.11; 0.14) |
(0.12; 0.17) |
|
|
PPWR |
0.04 |
0.04 |
0.09 |
0.18 |
0.34 |
0.56 |
|
(0.02; 0.11) |
(0.03; 0.05) |
(0.08; 0.09) |
(0.17; 0.20) |
(0.32; 0.37) |
(0.53; 0.59) |
|
|
|
< 5 kg |
< 10 kg |
10-15 kg |
16-19 kg |
20-24 kg |
≥ 25 kg |
|
Overweight |
||||||
|
SGA |
0.16 |
0.16 |
0.10 |
0.08 |
0.07 |
0.05 |
|
(0.11; 0.24) |
(0.13; 0.20) |
(0.08; 0.11) |
(0.06; 0.10) |
(0.06; 0.09) |
(0.04; 0.08) |
|
|
LGA |
0.05 |
0.05 |
0.08 |
0.10 |
0.16 |
0.19 |
|
(0.02; 0.11) |
(0.04; 0.08) |
(0.07; 0.10) |
(0.08; 0.12) |
(0.13; 0.19) |
(0.15; 0.23) |
|
|
Emergency CS |
0.13 |
0.11 |
0.14 |
0.16 |
0.17 |
0.22 |
|
(0.08; 0.21) |
(0.09; 0.15) |
(0.12; 0.16) |
(0.13; 0.19) |
(0.14; 0.20) |
(0.18; 0.26) |
|
|
PPWR |
0.05 |
0.05 |
0.12 |
0.24 |
0.40 |
0.51 |
|
(0.03; 0.10) |
(0.04; 0.08) |
(0.11; 0.14) |
(0.21; 0.27) |
(0.36; 0.44) |
(0.47; 0.56) |
|
|
Obese |
||||||
|
SGA |
0.10 |
0.12 |
0.07 |
0.04 |
0.07 |
0.05 |
|
(0.07; 0.14) |
(0.09; 0.15) |
(0.06; 0.10) |
(0.02; 0.08) |
(0.04; 0.11) |
(0.02; 0.09) |
|
|
LGA |
0.10 |
0.10 |
0.13 |
0.17 |
0.26 |
0.29 |
|
(0.06; 0.14) |
(0.07; 0.14) |
(0.11; 0.17) |
(0.12; 0.23) |
(0.19; 0.34) |
(0.21; 0.40) |
|
|
Emergency CS |
0.15 |
0.15 |
0.20 |
0.21 |
0.19 |
0.26 |
|
(0.11; 0.20) |
(0.12; 0.19) |
(0.17; 0.23) |
(0.15; 0.28) |
(0.13; 0.26) |
(0.19; 0.36) |
|
|
PPWR |
0.02 |
0.04 |
0.14 |
0.29 |
0.35 |
0.42 |
|
(0.01; 0.04) |
(0.03; 0.06) |
(0.11; 0.17) |
(0.23;0.35) |
(0.28; 0.43) |
(0.34; 0.51) |
|
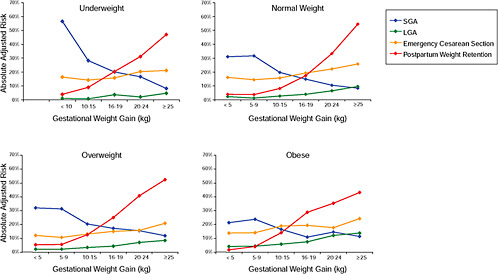
TABLE G-24 Short Primiparae, GWG–Specific Risks of Pregnancy Outcomes
|
|
< 5 kg |
< 10 kg |
10-15 kg |
16-19 kg |
20-24 kg |
≥ 25 kg |
|
Underweight |
||||||
|
SGA |
|
0.57 |
0.28 |
0.20 |
0.17 |
0.08 |
|
|
(0.46; 0.67) |
(0.23; 0.34) |
(0.15; 0.27) |
(0.11; 0.24) |
(0.04; 0.17) |
|
|
LGA |
|
0.01 |
0.01 |
0.04 |
0.02 |
0.05 |
|
|
(0.00; 0.04) |
(0.00; 0.02) |
(0.02; 0.07) |
(0.01; 0.05) |
(0.02; 0.10) |
|
|
Emergency CS |
|
0.17 |
0.14 |
0.16 |
0.20 |
0.21 |
|
|
(0.08; 0.31) |
(0.10; 0.19) |
(0.10; 0.24) |
(0.13; 0.30) |
(0.12; 0.36) |
|
|
PPWR |
|
0.04 |
0.09 |
0.20 |
0.31 |
0.47 |
|
|
(0.02; 0.09) |
(0.07; 0.12) |
(0.15; 0.26) |
(0.24; 0.39) |
(0.36; 0.58) |
|
|
Normal weight |
||||||
|
SGA |
0.31 |
0.32 |
0.20 |
0.15 |
0.11 |
0.09 |
|
(0.21; 0.45) |
(0.28; 0.36) |
(0.17; 0.22) |
(0.13; 0.17) |
(0.09; 0.13) |
(0.07; 0.11) |
|
|
LGA |
0.02 |
0.01 |
0.03 |
0.04 |
0.07 |
0.10 |
|
(0.01; 0.07) |
(0.01; 0.02) |
(0.02; 0.04) |
(0.03; 0.06) |
(0.05; 0.09) |
(0.07; 0.13) |
|
|
Emergency CS |
0.16 |
0.15 |
0.16 |
0.19 |
0.22 |
0.26 |
|
(0.07; 0.33) |
(0.12; 0.18) |
(0.14; 0.18) |
(0.17; 0.22) |
(0.19; 0.26) |
(0.22; 0.30) |
|
|
PPWR |
0.04 |
0.04 |
0.08 |
0.17 |
0.33 |
0.55 |
|
(0.01; 0.10) |
(0.03; 0.05) |
(0.07; 0.09) |
(0.15; 0.20) |
(0.29; 0.37) |
(0.50; 0.59) |
|
|
Overweight |
||||||
|
SGA |
0.23 |
0.23 |
0.14 |
0.12 |
0.11 |
0.08 |
|
(0.16; 0.33) |
(0.18; 0.28) |
(0.12; 0.17) |
(0.09; 0.15) |
(0.08; 0.14) |
(0.06; 0.11) |
|
|
LGA |
0.03 |
0.03 |
0.05 |
0.06 |
0.10 |
0.12 |
|
(0.01; 0.07) |
(0.02; 0.05) |
(0.04; 0.07) |
(0.04; 0.08) |
(0.07; 0.13) |
(0.08; 0.16) |
|
|
Emergency CS |
0.23 |
0.21 |
0.24 |
0.28 |
0.29 |
0.36 |
|
(0.14; 0.35) |
(0.16; 0.26) |
(0.21; 0.28) |
(0.23; 0.33) |
(0.24; 0.35) |
(0.30; 0.43) |
|
|
PPWR |
0.05 |
0.05 |
0.12 |
0.23 |
0.38 |
0.50 |
|
(0.03; 0.09) |
(0.04; 0.07) |
(0.10; 0.14) |
(0.20; 0.27) |
(0.33; 0.44) |
(0.44; 0.56) |
|
|
Obese |
||||||
|
SGA |
0.15 |
0.17 |
0.11 |
0.07 |
0.10 |
0.07 |
|
(0.11; 0.21) |
(0.13; 0.22) |
(0.08; 0.14) |
(0.04; 0.12) |
(0.06; 0.16) |
(0.04; 0.13) |
|
|
LGA |
0.06 |
0.06 |
0.08 |
0.11 |
0.17 |
0.19 |
|
(0.04; 0.09) |
(0.04; 0.09) |
(0.06; 0.12) |
(0.07; 0.16) |
(0.11; 0.24) |
(0.12; 0.29) |
|
|
Emergency CS |
0.26 |
0.27 |
0.33 |
0.35 |
0.32 |
0.42 |
|
(0.19; 0.34) |
(0.21; 0.33) |
(0.28; 0.39) |
(0.26; 0.44) |
(0.23; 0.42) |
(0.32; 0.53) |
|
|
PPWR |
0.02 |
0.04 |
0.13 |
0.27 |
0.34 |
0.41 |
|
(0.01; 0.03) |
(0.02; 0.06) |
(0.11; 0.16) |
(0.21;0.35) |
(0.26; 0.42) |
(0.32; 0.51) |
|
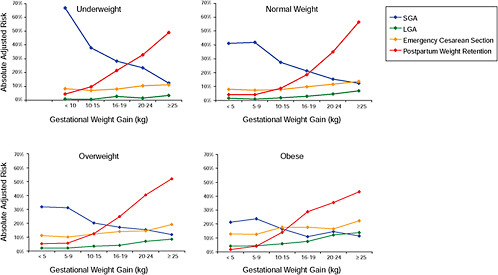
TABLE G-25 Smoking Primiparae, GWG–Specific Risks of Pregnancy Outcomes
|
|
< 5 kg |
< 10 kg |
10-15 kg |
16-19 kg |
20-24 kg |
≥ 25 kg |
|
Underweight |
||||||
|
SGA |
|
0.67 |
0.38 |
0.28 |
0.24 |
0.12 |
|
|
(0.57; 0.76) |
(0.32; 0.44) |
(0.22; 036) |
(0.17; 0.32) |
(0.06; 0.23) |
|
|
LGA |
|
0.01 |
0.01 |
0.03 |
0.02 |
0.03 |
|
|
(0.00; 0.03) |
(0.00; 0.01) |
(0.02; 0.04) |
(0.01; 0.03) |
(0.01; 0.07) |
|
|
Emergency CS |
|
0.08 |
0.07 |
0.08 |
0.11 |
0.11 |
|
|
(0.04; 0.17) |
(0.05; 0.10) |
(0.05; 0.12) |
(0.07; 0.17) |
(0.06; 0.20) |
|
|
PPWR |
|
0.04 |
0.10 |
0.21 |
0.33 |
0.49 |
|
|
(0.02; 0.10) |
(0.07; 0.12) |
(0.17; 0.27) |
(0.26; 0.40) |
(0.38; 0.59) |
|
|
Normal weight |
||||||
|
SGA |
0.41 |
0.42 |
0.28 |
0.21 |
0.15 |
0.13 |
|
(0.29; 0.55) |
(0.38; 0.46) |
(0.25; 0.30) |
(0.19; 0.24) |
(0.13; 0.18) |
(0.10; 0.15) |
|
|
LGA |
0.02 |
0.01 |
0.02 |
0.03 |
0.05 |
0.07 |
|
(0.00; 0.05) |
(0.01; 0.01) |
(0.01; 0.02) |
(0.02; 0.04) |
(0.04; 0.06) |
(0.06; 0.09) |
|
|
Emergency CS |
0.08 |
0.07 |
0.08 |
0.10 |
0.11 |
0.14 |
|
(0.03; 0.18) |
(0.06; 0.09) |
(0.07; 0.09) |
(0.09; 0.12) |
(0.10; 0.13) |
(0.11; 0.16) |
|
|
PPWR |
0.04 |
0.04 |
0.09 |
0.18 |
0.35 |
0.56 |
|
(0.02; 0.11) |
(0.03; 0.05) |
(0.08; 0.10) |
(0.17; 0.21) |
(0.32; 0.87) |
(0.53; 0.60) |
|
|
|
< 5 kg |
< 10 kg |
10-15 kg |
16-19 kg |
20-24 kg |
≥ 25 kg |
|
Overweight |
||||||
|
SGA |
0.32 |
0.23 |
0.20 |
0.17 |
0.15 |
0.12 |
|
(0.31; 0.33) |
(0.26; 0.37) |
(0.17; 0.23) |
(0.14; 0.21) |
(0.12; 0.19) |
(0.09; 0.16) |
|
|
LGA |
0.02 |
0.02 |
0.03 |
0.04 |
0.07 |
0.08 |
|
(0.01; 0.05) |
(0.01; 0.03) |
(0.03; 0.04) |
(0.03; 0.06) |
(0.05; 0.09) |
(0.06; 0.11) |
|
|
Emergency CS |
0.12 |
0.11 |
0.13 |
0.15 |
0.16 |
0.20 |
|
(0.07; 0.20) |
(0.08; 0.14) |
(0.11; 0.15) |
(0.12; 0.18) |
(0.13; 0.19) |
(0.16; 0.25) |
|
|
PPWR |
0.05 |
0.06 |
0.12 |
0.25 |
0.40 |
0.52 |
|
(0.03; 0.10) |
(0.04; 0.08) |
(0.11; 0.14) |
(0.21; 0.28) |
(0.36; 0.45) |
(0.47; 0.57) |
|
|
Obese |
||||||
|
SGA |
0.22 |
0.24 |
0.16 |
0.10 |
0.15 |
0.10 |
|
(0.16; 0.29) |
(0.19; 0.30) |
(0.13; 0.20) |
(0.06; 0.17) |
(0.09; 0.23) |
(0.05; 0.19) |
|
|
LGA |
0.04 |
0.04 |
0.06 |
0.08 |
0.12 |
0.14 |
|
(0.03; 0.06) |
(0.03; 0.06) |
(0.04; 0.08) |
(0.05; 0.11) |
(0.08; 0.17) |
(0.09; 0.21) |
|
|
Emergency CS |
0.14 |
0.14 |
0.19 |
0.20 |
0.18 |
0.25 |
|
(0.10; 0.19) |
(0.11; 0.19) |
(0.15; 0.23) |
(0.14; 0.27) |
(0.12; 0.25) |
(0.18; 0.34) |
|
|
PPWR |
0.02 |
0.04 |
0.14 |
0.29 |
0.35 |
0.43 |
|
(0.01; 0.04) |
(0.02; 0.06) |
(0.11; 0.17) |
(0.23;0.36) |
(0.28; 0.43) |
(0.34; 0.52) |
|
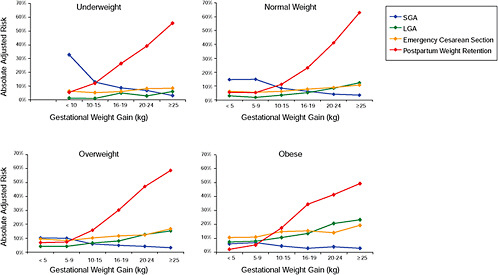
TABLE G-26 Young Primiparae, GWG–Specific Risks of Pregnancy Outcomes
|
|
< 5 kg |
< 10 kg |
10-15 kg |
16-19 kg |
20-24 kg |
≥ 25 kg |
|
Underweight |
||||||
|
SGA |
|
0.33 |
0.13 |
0.09 |
0.07 |
0.03 |
|
|
(0.22; 0.46) |
(0.09; 0.18) |
(0.06; 0.14) |
(0.04; 0.12) |
(0.01; 0.07) |
|
|
LGA |
|
0.01 |
0.01 |
0.05 |
0.03 |
0.06 |
|
|
(0.00; 0.06) |
(0.00; 0.02) |
(0.03; 0.09) |
(0.01; 0.07) |
(0.03; 0.14) |
|
|
Emergency CS |
|
0.06 |
0.05 |
0.06 |
0.08 |
0.09 |
|
|
(0.03; 0.14) |
(0.03; 0.09) |
(0.03; 0.11) |
(0.05; 0.14) |
(0.04; 0.17) |
|
|
PPWR |
|
0.06 |
0.12 |
0.27 |
0.39 |
0.56 |
|
|
(0.02; 0.13) |
(0.09; 0.17) |
(0.20; 0.35) |
(0.30; 0.49) |
(0.44; 0.67) |
|
|
Normal weight |
||||||
|
SGA |
0.15 |
0.15 |
0.09 |
0.06 |
0.04 |
0.03 |
|
(0.08; 0.24) |
(0.11; 0.21) |
(0.06; 0.12) |
(0.04; 0.09) |
(0.03; 0.06) |
(0.02; 0.05) |
|
|
LGA |
0.03 |
0.02 |
0.03 |
0.05 |
0.08 |
0.12 |
|
(0.01; 0.10) |
(0.01; 0.03) |
(0.02; 0.05) |
(0.03; 0.08) |
(0.05; 0.13) |
(0.08; 0.19) |
|
|
Emergency CS |
0.06 |
0.06 |
0.06 |
0.08 |
0.09 |
0.11 |
|
(0.02; 0.15) |
(0.04; 0.89) |
(0.04; 0.09) |
(0.05; 0.11) |
(0.06; 0.13) |
(0.07; 0.15) |
|
|
PPWR |
0.05 |
0.05 |
0.11 |
0.23 |
0.41 |
0.63 |
|
(0.02; 0.14) |
(0.04; 0.07) |
(0.09; 0.14) |
(0.19; 0.28) |
(0.35; 0.48) |
(0.56; 0.69) |
|
|
Overweight |
||||||
|
SGA |
0.10 |
0.10 |
0.06 |
0.05 |
0.04 |
0.03 |
|
(0.06; 0.17) |
(0.07; 0.15) |
(0.04; 0.08) |
(0.03; 0.07) |
(0.03; 0.07) |
(0.02; 0.05) |
|
|
LGA |
0.04 |
0.04 |
0.06 |
0.08 |
0.13 |
0.15 |
|
(0.02; 0.09) |
(0.02; 0.07) |
(0.04; 0.10) |
(0.05; 0.12) |
(0.08; 0.19) |
(0.10; 0.23) |
|
|
Emergency CS |
0.09 |
0.08 |
0.10 |
0.12 |
0.13 |
0.16 |
|
(0.05; 0.17) |
(0.05; 0.13) |
(0.07; 0.14) |
(0.08; 0.17) |
(0.09; 0.18) |
(0.11; 0.23) |
|
|
PPWR |
0.07 |
0.07 |
0.16 |
0.30 |
0.47 |
0.59 |
|
(0.03; 0.13) |
(0.05; 0.11) |
(0.12; 0.20) |
(0.24; 0.37) |
(0.40; 0.54) |
(0.51; 0.66) |
|
|
Obese |
||||||
|
SGA |
0.06 |
0.07 |
0.05 |
0.03 |
0.04 |
0.03 |
|
(0.04; 0.10) |
(0.05; 0.11) |
(0.03; 0.07) |
(0.01; 0.05) |
(0.02; 0.07) |
(0.01; 0.06) |
|
|
LGA |
0.08 |
0.08 |
0.11 |
0.14 |
0.21 |
0.24 |
|
(0.04; 0.13) |
(0.05; 0.13) |
(0.07; 0.17) |
(0.08; 0.22) |
(0.13; 0.33) |
(0.15; 0.38) |
|
|
Emergency CS |
0.11 |
0.11 |
0.15 |
0.16 |
0.14 |
0.20 |
|
(0.07; 0.17) |
(0.07; 0.17) |
(0.10; 0.21) |
(0.10; 0.24) |
(0.09; 0.22) |
(0.13; 0.30) |
|
|
PPWR |
0.02 |
0.05 |
0.18 |
0.35 |
0.42 |
0.50 |
|
(0.01; 0.05) |
(0.03; 0.09) |
(0.13; 0.23) |
(0.27; 0.45) |
(0.32; 0.52) |
(0.39; 0.60) |
|
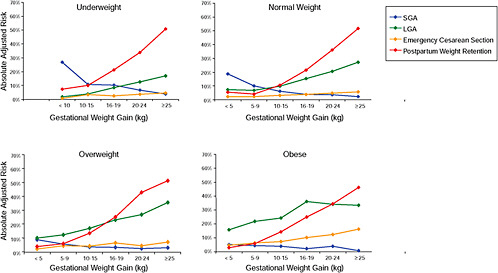
TABLE G-27 Unexposed Multiparae, GWG–Specific Risks of Pregnancy Outcomes
|
|
< 5 kg |
< 10 kg |
10-15 kg |
16-19 kg |
20-24 kg |
≥ 25 kg |
|
Underweight |
||||||
|
SGA |
|
0.27 |
0.11 |
0.10 |
0.07 |
0.04 |
|
|
(0.19; 0.36) |
(0.09; 0.14) |
(0.08; 0.14) |
(0.04; 0.11) |
(0.01; 0.10) |
|
|
LGA |
|
0.02 |
0.04 |
0.08 |
0.13 |
0.17 |
|
|
(0.01; 0.06) |
(0.03; 0.06) |
(0.06; 0.12) |
(0.08; 0.19) |
(0.09; 0.30) |
|
|
Emergency CS |
|
0.01 |
0.03 |
0.03 |
0.04 |
0.04 |
|
|
(0.00; 0.05) |
(0.02; 0.05) |
(0.01; 0.05) |
(0.02; 0.08) |
(0.01; 0.13) |
|
|
PPWR |
|
0.07 |
0.10 |
0.21 |
0.34 |
0.51 |
|
|
(0.04; 0.13) |
(0.08; 0.13) |
(0.17; 0.26) |
(0.27; 0.41) |
(0.39; 0.62) |
|
|
Normal weight |
||||||
|
SGA |
0.19 |
0.10 |
0.06 |
0.04 |
0.04 |
0.02 |
|
(0.13; 0.27) |
(0.08; 0.12) |
(0.05; 0.07) |
(0.03; 0.05) |
(0.03; 0.05) |
(0.02; 0.03) |
|
|
LGA |
0.07 |
0.07 |
0.10 |
0.15 |
0.20 |
0.27 |
|
(0.04; 0.14) |
(0.06; 0.08) |
(0.09; 0.11) |
(0.14; 0.17) |
(0.18; 0.23) |
(0.24; 0.31) |
|
|
Emergency CS |
0.02 |
0.02 |
0.03 |
0.04 |
0.05 |
0.06 |
|
(0.01; 0.07) |
(0.02; 0.03) |
(0.03; 0.04) |
(0.03; 0.05) |
(0.04; 0.06) |
(0.04; 0.07) |
|
|
PPWR |
0.05 |
0.04 |
0.11 |
0.22 |
0.36 |
0.52 |
|
(0.03; 0.11) |
(0.03; 0.05) |
(0.10; 0.12) |
(0.20; 0.23) |
(0.33; 0.39) |
(0.48; 0.55) |
|
|
|
< 5 kg |
< 10 kg |
10-15 kg |
16-19 kg |
20-24 kg |
≥ 25 kg |
|
Overweight |
||||||
|
SGA |
0.09 |
0.06 |
0.04 |
0.03 |
0.02 |
0.03 |
|
(0.06; 0.13) |
(0.04; 0.07) |
(0.03; 0.05) |
(0.02; 0.05) |
(0.01; 0.04) |
(0.02; 0.05) |
|
|
LGA |
0.10 |
0.13 |
0.17 |
0.23 |
0.27 |
0.36 |
|
(0.07; 0.15) |
(0.10; 0.15) |
(0.15; 0.19) |
(0.20; 0.26) |
(0.24; 0.31) |
(0.31; 0.41) |
|
|
Emergency CS |
0.02 |
0.05 |
0.05 |
0.07 |
0.04 |
0.07 |
|
(0.01; 0.05) |
(0.03; 0.06) |
(0.04; 0.06) |
(0.05; 0.09) |
(0.03; 0.07) |
(0.05; 0.11) |
|
|
PPWR |
0.04 |
0.06 |
0.14 |
0.25 |
0.43 |
0.51 |
|
(0.02; 0.07) |
(0.05; 0.08) |
(0.12; 0.15) |
(0.22; 0.28) |
(0.39; 0.47) |
(0.46; 0.56) |
|
|
Obese |
||||||
|
SGA |
0.05 |
0.04 |
0.05 |
0.02 |
0.04 |
0.01 |
|
(0.03; 0.07) |
(0.03; 0.06) |
(0.03; 0.06) |
(0.01; 0.05) |
(0.02; 0.08) |
(0.00; 0.05) |
|
|
LGA |
0.16 |
0.22 |
0.24 |
0.36 |
0.34 |
0.35 |
|
(0.13; 0.20) |
(0.19; 0.26) |
(0.21; 0.28) |
(0.30; 0.44) |
(0.26; 0.42) |
(0.26; 0.45) |
|
|
Emergency CS |
0.05 |
0.06 |
0.07 |
0.10 |
0.12 |
0.16 |
|
(0.03; 0.07) |
(0.04; 0.09) |
(0.05; 0.10) |
(0.06; 0.16) |
(0.08; 0.20) |
(0.09; 0.26) |
|
|
PPWR |
0.03 |
0.06 |
0.14 |
0.25 |
0.34 |
0.46 |
|
(0.02; 0.05) |
(0.04; 0.08) |
(0.12; 0.17) |
(0.20; 0.31) |
(0.27; 0.42) |
(0.36; 0.56) |
|
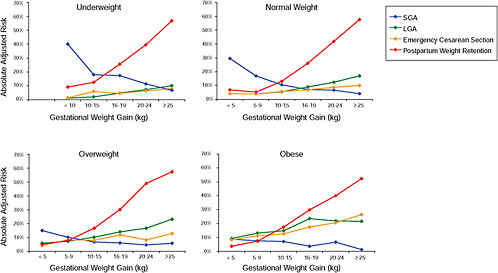
TABLE G-28 Short Multiparae, GWG–Specific Risks of Pregnancy Outcomes
|
|
< 5 kg |
< 10 kg |
10-15 kg |
16-19 kg |
20-24 kg |
≥ 25 kg |
|
Underweight |
||||||
|
SGA |
|
0.40 |
0.18 |
0.18 |
0.12 |
0.07 |
|
|
(0.30; 0.52) |
(0.14; 0.23) |
(0.13; 0.24) |
(0.07; 0.19) |
(0.03; 0.17) |
|
|
LGA |
|
0.01 |
0.02 |
0.05 |
0.07 |
0.10 |
|
|
(0.00; 0.03) |
(0.01; 0.03) |
(0.03; 0.07) |
(0.05; 0.11) |
(0.05; 0.19) |
|
|
Emergency CS |
|
0.01 |
0.06 |
0.05 |
0.06 |
0.08 |
|
|
(0.00; 0.09) |
(0.04; 0.09) |
(0.02; 0.09) |
(0.03; 0.14) |
(0.03; 0.22) |
|
|
PPWR |
|
0.09 |
0.13 |
0.26 |
0.39 |
0.57 |
|
|
(0.05; 0.16) |
(0.10; 0.16) |
(0.20; 0.32) |
(0.32; 0.48) |
(0.45; 0.68) |
|
|
Normal weight |
||||||
|
SGA |
0.30 |
0.17 |
0.11 |
0.07 |
0.07 |
0.04 |
|
(0.21; 0.41) |
(0.14; 0.21) |
(0.09; 0.13) |
(0.06; 0.09) |
(0.05; 0.09) |
(0.03; 0.06) |
|
|
LGA |
0.04 |
0.04 |
0.06 |
0.09 |
0.12 |
0.17 |
|
(0.02; 0.09) |
(0.03; 0.05) |
(0.05; 0.07) |
(0.07; 0.11) |
(0.10; 0.15) |
(0.14; 0.21) |
|
|
Emergency CS |
0.04 |
0.04 |
0.06 |
0.07 |
0.09 |
0.10 |
|
(0.01; 0.12) |
(0.03; 0.06) |
(0.04; 0.07) |
(0.05; 0.09) |
(0.07; 0.11) |
(0.07; 0.14) |
|
|
PPWR |
0.07 |
0.05 |
0.13 |
0.26 |
0.42 |
0.58 |
|
(0.03; 0.13) |
(0.04; 0.07) |
(0.11; 0.15) |
(0.23; 0.29) |
(0.38; 0.46) |
(0.53; 0.62) |
|
|
Overweight |
||||||
|
SGA |
0.15 |
0.10 |
0.07 |
0.06 |
0.04 |
0.05 |
|
(0.10; 0.21) |
(0.08; 0.13) |
(0.05; 0.09) |
(0.04; 0.09) |
(0.03; 0.07) |
(0.03; 0.09) |
|
|
LGA |
0.06 |
0.07 |
0.10 |
0.14 |
0.17 |
0.23 |
|
(0.04; 0.09) |
(0.06; 0.09) |
(0.08; 0.12) |
(0.11; 0.17) |
(0.14; 0.21) |
(0.19; 0.29) |
|
|
Emergency CS |
0.04 |
0.08 |
0.08 |
0.12 |
0.08 |
0.13 |
|
(0.02; 0.09) |
(0.06; 0.12) |
(0.06; 0.10) |
(0.09; 0.16) |
(0.05; 0.12) |
(0.09; 0.19) |
|
|
PPWR |
0.05 |
0.08 |
0.17 |
0.30 |
0.49 |
0.57 |
|
(0.03; 0.09) |
(0.06; 0.10) |
(0.14; 0.19) |
(0.26; 0.34) |
(0.44; 0.54) |
(0.51; 0.63) |
|
|
Obese |
||||||
|
SGA |
0.09 |
0.07 |
0.07 |
0.04 |
0.07 |
0.01 |
|
(0.06; 0.13) |
(0.05; 0.10) |
(0.05; 0.10) |
(0.02; 0.09) |
(0.03; 0.14) |
(0.00; 0.09) |
|
|
LGA |
0.09 |
0.13 |
0.15 |
0.24 |
0.21 |
0.22 |
|
(0.07; 0.12) |
(0.10; 0.17) |
(0.12; 0.18) |
(0.18; 0.31) |
(0.15; 0.29) |
(0.15; 0.31) |
|
|
Emergency CS |
0.08 |
0.11 |
0.13 |
0.18 |
0.21 |
0.26 |
|
(0.05; 0.13) |
(0.08; 0.15) |
(0.09; 0.17) |
(0.11; 0.27) |
(0.13; 0.32) |
(0.15; 0.40) |
|
|
PPWR |
0.04 |
0.07 |
0.18 |
0.30 |
0.40 |
0.52 |
|
(0.02; 0.06) |
(0.05; 0.10) |
(0.14; 0.21) |
(0.23; 0.37) |
(0.31; 0.48) |
(0.42; 0.62) |
|
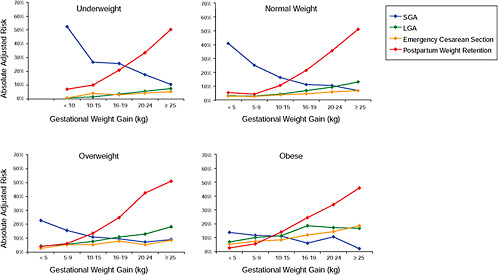
TABLE G-29 Smoking Multiparae, GWG–Specific Risks of Pregnancy Outcomes
|
|
< 5 kg |
< 10 kg |
10-15 kg |
16-19 kg |
20-24 kg |
≥ 25 kg |
|
Underweight |
||||||
|
SGA |
|
0.53 |
0.27 |
0.26 |
0.18 |
0.11 |
|
|
(0.42; 0.64) |
(0.22; 0.33) |
(0.20; 0.33) |
(0.11; 0.27) |
(0.04; 0.25) |
|
|
LGA |
|
0.01 |
0.02 |
0.04 |
0.05 |
0.108 |
|
|
(0.00; 0.02) |
(0.01; 0.03) |
(0.02; 0.05) |
(0.03; 0.09) |
(0.04; 0.14) |
|
|
Emergency CS |
|
0.01 |
0.04 |
0.03 |
0.04 |
0.05 |
|
|
(0.00; 0.06) |
(0.03; 0.06) |
(0.01; 0.06) |
(0.02; 0.09) |
(0.02; 0.15) |
|
|
PPWR |
|
0.07 |
0.10 |
0.21 |
0.33 |
0.50 |
|
|
(0.04; 0.13) |
(0.08; 0.12) |
(0.17; 0.26) |
(0.27; 0.41) |
(0.38; 0.62) |
|
|
Normal weight |
||||||
|
SGA |
0.41 |
0.25 |
0.16 |
0.11 |
0.11 |
0.07 |
|
(0.30; 0.53) |
(0.21; 0.29) |
(0.14; 0.19) |
(0.09; 0.13) |
(0.09; 0.13) |
(0.05; 0.09) |
|
|
LGA |
0.03 |
0.03 |
0.04 |
0.07 |
0.09 |
0.13 |
|
(0.02; 0.06) |
(0.02; 0.04) |
(0.04; 0.05) |
(0.06; 0.08) |
(0.08; 0.11) |
(0.11; 0.15) |
|
|
Emergency CS |
0.03 |
0.03 |
0.04 |
0.04 |
0.06 |
0.07 |
|
(0.01; 0.08) |
(0.02; 0.04) |
(0.03; 0.05) |
(0.04; 0.06) |
(0.04; 0.07) |
(0.05; 0.09) |
|
|
PPWR |
0.05 |
0.04 |
0.10 |
0.21 |
0.36 |
0.51 |
|
(0.03; 0.10) |
(0.03; 0.05) |
(0.09; 0.12) |
(0.19; 0.24) |
(0.33; 0.39) |
(0.47; 0.55) |
|
|
|
< 5 kg |
< 10 kg |
10-15 kg |
16-19 kg |
20-24 kg |
≥ 25 kg |
|
Overweight |
||||||
|
SGA |
0.22 |
0.16 |
0.11 |
0.10 |
0.07 |
0.09 |
|
(0.16; 0.30) |
(0.12; 0.20) |
(0.09; 0.13) |
(0.07; 0.13) |
(0.04; 0.10) |
(0.05; 0.14) |
|
|
LGA |
0.04 |
0.05 |
0.08 |
0.11 |
0.13 |
0.18 |
|
(0.03; 0.07) |
(0.04; 0.07) |
(0.07; 0.09) |
(0.09; 0.13) |
(0.11; 0.16) |
(0.15; 0.22) |
|
|
Emergency CS |
0.03 |
0.05 |
0.05 |
0.08 |
0.05 |
0.09 |
|
(0.01; 0.06) |
(0.04; 0.08) |
(0.04; 0.7) |
(0.06; 0.11) |
(0.03; 0.08) |
(0.06; 0.13) |
|
|
PPWR |
0.04 |
0.06 |
0.13 |
0.25 |
0.43 |
0.51 |
|
(0.02; 0.07) |
(0.05; 0.08) |
(0.12; 0.15) |
(0.22; 0.28) |
(0.38; 0.47) |
(0.45; 0.56) |
|
|
Obese |
||||||
|
SGA |
0.13 |
0.12 |
0.11 |
0.06 |
0.11 |
0.02 |
|
(0.09; 0.19) |
(0.08; 0.16) |
(0.08; 0.15) |
(0.03; 0.14) |
(0.05; 0.21) |
(0.00; 0.25) |
|
|
LGA |
0.07 |
0.10 |
0.11 |
0.19 |
0.17 |
0.17 |
|
(0.05; 0.09) |
(0.08; 0.13) |
(0.09; 0.14) |
(0.14; 0.24) |
(0.12; 0.23) |
(0.12; 0.31) |
|
|
Emergency CS |
0.05 |
0.07 |
0.08 |
0.12 |
0.14 |
0.18 |
|
(0.03; 0.09) |
(0.05; 0.10) |
(0.06; 0.11) |
(0.07; 0.19) |
(0.09; 0.23) |
(0.10; 0.29) |
|
|
PPWR |
0.03 |
0.06 |
0.14 |
0.25 |
0.33 |
0.45 |
|
(0.02; 0.05) |
(0.04; 0.08) |
(0.12; 0.17) |
(0.19; 0.31) |
(0.26; 0.42) |
(0.36; 0.56) |
|
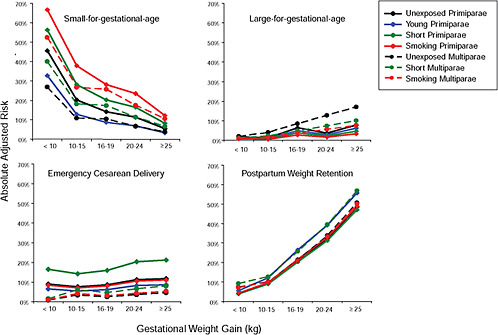
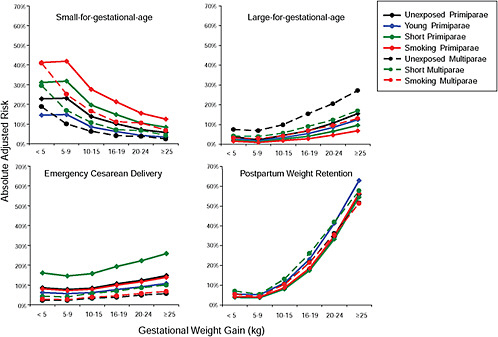
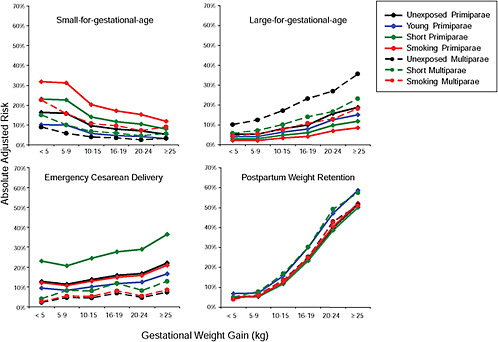
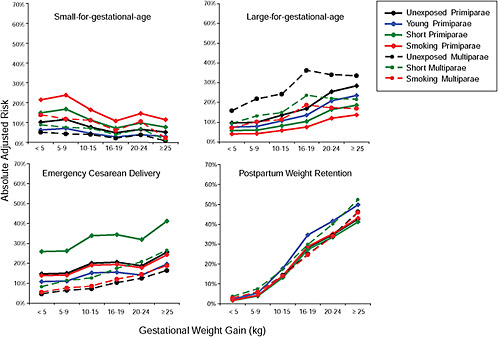
For emergency cesarean delivery and postpartum weight retention, the above analyses were repeated with adjustment for birth weight. When adjusted for birth weight, the presented absolute risk was that of a woman giving birth to a 3,500-3,999 g infant. These results are presented in:
-
Figure G-35 (Tables G-30A through G-30D): Underweight women, risks before and after adjustment for birth weight
-
Figure G-36 (Tables G-31A through G-31D): Normal weight women, risks before and after adjustment for birth weight
-
Figure G-37 (Tables G-32A though G-32D): Overweight women, risks before and after adjustment for birth weight
-
Figure G-38 (Tables G-33A through G-33D): Obese women, risks before and after adjustment for birth weight
In summary, the findings showed that, in addition to prepregnancy BMI, other characteristics were associated with a woman’s risk of important pregnancy outcomes.
Parity
-
The mean GWG in primiparae was higher than in multiparae (15.7 kg vs. 14.6 kg), which may be needed to eliminate excess risk of giving birth to a SGA infant. Thus, risk of SGA was 46 percent and 22 percent in underweight and normal weight primiparae with GWG < 10 kg.
-
In contrast, the average risk of SGA was much lower among multiparous women. Among underweight and normal weight multiparae, an absolute risk at or below 10 percent was reached at 2-3 GWG categories lower than among primiparae.
-
Risk of postpartum weight retention increased steeply with increasing gain irrespective of parity.
-
Although LGA was responsive to increasing GWG, a considerable excess risk of LGA was only present in obese primiparae and multiparous women.
-
These findings suggest that a multiparous woman may reach an overall favorable pregnancy outcome at a lower GWG than needed for a primiparous woman, and that recommendations for GWG could be lower in multiparous than in primiparous women.
Height
-
These data could not confirm the idea included in the IOM (1990) guidelines that short (< 157 cm) women should gain at the lower
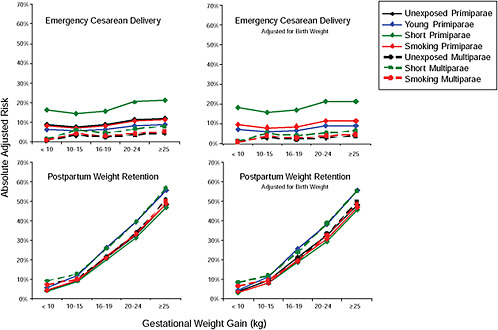
FIGURE G-35 Underweight women, emergency cesarean delivery (CS) and postpartum weight retention (PPWR) with and without adjustment for birth weight.
NOTE: Absolute risks in different types of underweight women. When adjusted for birth weight, the presented risk is that of a women giving birth to a 3,500-3,999 g infant.
TABLE G-30A Emergency Cesarean Delivery (CS) in Different Types of Underweight Women by GWG
|
|
< 10 kg |
10-15 kg |
16-19 kg |
20-24 kg |
≥ 25 kg |
|
Unexposed primipara |
0.09 |
0.08 |
0.09 |
0.11 |
0.12 |
|
Young primipara |
0.06 |
0.05 |
0.06 |
0.08 |
0.09 |
|
Short primipara |
0.16 |
0.14 |
0.16 |
0.20 |
0.21 |
|
Smoking primipara |
0.08 |
0.07 |
0.08 |
0.11 |
0.11 |
|
Unexposed multipara |
0.01 |
0.03 |
0.03 |
0.04 |
0.04 |
|
Short multipara |
0.01 |
0.06 |
0.05 |
0.06 |
0.08 |
|
Smoking multipara |
0.01 |
0.04 |
0.03 |
0.04 |
0.05 |
TABLE G-30B Emergency Cesarean Delivery (CS) with Adjustment for Birth Weight in Different Types of Underweight Women by GWG
|
|
< 10 kg |
10-15 kg |
16-19 kg |
20-24 kg |
≥ 25 kg |
|
Unexposed primipara |
0.10 |
0.08 |
0.09 |
0.12 |
0.11 |
|
Young primipara |
0.07 |
0.06 |
0.07 |
0.09 |
0.09 |
|
Short primipara |
0.18 |
0.16 |
0.17 |
0.22 |
0.21 |
|
Smoking primipara |
0.10 |
0.08 |
0.09 |
0.12 |
0.11 |
|
Unexposed multipara |
0.01 |
0.03 |
0.02 |
0.03 |
0.04 |
|
Short multipara |
0.01 |
0.05 |
0.04 |
0.05 |
0.06 |
|
Smoking multipara |
0.01 |
0.04 |
0.03 |
0.04 |
0.05 |
TABLE G-30C Postpartum Weight Retention (PPWR) in Different Types of Underweight Women by GWG
|
|
< 10 kg |
10-15 kg |
16-19 kg |
20-24 kg |
≥ 25 kg |
|
Unexposed primipara |
0.04 |
0.09 |
0.21 |
0.32 |
0.48 |
|
Young primipara |
0.06 |
0.12 |
0.26 |
0.39 |
0.56 |
|
Short primipara |
0.04 |
0.09 |
0.20 |
0.31 |
0.47 |
|
Smoking primipara |
0.04 |
0.10 |
0.22 |
0.33 |
0.49 |
|
Unexposed multipara |
0.07 |
0.10 |
0.21 |
0.34 |
0.51 |
|
Short multipara |
0.09 |
0.13 |
0.26 |
0.39 |
0.57 |
|
Smoking multipara |
0.07 |
0.10 |
0.21 |
0.33 |
0.50 |
TABLE G-30D Postpartum Weight Retention (PPWR) with Adjustment for Birth Weight in Different Types of Underweight Women by GWG
|
|
< 10 kg |
10-15 kg |
16-19 kg |
20-24 kg |
≥ 25 kg |
|
Unexposed primipara |
0.04 |
0.09 |
0.21 |
0.32 |
0.48 |
|
Young primipara |
0.05 |
0.12 |
0.26 |
0.38 |
0.55 |
|
Short primipara |
0.03 |
0.08 |
0.19 |
0.29 |
0.45 |
|
Smoking primipara |
0.04 |
0.08 |
0.20 |
0.31 |
0.47 |
|
Unexposed multipara |
0.07 |
0.10 |
0.20 |
0.33 |
0.50 |
|
Short multipara |
0.09 |
0.12 |
0.24 |
0.39 |
0.55 |
|
Smoking multipara |
0.07 |
0.09 |
0.19 |
0.33 |
0.49 |
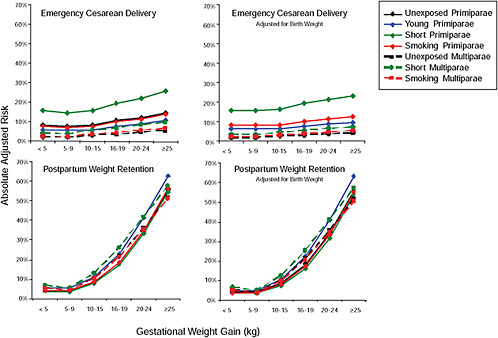
FIGURE G-36 Normal weight women, emergency cesarean delivery (CS) and postpartum weight retention (PPWR) with and without adjustment for birth weight.
NOTE: Absolute risks in different types of normal weight women. When adjusted for birth weight, the presented risk is that of a women giving birth to a 3,500-3,999 g infant.
TABLE G-31A Emergency Cesarean Delivery (CS) in Different Types of Normal Weight Women by GWG
|
|
< 5 kg |
5-9 kg |
10-15 kg |
16-19 kg |
20-24 kg |
25+ kg |
|
Unexposed primipara |
0.09 |
0.08 |
0.08 |
0.11 |
0.12 |
0.15 |
|
Young primipara |
0.06 |
0.06 |
0.06 |
0.08 |
0.09 |
0.11 |
|
Short primipara |
0.16 |
0.15 |
0.16 |
0.19 |
0.22 |
0.26 |
|
Smoking primipara |
0.08 |
0.07 |
0.08 |
0.10 |
0.12 |
0.14 |
|
Unexposed multipara |
0.02 |
0.02 |
0.03 |
0.04 |
0.05 |
0.06 |
|
Short multipara |
0.04 |
0.04 |
0.06 |
0.07 |
0.09 |
0.10 |
|
Smoking multipara |
0.03 |
0.03 |
0.04 |
0.04 |
0.06 |
0.07 |
TABLE G-31B Emergency Cesarean Delivery (CS) with Adjustment for Birth Weight in Different Types of Normal Weight Women by GWG
|
|
< 5 kg |
5-9 kg |
10-15 kg |
16-19 kg |
20-24 kg |
25+ kg |
|
Unsed primipara |
0.08 |
0.08 |
0.09 |
0.10 |
0.11 |
0.13 |
|
Young primipara |
0.06 |
0.06 |
0.07 |
0.08 |
0.09 |
0.10 |
|
Short primipara |
0.16 |
0.16 |
0.17 |
0.20 |
0.21 |
0.23 |
|
Smoking primipara |
0.08 |
0.08 |
0.09 |
0.10 |
0.11 |
0.13 |
|
Unexposed multipara |
0.02 |
0.02 |
0.03 |
0.03 |
0.04 |
0.04 |
|
Short multipara |
0.03 |
0.03 |
0.05 |
0.06 |
0.07 |
0.08 |
|
Smoking multipara |
0.02 |
0.02 |
0.03 |
0.04 |
0.05 |
0.05 |
TABLE G-31C Postpartum Weight Retention (PPWR) in Different Types of Normal Weight Women by GWG
|
|
< 5 kg |
5-9 kg |
10-15 kg |
16-19 kg |
20-24 kg |
25+ kg |
|
Unexposed primipara |
0.04 |
0.04 |
0.09 |
0.18 |
0.34 |
0.56 |
|
Young primipara |
0.05 |
0.05 |
0.11 |
0.23 |
0.41 |
0.63 |
|
Short primipara |
0.04 |
0.04 |
0.08 |
0.18 |
0.33 |
0.54 |
|
Smoking primipara |
0.04 |
0.04 |
0.09 |
0.19 |
0.35 |
0.56 |
|
Unexposed multipara |
0.05 |
0.04 |
0.11 |
0.22 |
0.36 |
0.52 |
|
Short multipara |
0.07 |
0.05 |
0.13 |
0.26 |
0.42 |
0.58 |
|
Smoking multipara |
0.05 |
0.04 |
0.10 |
0.21 |
0.36 |
0.51 |
TABLE G-31D Postpartum Weight Retention (PPWR) with Adjustment for Birth Weight in Different Types of Normal Weight Women by GWG
|
|
< 5 kg |
5-9 kg |
10-15 kg |
16-19 kg |
20-24 kg |
25+ kg |
|
Unexposed primipara |
0.04 |
0.04 |
0.09 |
0.18 |
0.34 |
0.56 |
|
Young primipara |
0.05 |
0.05 |
0.11 |
0.23 |
0.41 |
0.63 |
|
Short primipara |
0.03 |
0.03 |
0.07 |
0.16 |
0.32 |
0.54 |
|
Smoking primipara |
0.04 |
0.04 |
0.08 |
0.17 |
0.33 |
0.55 |
|
Unexposed multipara |
0.05 |
0.04 |
0.10 |
0.21 |
0.36 |
0.52 |
|
Short multipara |
0.07 |
0.05 |
0.12 |
0.25 |
0.41 |
0.57 |
|
Smoking multipara |
0.05 |
0.04 |
0.10 |
0.21 |
0.35 |
0.51 |
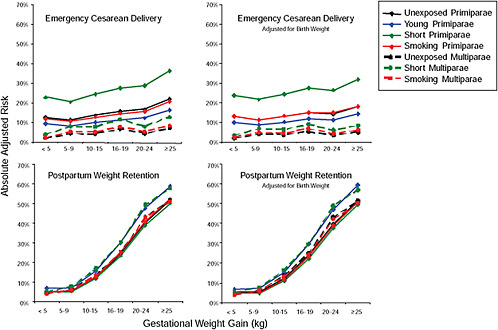
FIGURE G-37 Overweight women, emergency cesarean delivery (CS) and postpartum weight retention (PPWR) with and without adjustment for birth weight.
NOTE: Absolute risks in different types of overweight women. When adjusted for birth weight, the presented risk is that of a women giving birth to a 3,500-3,999 g infant.
TABLE G-32A Emergency Cesarean Delivery (CS) in Different Types of Overweight Women by GWG
|
|
< 5 kg |
5-9 kg |
10-15 kg |
16-19 kg |
20-24 kg |
≥ 25 kg |
|
Unexposed primipara |
0.13 |
0.11 |
0.14 |
0.16 |
0.17 |
0.22 |
|
Young primipara |
0.09 |
0.08 |
0.10 |
0.12 |
0.12 |
0.17 |
|
Short primipara |
0.23 |
0.21 |
0.25 |
0.28 |
0.29 |
0.36 |
|
Smoking primipara |
0.12 |
0.11 |
0.13 |
0.15 |
0.16 |
0.21 |
|
Unexposed multipara |
0.02 |
0.05 |
0.05 |
0.07 |
0.05 |
0.07 |
|
Short multipara |
0.04 |
0.08 |
0.08 |
0.12 |
0.08 |
0.13 |
|
Smoking multipara |
0.03 |
0.05 |
0.05 |
0.08 |
0.05 |
0.09 |
TABLE G-32B Emergency Cesarean Delivery (CS) with Adjustment for Birth Weight in Different Types of Overweight Women by GWG
|
|
< 5 kg |
5-9 kg |
10-15 kg |
16-19 kg |
20-24 kg |
≥ 25 kg |
|
Unexposed primipara |
0.13 |
0.11 |
0.13 |
0.15 |
0.15 |
0.18 |
|
Young primipara |
0.10 |
0.09 |
0.10 |
0.12 |
0.11 |
0.14 |
|
Short primipara |
0.24 |
0.21 |
0.24 |
0.27 |
0.27 |
0.32 |
|
Smoking primipara |
0.13 |
0.12 |
0.13 |
0.15 |
0.15 |
0.18 |
|
Unexposed multipara |
0.02 |
0.04 |
0.04 |
0.05 |
0.03 |
0.05 |
|
Short multipara |
0.03 |
0.07 |
0.06 |
0.09 |
0.06 |
0.08 |
|
Smoking multipara |
0.02 |
0.05 |
0.05 |
0.07 |
0.04 |
0.06 |
TABLE G-32C Postpartum Weight Retention (PPWR) in Different Types of Overweight Women by GWG
|
|
< 5 kg |
5-9 kg |
10-15 kg |
16-19 kg |
20-24 kg |
≥ 25 kg |
|
Unexposed primipara |
0.05 |
0.05 |
0.012 |
0.24 |
0.40 |
0.52 |
|
Young primipara |
0.07 |
0.07 |
0.16 |
0.30 |
0.47 |
0.59 |
|
Short primipara |
0.05 |
0.05 |
0.12 |
0.23 |
0.39 |
0.50 |
|
Smoking primipara |
0.05 |
0.06 |
0.12 |
0.25 |
0.40 |
0.52 |
|
Unexposed multipara |
0.04 |
0.06 |
0.14 |
0.25 |
0.43 |
0.51 |
|
Short multipara |
0.05 |
0.08 |
0.17 |
0.30 |
0.49 |
0.57 |
|
Smoking multipara |
0.04 |
0.06 |
0.13 |
0.25 |
0.43 |
0.51 |
TABLE G-32D Postpartum Weight Retention (PPWR) with Adjustment for Birth Weight in Different Types of Overweight Women by GWG
|
|
< 5 kg |
5-9 kg |
10-15 kg |
16-19 kg |
20-24 kg |
≥ 25 kg |
|
Unexposed primipara |
0.05 |
0.05 |
0.12 |
0.24 |
0.40 |
0.51 |
|
Young primipara |
0.07 |
0.07 |
0.15 |
0.30 |
0.47 |
0.59 |
|
Short primipara |
0.05 |
0.05 |
0.11 |
0.22 |
0.37 |
0.49 |
|
Smoking primipara |
0.05 |
0.05 |
0.12 |
0.23 |
0.39 |
0.51 |
|
Unexposed multipara |
0.04 |
0.06 |
0.13 |
0.25 |
0.43 |
0.51 |
|
Short multipara |
0.05 |
0.08 |
0.16 |
0.29 |
0.49 |
0.57 |
|
Smoking multipara |
0.04 |
0.06 |
0.13 |
0.24 |
0.42 |
0.50 |
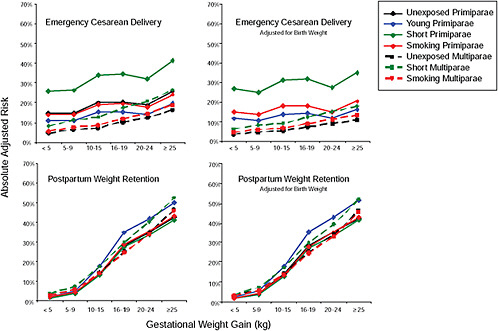
FIGURE G-38 Obese women, emergency cesarean delivery (CS) and postpartum weight retention (PPWR) with and without adjustment for birth weight.
NOTE: Absolute risks in different types of obese women. When adjusted for birth weight, the presented risk is that of a women giving birth to a 3500-3999 g infant.
TABLE G-33A Emergency Cesarean Delivery (CS) in Different Types of Obese Women by GWG
|
|
< 5 kg |
5-9 kg |
10-15 kg |
16-19 kg |
20-24 kg |
≥ 25 kg |
|
Unexposed primipara |
0.15 |
0.15 |
0.20 |
0.21 |
0.19 |
0.26 |
|
Young primipara |
0.11 |
0.11 |
0.15 |
0.15 |
0.14 |
0.20 |
|
Short primipara |
0.26 |
0.26 |
0.34 |
0.34 |
0.32 |
0.41 |
|
Smoking primipara |
0.14 |
0.14 |
0.19 |
0.19 |
0.18 |
0.24 |
|
Unexposed multipara |
0.05 |
0.06 |
0.07 |
0.10 |
0.12 |
0.16 |
|
Short multipara |
0.08 |
0.11 |
0.13 |
0.17 |
0.21 |
0.26 |
|
Smoking multipara |
0.05 |
0.07 |
0.08 |
0.12 |
0.14 |
0.19 |
TABLE G-33B Emergency Cesarean Delivery (CS) with Adjustment for Birth Weight in Different Types of Obese Women by GWG
|
|
< 5 kg |
5-9 kg |
10-15 kg |
16-19 kg |
20-24 kg |
≥ 25 kg |
|
Unexposed primipara |
0.15 |
0.14 |
0.018 |
0.18 |
0.15 |
0.20 |
|
Young primipara |
0.11 |
0.11 |
0.14 |
0.14 |
0.12 |
0.16 |
|
Short primipara |
0.27 |
0.25 |
0.31 |
0.32 |
0.27 |
0.35 |
|
Smoking primipara |
0.15 |
0.14 |
0.18 |
0.18 |
0.15 |
0.20 |
|
Unexposed multipara |
0.04 |
0.05 |
0.05 |
0.07 |
0.09 |
0.11 |
|
Short multipara |
0.06 |
0.08 |
0.09 |
0.12 |
0.15 |
0.18 |
|
Smoking multipara |
0.05 |
0.06 |
0.07 |
0.09 |
0.11 |
0.13 |
TABLE G-33C Postpartum Weight Retention (PPWR) in Different Types of Obese Women by GWG
|
|
< 5 kg |
5-9 kg |
10-15 kg |
16-19 kg |
20-24 kg |
≥ 25 kg |
|
Unexposed primipara |
0.02 |
0.04 |
0.14 |
0.28 |
0.35 |
0.43 |
|
Young primipara |
0.02 |
0.05 |
0.18 |
0.35 |
0.42 |
0.50 |
|
Short primipara |
0.02 |
0.04 |
0.13 |
0.27 |
0.34 |
0.41 |
|
Smoking primipara |
0.02 |
0.04 |
0.14 |
0.29 |
0.35 |
043 |
|
Unexposed multipara |
0.03 |
0.06 |
0.14 |
0.25 |
0.34 |
0.46 |
|
Short multipara |
0.04 |
0.07 |
0.17 |
0.30 |
0.40 |
0.52 |
|
Smoking multipara |
0.03 |
0.06 |
0.14 |
0.25 |
0.34 |
0.46 |
TABLE G-33D Postpartum Weight Retention (PPWR) with Adjustment for Birth Weight in Different Types of Obese Women by GWG
|
|
< 5 kg |
5-9 kg |
10-15 kg |
16-19 kg |
20-24 kg |
≥ 25 kg |
|
Unexposed primipara |
0.02 |
0.04 |
0.14 |
0.29 |
0.35 |
0.42 |
|
Young primipara |
0.02 |
0.05 |
0.18 |
0.35 |
0.43 |
0.51 |
|
Short primipara |
0.01 |
0.04 |
0.13 |
0.27 |
0.34 |
0.42 |
|
Smoking primipara |
0.02 |
0.04 |
0.13 |
0.28 |
0.35 |
0.43 |
|
Unexposed multipara |
0.03 |
0.06 |
0.14 |
0.25 |
0.34 |
0.46 |
|
Short multipara |
0.03 |
0.07 |
0.17 |
0.30 |
0.39 |
0.52 |
|
Smoking multipara |
0.03 |
0.06 |
0.14 |
0.25 |
0.33 |
0.45 |
-
end of the recommended range. Only risk of emergency cesarean deliveries was uniquely high in short primiparae, which was probably related to pelvic size and prepregnancy BMI and not to gain, since the risk did not vary with GWG.
Young Age
-
Young primiparae in these data had better outcomes than primiparae aged 25-29 years. It was suggested in the IOM (1990) guidelines that adolescents should gain more weight to avoid SGA, but these findings suggest that this is not necessary, at least not among those at ages (mean = 18.4 years) studied here. However, this may not be true among younger teens, which was poorly presented in the DNBC.
Smokers
-
Smokers had a substantial excess risk of SGA, which was only eliminated in multiparous women with high prepregnant BMI values and high gains. However, smokers retained weight just like non-smokers. Thus, smoking cessation still seems the best way to improve birth outcomes and reduce the risk of excessive postpartum weight retention among smokers.
PART II:
ANALYSES FROM DR. HERRING
ASSOCIATION BETWEEN GESTATIONAL WEIGHT CHANGES AND ADVERSE PREGNANCY OUTCOMES IN THE 1988 NATIONAL MATERNAL AND INFANT HEALTH SURVEY AND 1991 FOLLOW-UP SURVEY
Amy H. Herring, ScD
Associate Professor of Biostatistics
University of North Carolina at Chapel Hill
Improvement of maternal, fetal, and child health are key public health goals. In an effort to achieve these objectives, the Institute of Medicine (IOM) report Nutrition During Pregnancy offered recommendations in 1990 for weight gain during pregnancy based on pre-pregnancy maternal body mass index (BMI). Since publication of the IOM reports, the population of U.S. women of childbearing age has become more diverse. New
health concerns have arisen, including the greater prevalence of women who are overweight or obese entering pregnancy, which puts them at high risk for pregnancy complications. More women are becoming pregnant at an older age and enter pregnancy with chronic conditions such as type 2 diabetes, which also puts them at risk for pregnancy complications and may lead to increased morbidity during their post-pregnancy years. In addition to adverse outcomes for the mother, there are risks for the child associated with gestational weight gain outside recommended levels.
The Committee to Reexamine IOM Pregnancy Weight Guidelines requested an analysis based on the 1988 National Maternal and Infant Health Study and its 1991 longitudinal follow-up. Data from the 1988 National Maternal and Infant Health Survey (NMIHS) and its 1991 longitudinal follow-up study were used to generate:
-
Descriptions of gestational weight gain distributions in the general population as well as in specific subgroups of interest.
-
Descriptions of distributions of pregnancy, birth, and maternal and child health outcomes, including cesarean delivery, preterm birth, birth weight among term births, small for gestational age, large for gestational age, breastfeeding initiation, duration of breastfeeding, postpartum weight retention, and childhood weight status.
-
Results from statistical modeling of relationships between gestational weight gain, pregravid body mass index, and outcomes of interest.
-
Predictions from these outcomes based on weight gain scenarios, including current (observed in data) gain, gain according to the current IOM recommendations, and gain according to proposed recommendations.
-
Outcome risk estimates, averaged over other exposures, by pregravid BMI and adequacy of weight gain.
Women included in the analysis had singleton pregnancies ending in live births as defined by NMIHS (NMIHS distinguishes live births from fetal and infant deaths). Due to the presence of numerous extreme outliers, data were cleaned by excluding (1) subjects with birth weights further than three standard deviations from the mean birth weight for each gestational age at delivery, (2) subjects with gestational weight gain greater than 40 kg or with gestational weight loss greater than −10 kg, and (3) deliveries before 26 weeks gestation nor after 42 weeks gestation. Due to poor quality of data on gestational diabetes mellitus (GDM), pregnancy-induced hypertension (PIH), and preeclampsia, these outcomes were not analyzed in further detail.
Gestational Weight Gain
Gestational weight gain in NMIHS is available from either maternal self-report at the time of questionnaire (mean 17 months postpartum with range 6 to 31 months) or from medical care provider report (Figure G-39). For these analyses, medical care provider was used when available, and maternal self-report was used when provider report was unavailable. Pregravid weight, used to calculate gestational weight gain, was largely based on self-reported data unless the provider reported a measured pregravid weight (this is possible but not indicated in the data set). In addition, gestational age at delivery is based on vital records data and is not of uniform quality; there are numerous cases of extreme outliers in birth weight that may be due to incorrect pregnancy dating. Birth weight was thus cleaned by eliminating observations more than three standard deviations from the mean birth weight at each gestational age week.
The original gestational weight gain variable has mean 30.5 pounds and ranged from 217 pounds lost to 235 pounds gained. For purposes of this analysis, data were cleaned by excluding the top 1 percent and bottom 1 percent of this variable. The resulting variable had range limited to 22 pounds lost to 79 pounds gained. The (unweighted) empirical density of weight gain is presented in Figure G-39; 29 percent of women had inadequate gain; 26 percent of women had adequate gain, and 45 percent of women had excessive gain based on the current IOM recommendations for weight gain and World Health Organization (WHO) cutoffs for BMI.
Weight gain adequacy was related to pregravid BMI category, as described below in Table G-34. In particular, underweight women tended to have inadequate or adequate gain, while the majority of normal weight, overweight, and obese women had excessive gain. Interestingly, fewer overweight women had inadequate gain than women in any other group.
In all analysis models, predicted outcomes are obtained for the following three scenarios:
-
Observed weight gain.
-
Weight gain according to the IOM (1990) recommendations.
-
Weight gain as indicated by the Oken et al. (2008) analysis.
In order to determine whether weight gain was according to the current IOM recommendations, women were classified into one of four pregravid BMI groups. Within each BMI group, the current IOM recommended weight gain range at 40 weeks was linearly extrapolated (after accounting for recommended first trimester gain) to a range at each week of gestation, so that each woman could be classified as having adequate weight gain (within the IOM recommended range), inadequate gain, or excessive gain,
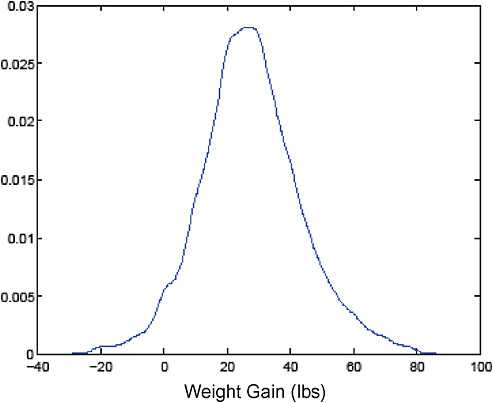
FIGURE G-39 Empirical distribution of weight gain in NMIHS. Weight Gain (lbs)
specific to her pregravid BMI and the gestational age of her child at delivery. Scenario 2 was created by first determining whether a woman’s weight gain was adequate or not. For women with adequate gain (that is, gain within the recommended range), weight gain values were unaltered. For women with inadequate or excessive gain, a new gestational weight gain was randomly sampled from a uniform distribution on the IOM recommended weight gain range specific to her pregravid BMI and gestational week at delivery. Scenario 3 was created by taking the Oken et al. (2008) values
TABLE G-34 Adequacy of Weight Gain (Current IOM Guidelines) by Pregravid BMI (WHO Cutoffs)
|
Pregravid BMI |
Weight Gain Adequacy (%) |
||
|
Inadequate |
Adequate |
Excessive |
|
|
Underweight |
33.7 |
41.2 |
25.1 |
|
Normal |
29.8 |
28.7 |
41.5 |
|
Overweight |
19.4 |
18.8 |
61.8 |
|
Obese |
32.9 |
7.7 |
59.5 |
based on the IOM (1990) recommended first trimester gain, extrapolating them to gestational ages other than 40 weeks. Then all women were assigned to the exact weight gain recommended specific to that gestational week and pregravid BMI.
Overall risk estimates of outcomes of interest are presented in Figure G-40.
Cesarean Delivery
Analysis was limited to women who had not had a prior cesarean delivery. Predictors were selected in the logistic regression model based on backward selection, with the following predictors retained in the final model: maternal pregravid BMI (WHO categories), maternal weight gain, maternal race (black versus non-black), maternal height (< 63 in, 63-66 in, ≥ 67 in), maternal age (< 20 years, 20-24 years, 25-29 years, 30-34 years, ≥ 35 years), maternal smoking during 12 months prior to delivery (none, 1-10 cigarettes per day, > 10 cigarettes per day), maternal employment dur-
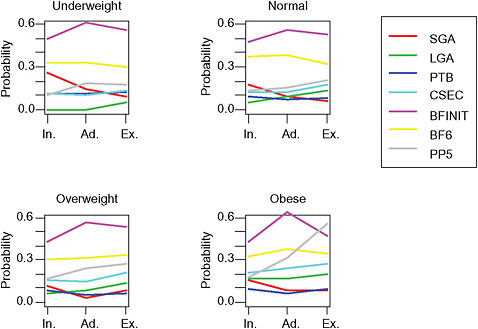
FIGURE G-40 Risks, by NHLBI BMI and IOM weight gain (inadequate, adequate, excessive) categories, of SGA, LGA, PTB, cesarean delivery, breastfeeding initiation (BFI), breastfeeding 6 months among initiators (BF6), and postpartum weight retention > 5kg (PP5).
ing pregnancy, parity (multiparous versus nulliparous), gestational age at delivery (linear) and birth weight.
While weight gain was significantly related to cesarean delivery probability, this relationship was not very precise, as illustrated in Figure G-41.
The probability of cesarean delivery did vary across recommendations, with a probability of 0.23 (0.22, 0.24) in the observed data, of 0.25 (0.21, 0.30) under the IOM recommendations, and 0.25 (0.21, 0.29) under the alternate recommendations. Predicted probabilities by pregravid BMI are presented in Table G-35.
Preterm Birth
Preterm birth was defined as birth before 37 completed weeks of gestation, with duration of gestation obtained from the vital record. Predictors were selected in a logistic regression model based on backward selection, and the following were included in the final model: maternal pregravid BMI (WHO categories), maternal weight gain rate, maternal race (black versus non-black), education (< 12 years, 12 years, 13-15 years, 16 or more years),
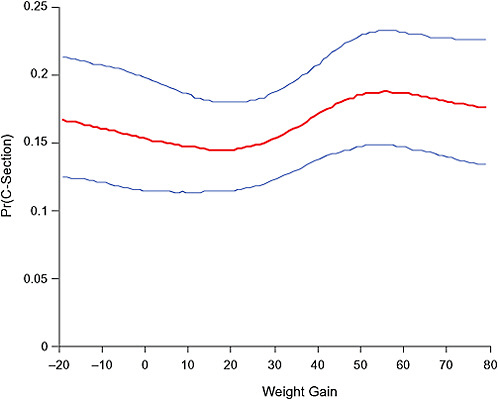
FIGURE G-41 Weight gain (lbs) and probability of cesarean delivery.
TABLE G-35 Predicted Cesarean Delivery Probabilities by Pregravid BMI Pregravid BMI
|
Pregravid BMI |
Cesarean Delivery Probabilities (95% CI) |
||
|
Observed Data |
IOM Gain |
Oken Gain |
|
|
Underweight |
0.17 (0.14, 0.21) |
0.19 (0.14, 0.25) |
0.19 (0.14, 0.25) |
|
Normal weight |
0.21 (0.19, 0.22) |
0.22 (0.19, 0.28) |
0.22 (0.19, 0.28) |
|
Overweight |
0.30 (0.27, 0.33) |
0.32 (0.26, 0.38) |
0.29 (0.25, 0.34) |
|
Obese |
0.35 (0.30, 0.40) |
0.38 (0.32, 0.46) |
0.38 (0.32, 0.46) |
maternal height (< 63 in, 63-66 in, ≥ 67 in), maternal age (< 20 years, 20-24 years, 25-29 years, 30-34 years, ≥ 35 years), and maternal smoking during 12 months prior to delivery (none, 1-10 cigarettes per day, > 10 cigarettes per day).
Clearly, weight gain will be greater for longer pregnancies, so a relationship between lower gains and higher preterm birth probability should be apparent. In this model, the rate of weight gain per week was used as the predictor of interest in an attempt to control for the known relationship between weight gain and duration of gestation. This relationship is depicted in Figure G-42, which shows the preterm birth probability as a function of gestational weight gain for women of normal pregravid BMI who were non-black, college educated, 5′3″-5′6″, 20-24 years old, and nonsmokers. The relationship between rate of weight gain and preterm birth was not statistically significant.
Preterm birth was not strongly associated with suggested changes in weight gain. In the observed data, the predicted probability of preterm birth is 0.08 (0.08, 0.10), while under the current IOM recommendations and Oken recommendations, the predicted probability is 0.08 (0.08, 0.99). Preterm birth probabilities by pregravid BMI are below (see Table G-36).
Birth Weight Among Term Births
Birth weight was analyzed among births ranging from 37 to 42 weeks gestation. Due to numerous outliers even after cleaning, the regression model used was not the traditional normal (Gaussian) regression model but a regression based on t distributed outcomes with degrees of freedom estimated in the modeling procedure. T-regression is much less sensitive to outliers and was used to avoid trimming the outcome data based eliminating observations in the tails of the birth weight distribution. Predictors were selected in the birth weight regression model based on backward selection; predictors retained in the final model include gestational age at delivery, maternal pregravid BMI (WHO categories), maternal weight gain, maternal race (black versus white), education (< 12 years, 12 years, 13-15 years, 16
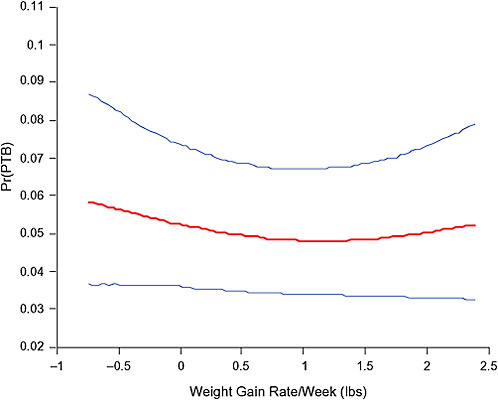
FIGURE G-42 Relationship of weight gain to preterm birth probability.
or more years), maternal height (< 63 in, 63-66 in, ≥ 67 in), maternal smoking during 12 months prior to delivery (none, 1-10 cigarettes per day, > 10 cigarettes per day), parity (multiparous versus nulliparous), infant gender, and the interaction between pregravid BMI and weight gain.
The association between weight gain and birth weight among terms is illustrated in Figure G-43. Among underweight and normal weight women, in the range of (5, 55) pounds gained among normal weight women, birth weight steadily increases, and then birth weight declines slightly after
TABLE G-36 Predicted Probabilities of Preterm Birth by Pregravid BMI
|
Pregravid BMI |
Preterm Probabilities (95% CI) |
||
|
Observed Data |
IOM Gain |
Oken Gain |
|
|
Underweight |
0.11 (0.09, 0.14) |
0.11 (0.09, 0.14) |
0.11 (0.09, 0.14) |
|
Normal weight |
0.08 (0.07, 0.09) |
0.08 (0.07, 0.09) |
0.08 (0.07, 0.09) |
|
Overweight |
0.07 (0.05, 0.08) |
0.07 (0.05, 0.08) |
0.07 (0.05, 0.09) |
|
Obese |
0.08 (0.06, 0.11) |
0.08 (0.06, 0.11) |
0.09 (0.06, 0.13) |
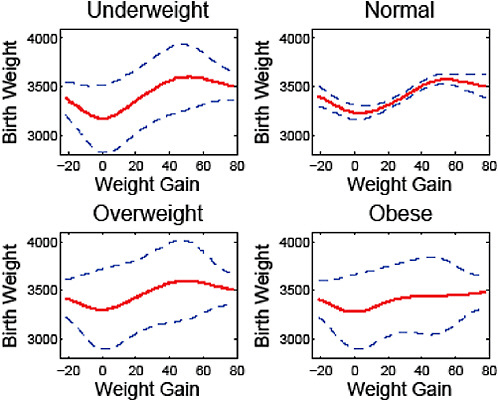
FIGURE G-43 Birth weight by weight gain (lbs).
around 55 pounds gained. This trend flattens among overweight and obese women so that there is less association between gestational weight gain and birth weight.
Figure G-44 presents the estimated birth weight density among term births observed in the NMIHS data (blue curve and confidence bands); among term births assuming compliance to current IOM recommendations (red); and among term births assuming compliance to the Oken et al. (2008) values. When analysis was restricted to smokers, we saw the same general trends with respect to weight gain, though mean birth weights were lower in this group, as expected.
Small-for-Gestational Age
Analysis of small-for-gestational age births involved white and black infants born in the range of 24-42 completed weeks of gestation. The exclusion of other infants is due to the lack of known standards for determining SGA status. The Zhang and Bowes (1995) criteria were used for determining SGA status. Predictors were selected in the SGA logistic regression
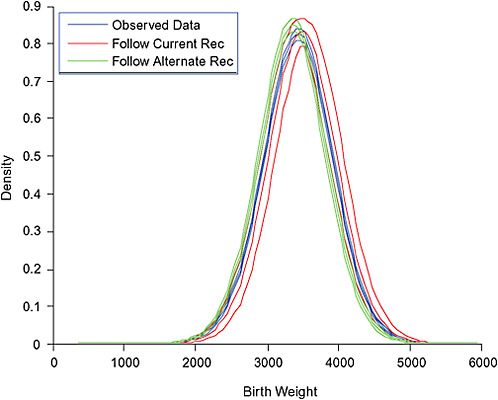
FIGURE G-44 Birth weight density, predicted birth weight distribution by hypothetical weight gain.
model based on backward selection; predictors retained in the final model include maternal pregravid BMI (WHO categories), maternal weight gain, maternal race (black versus non-black), maternal education (< 12 years, 12 years, 13-15 years, 16+ years) maternal height (< 63 in, 63-66 in, ≥ 67 in), maternal age (< 20 years, 20-24 years, 25-29 years, 30-34 years, ≥ 35 years), maternal smoking in 12 months prior to delivery (none, 1-10 cigarettes per day, > 10 cigarettes per day), maternal exercise during pregnancy, gestational age, maternal employment during pregnancy, and the following interactions: pregravid BMI by weight gain, race by weight gain, race by maternal height, race by maternal age, and race by exercise. As illustrated in Figures G-45 and G-46, weight gain was significantly associated with SGA risk. Non-black women who were underweight, normal weight, or overweight were somewhat more likely to have a SGA birth if their weight gain was inadequate. The association between weight gain and SGA risk was considerably muted as pregravid BMI increased.
The SGA density does vary slightly across weight gain recommendations. Using the observed data, 11 percent (10 percent, 12 percent) of births
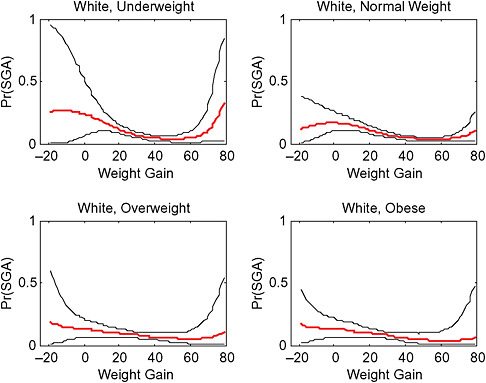
FIGURE G-45 SGA risk among white women by weight gain (lbs) and pregravid BMI
are SGA. Under the IOM recommendations, 11 percent (10 percent, 12 percent) of births are SGA. Under the alternate values, 13 percent (12 percent, 16 percent) of births are SGA. Probabilities of SGA birth by pregravid BMI categories are below in Table G-37.
Large-for-Gestational Age
Zhang and Bowes (1995) cutoff points were used to determine LGA status. Predictors were selected in the LGA logistic regression model based on backward selection. Predictors retained in the final model include maternal pregravid BMI (WHO categories), maternal weight gain, maternal race (black versus non-black), maternal height (< 63 in, 63-66 in, ≥ 67 in), maternal age (< 20 years, 20-24 years, 25-29 years, 30-34 years, ≥ 35 years), maternal smoking during 12 months prior to delivery (none, 1-10 cigarettes per day, > 10 cigarettes per day), gestational age at delivery, and the following two-way interactions: pregravid BMI by weight gain, race by pregravid BMI, race by weight gain, race by height, and race by smoking.
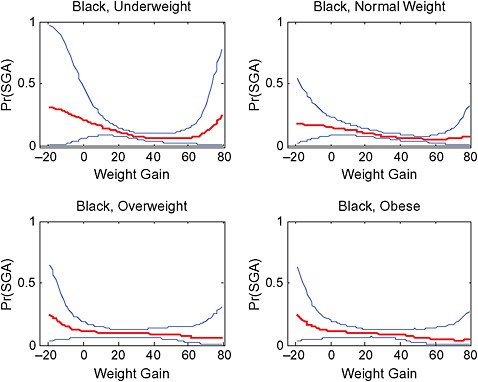
FIGURE G-46 Risk of SGA birth in black women by weight gain (lbs) and pregravid BMI.
The probability of LGA birth is associated with weight gain, though interval estimates are wide. Figures G-47 and G-48 show this probability as a function of race and pregravid BMI.
The LGA density does vary slightly across weight gain recommendations. Using the observed data, 11 percent (10 percent, 11 percent) of births are LGA. Under the IOM (1990) recommendations, 8 percent (8 percent, 9 percent) of births are LGA. Under the alternate recommendations,
TABLE G-37 Predicted Probabilities of SGA Birth by Pregravid BMI
|
Pregravid BMI |
SGA Probabilities (95% CI) |
||
|
Observed Data |
IOM Gain |
Oken Gain |
|
|
Underweight |
0.17 (0.14, 0.19) |
0.14 (0.11, 0.18) |
0.19 (0.15, 0.21) |
|
Normal weight |
0.11 (0.10, 0.12) |
0.11 (0.10, 0.12) |
0.12 (0.11, 0.13) |
|
Overweight |
0.09 (0.07, 0.11) |
0.10 (0.08, 0.12) |
0.12 (0.07, 0.20) |
|
Obese |
0.10 (0.08, 0.13) |
0.11 (0.08, 0.15) |
0.17 (0.04, 0.35) |
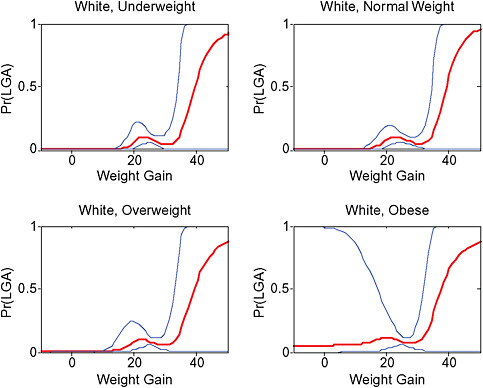
FIGURE G-47 Probability of LGA birth by pregravid BMI and weight gain (lbs) in whites.
8 percent (7 percent, 9 percent) of births are LGA. Predicted probabilities of LGA by pregravid BMI category are in Table G-38.
Breastfeeding
Breastfeeding initiation and duration were not associated with pregnancy weight gain after confounder adjustment. While point estimates of the probabilities of initiation and of breastfeeding 6 months among initiators are provided in Figure G-40, the interval estimates about these probabilities are quite wide. Analysis of these outcomes is not included due to space consideration (available upon request).
Postpartum Weight Retention
The quality of postpartum weight retention depends on the quality of the pregravid weight. Women self-reported postpartum weight on the questionnaire, which was administered at 6-31 months postpartum. The first analysis was of postpartum weight retention among only those sub-
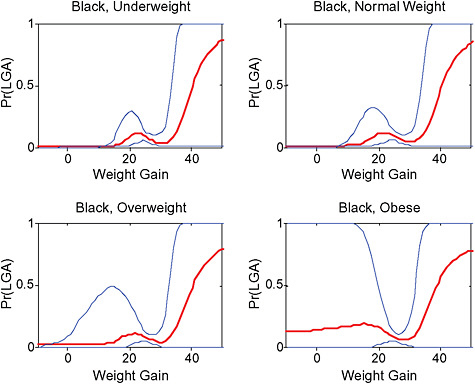
FIGURE G-48 Probability of LGA birth by BMI and weight gain (lbs) in blacks.
jects queried at 6-12 months postpartum (Figure G-49). Among this subset, mean retention was 6.7 pounds.
Due to numerous outliers, a regression based on t-distributed outcomes with degrees of freedom estimated in the modeling procedure was used. Predictors were selected in the postpartum weight retention regression model based on backward selection, with the following predictors in the final model: postpartum month of survey, maternal pregravid BMI (WHO categories), maternal weight gain, maternal race (black versus white), education (< 12 years, 12 years, 13-15 years, 16 or more years), maternal age (< 20 years, 20-24 years, 25-29 years, 30-34 years, ≥ 35 years), maternal
TABLE G-38 Predicted Probabilities of LGA Birth by Pregravid BMI
|
Pregravid BMI |
LGA Probabilities (95% CI) |
||
|
Observed Data |
IOM Gain |
Oken Gain |
|
|
Underweight |
0.05 (0.03, 0.07) |
0.04 (0.02, 0.06) |
0.03 (0.01, 0.04) |
|
Normal weight |
0.10 (0.09, 0.12) |
0.08 (0.07, 0.09) |
0.07 (0.06, 0.08) |
|
Overweight |
0.12 (0.10, 0.14) |
0.08 (0.06, 0.10) |
0.10 (0.06, 0.14) |
|
Obese |
0.19 (0.15, 0.22) |
0.16 (0.12, 0.19) |
0.17 (0.12, 0.23) |
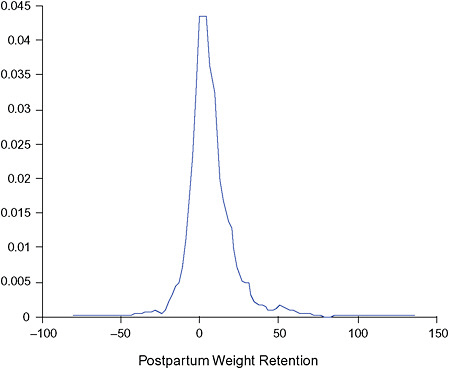
FIGURE G-49 Postpartum weight retention, 6-12 months.
smoking during postpartum (none, 1-10 cigarettes per day, > 10 cigarettes per day), parity (multiparous versus nulliparous), duration of gestation, breastfeeding duration, and interactions between pregravid BMI and weight gain, pregravid BMI and race, pregravid BMI and parity, and pregravid BMI and month postpartum of survey. As illustrated in Figure G-50, obese women tended to report more postpartum weight retention. Across all pregravid BMI groups, weight retention only seemed to increase substantially with weight gains greater than 20 pounds.
Predicted weight retention is subject to considerable uncertainty due to the relatively small sample size (n = 1,157) with reported postpartum weight in the 6-12 month interval (Figure G-51).
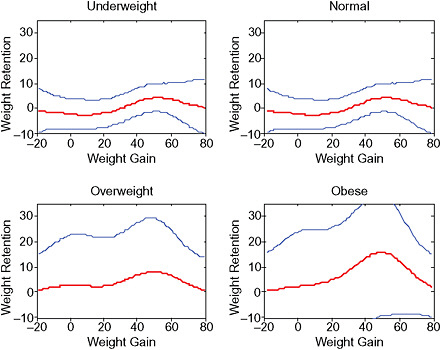
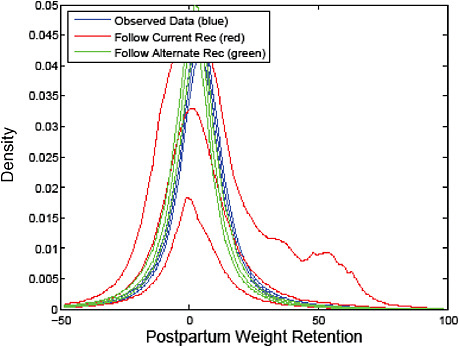
PART III:
ANALYSES FROM DR. STEIN AND DR. SAVITZ
THE EFFECT OF MATERNAL RACE/ETHNICITY AND BMI ON THE ASSOCIATION BETWEEN GESTATIONAL WEIGHT GAIN AND BIRTH OUTCOME
Cheryl R. Stein, PhD, and David A. Savitz, PhD
Mount Sinai School of Medicine
To examine the independent and joint effects of maternal race/ethnicity and body mass index (BMI) on the association between gestational weight gain (GWG) and birth outcome, New York City vital statistics birth data for 1995 to 2003 was linked to hospital discharge data from the Statewide Planning and Research Cooperative System (SPARCS). Of 1,173,053 birth records, 1,084,882 (92.5 percent) were successfully matched to a hospital discharge record. Unmatched records resulted from missing personal information needed for the matching algorithm. Singleton births were more likely to be matched to a hospital discharge record than infants from a multiple gestation. Of 1,133,020 vital records for singleton births, 1,067,356 (94.2 percent) were successfully linked to a hospital discharge record (see Tables G-39 and G-40).
Inclusion Criteria
Of the 1,067,356 singleton births with matched vital records and hospital discharge data, 913,461 (85.6 percent) were potentially eligible for analysis. Inclusion criteria, and the corresponding percent lost, are GWG between −10 to 40 kg (10.7 percent), no birth defects (2.2 percent), non-missing outcome and covariate (maternal age, race/ethnicity, parity, education, smoking) data (1.2 percent), gestational age between 26 and 42 completed weeks (1.0 percent), and plausible combination of birth weight and gestational age (0.7 percent) (Alexander et al., 1996). Maternal height, needed to calculate BMI, was reported for births to New York City residents in hospitals located elsewhere in New York State, which were only 34,307 (3.8 percent) of these 913,461 potentially eligible births. As indicated in Table G-41, women with height reported had higher pre-pregnancy and delivery weights, more frequent primary cesarean sections, fewer term small-for-gestational age (SGA) and more term large-for-gestational age (LGA) births. Additionally, these women were more often from Queens and the Bronx, which likely accounts for the increased proportion of white non-Hispanic women.
TABLE G-39 Characteristics of Singleton Births, New York City, 1995-2003, n = 34,307
|
Characteristic |
N (percent) |
|
Gestational weight gain, kg |
|
|
Mean (standard deviation) |
14.4 (5.8) |
|
Gestational weight gain, kg |
|
|
< 0 |
140 (0.4) |
|
0-4 |
1,408 (4.1) |
|
5-9 |
5,861 (17.1) |
|
10-14 |
12,950 (37.7) |
|
15-19 |
8,953 (26.1) |
|
20-24 |
3,590 (10.5) |
|
> 25 |
1,405 (4.1) |
|
Gestational weight gain, kg |
|
|
0-9 |
7,269 (21.3) |
|
10-14 |
12,950 (37.9) |
|
15-19 |
8,953 (26.2) |
|
> 20 |
4,995 (14.6) |
|
Gestational weight gain ratea |
|
|
Lower tertile (−0.35-0.30 kg/week) |
11,250 (32.3) |
|
Middle tertile (0.31-0.41 kg/week) |
11,416 (33.3) |
|
Upper tertile (0.42-1.19 kg/week) |
11,641 (33.9) |
|
Body mass index, pre-pregnancy |
|
|
Mean (standard deviation) |
24.8 (5.3) |
|
Body mass index, pre-pregnancy |
|
|
< 18.5 (underweight) |
1,632 (4.8) |
|
18.5-25 (normal weight) |
19,892 (58.0) |
|
25-30 (overweight) |
7,893 (23.0) |
|
30-35 (obese I) |
3,077 (9.0) |
|
35-40 (obese II) |
1,166 (3.4) |
|
40+ (obese III) |
647 (1.9) |
|
Body mass index, pre-pregnancy |
|
|
< 18.5 (underweight) |
1,632 (4.8) |
|
18.5-25 (normal weight) |
19,892 (58.0) |
|
25-30 (overweight) |
7,893 (23.0) |
|
30+ (obese) |
4,890 (14.3) |
|
Preterm < 37 weeks |
|
|
Yes |
2,430 (7.1) |
|
No |
31,877 (92.9) |
|
Preterm < 37 weeks, delivery indication |
|
|
PROM or spontaneous |
1,738 (71.5) |
|
Medically indicated |
692 (28.5) |
|
Primary cesarean deliveryb |
|
|
Primary cesarean |
6,279 (21.1) |
|
Vaginal delivery |
23,518 (78.9) |
|
Term SGA < 10 percentile |
|
|
Yes |
2,749 (8.6) |
|
No |
29,128 (91.4) |
Dependent Variables
Five birth outcomes were studied: preterm birth < 37 completed weeks gestation, spontaneous preterm birth < 37 completed weeks gestation, primary cesarean delivery, term SGA, and term LGA. Preterm birth < 37 weeks was examined as a dichotomous variable. Spontaneous preterm births were differentiated from medically indicated preterm births using International Classification of Diseases, Ninth Revision (ICD-9) hospital discharge diagnosis and procedure codes. Women with artificial rupture of membranes, induction of labor by artificial rupture of membranes, or other surgical or medical induction of labor (ICD-9 codes 73.0, 73.01, 73.09, 73.1, 73.4) were categorized as medically indicated preterm births. From the remaining women, those with premature rupture of membranes (PROM) (658.1x; 658.2x) were categorized as spontaneous. We then added pre-labor cesarean deliveries to medically indicated births. To identify pre-labor cesareans, we looked for women with delivery by cesarean section (74.x), but without codes indicating labor or spontaneous delivery (644.0x; 644.1x; 644.2x). The remaining preterm births were classified as spontane-
TABLE G-40A Bivariate Association between BMI and Characteristics of Singleton Births, New York City, 1995-2003, n = 34,307
|
|
Body Mass Index |
|||
|
Underweight N = 1,632 N (percent) |
Normal Weight N = 19,892 N (percent) |
Overweight N = 7,893 N (percent) |
Obese N = 4,890 N (percent) |
|
|
Gestational weight gain, kg |
|
|
|
|
|
< 0 |
0 |
11 (0.1) |
26 (0.3) |
103 (2.1) |
|
0-9 |
217 (13.3) |
3,063 (15.4) |
2,030 (25.8) |
1,959 (40.9) |
|
10-14 |
716 (43.9) |
7,973 (40.1) |
2,779 (35.3) |
1,482 (31.0) |
|
15-19 |
466 (28.5) |
5,804 (29.2) |
1,876 (23.9) |
807 (16.9) |
|
> 20 |
233 (14.3) |
3,041 (15.3) |
1,182 (15.0) |
539 (11.3) |
|
Gestational weight gain, kg |
|
|
|
|
|
< 0 |
0 |
11 (0.1) |
26 (0.3) |
103 (2.1) |
|
0-4 |
15 (0.9) |
331 (1.7) |
402 (5.1) |
660 (13.5) |
|
5-9 |
202 (12.4) |
2,732 (13.7) |
1,628 (20.6) |
1,299 (26.6) |
|
10-14 |
716 (43.9) |
7,973 (40.1) |
2,779 (35.2) |
1,482 (30.3) |
|
15-19 |
466 (28.5) |
5,804 (29.2) |
1,876 (23.8) |
807 (16.5) |
|
20-24 |
177 (10.9) |
2,265 (11.4) |
805 (10.2) |
343 (7.0) |
|
> 25 |
56 (3.4) |
776 (3.9) |
377 (4.8) |
196 (4.0) |
|
Gestational weight gain ratea |
|
|
|
|
|
Lower tertile |
414 (25.4) |
5,300 (26.6) |
2,909 (36.9) |
2,627 (53.7) |
|
Middle tertile |
628 (38.5) |
7,268 (36.5) |
2,397 (30.4) |
1,123 (23.0) |
|
Upper tertile |
590 (36.1) |
7,324 (36.8) |
2,587 (32.8) |
1,140 (23.3) |
|
Maternal race/ethnicity |
|
|
|
|
|
Non-Hispanic white |
679 (41.6) |
10,157 (51.1) |
3,399 (43.1) |
2,056 (42.0) |
|
Non-Hispanic black |
313 (19.2) |
4,251 (21.4) |
2,695 (34.1) |
1,950 (40.0) |
|
Hispanic |
169 (10.4) |
2,801 (14.1) |
1,251 (15.9) |
732 (15.0) |
|
Asian |
445 (27.3) |
2,493 (12.5) |
487 (6.2) |
133 (2.7) |
|
Other |
26 (1.6) |
190 (1.0) |
61 (0.8) |
19 (0.4) |
|
Preterm < 37 weeks |
150 (9.2) |
1,232 (6.2) |
595 (7.5) |
453 (9.3) |
|
Preterm, spontaneousb |
114 (7.1) |
874 (4.5) |
433 (5.6) |
317 (6.7) |
|
Primary cesarean deliveryc |
234 (15.5) |
3,350 (18.8) |
1,519 (22.9) |
1,176 (30.7) |
|
Term SGA < 10 percentiled |
233 (15.7) |
1,737 (9.3) |
499 (6.9) |
262 (6.0) |
|
Term LGA > 90 percentiled |
60 (4.1) |
1,518 (8.1) |
916 (12.6) |
740 (17.0) |
|
aRate of gestational weight gain equivalent for 40 weeks gestation: lower tertile = −13.6-12 kg gain; middle tertile = 12.1-16.4 kg gain; upper tertile = 16.5-47.6 kg gain. bExcludes 692 medically indicated preterm births. cExcludes 3,502 repeat cesarean and 1,008 vaginal birth after cesarean deliveries. dExcludes 2,430 preterm births. |
||||
TABLE G-40B Bivariate Association between Rate of Gestational Weight Gain and Race/Ethnicity Among Singleton Births, New York City, 1995-2003, n = 34,307
|
Maternal race/ethnicity |
Rate of Gestational Weight Gaina |
||
|
Lower Tertile N = 11,250 N (percent) |
Middle Tertile N = 11,416 N (percent) |
Upper Tertile N = 11,641 N (percent) |
|
|
Non-Hispanic white |
4,922 (30.2) |
5,560 (34.1) |
5,809 (35.7) |
|
Non-Hispanic black |
3,451 (37.5) |
2,807 (30.5) |
2,951 (32.0) |
|
Hispanic |
1,597 (32.2) |
1,540 (31.1) |
1,816 (36.7) |
|
Asian |
1,157 (32.5) |
1,412 (39.7) |
989 (27.8) |
|
Other |
123 (41.5) |
97 (32.8) |
76 (25.7) |
|
aRate of gestational weight gain equivalent for 40 weeks gestation: lower tertile = −13.6-12 kg gain; middle tertile = 12.1-16.4 kg gain; upper tertile = 16.5-47.6 kg gain. |
|||
TABLE G-40C Bivariate Association between Gestational Weight Gain and Race/Ethnicity Among Singleton Births, New York City, 1995-2003, n = 34,167
|
Maternal race/ethnicity |
Gestational Weight Gain |
|||
|
0-9 kg N = 7,269 N (percent) |
10-14 kg N = 12,950 N (percent) |
15-19 kg N = 8,953 N (percent) |
20+ kg N = 4,995 N (percent) |
|
|
Non-Hispanic white |
3,043 (18.7) |
6,178 (38.1) |
4,487 (27.6) |
2,527 (15.6) |
|
Non-Hispanic black |
2,356 (25.7) |
3,318 (36.3) |
2,158 (23.6) |
1,316 (14.4) |
|
Hispanic |
1,083 (21.9) |
1,769 (35.9) |
1,259 (25.5) |
824 (16.7) |
|
Asian |
706 (19.9) |
1,571 (44.2) |
976 (27.5) |
301 (8.5) |
|
Other |
81 (27.5) |
114 (38.6) |
73 (24.7) |
27 (9.1) |
TABLE G-40D Bivariate Association between Rate of Gestational Weight Gain and Race/Ethnicity Among Singleton Births, New York City, 1995-2003, n = 913,461
|
Maternal race/ethnicity |
Rate of Gestational Weight Gaina |
||
|
Lower Tertile N = 339,592 N (percent) |
Middle Tertile N = 291,098 N (percent) |
Upper Tertile N = 282,771 N (percent) |
|
|
Non-Hispanic white |
91,741 (32.8) |
101,031 (36.1) |
86,706 (31.0) |
|
Non-Hispanic black |
93,127 (39.2) |
67,288 (28.3) |
77,119 (32.5) |
|
Hispanic |
110,550 (37.8) |
86,361 (29.5) |
95,548 (32.7) |
|
Asian |
42,713 (42.5) |
35,156 (35.0) |
22,573 (22.5) |
|
Other |
1,461 (41.2) |
1,262 (35.6) |
825 (23.3) |
|
aRate of gestational weight gain equivalent for 40 weeks gestation: lower tertile = −13.6-12 kg gain; middle tertile = 12.1-16.4 kg gain; upper tertile = 16.5-47.6 kg gain. |
|||
TABLE G-40E Bivariate Association between Gestational Weight Gain and Race/Ethnicity Among Singleton Births, New York City, 1995-2003, n = 913,290
|
Maternal race/ethnicity |
Gestational Weight Gain |
|||
|
0-9 kg N = 234,764 N (percent) |
10-14 kg N = 333,968 N (percent) |
15-19 kg N = 223,366 N (percent) |
20+ kg N = 121,192 N (percent) |
|
|
Non-Hispanic white |
56,817 (20.3) |
112,814 (40.4) |
75,274 (26.9) |
34,517 (12.3) |
|
Non-Hispanic black |
69,294 (29.2) |
77,868 (32.8) |
54,412 (22.9) |
35,899 (15.1) |
|
Hispanic |
78,528 (26.9) |
99,705 (34.1) |
70,694 (24.2) |
43,513 (14.9) |
|
Asian |
29,086 (29.0) |
42,137 (41.9) |
22,251 (22.1) |
6,964 (6.9) |
|
Other |
1069 (30.1) |
1,444 (40.7) |
735 (20.7) |
299 (8.4) |
ous. Medically indicated preterm births (692) were excluded from analyses comparing spontaneous preterm births < 37 weeks to term births. Vaginal births after cesarean (1,008) and repeat cesareans (3,502) were excluded from analyses comparing primary cesarean delivery to vaginal delivery as noted on the birth certificate. Term SGA was used to indicate term infants below the 10th percentile of birth weight for week of gestation; by the combination of infant gender, maternal race (black/non-black), and parity (nulliparous/multiparous) (Gregory et al., 2008). Term LGA corresponded to term infants above the 90th percentile of birth weight for week of gestation by the combination of infant gender, maternal race, and parity (Gregory et al., 2008).
Independent Variables
GWG was calculated as delivery weight minus pre-pregnancy weight as reported on the birth certificate, and then converted from pounds to kilograms. For analyses restricted to term births only (SGA and LGA), GWG was used as a categorical measure (0-9 kg, 10-14 kg, 15-19 kg, 20-40 kg) with 10-14 kg as the referent. Women who lost weight during pregnancy were excluded from these analyses because of small numbers (140). For the analyses not restricted to term births (preterm birth, spontaneous preterm birth, cesarean delivery), the rate of GWG was calculated as GWG divided by completed weeks gestation. Rate of GWG was categorized into tertiles, with the middle tertile as the referent. The equivalent weight gain at 40 completed weeks for the middle tertile was 12.1-16.4 kg.
BMI was computed as prepregnancy weight divided by height squared. The World Health Organization (WHO) cutoff points were used to categorize BMI as underweight (< 18.5), normal weight (18.5 -< 25), overweight (25 -< 30), and obese (≥ 30).
TABLE G-41 Percent of Singleton Births with and Without Maternal Height, New York City, 1995-2003
|
Characteristic |
Height Recorded (N = 34,307) |
Height Missing (N = 879,154) |
|
Prepregnancy weight, kg (mean) |
66.1 |
64.5 |
|
Delivery weight, kg (mean) |
80.5 |
78.5 |
|
Gestational weight gain (mean) |
14.4 |
14.0 |
|
Rate of gestational weight gain (kg/week) |
0.37 |
0.36 |
|
Preterm < 37 weeks |
7.1 |
7.1 |
|
Preterm PROM or spontaneous |
5.2 |
5.6 |
|
Primary cesarean delivery |
21.1 |
16.5 |
|
Term SGA < 10 percentile |
8.6 |
10.4 |
|
Term LGA > 90 percentile |
10.2 |
8.5 |
|
Maternal race/ethnicity |
|
|
|
Non-Hispanic white |
47.5 |
29.9 |
|
Non-Hispanic black |
26.8 |
26.0 |
|
Hispanic |
14.4 |
32.7 |
|
Asian |
10.4 |
11.0 |
|
Other |
0.9 |
0.4 |
|
Tobacco use |
2.6 |
3.4 |
|
Maternal age, years (mean) |
30.7 |
28.8 |
|
Parity (mean) |
0.9 |
1.0 |
|
Education, years (mean) |
14.2 |
12.8 |
|
County of residence |
|
|
|
Manhattan |
2.4 |
16.5 |
|
Brooklyn |
5.1 |
31.4 |
|
Bronx |
24.3 |
17.9 |
|
Queens |
62.5 |
21.2 |
|
Staten Island |
0.2 |
4.7 |
|
Outside NYC |
4.4 |
5.0 |
|
Outside NYC |
0.1 |
1.5 |
|
Unknown |
1.1 |
1.9 |
Maternal race/ethnicity (non-Hispanic white, non-Hispanic black, Hispanic, Asian, Other) was self-reported on the birth certificate. Additional maternal demographic characteristics examined as covariates include maternal age (continuous and squared terms), number of previous pregnancies (0, ≥ 1), education (< 12 years, 12 years, > 12 years), and tobacco use during pregnancy (smoker, non-smoker).
Statistical Analysis
Analyses were restricted to singleton births with complete information on all measures and were performed using SAS Version 9.1 (SAS Institute, Cary, North Carolina) and Stata Version 10 (Stata Corp, College Station, Texas). Unconditional logistic regression was used to estimate odds ratios (OR) and 95 percent confidence intervals (CI) for the relation between GWG and birth outcome. For each birth outcome, the unadjusted association was calculated. To assess whether the effect of GWG on birth outcome varied by prepregnancy BMI, was included as a product interaction term between GWG and BMI and adjusted for race/ethnicity. To assess whether the effect of GWG on birth outcome varied by race/ethnicity, a product interaction term was included between GWG and race/ethnicity and adjusted for BMI. Finally, to look at the potential for joint effects between BMI and race/ethnicity, a three-level product interaction term was included containing GWG, BMI, and race/ethnicity. Regardless of the p-value for the product terms, results were tabulated stratified by BMI, adjusted for ethnicity, for ethnicity adjusted for BMI, and jointly stratified by BMI and ethnicity.
In additional analyses, maternal age, parity, education and smoking were adjusted for and no substantive confounding was found. Spline regression (Zhang and Bowes, 1995) did not alter decisions about category cutoff points for GWG. Analyses that included the 879,154 births without height information were also performed. For these analyses, stratification by race/ethnicity was used and adjusted for prepregnancy weight (continuous and square terms).
PART IV:
ANALYSES FROM DR. HAMMITT
OPTIMAL GESTATIONAL WEIGHT GAIN: RISK TRADEOFF CALCULATIONS
James K. Hammitt, PhD
Harvard Center for Risk Analysis
The risks of multiple adverse pregnancy outcomes to mother and child are associated with the mother’s gestational weight gain (GWG) and pregravid body mass index (BMI). The prevalence of some outcomes (e.g., prematurity, small-for-gestational age [SGA]) are more strongly associated with small GWG while others (e.g., large-for-gestational age [LGA]), childhood obesity, postpartum weight retention) are more strongly associated with large GWG. In formulating guidance about appropriate GWG, it is
TABLE G-42 Odds Ratios and 95% Confidence Intervals for the Association of Rate of Gestational Weight Gain with Preterm Birth < 37 Weeks vs Term Birth ≥ 37 Weeks among Singleton Births, New York City, 1995-2003, n = 34,307
|
|
Rate of Gestational Weight Gaina |
||
|
Lower Tertile |
Middle Tertile |
Upper Tertile |
|
|
Overall, unadjusted |
1.3 (1.2, 1.5) |
1.0 |
1.1 (1.0, 1.3) |
|
By BMI, adjusted for race/ethnicity (GWG*BMI p = 0.14) |
|
|
|
|
< 18.5 (underweight) |
1.1 (0.7, 1.6) |
1.0 |
0.8 (0.5, 1.2) |
|
18.5-25 (normal weight) |
1.4 (1.2, 1.6) |
1.0 |
1.2 (1.0, 1.3) |
|
25-30 (overweight) |
1.1 (0.9, 1.4) |
1.0 |
1.1 (0.9, 1.3) |
|
30+ (obese) |
1.1 (0.8, 1.4) |
1.0 |
1.2 (0.9, 1.7) |
|
By race/ethnicity, adjusted for BMI (GWG*ethnicity p = 0.49) |
|
|
|
|
Non-Hispanic white |
1.1 (1.0, 1.4) |
1.0 |
1.1 (0.9, 1.3) |
|
Non-Hispanic black |
1.2 (1.0, 1.4) |
1.0 |
1.2 (1.0, 1.4) |
|
Hispanic |
1.3 (1.0, 1.7) |
1.0 |
1.0 (0.8, 1.3) |
|
Asian |
1.4 (1.0, 2.0) |
1.0 |
1.1 (0.7, 1.5) |
|
By race/ethnicity (N = 913,461), adjusted for pre-pregnancy weight (GWG*ethnicity p < 0.001) |
|
|
|
|
Non-Hispanic white |
1.1 (1.1, 1.1) |
1.0 |
1.1 (1.1, 1.1) |
|
Non-Hispanic black |
1.2 (1.1, 1.2) |
1.0 |
1.0 (1.0, 1.0) |
|
Hispanic |
1.1 (1.1, 1.2) |
1.0 |
1.0 (1.0, 1.1) |
|
Asian |
1.0 (1.0, 1.1) |
1.0 |
1.1 (1.0, 1.1) |
|
By BMI and race/ethnicity (GWG*BMI*ethnicity p = 0.82) |
|
|
|
|
Non-Hispanic white |
|
|
|
|
< 18.5 (underweight) |
1.0 (0.5, 1.9) |
1.0 |
0.7 (0.4, 1.4) |
|
18.5-25 (normal weight) |
1.3 (1.0, 1.7) |
1.0 |
1.2 (0.9, 1.4) |
|
25-30 (overweight) |
1.1 (0.8, 1.6) |
1.0 |
1.0 (0.7, 1.5) |
|
30+ (obese) |
1.0 (0.6, 1.6) |
1.0 |
1.3 (0.8, 2.2) |
|
Non-Hispanic black |
|
|
|
|
< 18.5 (underweight) |
1.3 (0.6, 2.9) |
1.0 |
0.8 (0.4, 1.8) |
|
18.5-25 (normal weight) |
1.2 (0.9, 1.6) |
1.0 |
1.1 (0.9, 1.5) |
|
25-30 (overweight) |
1.2 (0.9, 1.6) |
1.0 |
1.2 (0.8, 1.6) |
|
30+ (obese) |
1.3 (0.9, 1.8) |
1.0 |
1.4 (0.9, 2.2) |
|
Hispanic |
|
|
|
|
< 18.5 (underweight) |
1.1 (0.3, 4.3) |
1.0 |
0.7 (0.2, 2.5) |
|
18.5-25 (normal weight) |
1.5 (1.0, 2.2) |
1.0 |
1.1 (0.7, 1.6) |
|
25-30 (overweight) |
1.2 (0.7, 1.9) |
1.0 |
0.9 (0.5, 1.6) |
|
30+ (obese) |
1.0 (0.6, 1.8) |
1.0 |
0.9 (0.5, 1.8) |
|
Asian |
|
|
|
|
< 18.5 (underweight) |
0.3 (0.1, 1.4) |
1.0 |
0.9 (0.3, 2.1) |
|
18.5-25 (normal weight) |
1.8 (1.2, 2.8) |
1.0 |
1.3 (0.8, 2.1) |
|
25-30 (overweight) |
1.1 (0.5, 2.3) |
1.0 |
0.8 (0.3, 2.3) |
|
30+ (obese) |
0.4 (0.1, 1.3) |
1.0 |
0.4 (0.1, 2.1) |
|
aRate of gestational weight gain equivalent for 40 weeks gestation: lower tertile = −13.6-12 kg gain; middle tertile = 12.1-16.4 kg gain; upper tertile = 16.5-47.6 kg gain. |
|||
TABLE G-43 Odds Ratios and 95% Confidence Intervals for the Association of Rate of Gestational Weight Gain with Spontaneous Preterm Birth < 37 Weeks vs. Term Birth ≥ 37 Weeks among Singleton Births, New York City, 1995-2003, n = 33,615
|
|
Rate of Gestational Weight Gaina |
||
|
Lower Tertile |
Middle Tertile |
Upper Tertile |
|
|
Overall, unadjusted |
1.3 (1.2, 1.5) |
1.0 |
1.1 (1.0, 1.3) |
|
By BMI, adjusted for race/ethnicity (GWG*BMI p = 0.28) |
|
|
|
|
< 18.5 (underweight) |
1.0 (0.6, 1.6) |
1.0 |
0.8 (0.5, 1.2) |
|
18.5-25 (normal weight) |
1.4 (1.2, 1.7) |
1.0 |
1.1 (1.0, 1.3) |
|
25-30 (overweight) |
1.2 (0.9, 1.5) |
1.0 |
1.1 (0.8, 1.4) |
|
30+ (obese) |
1.1 (0.8, 1.5) |
1.0 |
1.2 (0.9, 1.7) |
|
By race/ethnicity, adjusted for BMI (GWG*ethnicity p = 0.75) |
|
|
|
|
Non-Hispanic white |
1.1 (0.9, 1.4) |
1.0 |
1.1 (0.9, 1.3) |
|
Non-Hispanic black |
1.3 (1.0, 1.5) |
1.0 |
1.2 (1.0, 1.5) |
|
Hispanic |
1.5 (1.1, 1.9) |
1.0 |
1.0 (0.7, 1.4) |
|
Asian |
1.2 (0.9, 1.8) |
1.0 |
1.1 (0.7, 1.7) |
|
By race/ethnicity (n = 898,893), adjusted for pre-pregnancy weight (GWG*ethnicity p < 0.001) |
|
|
|
|
Non-Hispanic white |
1.1 (1.1, 1.2) |
1.0 |
1.1 (1.1, 1.1) |
|
Non-Hispanic black |
1.2 (1.2, 1.3) |
1.0 |
1.0 (0.9, 1.0) |
|
Hispanic |
1.1 (1.1, 1.2) |
1.0 |
1.0 (0.9, 1.0) |
|
Asian |
1.1 (1.0, 1.1) |
1.0 |
1.1 (1.0, 1.1) |
|
By BMI and race/ethnicity (GWG*BMI*ethnicity p = 0.56) |
|
|
|
|
Non-Hispanic white |
|
|
|
|
< 18.5 (underweight) |
0.8 (0.4, 1.7) |
1.0 |
0.7 (0.3, 1.4) |
|
18.5-25 (normal weight) |
1.3 (1.0, 1.7) |
1.0 |
1.1 (0.9, 1.5) |
|
25-30 (overweight) |
1.2 (0.8, 1.9) |
1.0 |
0.8 (0.5, 1.3) |
|
30+ (obese) |
0.9 (0.5, 1.6) |
1.0 |
1.4 (0.8, 2.5) |
|
Non-Hispanic black |
|
|
|
|
< 18.5 (underweight) |
1.0 (0.4, 2.5) |
1.0 |
0.7 (0.3, 1.7) |
|
18.5-25 (normal weight) |
1.3 (1.0, 1.8) |
1.0 |
1.2 (0.9, 1.6) |
|
25-30 (overweight) |
1.3 (0.9, 1.9) |
1.0 |
1.3 (0.9, 2.0) |
|
30+ (obese) |
1.3 (0.8, 1.9) |
1.0 |
1.2 (0.7, 2.0) |
|
Hispanic |
|
|
|
|
< 18.5 (underweight) |
1.7 (0.4, 7.2) |
1.0 |
1.1 (0.3, 4.2) |
|
18.5-25 (normal weight) |
1.7 (1.1, 2.6) |
1.0 |
1.0 (0.6, 1.5) |
|
25-30 (overweight) |
1.0 (0.6, 1.9) |
1.0 |
1.0 (0.5, 1.8) |
|
30+ (obese) |
1.2 (0.6, 2.4) |
1.0 |
1.1 (0.5, 2.3) |
|
Asian |
|
|
|
|
< 18.5 (underweight) |
0.4 (0.1, 1.9) |
1.0 |
0.9 (0.3, 2.5) |
|
18.5-25 (normal weight) |
1.6 (1.0, 2.6) |
1.0 |
1.4 (0.9, 2.3) |
|
25-30 (overweight) |
0.9 (0.4, 2.1) |
1.0 |
0.7 (0.2, 2.2) |
|
30+ (obese) |
0.3 (0.1, 1.3) |
1.0 |
0.5 (0.1, 3.1) |
|
aRate of gestational weight gain equivalent for 40 weeks gestation: lower tertile = −13.6-12 kg gain; middle tertile = 12.1-16.4 kg gain; upper tertile = 16.5-47.6 kg gain. |
|||
TABLE G-44 Odds Ratios and 95% Confidence Intervals for the Association of Rate of Gestational Weight Gain with Primary Cesarean Delivery vs. Vaginal Delivery among Singleton Births, New York City, 1995-2003, n = 29,797
|
|
Rate of Gestational Weight Gaina |
||
|
Lower Tertile |
Middle Tertile |
Upper Tertile |
|
|
Overall, unadjusted |
1.0 (0.9, 1.1) |
1.0 |
1.4 (1.3, 1.5) |
|
By BMI, adjusted for race/ethnicity (GWG*BMI p = 0.81) |
|
|
|
|
< 18.5 (underweight) |
0.9 (0.6, 1.4) |
1.0 |
1.7 (1.2, 2.3) |
|
18.5-25 (normal weight) |
0.8 (0.8, 0.9) |
1.0 |
1.3 (1.2, 1.5) |
|
25-30 (overweight) |
0.9 (0.8, 1.0) |
1.0 |
1.4 (1.2, 1.6) |
|
30+ (obese) |
0.9 (0.7, 1.0) |
1.0 |
1.4 (1.1, 1.7) |
|
By race/ethnicity, adjusted for BMI (GWG*ethnicity p = 0.04) |
|
|
|
|
Non-Hispanic white |
0.8 (0.7, 0.9) |
1.0 |
1.4 (1.3, 1.6) |
|
Non-Hispanic black |
0.9 (0.8, 1.1) |
1.0 |
1.3 (1.1, 1.5) |
|
Hispanic |
0.8 (0.7, 1.0) |
1.0 |
1.3 (1.1, 1.5) |
|
Asian |
0.9 (0.7, 1.1) |
1.0 |
1.4 (1.2, 1.8) |
|
By race/ethnicity (n = 813,272), adjusted for pre-pregnancy weight (GWG*ethnicity p < 0.001) |
|
|
|
|
Non-Hispanic white |
0.8 (0.8, 0.8) |
1.0 |
1.4 (1.4, 1.4) |
|
Non-Hispanic black |
0.9 (0.8, 0.9) |
1.0 |
1.3 (1.2, 1.3) |
|
Hispanic |
0.8 (0.8, 0.8) |
1.0 |
1.3 (1.3, 1.3) |
|
Asian |
0.8 (0.8, 0.9) |
1.0 |
1.3 (1.3, 1.4) |
|
By BMI and race/ethnicity (GWG*BMI*ethnicity p = 0.86) |
|
|
|
|
Non-Hispanic white |
|
|
|
|
< 18.5 (underweight) |
1.2 (0.6, 2.3) |
1.0 |
1.9 (1.1, 3.4) |
|
18.5-25 (normal weight) |
0.7 (0.6, 0.9) |
1.0 |
1.4 (1.2, 1.5) |
|
25-30 (overweight) |
0.9 (0.7, 1.1) |
1.0 |
1.5 (1.3, 1.9) |
|
30+ (obese) |
0.8 (0.6, 1.1) |
1.0 |
1.4 (1.1, 1.9) |
|
Non-Hispanic black |
|
|
|
|
< 18.5 (underweight) |
1.0 (0.4, 2.6) |
1.0 |
2.7 (1.2, 6.1) |
|
18.5-25 (normal weight) |
1.0 (0.8, 1.2) |
1.0 |
1.3 (1.1, 1.6) |
|
25-30 (overweight) |
0.9 (0.7, 1.1) |
1.0 |
1.1 (0.9, 1.5) |
|
30+ (obese) |
0.9 (0.7, 1.2) |
1.0 |
1.4 (1.0, 1.9) |
|
Hispanic |
|
|
|
|
< 18.5 (underweight) |
0.7 (0.2, 2.6) |
1.0 |
0.9 (0.4, 2.5) |
|
18.5-25 (normal weight) |
0.8 (0.6, 1.0) |
1.0 |
1.2 (1.0, 1.5) |
|
25-30 (overweight) |
0.9 (0.6, 1.3) |
1.0 |
1.2 (0.8, 1.7) |
|
30+ (obese) |
0.9 (0.6, 1.4) |
1.0 |
1.6 (1.0, 2.7) |
|
Asian |
|
|
|
|
< 18.5 (underweight) |
0.7 (0.3, 1.5) |
1.0 |
1.5 (0.9, 2.5) |
|
18.5-25 (normal weight) |
1.0 (0.7, 1.3) |
1.0 |
1.4 (1.1, 1.9) |
|
25-30 (overweight) |
1.0 (0.6, 1.8) |
1.0 |
1.9 (1.0, 3.6) |
|
30+ (obese) |
0.5 (0.2, 1.4) |
1.0 |
0.5 (0.1, 2.1) |
|
aRate of gestational weight gain equivalent for 40 weeks gestation: lower tertile = −13.6-12 kg gain; middle tertile = 12.1-16.4 kg gain; upper tertile = 16.5-47.6 kg gain. |
|||
TABLE G-45 Odds Ratios and 95% Confidence Intervals for the Association of Gestational Weight Gain with Term Small-for-Gestational Age among Singleton Births, New York City, 1995-2003, n = 31,760
|
|
Gestational Weight Gain |
|||
|
0-9 kg |
10-14 kg |
15-19 kg |
20+ kg |
|
|
Overall, unadjusted |
1.3 (1.2, 1.4) |
1.0 |
0.7 (0.7, 0.8) |
0.5 (0.4, 0.6) |
|
By BMI, adjusted for race/ethnicity (GWG*BMI p = 0.43) |
|
|
|
|
|
< 18.5 (underweight) |
1.5 (1.0, 2.3) |
1.0 |
0.7 (0.5, 1.0) |
0.4 (0.2, 0.6) |
|
18.5-25 (normal weight) |
1.5 (1.3, 1.7) |
1.0 |
0.7 (0.6, 0.8) |
0.5 (0.4, 0.6) |
|
25-30 (overweight) |
1.4 (1.1, 1.7) |
1.0 |
0.6 (0.5, 0.8) |
0.6 (0.5, 0.9) |
|
30+ (obese) |
1.7 (1.3, 2.4) |
1.0 |
0.9 (0.6, 1.4) |
0.9 (0.5, 1.4) |
|
By race/ethnicity, adjusted for BMI (GWG*ethnicity p = 0.50) |
|
|
|
|
|
Non-Hispanic white |
1.5 (1.3, 1.7) |
1.0 |
0.7 (0.6, 0.8) |
0.5 (0.4, 0.6) |
|
Non-Hispanic black |
1.3 (1.1, 1.7) |
1.0 |
0.8 (0.7, 1.1) |
0.6 (0.5, 0.8) |
|
Hispanic |
1.7 (1.3, 2.1) |
1.0 |
0.7 (0.5, 0.9) |
0.6 (0.4, 0.8) |
|
Asian |
1.6 (1.2, 2.0) |
1.0 |
0.8 (0.6, 1.0) |
0.5 (0.3, 0.7) |
|
By race/ethnicity (n = 848,426), adjusted for pre-pregnancy weight (GWG*ethnicity p < 0.001) |
|
|
|
|
|
Non-Hispanic white |
1.7 (1.6, 1.7) |
1.0 |
0.7 (0.6, 0.7) |
0.5 (0.5, 0.5) |
|
Non-Hispanic black |
1.5 (1.5, 1.6) |
1.0 |
0.7 (0.7, 0.7) |
0.6 (0.5, 0.6) |
|
Hispanic |
1.5 (1.5, 1.5) |
1.0 |
0.7 (0.7, 0.8) |
0.6 (0.6, 0.6) |
|
Asian |
1.7 (1.6, 1.7) |
1.0 |
0.7 (0.7, 0.7) |
0.6 (0.6, 0.7) |
|
By BMI and race/ethnicity (GWG*BMI*ethnicity p = 0.41) |
|
|
|
|
|
Non-Hispanic white |
|
|
|
|
|
< 18.5 (underweight) |
1.0 (0.5, 1.9) |
1.0 |
0.5 (0.3, 1.0) |
0.5 (0.3, 1.1) |
|
18.5-25 (normal weight) |
1.6 (1.3, 1.9) |
1.0 |
0.7 (0.6, 0.9) |
0.5 (0.4, 0.6) |
|
25-30 (overweight) |
1.3 (0.9, 1.7) |
1.0 |
0.4 (0.3, 0.7) |
0.3 (0.2, 0.6) |
|
30+ (obese) |
1.8 (1.1, 2.8) |
1.0 |
0.6 (0.3, 1.3) |
0.8 (0.4, 1.7) |
|
Non-Hispanic black |
|
|
|
|
|
< 18.5 (underweight) |
2.2 (0.9, 5.8) |
1.0 |
0.9 (0.4, 2.5) |
0.2 (0.02, 1.4) |
|
18.5-25 (normal weight) |
1.2 (0.9, 1.7) |
1.0 |
0.7 (0.5, 1.0) |
0.4 (0.3, 0.6) |
|
25-30 (overweight) |
1.2 (0.8, 1.9) |
1.0 |
0.9 (0.6, 1.5) |
1.1 (0.6, 1.9) |
|
30+ (obese) |
2.1 (1.2, 3.7) |
1.0 |
1.5 (0.7, 3.1) |
1.4 (0.6, 3.3) |
|
Hispanic |
|
|
|
|
|
< 18.5 (underweight) |
4.8 (1.2, 18.4) |
1.0 |
1.6 (0.5, 5.6) |
1.1 (0.3, 4.8) |
|
18.5-25 (normal weight) |
1.4 (1.0, 1.9) |
1.0 |
0.6 (0.4, 0.8) |
0.5 (0.3, 0.7) |
|
25-30 (overweight) |
1.6 (1.0, 2.6) |
1.0 |
0.7 (0.4, 1.3) |
0.8 (0.4, 1.5) |
|
30+ (obese) |
2.1 (1.0, 4.2) |
1.0 |
1.1 (0.5, 2.9) |
0.6 (0.2, 2.4) |
|
Asian |
|
|
|
|
|
< 18.5 (underweight) |
1.4 (0.6, 3.1) |
1.0 |
0.7 (0.4, 1.3) |
0.1 (0.01, 0.5) |
|
18.5-25 (normal weight) |
1.7 (1.3, 2.3) |
1.0 |
0.8 (0.6, 1.0) |
0.7 (0.4, 1.1) |
|
25–30 (overweight) |
1.6 (0.9, 3.0) |
1.0 |
0.9 (0.4, 2.0) |
0.3 (0.04, 2.2) |
|
30+ (obese) |
0.1 (0.01, 1.2) |
1.0 |
0.4 (0.04, 3.7) |
n/ca |
|
an/c = not calculable. |
||||
TABLE G-46 Odds Ratios and 95% Confidence Intervals for the Association of Gestational Weight Gain with Term Large-for-Gestational Age among Singleton Births, New York City, 1995-2003, n = 31,760
|
|
Gestational Weight Gain |
|||
|
0-9 kg |
10-14 kg |
15-19 kg |
20+ kg |
|
|
Overall, unadjusted |
0.9 (0.8, 1.0) |
1.0 |
1.4 (1.3, 1.5) |
2.5 (2.3, 2.7) |
|
By BMI, adjusted for race/ethnicity (GWG*BMI p =0.01) |
|
|
|
|
|
< 18.5 (underweight) |
0.4 (0.1, 1.9) |
1.0 |
1.6 (0.8, 3.2) |
4.9 (2.6, 9.4) |
|
18.5-25 (normal weight) |
0.7 (0.5, 0.8) |
1.0 |
1.5 (1.3, 1.7) |
2.8 (2.5, 3.3) |
|
25-30 (overweight) |
0.6 (0.5, 0.7) |
1.0 |
1.3 (1.1, 1.6) |
2.2 (1.8, 2.6) |
|
30+ (obese) |
0.7 (0.6, 0.9) |
1.0 |
1.5 (1.2, 1.9) |
1.9 (1.5, 2.5) |
|
By race/ethnicity, adjusted for BMI (GWG*ethnicity p= 0.93) |
|
|
|
|
|
Non-Hispanic white |
0.7 (0.6, 0.9) |
1.0 |
1.5 (1.3, 1.7) |
2.6 (2.3, 3.0) |
|
Non-Hispanic black |
0.6 (0.5, 0.7) |
1.0 |
1.4 (1.2, 1.7) |
2.2 (1.8, 2.6) |
|
Hispanic |
0.6 (0.4, 0.9) |
1.0 |
1.4 (1.1, 1.9) |
2.7 (2.0, 3.6) |
|
Asian |
0.7 (0.4, 1.1) |
1.0 |
1.5 (1.0, 2.2) |
3.1 (2.0, 4.9) |
|
By race/ethnicity (n =848,426), adjusted for pre-pregnancy weight (GWG*ethnicity p < 0.001) |
|
|
|
|
|
Non-Hispanic white |
0.6 (0.6, 0.7) |
1.0 |
1.6 (1.5, 1.6) |
2.5 (2.4, 2.6) |
|
Non-Hispanic black |
0.7 (0.7, 0.7) |
1.0 |
1.5 (1.4, 1.5) |
2.2 (2.2, 2.3) |
|
Hispanic |
0.7 (0.6, 0.7) |
1.0 |
1.5 (1.4, 1.5) |
2.4 (2.3, 2.5) |
|
Asian |
0.6 (0.6, 0.7) |
1.0 |
1.6 (1.5, 1.7) |
2.7 (2.4, 2.9) |
|
By BMI and race/ethnicity (GWG*BMI*ethnicity p = 0.21) |
|
|
|
|
|
Non-Hispanic white |
|
|
|
|
|
< 18.5 (underweight) |
n/ca |
1.0 |
1.1 (0.4, 3.1) |
4.3 (1.7, 10.6) |
|
18.5-25 (normal weight) |
0.9 (0.7, 1.1) |
1.0 |
1.5 (1.2, 1.8) |
3.0 (2.5, 3.7) |
|
25-30 (overweight) |
0.5 (0.4, 0.8) |
1.0 |
1.5 (1.2, 2.0) |
2.3 (1.8, 3.1) |
|
30+ (obese) |
0.7 (0.5, 1.0) |
1.0 |
1.5 (1.1, 2.1) |
1.8 (1.3, 2.6) |
|
Non-Hispanic black |
|
|
|
|
|
< 18.5 (underweight) |
0.5 (0.1, 4.5) |
1.0 |
1.2 (0.3, 4.5) |
4.8 (1.5, 15.3) |
|
18.5-25 (normal weight) |
0.5 (0.3, 0.8) |
1.0 |
1.5 (1.2, 2.0) |
2.3 (1.8, 3.0) |
|
25-30 (overweight) |
0.6 (0.4, 0.8) |
1.0 |
1.1 (0.9, 1.5) |
2.3 (1.7, 3.1) |
|
30+ (obese) |
0.7 (0.5, 1.0) |
1.0 |
1.5 (1.1, 2.2) |
1.4 (0.9, 2.1) |
|
Hispanic |
|
|
|
|
|
< 18.5 (underweight) |
n/ca |
1.0 |
n/ca |
n/ca |
|
18.5-25 (normal weight) |
0.4 (0.2, 0.9) |
1.0 |
1.6 (1.1, 2.4) |
3.1 (2.1, 4.7) |
|
25-30 (overweight) |
0.8 (0.4, 1.4) |
1.0 |
1.3 (0.7, 2.2) |
1.4 (0.8, 2.5) |
|
30+ (obese) |
0.7 (0.3, 1.3) |
1.0 |
1.1 (0.5, 2.4) |
4.2 (2.1, 8.2) |
|
Asian |
|
|
|
|
|
< 18.5 (underweight) |
n/ca |
1.0 |
3.6 (0.7, 18.3) |
5.7 (0.9, 35.0) |
|
18.5-25 (normal weight) |
0.7 (0.3, 1.4) |
1.0 |
1.5 (0.9, 2.3) |
3.1 (1.8, 5.3) |
|
25-30 (overweight) |
0.7 (0.3, 1.5) |
1.0 |
0.7 (0.3, 2.0) |
1.8 (0.5, 5.8) |
|
30+ (obese) |
0.6 (0.1, 3.7) |
1.0 |
4.4 (0.9, 22.7) |
13.3 (2.2, 81.9) |
|
an/c = not calculable. |
||||
TABLE G-47A Adjusteda Odds Ratios and 95% Confidence Intervals for the Association of Rate of Gestational Weight Gain with Preterm Birth < 37 Weeks among Singleton Births, New York City, 1995-2003, n = 34,307
|
|
Rate of Gestational Weight Gainb |
||
|
Lower Tertile |
Middle Tertile |
Upper Tertile |
|
|
Overall |
1.3 (1.1, 1.4) |
1.0 |
1.1 (1.0, 1.3) |
|
By BMI (GWG*BMI p = 0.12) |
|
|
|
|
< 18.5 (underweight) |
1.1 (0.7, 1.6) |
1.0 |
0.8 (0.5, 1.2) |
|
18.5-25 (normal weight) |
1.4 (1.2, 1.6) |
1.0 |
1.2 (1.0, 1.3) |
|
25-30 (overweight) |
1.1 (0.9, 1.4) |
1.0 |
1.1 (0.9, 1.3) |
|
30+ (obese) |
1.1 (0.8, 1.4) |
1.0 |
1.2 (0.9, 1.6) |
|
By race/ethnicity (GWG*ethnicity p = 0.53) |
|
|
|
|
Non-Hispanic white |
1.1 (1.0, 1.4) |
1.0 |
1.1 (0.9, 1.3) |
|
Non-Hispanic black |
1.2 (1.0, 1.4) |
1.0 |
1.2 (1.0, 1.4) |
|
Hispanic |
1.3 (1.0, 1.7) |
1.0 |
1.0 (0.8, 1.3) |
|
Asian |
1.4 (1.0, 1.9) |
1.0 |
1.1 (0.7, 1.5) |
|
By BMI and race/ethnicity (GWG*BMI*ethnicity p = 0.79) |
|
|
|
|
Non-Hispanic white |
|
|
|
|
< 18.5 (underweight) |
1.0 (0.5, 1.9) |
1.0 |
0.7 (0.4, 1.4) |
|
18.5-25 (normal weight) |
1.3 (1.1, 1.7) |
1.0 |
1.2 (0.9, 1.4) |
|
25-30 (overweight) |
1.1 (0.8, 1.6) |
1.0 |
1.0 (0.7, 1.5) |
|
30+ (obese) |
1.0 (0.6, 1.5) |
1.0 |
1.3 (0.8, 2.2) |
|
Non-Hispanic black |
|
|
|
|
< 18.5 (underweight) |
1.3 (0.6, 2.7) |
1.0 |
0.8 (0.3, 1.7) |
|
18.5-25 (normal weight) |
1.3 (0.9, 1.6) |
1.0 |
1.1 (0.9, 1.5) |
|
25-30 (overweight) |
1.1 (0.8, 1.6) |
1.0 |
1.2 (0.9, 1.7) |
|
30+ (obese) |
1.3 (0.9, 1.8) |
1.0 |
1.5 (0.9, 2.2) |
|
Hispanic |
|
|
|
|
< 18.5 (underweight) |
1.1 (0.3, 4.2) |
1.0 |
0.7 (0.2, 2.5) |
|
18.5-25 (normal weight) |
1.5 (1.0, 2.2) |
1.0 |
1.1 (0.8, 1.6) |
|
25-30 (overweight) |
1.1 (0.7, 1.9) |
1.0 |
0.9 (0.5, 1.6) |
|
30+ (obese) |
1.0 (0.6, 1.8) |
1.0 |
0.9 (0.5, 1.8) |
|
Asian |
|
|
|
|
< 18.5 (underweight) |
0.3 (0.1, 1.4) |
1.0 |
0.9 (0.4, 2.1) |
|
18.5-25 (normal weight) |
1.8 (1.2, 2.7) |
1.0 |
1.3 (0.8, 2.1) |
|
25-30 (overweight) |
1.0 (0.5, 2.3) |
1.0 |
0.8 (0.3, 2.3) |
|
30+ (obese) |
0.5 (0.1, 1.4) |
1.0 |
0.4 (0.1, 2.3) |
|
aAdjusted for maternal age, parity, education, and smoking. bRate of gestational weight gain equivalent for 40 weeks gestation: lower tertile = −13.6-12 kg gain; middle tertile = 12.1-16.4 kg gain; upper tertile = 16.5-47.6 kg gain. |
|||
TABLE G-47B Adjusteda Odds Ratios and 95% Confidence Intervals for the Association of Rate of Gestational Weight Gain with Spontaneous Preterm Birth < 37 Weeks vs. Term Birth ≥ 37 Weeks among Singleton Births, New York City, 1995-2003, n = 33,615
|
|
Rate of Gestational Weight Gainb |
||
|
Lower Tertile |
Middle Tertile |
Upper Tertile |
|
|
Overall |
1.3 (1.1, 1.4) |
1.0 |
1.1 (1.0, 1.3) |
|
By BMI (GWG*BMI p = 0.27) |
|
|
|
|
< 18.5 (underweight) |
1.0 (0.6, 1.6) |
1.0 |
0.7 (0.5, 1.2) |
|
18.5-25 (normal weight) |
1.4 (1.2, 1.7) |
1.0 |
1.1 (1.0, 1.4) |
|
25-30 (overweight) |
1.2 (0.9, 1.5) |
1.0 |
1.1 (0.8, 1.4) |
|
30+ (obese) |
1.1 (0.8, 1.4) |
1.0 |
1.2 (0.9, 1.7) |
|
By race/ethnicity (GWG*ethnicity p = 0.77) |
|
|
|
|
Non-Hispanic white |
1.1 (0.9, 1.4) |
1.0 |
1.0 (0.9, 1.3) |
|
Non-Hispanic black |
1.3 (1.0, 1.5) |
1.0 |
1.2 (1.0, 1.5) |
|
Hispanic |
1.4 (1.1, 1.9) |
1.0 |
1.0 (0.7, 1.4) |
|
Asian |
1.2 (0.8, 1.8) |
1.0 |
1.1 (0.7, 1.7) |
|
By BMI and race/ethnicity (GWG*BMI*ethnicity p = 0.50) |
|
|
|
|
Non-Hispanic white |
|
|
|
|
< 18.5 (underweight) |
0.8 (0.4, 1.7) |
1.0 |
0.7 (0.3, 1.4) |
|
18.5-25 (normal weight) |
1.3 (1.0, 1.7) |
1.0 |
1.1 (0.9, 1.4) |
|
25-30 (overweight) |
1.2 (0.8, 1.9) |
1.0 |
0.8 (0.5, 1.3) |
|
30+ (obese) |
0.9 (0.5, 1.5) |
1.0 |
1.4 (0.8, 2.5) |
|
Non-Hispanic black |
|
|
|
|
< 18.5 (underweight) |
1.0 (0.4, 2.4) |
1.0 |
0.7 (0.3, 1.7) |
|
18.5-25 (normal weight) |
1.3 (1.0, 1.8) |
1.0 |
1.2 (0.9, 1.6) |
|
25-30 (overweight) |
1.3 (0.9, 1.9) |
1.0 |
1.4 (0.9, 2.0) |
|
30+ (obese) |
1.3 (0.8, 2.0) |
1.0 |
1.2 (0.7, 2.0) |
|
Hispanic |
|
|
|
|
< 18.5 (underweight) |
1.6 (0.4, 7.0) |
1.0 |
1.1 (0.3, 4.2) |
|
18.5-25 (normal weight) |
1.7 (1.1, 2.6) |
1.0 |
1.0 (0.6, 1.5) |
|
25-30 (overweight) |
1.0 (0.6, 1.8) |
1.0 |
1.0 (0.5, 1.8) |
|
30+ (obese) |
1.2 (0.6, 2.3) |
1.0 |
1.0 (0.5, 2.3) |
|
Asian |
|
|
|
|
< 18.5 (underweight) |
0.4 (0.1, 1.9) |
1.0 |
0.9 (0.3, 2.5) |
|
18.5-25 (normal weight) |
1.6 (1.0, 2.6) |
1.0 |
1.4 (0.9, 2.3) |
|
25-30 (overweight) |
0.9 (0.4, 2.1) |
1.0 |
0.7 (0.2, 2.2) |
|
30+ (obese) |
0.3 (0.1, 1.3) |
1.0 |
0.6 (0.1, 3.4) |
|
aAdjusted for maternal age, parity, education, and smoking. bRate of gestational weight gain equivalent for 40 weeks gestation: lower tertile = −13.6-12 kg gain; middle tertile = 12.1-16.4 kg gain; upper tertile = 16.5-47.6 kg gain. |
|||
TABLE G-47C Adjusteda Odds Ratios and 95% Confidence Intervals for the Association of Rate of Gestational Weight Gain with Primary Cesarean Delivery vs. Vaginal Delivery among Singleton Births, New York City, 1995-2003, n = 29,797
|
|
Rate of Gestational Weight Gainb |
||
|
Lower Tertile |
Middle Tertile |
Upper Tertile |
|
|
Overall |
1.0 (0.9, 1.1) |
1.0 |
1.3 (1.2, 1.4) |
|
By BMI (GWG*BMI p = 0.62) |
|
|
|
|
< 18.5 (underweight) |
0.9 (0.6, 1.3) |
1.0 |
1.7 (1.2, 2.3) |
|
18.5-25 (normal weight) |
0.9 (0.8, 1.0) |
1.0 |
1.3 (1.2, 1.4) |
|
25-30 (overweight) |
1.0 (0.8, 1.1) |
1.0 |
1.3 (1.1, 1.5) |
|
30+ (obese) |
0.9 (0.7, 1.0) |
1.0 |
1.2 (1.0, 1.5) |
|
By race/ethnicity (GWG*ethnicity p = 0.15) |
|
|
|
|
Non-Hispanic white |
0.9 (0.8, 1.0) |
1.0 |
1.3 (1.2, 1.5) |
|
Non-Hispanic black |
0.9 (0.8, 1.1) |
1.0 |
1.3 (1.1, 1.5) |
|
Hispanic |
0.9 (0.7, 1.1) |
1.0 |
1.2 (1.0, 1.5) |
|
Asian |
1.0 (0.8, 1.2) |
1.0 |
1.3 (1.1, 1.6) |
|
By BMI and race/ethnicity (GWG*BMI*ethnicity p = 0.64) |
|
|
|
|
Non-Hispanic white |
|
|
|
|
< 18.5 (underweight) |
1.2 (0.6, 2.3) |
1.0 |
1.9 (1.1, 3.3) |
|
18.5-25 (normal weight) |
0.8 (0.7, 0.9) |
1.0 |
1.3 (1.1, 1.4) |
|
25-30 (overweight) |
1.0 (0.7, 1.2) |
1.0 |
1.4 (1.1, 1.8) |
|
30+ (obese) |
0.9 (0.7, 1.2) |
1.0 |
1.3 (0.9, 1.7) |
|
Non-Hispanic black |
|
|
|
|
< 18.5 (underweight) |
0.8 (0.3, 2.3) |
1.0 |
2.6 (1.2, 6.0) |
|
18.5-25 (normal weight) |
1.1 (0.9, 1.3) |
1.0 |
1.3 (1.1, 1.6) |
|
25-30 (overweight) |
0.9 (0.7, 1.2) |
1.0 |
1.1 (0.9, 1.4) |
|
30+ (obese) |
0.8 (0.6, 1.1) |
1.0 |
1.1 (0.8, 1.6) |
|
Hispanic |
|
|
|
|
< 18.5 (underweight) |
1.0 (0.3, 3.7) |
1.0 |
1.1 (0.4, 2.9) |
|
18.5-25 (normal weight) |
0.9 (0.7, 1.1) |
1.0 |
1.2 (1.0, 1.5) |
|
25-30 (overweight) |
1.0 (0.7, 1.4) |
1.0 |
1.1 (0.7, 1.6) |
|
30+ (obese) |
1.0 (0.6, 1.7) |
1.0 |
1.7 (1.0, 2.9) |
|
Asian |
|
|
|
|
< 18.5 (underweight) |
0.7 (0.3, 1.4) |
1.0 |
1.4 (0.8, 2.5) |
|
18.5-25 (normal weight) |
1.1 (0.8, 1.5) |
1.0 |
1.3 (1.0, 1.7) |
|
25-30 (overweight) |
1.0 (0.6, 1.9) |
1.0 |
1.6 (0.8, 3.0) |
|
30+ (obese) |
0.4 (0.1, 1.2) |
1.0 |
0.4 (0.1, 1.7) |
|
aAdjusted for maternal age, parity, education, and smoking. bRate of gestational weight gain equivalent for 40 weeks gestation: lower tertile = −13.6-12 kg gain; middle tertile = 12.1-16.4 kg gain; upper tertile = 16.5-47.6 kg gain. |
|||
TABLE G-47D Adjusteda Odds Ratios and 95% Confidence Intervals for the Association of Gestational Weight Gain with Term Small-for-Gestational Age among Singleton Births, New York City, 1995-2003, n = 31,760
|
|
Gestational Weight Gain |
|||
|
0-9 kg |
10-14 kg |
15-19 kg |
20+ kg |
|
|
Overall |
1.3 (1.2, 1.4) |
1.0 |
0.7 (0.7, 0.8) |
0.5 (0.4, 0.6) |
|
By BMI (GWG*BMI p = 0.42) |
|
|
|
|
|
< 18.5 (underweight) |
1.5 (1.0, 2.3) |
1.0 |
0.7 (0.5, 1.0) |
0.3 (0.2, 0.6) |
|
18.5-25 (normal weight) |
1.5 (1.3, 1.7) |
1.0 |
0.7 (0.6, 0.8) |
0.5 (0.4, 0.6) |
|
25-30 (overweight) |
1.4 (1.1, 1.7) |
1.0 |
0.6 (0.5, 0.8) |
0.6 (0.4, 0.8) |
|
30+ (obese) |
1.8 (1.3, 2.4) |
1.0 |
0.9 (0.6, 1.4) |
0.9 (0.5, 1.4) |
|
By race/ethnicity (GWG*ethnicity p = 0.52) |
|
|
|
|
|
Non-Hispanic white |
1.5 (1.3, 1.7) |
1.0 |
0.7 (0.6, 0.8) |
0.5 (0.4, 0.6) |
|
Non-Hispanic black |
1.3 (1.1, 1.7) |
1.0 |
0.9 (0.7, 1.1) |
0.6 (0.4, 0.8) |
|
Hispanic |
1.6 (1.3, 2.1) |
1.0 |
0.7 (0.5, 0.9) |
0.6 (0.4, 0.8) |
|
Asian |
1.6 (1.2, 2.0) |
1.0 |
0.8 (0.6, 1.0) |
0.5 (0.3, 0.7) |
|
By BMI and race/ethnicity (GWG*BMI*ethnicity p = 0.42) |
|
|
|
|
|
Non-Hispanic white |
|
|
|
|
|
< 18.5 (underweight) |
1.1 (0.6, 2.0) |
1.0 |
0.5 (0.3, 0.9) |
0.5 (0.2, 1.0) |
|
18.5-25 (normal weight) |
1.5 (1.3, 1.9) |
1.0 |
0.7 (0.6, 0.9) |
0.5 (0.4, 0.6) |
|
25-30 (overweight) |
1.2 (0.9, 1.7) |
1.0 |
0.4 (0.3, 0.7) |
0.3 (0.2, 0.6) |
|
30+ (obese) |
1.8 (1.1, 2.8) |
1.0 |
0.6 (0.3, 1.2) |
0.8 (0.4, 1.7) |
|
Non-Hispanic black |
|
|
|
|
|
< 18.5 (underweight) |
2.3 (0.9, 5.9) |
1.0 |
1.0 (0.4, 2.5) |
0.2 (0.02, 1.4) |
|
18.5-25 (normal weight) |
1.2 (0.9, 1.7) |
1.0 |
0.7 (0.5, 1.0) |
0.4 (0.3, 0.6) |
|
25-30 (overweight) |
1.2 (0.8, 1.9) |
1.0 |
0.9 (0.6, 1.6) |
1.1 (0.6, 1.9) |
|
30+ (obese) |
2.1 (1.2, 3.8) |
1.0 |
1.5 (0.7, 3.1) |
1.4 (0.6, 3.4) |
|
Hispanic |
|
|
|
|
|
< 18.5 (underweight) |
4.3 (1.1, 16.8) |
1.0 |
1.7 (0.5, 5.9) |
1.1 (0.3, 4.6) |
|
18.5-25 (normal weight) |
1.3 (1.0, 1.9) |
1.0 |
0.6 (0.4, 0.8) |
0.5 (0.3, 0.7) |
|
25-30 (overweight) |
1.5 (1.0, 2.5) |
1.0 |
0.7 (0.4, 1.3) |
0.8 (0.4, 1.4) |
|
30+ (obese) |
2.1 (1.0, 4.1) |
1.0 |
1.2 (0.5, 2.9) |
0.6 (0.2, 2.2) |
|
Asian |
|
|
|
|
|
< 18.5 (underweight) |
1.4 (0.6, 3.1) |
1.0 |
0.7 (0.4, 1.3) |
0.1 (0.01, 0.5) |
|
18.5-25 (normal weight) |
1.7 (1.3, 2.3) |
1.0 |
0.8 (0.6, 1.0) |
0.7 (0.4, 1.1) |
|
25-30 (overweight) |
1.6 (0.9, 3.0) |
1.0 |
0.9 (0.4, 2.0) |
0.3 (0.04, 2.2) |
|
30+ (obese) |
0.1 (0.01, 1.2) |
1.0 |
0.4 (0.05, 3.8) |
n/cb |
|
aAdjusted for maternal age, education, and smoking. bn/c = not calculable. |
||||
TABLE G-47E Adjusteda Odds Ratios and 95% Confidence Intervals for the Association of Gestational Weight Gain with Term Large-for-Gestational Age among Singleton Births, New York City, 1995-2003, n = 31,760
|
|
Gestational Weight Gain |
|||
|
0-9 kg |
10-14 kg |
15-19 kg |
20+ kg |
|
|
Overall |
0.9 (0.8, 1.0) |
1.0 |
1.4 (1.3, 1.5) |
2.6 (2.3, 2.9) |
|
By BMI (GWG*BMI p = 0.02) |
|
|
|
|
|
< 18.5 (underweight) |
0.4 (0.1, 1.8) |
1.0 |
1.6 (0.8, 3.2) |
5.1 (2.7, 9.8) |
|
18.5-25 (normal weight) |
0.7 (0.6, 0.9) |
1.0 |
1.5 (1.3, 1.7) |
2.9 (2.5, 3.3) |
|
25-30 (overweight) |
0.6 (0.5, 0.7) |
1.0 |
1.3 (1.1, 1.6) |
2.3 (1.9, 2.7) |
|
30+ (obese) |
0.7 (0.6, 0.9) |
1.0 |
1.5 (1.2, 1.9) |
2.0 (1.5, 2.5) |
|
By race/ethnicity (GWG*ethnicity p = 0.89) |
|
|
|
|
|
Non-Hispanic white |
0.8 (0.6, 0.9) |
1.0 |
1.5 (1.3, 1.7) |
2.7 (2.3, 3.1) |
|
Non-Hispanic black |
0.6 (0.5, 0.7) |
1.0 |
1.4 (1.2, 1.7) |
2.2 (1.9, 2.7) |
|
Hispanic |
0.7 (0.5, 0.9) |
1.0 |
1.4 (1.1, 1.9) |
2.8 (2.1, 3.8) |
|
Asian |
0.7 (0.4, 1.1) |
1.0 |
1.5 (1.0, 2.2) |
3.2 (2.0, 5.0) |
|
By BMI and race/ethnicity (GWG*BMI*ethnicity p = 0.16) |
|
|
|
|
|
Non-Hispanic white |
|
|
|
|
|
< 18.5 (underweight) |
n/cb |
1.0 |
1.1 (0.4, 3.2) |
4.5 (1.8, 11.4) |
|
18.5-25 (normal weight) |
0.9 (0.7, 1.2) |
1.0 |
1.5 (1.3, 1.8) |
3.1 (2.6, 3.7) |
|
25-30 (overweight) |
0.5 (0.4, 0.8) |
1.0 |
1.5 (1.2, 2.0) |
2.4 (1.9, 3.2) |
|
30+ (obese) |
0.7 (0.5, 1.0) |
1.0 |
1.6 (1.1, 2.2) |
1.9 (1.3, 2.7) |
|
Non-Hispanic black |
|
|
|
|
|
< 18.5 (underweight) |
0.5 (0.1, 4.3) |
1.0 |
1.2 (0.3, 4.4) |
4.8 (1.5, 15.4) |
|
18.5-25 (normal weight) |
0.5 (0.3, 0.8) |
1.0 |
1.5 (1.2, 2.0) |
2.3 (1.8, 3.1) |
|
25-30 (overweight) |
0.6 (0.4, 0.8) |
1.0 |
1.1 (0.9, 1.5) |
2.4 (1.8, 3.3) |
|
30+ (obese) |
0.7 (0.5, 1.0) |
1.0 |
1.5 (1.1, 2.2) |
1.4 (0.9, 2.1) |
|
Hispanic |
|
|
|
|
|
< 18.5 (underweight) |
n/cb |
1.0 |
n/cb |
n/cb |
|
18.5-25 (normal weight) |
0.4 (0.2, 0.9) |
1.0 |
1.6 (1.0, 2.4) |
3.2 (2.1, 4.8) |
|
25-30 (overweight) |
0.8 (0.4, 1.4) |
1.0 |
1.3 (0.7, 2.2) |
1.5 (0.8, 2.6) |
|
30+ (obese) |
0.7 (0.3, 1.3) |
1.0 |
1.1 (0.5, 2.4) |
4.7 (2.4, 9.2) |
|
Asian |
|
|
|
|
|
< 18.5 (underweight) |
n/cb |
1.0 |
3.6 (0.7, 18.2) |
5.8 (0.9, 35.9) |
|
18.5-25 (normal weight) |
0.7 (0.3, 1.4) |
1.0 |
1.5 (0.9, 2.4) |
3.1 (1.8, 5.4) |
|
25-30 (overweight) |
0.6 (0.3, 1.5) |
1.0 |
0.7 (0.3, 2.0) |
1.9 (0.6, 6.1) |
|
30+ (obese) |
0.6 (0.1, 3.6) |
1.0 |
4.3 (0.8, 21.9) |
13.6 (2.2, 83.6) |
|
aAdjusted for maternal age, education, and smoking. bn/c = not calculable. |
||||
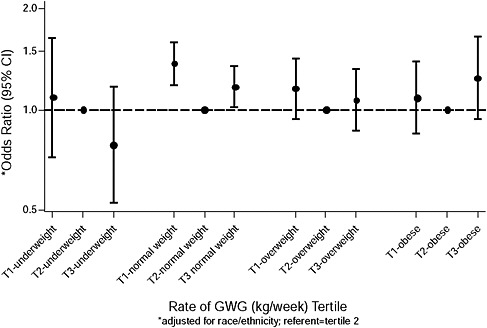
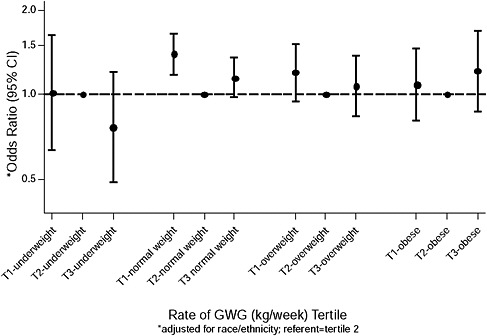
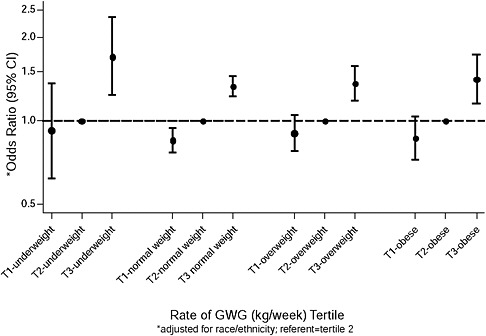
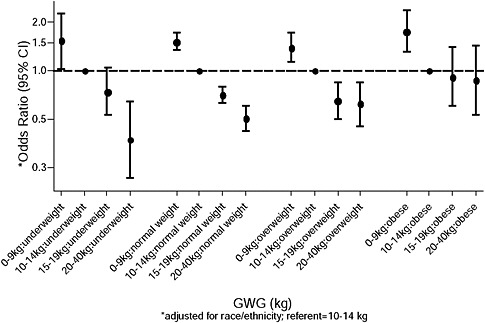
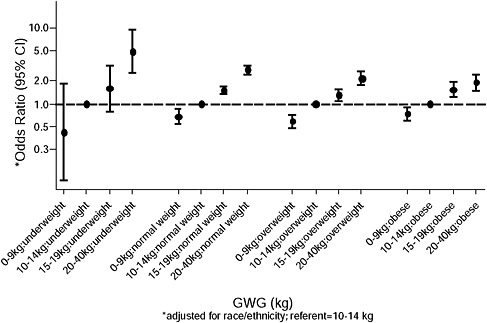
FIGURE G-56 Gestational weigh gain and term large-for-gestational age (LGA) by body mass index (BMI).
necessary to consider how to balance increasing risks of some outcomes against decreasing risks of others. To assist this consideration, a quantitative analysis of risk tradeoffs was performed.
Based on discussion with the Committee to Reexamine IOM Pregnancy Weight Guidelines, three outcomes were considered: infant mortality, post-partum weight retention (PPWR), and childhood obesity. These endpoints were selected because they were believed to be quantitatively important and to be reasonably estimable with available data. (In this context, quantitative importance requires that the occurrence of each outcome has significant effects on health and the probability of occurrence varies significantly with GWG.) Other outcomes (e.g., SGA, LGA) were not quantified in part because estimating the effect of these outcomes on health (i.e., ensuing morbidity and mortality) was judged to be too difficult or speculative given available data and resources.
The analysis was framed by estimating how the probability of each outcome varies with GWG controlling for pregravid BMI category (using the World Health Organization [WHO] categories: underweight < 18.5, normal 18.5-24.9, overweight 25-29.9, and obese ≥ 30 kg/m2). These estimates are obtained from observational epidemiological data and assume that the observed associations are causal.
For each endpoint, the expected number of quality-adjusted life-years (QALYs) lost over the lifetime of the mother and child was estimated. QALYs are a standard measure of health that combined length of life and quality of health. They are defined as the sum of the time spent in each health state weighted by the health-related quality of life (HRQL) associated with that state. HRQL is a measure of the quality or utility associated with a health state, normalized so that perfect health takes a value of one and a health state equivalent to dead has a value of zero (health states that are viewed as worse than dead may be assigned values smaller than zero). Summing across endpoints (weighted by their probabilities of occurrence) yields an estimate of the total expected number of QALYs lost from these three outcomes. The use of this metric implies that the health impairments of different outcomes, occurring to mothers and children, are appropriately judged by comparing the corresponding expected losses in QALYs. The use of expected QALYs to evaluate health effects within and among individuals is common in health economics and public health, but not without controversy (see, e.g., IOM, 2006).
The following subsections describe the data used to estimate the probabilities and QALYs lost for each outcome. The final section reports the results of summing the estimated health losses across outcomes.
Infant Mortality
Infant mortality was chosen as an outcome measure that aggregates many of the pathways through which inadequate or excessive GWG may lead to fatal outcomes. Its use is convenient because infant death is clearly more significant than many other birth outcomes and by aggregating across pathways one avoids the necessity of detailed modeling associated with how various outcomes (e.g., SGA) lead to infant fatality.
Prevalence
Two estimates of the prevalence of infant mortality as a function of GWG and pregravid BMI are available: one by Chen et al. (2008) and a second conducted for the Committee by Amy Herring. Both estimates use data from the 1988 U.S. National Maternal and Infant Health Survey (NMIHS). Within BMI class, Chen et al. (2008) estimate total infant mortality prevalence among live births for each of four classes of GWG gain (< 0.15, 0.15-0.29, 0.30-0.45, ≥ 0.45 kg/wk). These were converted to full-term GWG gain by multiplying by 40, yielding the following classes: < 6, 6-12, 12-18, ≥ 18 kg. At the Committee’s request, Herring estimated infant mortality rate excluding congenital defects (that are believed to be unrelated to GWG) and restricting the NMIHS sample to term births. She estimated
prevalence using the four BMI classes and seven GWG classes (< 0, 0-5, 5-10, 10-15, 15-20, 20-25, ≥ 25 kg). The overall infant mortality rate in the NMIHS data is 1.0/100 live births, substantially larger than the current U.S. value of 0.64/100. To convert to current values, all of the estimates of prevalence were multiplied by 0.64, which assumes a constant proportional improvement in infant mortality rate across BMI/GWG classes.
The Chen et al. (2008) and Herring estimates of infant mortality by GWG classes were converted to continuous functions of GWG by fitting polynomial functions to the estimated prevalence for the midpoints of the GWG categories (for open intervals a typical value was assumed). The polynomial functions are saturated, including as many terms as are estimable from the categorical estimates (i.e., third order for the Chen et al. estimates, sixth order for the Herring estimates). As a consequence, these polynomial functions exactly reproduce the observations to which they are fit. (These polynomial functions are best viewed as smoothed curves fit to the underlying categorical estimates rather than as statistical models of the relationship between infant mortality and GWG). The categorical estimates are reported in Tables G-48A and G-48B. Note that the Herring analysis shows that infant mortality is lower at the two extreme points than at the adjacent GWG categories (i.e., for the smallest weight gain category among underweight women and for the largest weight gain category among obese
TABLE G-48A Infant Mortality (Chen et al., 2008)
TABLE G-48B Infant Mortality (Herring)
women). These departures from the anticipated J- or U-shaped relationship between GWG and infant mortality seem implausible and may reflect limited data at the extreme points or artifacts of model estimation.
QALYs Lost
Infant mortality implies the child’s entire lifetime is lost. A value of 80 QALYs is assumed, consistent with current life expectancy at birth. In principle, one could adjust this figure downward to recognize that not all years of life are lived in perfect health (especially at older ages), but adjustment
for this factor is viewed as negligible in comparison with other uncertainties and approximations in the risk tradeoff calculations. The figure might also be adjusted downward if it is considered appropriate to discount the value of future life years.
Postpartum Weight Retention (PPWR)
Prevalence
Prevalence estimates were provided by Ellen Nohr using data from the Danish National Birth Cohort (Nohr et al., 2008). For this analysis, PPWR is defined as retention of at least 5 kg body mass 6 months after birth. Prevalence estimates were provided for four GWG classes (< 10, 10-15, 16-19, ≥ 20 kg), as reported in Table G-49. Third order polynomial functions were fit to these estimates.
QALYs Lost
The effects of PPWR on morbidity and mortality are estimated on the assumption that weight retained post-partum is retained for the rest
TABLE G-49 Post-Partum Weight Retention (Nohr)
of a woman’s life and using estimates of how mortality and health-related quality of life vary with BMI. First, average retained weight conditional on retaining at least 5 kg at 6 months post-partum is estimated as 10 kg (based in part on data from committee member Barbara Abrams suggesting that roughly half of women who retain at least 5 kg retain at least 10 kg). The incremental effect on BMI of a 10 kg weight increase is 3.7, calculated using a nominal average height (5 foot 5 inches).
Mortality The effect of increased BMI on mortality is calculated using estimates from Peeters et al. (2003) cited by Hu (2008). Using data from the Framingham heart study, they estimated that an average 40 year old female nonsmoker loses 3.3 years of life if overweight and 7.1 years if obese. Using midpoint values of BMI for normal, overweight, and obese (assumed value = 33), a 1 point increment to BMI is associated with about 0.6 life years lost, and so the effect of a 3.7 point BMI increment is estimated as 2.2 years (this is the average of the slopes estimated by comparing overweight and obese with normal weight, 2.1 and 2.3, respectively). This effect is applied only to women with pregravid BMI in the overweight and obese categories. No account is taken of any possible beneficial effect of weight gain on mortality of underweight women.
Morbidity Jia and Lubetkin (2005) used data from the U.S. Medical Expenditure Panel Survey (MEPS) to estimate how HRQL varies with BMI class. The MEPS includes two measures of individual’s current HRQL obtained using the EQ-5D and EQ-VAS. The EQ-5D is a standard instrument used to estimate HRQL based on classification of health into one of three levels (no problem, some problem, severe problem) on each of five dimensions or attributes (mobility, self care, usual activities, pain/discomfort, anxiety/depression). The EQ-VAS is an example of a visual analog scale, another common instrument on which respondents mark a point on a visual scale (or report a number on the scale) that they associate with their health state. Jia and Lubetkin (2005) report regression estimates of the partial effect of BMI class on each measure of HRQL, controlling for age, income, race/ethnicity, physical activity, presence of each of several diseases (asthma, hypertension, diabetes, heart disease, stroke, emphysema), and other factors. Compared with normal BMI, the estimated loss in HRQL is 0.013 (EQ-5D) and 0.0052 (VAS) for overweight, 0.033(EQ-5D) and 0.0323 (VAS) for obesity class I, and 0.073 (EQ-5D) and 0.0494 (VAS) for obesity class II (note: class I and II obesity are distinguished by BMI < 30 and ≥ 30). The total effect of higher BMI on HRQL is presumably larger than these estimates because some of the diseases for which Jia and Lubetkin control in their regression models are likely consequences of higher BMI; to adjust for this bias, the partial effects are multiplied by two.
Assuming these HRQL increments persist for the remainder of the woman’s life (estimated as 50 years) and using midpoint values of BMI within BMI class (assumed value = 37 for obese class II) suggests QALY losses associated with a BMI increment of 5.7 equal 0.9 and 2.0 for overweight and obese women, respectively (the value for obese women is an average of the values for obese class I and obese class II, 1.7 and 2.3, respectively).
Summing the estimates for morbidity and mortality implies that each case of PPWR is associated with expected values of 3.1 and 4.2 QALYs lost for overweight and obese women, respectively.
Childhood Obesity
Prevalence
The relative risk of childhood obesity was estimated by committee member Matt Gillman as 1.2 per 5 kg increment in GWG for all maternal BMI groups. This result is based primarily on the Oken et al. (2008) GUTS analysis, supported by results from Wrotniak (2008) and Monteiro (2007). This estimate is for childhood obesity defined as BMI above the 95th percentile compared with below the 85th percentile for age, observed at ages 9 to 14 years. Prevalence of childhood obesity by maternal pregravid BMI category for the Oken et al. (2008) analysis is 1.9, 5.2, 12.7, and 24.6 percent for underweight, normal, overweight, and obese, respectively. The probability of childhood obesity by GWG conditional on BMI was calculated using the estimated relative risk, the prevalence by BMI category, and information on the joint distribution of GWG and BMI from Chen (supplemental material Table G-48B assuming a common ratio of deaths to controls across BMI/GWG classes). (Note that the resulting population prevalence of 7.3 percent exceeds Oken’s reported population prevalence of 6.5 percent.) Third order polynomials were fit to these estimates (reported in Table G-50).
QALYs lost
Mortality Engeland et al. (2003) analyzed Norwegian data on mortality as a function of adolescent obesity (at ages 14 to 19 years). With average follow-up exceeding 30 years, they estimate that adult mortality rates from about age 30 onward are 80 percent larger for males and 100 percent larger for females whose adolescent BMI exceeded the 95th percentile of a U.S. reference population compared with those whose adolescent BMI was less than the 85th percentile. Adjusting a current U.S. life table to increase age-specific mortality rates by 90 percent for all ages from 30 onward suggests
TABLE G-50 Childhood Obesity
|
BMI |
GWG Rate (kg/wk) |
GWG (kg in 40 wk) |
Prevalence (%) |
|
Underweight |
< 0.15 |
< 6 |
1.46 |
|
(< 18.5) |
0.15-0.29 |
6-12 |
1.52 |
|
|
0.30-0.45 |
12-18 |
1.89 |
|
|
≥ 0.45 |
≥ 18 |
2.34 |
|
Normal |
< 0.15 |
< 6 |
4.06 |
|
(18.5-24.9) |
0.15-0.29 |
6-12 |
4.23 |
|
|
0.30-0.45 |
12-18 |
5.21 |
|
|
≥ 0.45 |
≥ 18 |
6.40 |
|
Overweight |
< 0.15 |
< 6 |
10.4 |
|
(25-29.9) |
0.15-0.29 |
6-12 |
10.8 |
|
|
0.30-0.45 |
12-18 |
13.2 |
|
|
≥ 0.45 |
≥ 18 |
15.9 |
|
Obese |
< 0.15 |
< 6 |
22.3 |
|
(≥ 30) |
0.15-0.29 |
6-12 |
23.0 |
|
|
0.30-0.45 |
12-18 |
27.1 |
|
|
≥ 0.45 |
≥ 18 |
31.7 |
about 7 years of life lost (i.e., life expectancy at birth falls from about 77 to 70 years). Hence childhood obesity is estimated to lead to 7 QALYs lost to mortality (implicitly assuming that BMI above the 95th percentile at ages 9 to 14 years persists to ages 14 to 19 years).
Morbidity QALYs lost to morbidity are estimated using the results for morbidity associated with PPWR above. Childhood obesity defined as BMI above the 95th percentile is assumed to persist as adult obesity (BMI ≥ 30) and to persist for 70 years. Adjusting the estimated value of 2.0 QALYs lost for morbidity associated with PPWR among obese women for the difference in duration (i.e., multiplying by 70/50) yields 2.8 QALYs.
Summing the estimates of mortality and morbidity effects yields an expected value of 9.8 QALYs lost per case of childhood obesity.
Results
The expected QALYs lost due to infant mortality and the mortality and morbidity consequences of post-partum weight retention and childhood obesity for each maternal BMI category and value of GWG are estimated by multiplying the estimated prevalence of each endpoint by the associated expected value of QALYs lost. Results are summarized in Figure G-57 us-
![FIGURE G-57 Total expected quality-adjusted life-years (QALYs) lost (Chen et al. [2008] mortality estimates).](/openbook/12584/xhtml/images/p20019b26g840001.jpg)
FIGURE G-57 Total expected quality-adjusted life-years (QALYs) lost (Chen et al. [2008] mortality estimates).
ing the Chen et al. (2008) estimates of infant mortality and in Figure G-58 using the Herring estimates.
The conclusions are similar using both sets of infant mortality estimates. For overweight and obese women, the estimated total mortality and morbidity consequences for mother and child of the endpoints included in this analysis are minimized for GWG less than about 10 to 15 kg. For normal and underweight women, estimated mortality and morbidity consequences are minimized for GWG greater than about 10 to 15 kg. Within these ranges, estimated total QALY losses are not very sensitive to GWG. In Figure G-58, the prominent departure from a trend for obese women at high GWG, and the less prominent departure from a trend for underweight women at low GWG reflect the surprisingly low estimates of infant mortality prevalence for these categories shown in Table G-48B. As noted above, these departures from the trend toward increasing infant mortality with very low or very high GWG may reflect limited data for these categories or modeling artifacts. Similarly, the trend toward negative QALY losses for high GWG among underweight women shown in Figure G-57 is also likely to reflect limited data and possible model artifacts associated with extrapolation beyond the range of observations.
The vertical scale suggests that the expected loss of quality-adjusted
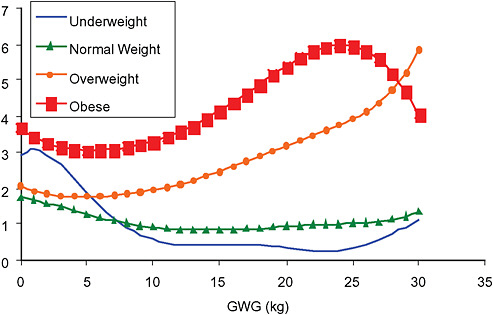
FIGURE G-58 Total expected quality-adjusted life-years (QALYs) lost (Herring infant mortality estimates).
life-years per live birth varies from near zero for normal weight and under-weight women who experience adequate gestational weight gain to five or more for overweight and obese women who experience substantial gestational weight gain. These values suggest the scale of the public health problem associated with overweight women and excessive gestational weight gain—the average loss may be on the order of 5 to 10 percent of the total lifetime QALYs experienced per birth.
REFERENCES
Alexander G. R., J. H. Himes, R. B. Kaufman, J. Mor and M. Kogan. 1996. A United States national reference for fetal growth. Obstetrics and Gynecology 87(2): 163-168.
Chen A., S. A. Feresu, C. Fernandez and W. J. Rogan. 2009. Maternal obesity and the risk of infant death in the United States. Epidemiology 20(1): 74-81.
Engeland A., T. Bjorge, A. J. Sogaard and A. Tverdal. 2003. Body mass index in adolescence in relation to total mortality: 32-year follow-up of 227,000 Norwegian boys and girls. American Journal of Epidemiology 157(6): 517-523.
Gregory M., H. Ulmer, K. P. Pfeiffer, S. Lang and A. M. Strasak. 2008. A set of SAS macros for calculating and displaying adjusted odds ratios (with confidence intervals) for continuous covariates in logistic B-spline regression models. Computer Methods and Programs in Biomedicine 92(1): 109-114.
Hu, F, ed. 2008. Obesity Epidemiology. Cary, NC: Oxford.
IOM (Institute of Medicine). 1990. Nutrition During Pregnancy. Washington, DC: National Academy Press.
IOM. 2006. Valuing Health for Regulatory Cost-Effectiveness Analysis. Washington, DC: The National Academies Press.
Jia H. and E. I. Lubetkin. 2005. The impact of obesity on health-related quality-of-life in the general adult US population. Journal of Public Health (Oxford, England) 27(2): 156-164.
Marsal K., P. H. Persson, T. Larsen, H. Lilja, A. Selbing and B. Sultan. 1996. Intrauterine growth curves based on ultrasonically estimated foetal weights. Acta Paediatrica85(7): 843-848.
Nohr E. A., M. Frydenberg, T. B. Henriksen and J. Olsen. 2006. Does low participation in cohort studies induce bias? Epidemiology 17(4): 413-418.
Nohr E. A., M. Vaeth, J. L. Baker, T. Sorensen, J. Olsen and K. M. Rasmussen. 2008. Combined associations of prepregnancy body mass index and gestational weight gain with the outcome of pregnancy. American Journal of Clinical Nutrition 87(6): 1750-1759.
Nohr E. A., M. Vaeth, J. L. Baker, T. I. Sorensen, J. Olsen and K. M. Rasmussen. 2009. Pregnancy outcomes related to gestational weight gain in women defined by their body mass index, parity, height, and smoking status. American Journal of Clinical Nutrition 90(5): 1288-1294.
Oken E., E. M. Taveras, K. P. Kleinman, J. W. Rich-Edwards and M. W. Gillman. 2007. Gestational weight gain and child adiposity at age 3 years. American Journal of Obstetrics and Gynecology 196(4): 322 e321-e328.
Oken E., S. L. Rifas-Shiman, A. E. Field, A. L. Frazier and M. W. Gillman. 2008. Maternal gestational weight gain and offspring weight in adolescence. Obstetrics and Gynecology 112(5): 999-1006.
Olsen J., M. Melbye, S. F. Olsen, T. I. Sorensen, P. Aaby, A. M. Andersen, D. Taxbol, K. D. Hansen, M. Juhl, T. B. Schow, H. T. Sorensen, J. Andresen, E. L. Mortensen, A. W. Olesen and C. Sondergaard. 2001. The Danish National Birth Cohort—its background, structure and aim. Scand J Public Health 29(4): 300-307.
Peeters A., J. J. Barendregt, F. Willekens, J. P. Mackenbach, A. Al Mamun and L. Bonneux. 2003. Obesity in adulthood and its consequences for life expectancy: a life-table analysis. Annals of Internal Medicine 138(1): 24-32.
WHO (World Health Organization). 2000. Obesity: preventing and managing the global epidemic. Report of a WHO consultation. World Health Organization Technical Report Series 894: i-xii, 1-253.
Wrotniak B. H., J. Shults, S. Butts and N. Stettler. 2008. Gestational weight gain and risk of overweight in the offspring at age 7 y in a multicenter, multiethnic cohort study. American Journal of Clinical Nutrition 87(6): 1818-1824.
Zhang J. and W. A. Bowes, Jr.1995. Birth-weight-for-gestational-age patterns by race, sex, and parity in the United States population. Obstetrics and Gynecology 86(2): 200-208.
Website:


