
Appendix K
Use of the School Meals Menu Analysis Program
This appendix includes a description of the School Meals Menu Analysis Program, developed by Iowa State University, including a schematic illustrating the general mapping of files in the database.
SCHOOL MEALS MENU ANALYSIS PROGRAM
School Meals Menu Analysis program is a software application that was designed by Iowa State University to estimate the nutrient content and the cost of the foods in school meals, as offered and/or as selected, exclusively for this study.
Data Files
The nutrient composition data file is comprised of the nutrient data file used in the third School Nutrition Dietary Assessment study (SNDA-III) (USDA/FNS, 2007a), supplemented with data from the U.S. Department of Agriculture (USDA) Food and Nutrient Database for Dietary Studies, version 3.0 (USDA/ARS, 2009b). The SNDA-III Menu Survey data file contains information on the type of meal, number of meals served, food names and descriptions, portion sizes, and the number of reimbursable portions sold. Food and nutrient values were imported to that data file from the USDA Food and Nutrient Database for Dietary Studies, version 3.0 (USDA/ARS, 2009b).
The cost data file is comprised of the data file from the USDA School Lunch and Breakfast Cost Study-II (USDA/FNS, 2008g), which was supple-
mented as needed with imputed values using similar food items and, if necessary, values from current records of actual food service units. The data file was created as a Microsoft Access Database which allows the user the ability to query and create reports.
Program Functions and Reports
The menus for a school meal can be entered, deleted, and edited in the database. Similarly, items in the food list for the nutrient composition data can created, deleted, and edited.
Any particular Menu Plan has a Plan ID number. Within this Menu Plan, there can be individual meal menus, breakfast or lunch, for each weekday. Each of these meal menus has its own Menu ID number, one through five for Monday through Friday, respectively, and labeled breakfast or lunch. A meal menu has a number of food items, each with its own Item number. The food items in a menu are matched with comparable food items in the nutrient composition database and to data on the food items including price. Figure K-1 provides an overview of the program mapping and structure.
One can generate a report from a single menu or for all menus and copy and paste the report into a spreadsheet or other program that handles tabular data. Staff used this output to prepare tables that describe the nutrient values of various types of menus and that compare the costs of baseline representative menus with those of modified baseline menus.
The report on a single menu prints the menu, ordered by day, one line per food item. Each line includes pertinent descriptions, mass of the item, mass of one serving, price, and energy information. The next section of the report has a nutritional summary. Both of these sections use concepts of “offer weight” and “percent take-up.”
In the menu report, the user can view and update a food item through a dialog box. Figure K-2 shows an image of the dialog box for query and updating information on a single food item in a menu.
As shown in the dialog box (Figure K-2), food items in the menu are described in terms of the food item code, verbal description, price per 100 g and a “quantity” measure. In addition, the dialog box shows the defined measures per serving, nutrient information, number of items, offer weight, and percent take up. “Offer weight” is entered on the food item dialog following rules set by the USDA for this purpose (USDA/FNS, 2007a). The built-in assumption is that a total of 300 meals will be served. Three examples illustrate the method:
-
If three items are offered and the student may take one, the value assigned to each choice is 100.
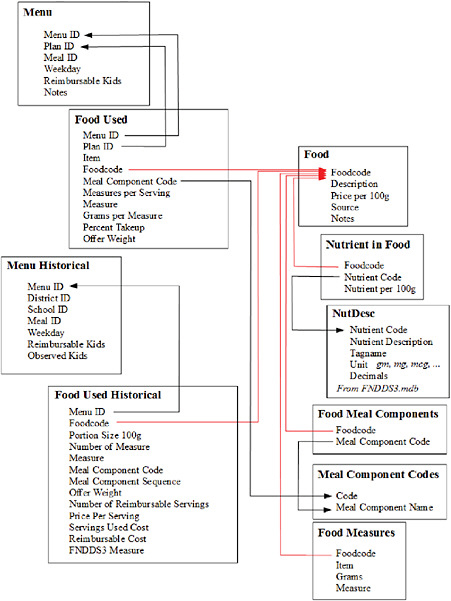
FIGURE K-1 Schematic illustrating the general mapping of files in the School Meals Menu Analysis Program developed by Iowa State University.
-
If two items are offered and the student may take one, the value assigned to each choice is 150.
-
If two items are offered and the student may take both, the value assigned to each item is 300.
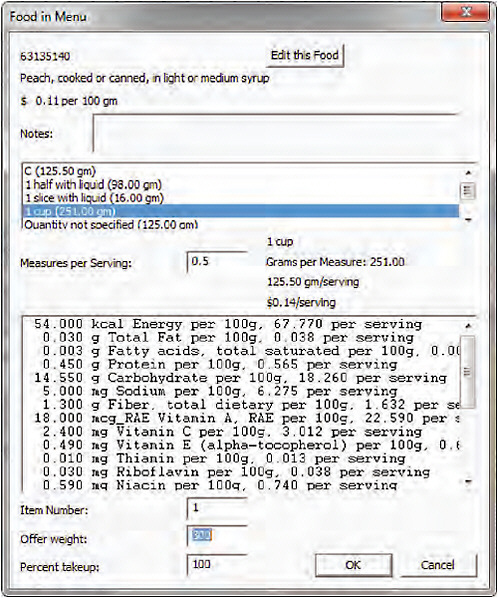
FIGURE K-2 Screen of the menu item dialog box in the School Meals Menu Analysis Program developed by Iowa State University.
“Percent Take-up” is entered on the food item dialog. The reports assume that this percentage of the students who select this item for their meal. For the purposes of this study, “percent take-up” for modified baseline menus is entered on the food item dialog following rules established by the committee. Percent take-up assumes that the school is following the meal
standards that apply under the offer versus serve provision of the law since that is by far the most common practice (see Chapter 5). Data from SNDA-III (USDA/FNS, 2007a) provided the foundation for these rules, and they were modified somewhat based on the new recommendations for the Meal Requirements and practitioners’ experience. Appendix Tables L-1 through L-7 present the rules used to assign percent take-up. The use of the percent take-up allows estimation of nutrient or cost values for meals as selected.
Based on this information, the user can output a single menu nutritional report. This report generates a table with two sections: a list of menu items and a nutritional summary. In the list of menu items (Figure K-3), the “By Offer Weight” column is the energy per serving times the offer weight. In the nutritional summary (Figure K-4), “Weighted by Offer Weight” columns give the energy value for each day as the sum of the “By Offer Weight” values for that day, divided by 300. These are the nutritional values for the meals as offered. In the “Weighted by Percent Take-up” columns of the nutritional summary, there is a column for each day. The value for energy for a day is the sum of the energy values for each item times its percent take-up. At the end is an average column, which is the average of these values over one week.
The last three columns of the table of menu items give the “Energy per Serving,” “Energy by Percent Take-up,” and “Energy by Offer Weight.” The “Energy per Serving” is just that, and the “Energy by Percent Takeup” value is the percent take-up (correctly scaled) times the energy per serving.
The report function also allows reporting on “All Menus.” The “All Menus” function generates reports that provide the aggregate nutrient and cost for each menu by day (each of the 5 days for the week’s menu). These reports were used to evaluate the aggregate nutrients provided in a meal, the number of meal components offered, and the cost of menus (by day of the week). Cost information was available on the menu as offered and with cost weighted by the percent take-up. Again, the “All Menus” reports can be copied and pasted into a spreadsheet for subsequent analyses.
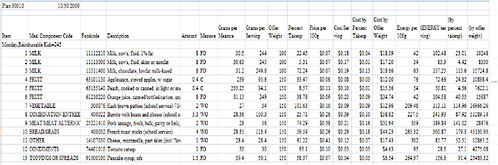
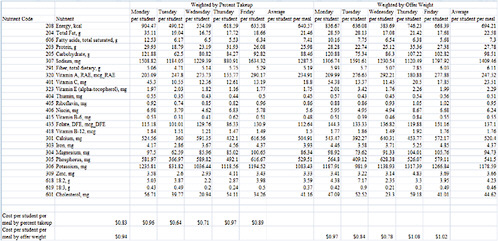
FIGURE K-4 Report generated by the School Meals Menu Analysis program showing the nutritional summary of a week of menus.
NOTES: 18:2 = linoleic acid; 18:3 = α-linolenic acid; DFE = dietary folate equivalent; g = gram; kcal = calories; mcg = microgram; mg = milligram; RAE = retinol activity equivalent.


