
A
A History of Computer Performance
Computer performance has historically been defined by how fast a computer system can execute a single-threaded program to perform useful work. Why care about computer performance? What is the work? How has computer performance improved?
Better computer performance matters in two ways. First, in what is often called capability computing, it can enable computations that were previously not practical or worthwhile. It does no good to compute tomorrow’s weather forecast in 24 hours, but 12-hour computation is valuable. Second, when performance scales up more rapidly than computer cost—as has often been the case—better cost performance allows computation to be used where it was previously not economically tenable. Neither spreadsheets on $1,000,000 mainframes nor $10,000 MP3 players make sense.
Computer performance should be evaluated on the basis of the work that matters. Computer vendors should analyze their designs with the (present and future) workloads of their (present and future) customers, and those purchasing computers should consider their own (present and future) workloads with alternative computers under consideration. Because the above is time-consuming—and therefore expensive—many people evaluate computers by using standard benchmark suites. Each vendor produces benchmark results for its computers, often after optimizing computers for the benchmarks. Each customer can then compare benchmark results and get useful information—but only if the benchmark suite is sufficiently close to the customer’s actual workloads.
Two popular benchmark suites are SPECint2000 and SPECfp2000. Both are produced by the Standard Performance Evaluation Corporation (SPEC) (http://www.spec.org/). SPECint2000 includes 12 integer codes, and SPECfp200 has 14 floating-point benchmarks. Below, we use SPEC data to examine computer-performance trends over the last 2 decades. The results are valuable, but their absolute numbers should be regarded as rough approximations of systems’ absolute performance. Nevertheless, they are much better than results based on “peak rate,” which gives a computer’s speed when it is doing nothing.
Figures A.1 (INT) and A.2 (FP) display results for SPECint2000 and SPECfp2000, respectively. The X axes give the years from 1985 or 1988 to 2007. The logarithmic Y axes give the SPEC rate normalized to circa 1985. Thus, a value of 10 means that the computer is 10 times faster than (can execute the work in one-tenth the time of) a 1985 model.
The Figures A.1 and A.2 reveal two trends. First, computer performance has improved exponentially (linearly on a semilogarithmic plot) for most years under study. In particular, until 2004 or so, both SPECint2000 and SPECfp2000 improved at a compound annual rate exceeding 50% (for example, a factor of 100 in about 10 years).
Second, the performance improvements after 2004 have been poorer.
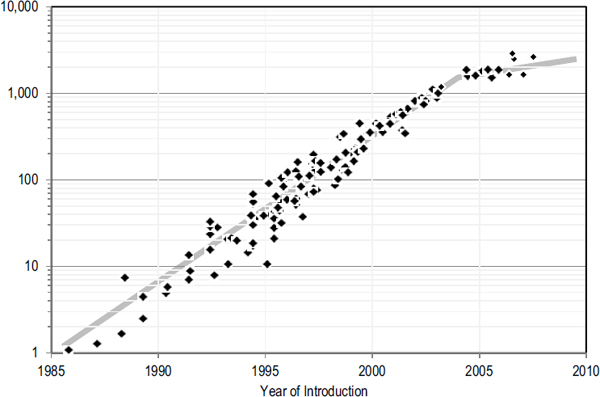
FIGURE A.1 Integer application performance (SPECint2000) over time (1985-2010).
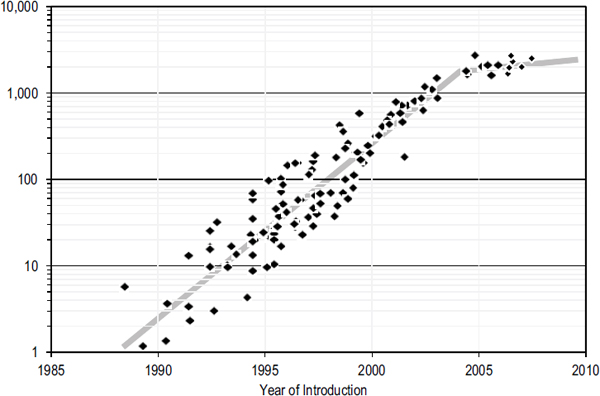
FIGURE A.2 Floating-point application performance (SPECfp2000) over time (1985-2010).
One could hope that the results are an anomaly and that computer vendors will soon return to robust annual improvements. However, public roadmaps and private conversations with vendors reveal that singlethreaded computer-performance gains have entered a new era of modest improvement.
Trends in computer-clock frequency offer another reason for pessimism. Clock frequency is the “heart rate” of a computer, and its improvement has traditionally been a major component of computer-performance improvement. Figure A.3 (FREQ) illustrates clock frequency over time in megahertz (millions of cycles per second). Clearly, clock-frequency improvements have also stalled (especially if the 4.7-GHz power 6 is more an exception than the new rule).
Moreover, the principal reason that clock-frequency improvement has slowed greatly is that higher clock frequencies demand greater power and the power used by modern microprocessors has reached a level that make increases questionable from an economic perspective and may even encourage clock-frequency reductions. Figure A.4 (POWER) plots chip power (in watts) versus. year. Like clock frequencies, power consumed by a chip increased exponentially (linearly on a semilogarithmic plot) for years, but it has recently reached a plateau.
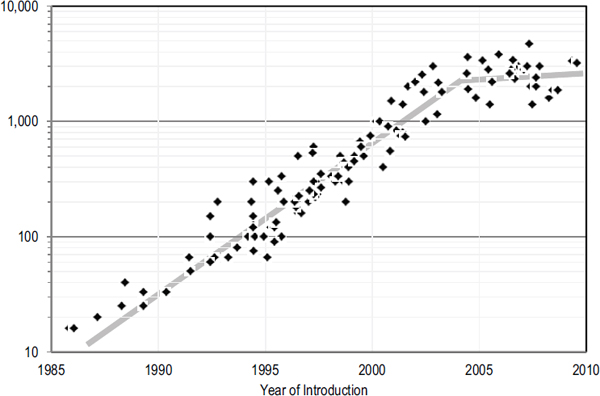
FIGURE A.3 Microprocessor clock frequency (MHz) over time (1985-2010).
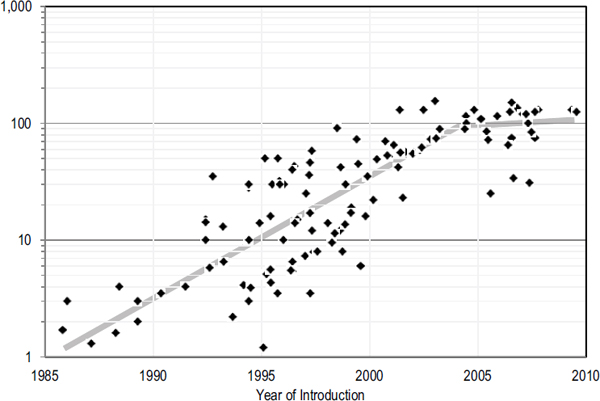
FIGURE A.4 Microprocessor power dissipation (watts) over time (1985-2010).
To put those trends into context, we should look further back in history. Kurzweil and others argue that the performance improvements during the recent microprocessor or Moore’s law era follow a longer historical trend.1 In particular, in Kurzweil’s estimates of 20th-century computer-performance improvements, he finds that over the whole century, computer performance improved exponentially and that exponential improvement was, if anything, accelerating. Although his exact numbers are open to debate, it is clear that computer performance grew exponentially over the entirety of the 20th century.
What will the rest of the 21st century bring? Optimists predict that Kurzweil’s trend will continue. Pessimists worry that single-threaded architectures and complementary metal oxide semiconductor technology are reaching their limits, that multithreaded programming has not been broadly successful, and that alternative technologies are still insufficient. Our job, as encouraged in the rest of this report, is to prove the optimists correct.
______________
1The Law of Accelerating Returns, by Ray Kurzweil, http://www.kurzweilai.net/articles/art0134.html?printable=1.


