
Appendix B
Life Cycle Assessment of Solar Thermal Power Technology in China
Description of the Assessment Model
This assessment model is based on a 300 MW solar tower power plant which will be built in Hami, Xinjiang Autonomic Region. The geographic reference of this assessment is Hami in China, and the data time reference is 2008. The functional unit used is 1 kWh produced at the power plant, and it is supposed that the exhaust pressure of the solar tower power plant is 0.06 bar. The characteristics of the 300MW solar tower power plant analyzed by Wang and Zhang (2008) are summarized below. Details can be seen in Table B-1.
Impacts Assessment Model and System Boundaries
The life cycle assessment (LCA) of the 300 MW solar tower power plant was performed using the software tool AGP (Assessment for Green-Product) developed by the Research Center for Eco-Environmental Sciences, Chinese Academy of Science (CAS), based on Chinese product and environmental data. LCA is conducted using APG modules for control interface, input of data listing, output of data listing, and environmental impact assessments. Five processes are divided and modeled in the life cycle of solar tower power plants:
-
The raw materials extraction and manufacturing of components of the power plant. This process includes the energy demand and emission of the facility materials in exploitation and manufacture.
-
The transport phase includes the transportation of raw materials, facilities, and construction materials.
-
The construction activities cover workshop, tower, and pipeline.
TABLE B-1 Characteristics of the Studied Solar Thermal Power
|
Technology type |
Solar central tower power |
|
Installed capacity |
300 MW |
|
Direct normal irradiation |
1,875 KW h/m2 yr |
|
Number of heliostats |
25,020 |
|
Aperture |
2,502,000 m2 |
|
Technical lifetime |
25 years |
|
Energy generated per year |
657 GWh |
|
Energy generated in the lifetime |
16,425 GWh |
|
Electricity consumption by self-produced electricity |
1,150 GWh |
|
Net efficiency |
14.06% |
-
In the operation stage the solar thermal power systems transform solar energy to electricity, and no other fossil energy is required except that a small amount of fossil fuel is required in the startup of the electricity generating set. Thereafter, electricity needs are met by the on-site solar generation. The energy demand and emissions can be neglected because so little fossil fuel is used.
-
The impacts of decommissioning of the power plant and the disposal of all the waste materials could not be quantified here due to the lack of reliable data, and so the energy and emissions produced in the disposal of all the waste materials of the power plant could not be accounted for in this study.
Processes modeled in the life cycle of the solar thermal power plants are depicted in Figure B-1.
Assessment Methods
The life cycle of the solar thermal power plant is completed using the following three environmental load profiles. First, the energy balance factor (EBF) is the ratio of energy output to input, which is used to confirm whether the system is feasible as an energy production system. Second, the energy payback time (EPT) is the index that accounts, by energy production, for the number of years required to recover the total energy input into the system over an entire life cycle. The third is the CO2 emission factor (CEF), which is the CO2 emission per unit of electricity generated. The CEF of the solar thermal power generation plant analyzed in this study are compared with that of a coal-fired power generation plant, which is reported to have the highest environmental impact among various power generation technologies.
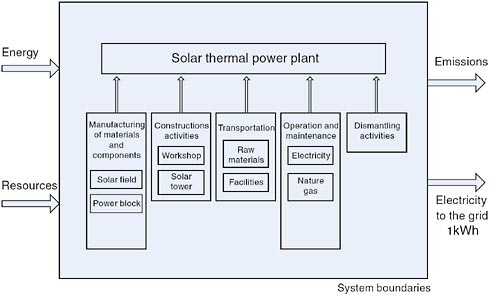
FIGURE B-1 Life cycle of a solar thermal power plant.
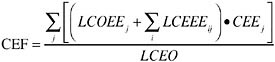
After defining the goal and scope, an inventory analysis was carried out based on the collected and processed data. The parameter that has the most impact on the life cycle inventory (LCI) results in this study, i.e., EBF, EPT, and CEF, was evaluated so that problems and improvements of the system could be revealed. The basic theoretical equations for the three environmental load profiles defined in this study (EBF, EPT, CEF, global warming protocol [GWP] and acidification potential [AP]) are expressed as:
(B-1)
(B-2)
(B-3)
where LCEO is the energy output from an energy conversion plant over its entire life cycle; LCEEi and LCOE are the “equipment” and “operation” energies over the life cycle of each process of the system, respectively (i represents each process, i.e., manufacturing material and equipment, transportation, and construction); AEO is the annual energy output; AOE is the annual operation energy of plant;
LCEEEij and LCOEEj are the equipment and operation energies of each kind of energy resources, e.g., electricity, coal, and oil, over the life cycle of each process, respectively (j represents each kind of energy resources); and CEEj is the CO2 emission per unit energy of each energy resource.
In this study, the energy input consists of the equipment and operation energies. Consequently, the denominator of the right side of Eq. B-1 represents the energy input into the system over its entire life cycle. Equipment energy is defined as the energy necessary for manufacturing equipment, which constitutes a system, i.e., heliostats and power block in this study, and is composed of the “material,” “production,” “transportation,” and “construction” energies. Material energy is the energy necessary for refining raw materials, e.g., steel, glass, and concrete. Production energy is the energy necessary for producing the parts of equipment, e.g., heliostats and a plant generator. Transportation energy is the energy necessary for transporting the equipments and construction material. Construction energy is the energy necessary for constructing equipment workshop.
With regard to the calculation of the energy input, a process analysis, in which the object is divided into several processes and the energies required for each process are integrated, is adopted in this study. The following equation is used to calculate the equipment energy over the entire life cycle of the system:
(B-4)
Where MEi, PEi, TEi, and CEi are the material, production, transportation, and construction energies of each process, respectively.
On the other hand, operation energy is defined as the energy necessary for operating a system and is composed of the fuel consumption of warming turbines in startup and the electricity consumed in operating equipments. The operation energy over the entire life cycle of the system is calculated on the basis of the following equation:
(B-5)
where FCfuel is the fuel consumption for warming turbines in startup of electricity generation sets, and FCelectricity is electricity demanded in operation, which is provided by self-produced electricity.
Global warming potential (GWP) and acid potential (AP) analysis were performed to identify the environmental impact characteristics of solar thermal power plant. Based on the environmental impact characteristics of solar thermal power plant, global warming emissions such as CO2, NOx, CO, and acidification emissions such as SO2, and NOx in the life cycle of the power plant are quantified and analyzed. The Equivalency Factor Approach is adopted for the GWP analysis in this report. Output data of listing are classified according to GWP and AP assessment, and all kinds of values of emissions are multiplied by the Equivalency
Factor. Finally, the sum of the equivalent values is achieved as the total impact potential. In this calculation, Equivalency Factors are adopted from research results of the IPCC (Yang et al., 2002).
Data Listing
Data needed to perform the LCA were provided by firms investing in solar thermal power plant and related technology research departments in China, complemented with data obtained from the most up-to-date databases in the National Bureau of Statistics of China or from existing academic literature.
At the time of performing this LCA, some data related to the weight of materials of some parts of the power plants could not be obtained, because the studied 300 MW solar tower power plant has not been built. Consequently, some assumptions were made by referring to similar materials used in coal-fired power plants of the same capacity.
Many material categories are involved in the life time of solar thermal power plants, and the material whose weight is 5 percent less than the total material can be neglected. Total material weights for the life time of the 300 MW solar tower power plant are depicted in Table B-2. Life cycle inventory (LCI) of 300 MW solar thermal power plant: (I) energy balance is depicted in Table B-3.
On all accounts by the software tool AGP, primary inputs and outputs in LCA of 300 MW solar thermal power plant are depicted in Table B-4.
RESULTS AND DISCUSSION
Energy Balance
From Tables B-1, B-3, and B-4, the equipment and operation energies are calculated using Eqs. B-1, B-2, B-4, and B-5, respectively, clarifying the energy
TABLE B-2 Total Material Weights of the Life Time of 300 MW Solar Tower Power Plant (t)
|
Technology |
Steel |
Glass |
Concrete |
Diesel |
Gasoline |
|
Solar tower power plant |
203,815 |
37,530 |
42,067 |
262 |
1,127 |
TABLE B-3 Life Cycle Inventory (LCI) of Solar Thermal Power Plant: (I) energy balance (tce)
|
Stages |
Materials extraction and production of equipment |
Transport |
Building construction |
Operation |
Total |
|
Energy input |
135,662.48 |
2,152.39 |
13,896 |
11,394 |
163,105 |
TABLE B-4 Life Cycle Inventory of Solar Thermal Power Plant: (II) emissions (g/kWh)
|
|
Types |
Materials extraction and production of equipment |
Transport |
Buildings construction |
Operation |
Total |
|
Input |
Steel |
11.55 |
----- |
0.86 |
---- |
12.41 |
|
|
Glass |
2.28 |
---- |
---- |
---- |
2.28 |
|
|
Concrete |
----- |
----- |
2.56 |
---- |
2.56 |
|
|
Diesel |
----- |
0.0160 |
----- |
---- |
0.0160 |
|
|
Gasoline |
----- |
0.0686 |
----- |
---- |
0.0686 |
|
Output |
CO2 |
24.93 |
0.65 |
3.78 |
2.21 |
31.6 |
|
|
SO2 |
0.0370 |
---- |
0.0032 |
0.0030 |
0.0432 |
|
|
NOX |
0.0051 |
0.0050 |
0.0036 |
0.0011 |
0.0148 |
|
|
HC |
---- |
0.00166 |
---- |
1.26*10−4 |
0.0018 |
|
|
CO |
---- |
0.0132 |
---- |
9.91*10−4 |
0.0142 |
|
|
Powder and Soot |
0.0242 |
6.29*10−4 |
0.0025 |
0.0021 |
0.0293 |
inputs and outputs in all processes of the system examined in this study. When calculations are conducted, the life cycle inventory of solar thermal power plant on the EBF is achieved as 12.38, and EPT is 1.89 years. That means the total energy input into the system that has a life time of 25 years can be recovered for a shorter period of 1.89 years with power generation. On the other hand, the EBF is 12.38, which means that 12.38 times more energy is required than for the total energy input that can be produced during the entire life cycle of the system. This result indicates that the system examined in this study is feasible as an energy production system.
Cumulative Energy Demand
The consumption of electricity required in the operation of solar thermal power systems is provided by self-produced electricity. No hybrid system has been built, and no other fossil energy is required in the operational stage except that little fossil fuel is required in the startup of the generating set. Without taking into account these energy expenses, from Tables B-1 and B-3, the fossil energy required in the power plant life cycle is calculated to be 0.29 MJ/kWh for central tower technology. Cumulative energy demand and the life cycle of solar thermal power plants are listed in Table B-5. Results from other LCAs yield 0.14–0.16 MJ/kWh for a trough-type plant (Pehnt, 2006; Viebahn, 2004). For the central tower technology, the cumulative energy demand was 0.17-0.41 MJ/kWh (Lechón et al., 2008; Wang and Zhao, 2007).
The energy input into the system can be analyzed by aggregating the equipment and operation energies of each process in Table B-5. Consequently, 92.6 percent of the total energy input is occupied by the equipment energy, and the operation energy corresponds to the remaining 7.4 percent, that means, the amount of energy required for equipment of the system is much larger than the energy required in operation, which is illustrated in Figure B-2. In order to reduce the total energy input, it is essential to first reduce the equipment energy by taking such measures as developing new techniques and improving the manufacture efficiency of raw material and production processes.
Greenhouse Gas Emissions
From Tables B-1 and B-4, the equipment and operation energies are calculated using Eqs. 3. Global warming emission CO2 produced during the life cycle of the analyzed solar thermal power plants are calculated, and its CEF value is around 31.6 g/kW h. Cumulative CO2 emissions in each process of the life cycle of solar thermal power plants are listed in Table B-6. Most of them come from the material and production stages (see Figure B-3). The Equivalency Factor Approach is adopted to make GWP analysis in LCA of 300 MW solar tower power plant. Emission sources such as CO2, CO, and NOx were studied, and the analysis result is depicted in Table B-7. Values are around 32.1 g CO2 equiv/kWh. It is similar to the values reported in the literature (see Table B-8). Values of global warming emissions reported in the literature range from 11 g CO2 equiv/kWh to 48 g CO2 equiv/kWh for the central tower type and from 12 g CO2 equiv/kWh to 80 g CO2 equiv/kWh for the parabolic troughs type, with the exception of the values reported in bracket by Lechón et al. (2008) for a hybrid operation. The emissions are higher in hybrid operation for the obvious reason of natural gas consumption.
Acidification
From Table B-4, in this study SO2 emission value is 43.2 mg/kWh. For acidification emissions such as SO2 and NOx, the Equivalency Factor Approach
TABLE B-5 Cumulative Energy Demand in the Life Cycle of Solar Thermal
|
Power Plants |
Phases Energy demand values (MJ/KWh) |
|
Solar field |
0.2394 |
|
Power block |
0.0037 |
|
Buildings construction |
0.0248 |
|
Transports |
0.0035 |
|
Operation |
0.0203 |
|
Total |
0.29 |
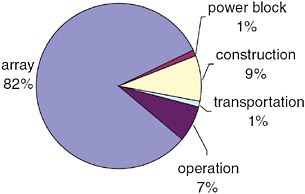
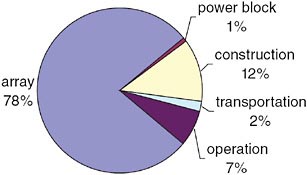
TABLE B-6 CO2 Emissions in Each Process of the Life Cycle of the Solar Thermal Power Plants
|
Phase |
CO2 emission (g/kWh) |
|
Solar field |
24.6777 |
|
Power block |
0.2514 |
|
Buildings construction |
3.7845 |
|
Transports |
0.6475 |
|
Operation |
2.2100 |
|
Total |
31.5711 |
TABLE B-7 GWP Analysis in LCA of 300MW Solar Tower Power Plant
|
Impact types |
Item |
Mass quality (kg) |
Equivalency factor (kg.kg−1) |
Impact potential value (kg) |
Total (g CO2 equiv./kWh) |
|
GWP |
CO2 |
31.6 |
1 |
31.6 |
|
|
NOX |
0.0148 |
320 |
0.4736 |
32.1 |
|
|
CO |
0.0142 |
2 |
0.0284 |
|
TABLE B-8 Global Warming Emissions for Solar Thermal Power Plants Reported in Literatures (g CO2 equiv./kW h)
|
|
Central tower |
Parabolic trough |
|
Lechón et al. (2008) |
17 (186) |
24 (161) |
|
Vant-Hull (1991) |
11 |
|
|
Norton et al. (1998) |
21–48 |
30–80 |
|
Viehban (2004) |
|
12 |
is adopted to make AP analysis in LCA of 300 MW solar tower power plant. The analysis result is depicted in Table B-9. Acidification value is 53.6 mg SO2 equiv/kWh. Values reported in the literature are higher than the values obtained in this study. Acidification values reported are 69.28 mg SO2 equiv/kWh (Pehnt, 2005) for a parabolic trough plant and 621 mg SO2 equiv/kWh (Lechón et al., 2008) for hybrid operation in solar tower power plant. The emissions are higher in the hybrid operation for the obvious reason of natural gas consumption. In China, strict policy to control the discharge of sulfur oxides has been established in recent years. In response to this policy the enterprises utilize technologies to reduce the SO2 and NOx discharge; as a result the acidification emission is greatly reduced.
Comparison with Coal-Fired Plants
In China, the environmental factors for a coal-fired generation system include coal demand value 320 g ce/kWh, warming emission discharge (CO2) value 738 g/kWh, and NOx value 3.25 g/kWh, acidification emission (SO2) value 9.38 g/kWh, and other emissions such as powder and soot discharge value 0.283 g/kWh from 1 kWh functional unit of 300 MW generation (Huang, 2006). Comparison of coal-fired plants and the solar thermal power plant in energy demand and emissions is depicted in Table B-10.
TABLE B-9 AP Analysis in LCA of 300 MW Solar Thermal Power Plants
|
Impact types |
Item |
Mass quality (g) |
Equivalency factor (kg.kg−1) |
Impact potential value (kg) |
Total (g SO2 equiv./kWh) |
|
AP |
SO2 |
0.0432 |
1 |
0.0432 |
0.0536 |
|
|
NOX |
0.0148 |
0.70 |
0.0136 |
TABLE B-10 Comparison of a Coal-Fired Power Plant and Solar Thermal Power Plant in Terms of Energy Demand and Emissions
|
technology |
Energy demand MJ(kWh) |
Powder and soot (g/kWh) |
CO2 (g/kWh) |
SO2 (g/kWh) |
NOX (g/kWh) |
|
Coal-fired |
> 9.37 |
0.283 |
738 |
9.38 |
3.25 |
|
Solar thermal power |
0.29 |
0.0293 |
31.6 |
0.432 |
0.0148 |
Conclusions
From the LCA performed for the 300 MW solar tower power plant, some important conclusions can be drawn:
-
First, this technology shows an environmental profile much better than the current mix of technologies used to produce electricity in China.
-
The cumulative energy demand of the life cycle of solar thermal power plant is much lower than the energy produced.
-
CO2 value of global warming emissions is around 31.6 g/kWh, which is much lower than the value of 738 g/kWh for competing fossil technologies.
-
Other impacts calculated are much lower than those produced by the current Chinese electricity generation system, and most of them are produced in the operation of the fossil-fired plant due to the consumption of natural gas or coal.


