
4
Intensity and Damage Distribution
A. F. Espinosa, U.S. Geological Survey, Denver, Colorado
J. Egred, Escuela Politécnica Nacional, Quito, Ecuador
M. García-Lopez, Universidad Nacional de Colombia, Bogotá
E. Crespo, Cornell University, Ithaca, New York
INTRODUCTION
The earthquake of March 5, 1987, was felt at 22:10 local time over an area of at least 93,000 km2. It originated in the province of Napo in the mountainous region of NE Ecuador; the epicenter was located about 75 km NE of Quito. There were some slight indications of surface faulting; however, the weather and rough terrain precluded a positive field identification of surface-faulting effects. The sense of motion determined from seismic instruments is strike-slip, with a thrust component having an almost N-S strike. A similar source-mechanism solution was obtained from a foreshock and from two aftershocks several months later. The Trans-Ecuadorian pipeline, the nerve center of the Ecuadorian economy, sustained a high degree of damage.
The main event was preceded by a foreshock on March 5, 1987, at 19:54 local time. It had a shallow depth of focus, a body-wave magnitude (mb) of 6.1, and a surface-wave magnitude (Ms) of 6.1 (Figure 4.1). The main damaging Ecuador earthquake occurred about 20 km W of the foreshock epicenter. It had a body-wave magnitude (mb) of 6.1 and a surface-wave magnitude (Ms) of 6.9. The maximum Modified Mercalli Intensity (Io) was IX in the immediate meizoseismal region.
This paper is a preliminary report on the earthquake-damaged area that was studied immediately after the main event took place. The objective was to obtain information, where accessible, in and around the epicentral location, covering a radius of approximately 80 km, in order to delineate the distribution of intensities, damage to adobe-type construction, strong motions, geologic hazards triggered by the earthquake strain-energy release, and related phenomena.
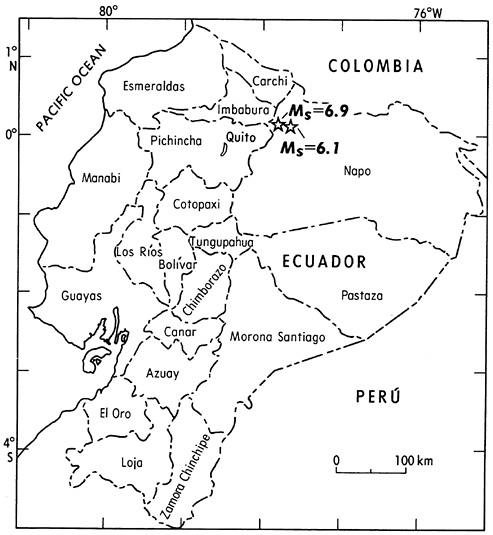
FIGURE 4.1 Epicentral locations of the March 5, 1987, earthquake (Ms=6.9) and of the aftershock (Ms=6.1) that occurred 3 hr after the main earthquake. Also shown are the departmental divisions (states) of Ecuador.
RELATIONSHIP OF BUILDING DAMAGE TO CONSTRUCTION PRACTICES
In order to assess the intensity distribution from data gathered in the field, it is necessary to identify the types of building construction in the areas examined.
To the E of Quito, the region best known as the región oriental (eastern region), the predominant type of building construction is wood-frame. There
is also a mixture of construction practices in this region; for example, woodframe and brick combination, also wood-frame and cinder-block mixture, and to a lesser extent, the replacement of brick by adobe. In some of the important towns, as well as in the petroleum exploration camps, the structures are of reinforced concrete, usually no more than four stories high. Most roofing in the larger towns is of corrugated zinc-plated steel; the use of terra-cotta tiles is very limited. Nearly all structures in rural areas and small hamlets are single-story stone buildings. For this eastern region of Ecuador, a preliminary count of structures that sustained damage in the towns of Baeza, Lumbaquí, El Chaco, Reventador, Lago Agrio, and Díaz de Pineda (Figure 4.2 and Figure 4.3) totaled 1,976; 818 were damaged beyond repair (as of May 13, 1987).
To the N, in Pichincha, Imbabura, and Carchi (Figure 4.1), the predominant type of house construction is known as tapial, in which the dwellings have no reinforcement on their corners, nor do they commonly possess interior walls or reinforced columns. The most common construction materials for walls are adobe and bahareque (adobe is a mixture of mud and straw; bahareque is a mixture of mud and long sticks of cane sugar or some
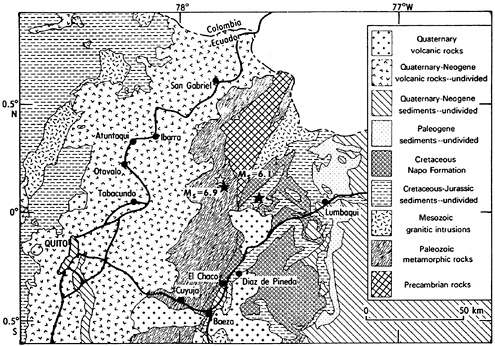
FIGURE 4.2 Map showing the major geological units for the epicentral region. Also shown are the epicenters of the main event (Ms=6.9) and of the main aftershock (Ms=6.1), and the main access highways to the E and N of Quito.
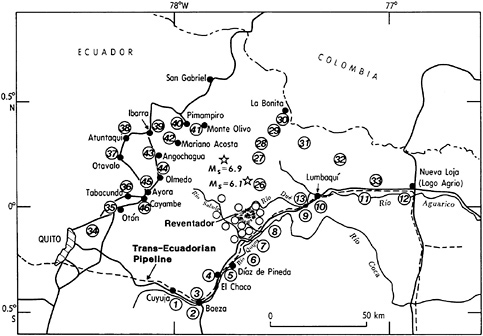
FIGURE 4.3 Intensity sampling distribution obtained in this postearthquake study around Reventador Volcano and along the main access roads to the N and E of Quito. Also shown are those areas in which an intensity evaluation was performed from helicopter reconnaissance flights. The circled numbers represent the areas where damage to dwellings and to the environment was documented using a video camcorder and 35-mm photographs.
similar material). Fewer buildings are constructed of brick and/or cinder blocks. In this part of Ecuador, known as región interandina (northern region), it is customary to cover the roof with terra-cotta tiles. The walls are quite thick; some are about 1 m wide, and in some of the old historic churches they are even thicker.
The larger towns and cities of Ecuador employ a great variety of types of construction, from adobe to reinforced-concrete buildings several stories high. The ages of the structures also vary greatly.
As of May 13, 1987, the number of dwellings that sustained damage in the region interandina totaled 12,083; 2,308 structures were damaged beyond repair. For example, in the town of Olmedo (Figure 4.3), due W of the March 5 epicenters, 1,631 dwellings sustained damage beyond repair.
The towns of Cangahua and Ayora (Figure 4.3), just N and S of Olmedo, sustained damage to 1,300 and 323 dwellings, respectively; 570 and 302 of these dwellings were damaged beyond repair. In the towns of Tabacundo and Cayambe (Figure 4.3), which are SW of the epicentral locations, much
less damage occurred. To the NW, much higher per capita damage occurred in Ibarra, where about 814 dwellings were damaged beyond repair. Farther N, at San Gabriel (Figure 4.3), damage decreased to 220 structures that were damaged beyond repair.
The damage distribution from this earthquake yields a rather uniform picture if, and only if, we study the same kinds of structures. Similar findings were field-documented by Espinosa and others (1976b) after the February 4, 1976, Guatemala earthquake. In the Guatemala event, the mapped infrastructure damage distribution reflected the sustained damage to adobe construction, or the equivalent of a rating in the MMI scale of VII. In Guatemala, the distribution of damage to buildings of adobe construction appeared to be directly related to the intensity (MMI) distribution (Espinosa et al., 1976b). In Ecuador, in the area of heavy landsliding, many adobe and wood-frame houses sustained no damage. Numerous scattered dwellings near landslides along the main highway to the east of the affected region were not damaged.
INTENSITY DISTRIBUTION
The authors visited villages in areas of high, intermediate, and low damage, and, by using questionnaires and a video camcorder, gathered data used to assess the MMI ratings throughout the affected region (Figure 4.3 and Figure 4.4). In these figures, the circled numbers identify those areas where damage to man-made structures and to the environment were photographed and certain areas where videotapes were taken by the authors documenting the aftereffects of these damaging earthquakes.
The areas of maximum MMI are concentrated in the meizoseismal area, attaining an Io=IX (Egred, 1988; García-Lopez, 1988). In this area, however, much of the damage can be classed as intensities VII and VIII. The problem encountered in the process of evaluating the intensity is that of “inconsistencies” in the MMI and in the Medvedev-Sponhauser-Karnik (MSK) intensity scales. Large landslides, such as were abundant in the high mountainous region near and around Reventador Volcano, as well as in other unstable regions in the high Andes (Nieto et al., Chapter 5, this report), suggest an intensity greater than IX. Another factor that indicates high intensities (>IX) is surface faulting, examples of which were observed in the Cascabel location (near circled number 25, Figure 4.4), near the epicentral region. Still another factor that yields higher intensities (X), as given in the intensity scale, is “landslides considerable from river banks and steep slopes due in some cases to water-saturated soils, shifted sand and mud, water splashed over banks.” Also, “bridges destroyed” implies an intensity rating of XI, and although a bridge was indeed destroyed (but by flooding), wooden structures nearby sustained no damage at all. Similar problems in
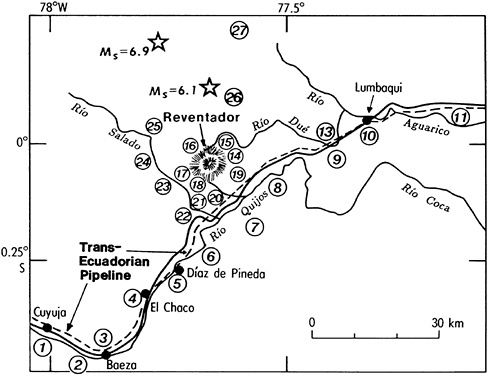
FIGURE 4.4 Intensity sampling distribution detail around Reventador Volcano and the region around the Salado River, the Quijos River, and part of the Aguarico River. Identification of circled numbers is explained in the caption of Figure 4.3.
the inconsistencies inherent in the MMI have been documented for several postearthquake studies in Caracas, Venezuela; Lima, Peru; Guatemala; and El Asnam, Algeria (Espinosa, 1969, 1976, 1981; Espinosa and Algermissen, 1972, 1973; Espinosa et al., 1976a, 1976b).
The data obtained in questionnaires and field notes gathered after the March 5 earthquakes have been rated by using the abridged version of the MMI scale (Richter, 1958) with the following exceptions: landslides are not considered in our report as indicators of intensity X; “ ground cracked conspicuously” and “underground pipes broken” are not considered as indicators of intensity IX; “shifted sand and mud, as well as water splashed over banks” are not considered as indicators of intensity X; “broad fissures in ground and bridges destroyed” are not considered as indicators of intensity XI. Espinosa and others (1976b) have proposed that these exceptions and other ground-failure effects be considered second-order effects that do not represent the intensity of an earthquake based on purely vibrational effects. A similar proposal is being implemented by the Soviet Intensity
Scale Committee in the revision of the MSK intensity scale (L. Shebalin, 1986, personal communication; D. Mayer Rosa, 1988, personal communication). Other secondary effects, such as liquefaction, ground compaction, subsidence, surface breakage, massive landslides, rock slides, debris flows, and “damming” of rivers, were observed in the field in the vicinity of Reventador Volcano and the tributary rivers in the region. According to the MSK intensity scale, the ratings, if followed verbatim, would suggest much higher intensities than those observed and assigned in the field and based on the vibrational effects produced by the earthquake.
Figure 4.4 shows the location of Reventador Volcano and the areas mentioned above that sustained high damage to the environment. The number of landslides in this area around and on the volcano was very high, and several large landslides that most likely were caused by water-saturated soils occurred E of the epicentral region; however, very few occurred to the N.
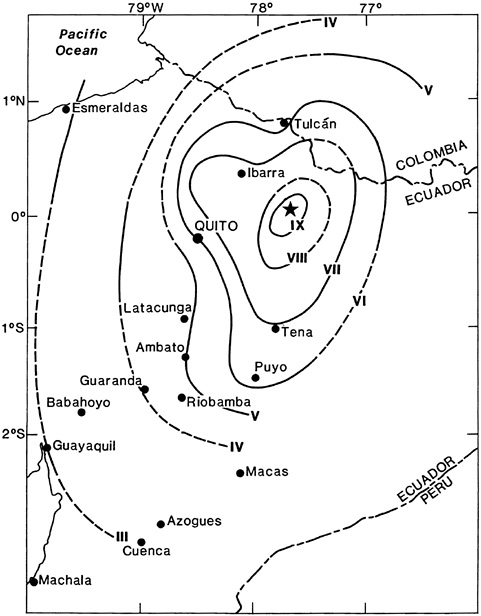
The isoseismal in Figure 4.5 shows a preliminary distribution of the main earthquake in Ecuador in March 1987. The isoseismals for intensities VIII, VII, and VI follow the general trend of a system of faults trending N-S. The intensities attenuate over a shorter distance more rapidly to the SW, and more slowly to the S and to the NNW. The isoseismal map was plotted on a 1:1,000,000 scale geologic map of Ecuador (Baldock, 1982a,b), and no simple correlation was found between gross surficial geology and intensity distribution.
The focal-mechanism solution obtained by Espinosa et al. (Figure 3.5 and Figure 3.6) for the main event has a strike for fault planes A and B of 261 and 6°, respectively. The isoseismals VII and VI exhibit a lobe to the NW that could indicate an effect due to a moving source in the near field. There is not enough intensity-data resolution in that region, because of the inaccessibility at the time of the earthquake, to ascertain or to infer the direction of the maximum released energy at those azimuths. The shaking intensity for MMI=VII has a certain directivity component suggesting a unilateral rupture from E to W. As pointed out earlier, the town of Olmedo (Figure 4.3) sustained higher damage to its infrastructure than municipalities N or S of Olmedo.
Other factors that may enter into the intensity distribution pattern shown in Figure 4.5 are seismic amplification effects, topographic seismic wave amplification, influence of surficial soil conditions, and depth of the water table. Moreover, construction practices in this part of the country are highly mixed, and in the mountainous area the population settlements are small and scattered.
REFERENCES
Baldock, J. N. 1982a . Geology of Ecuador—Explanatory Bulletin of the National Geological Map of the Republic of Ecuador . Ministerio de Recursos Naturales y Energéticos, Dirección General de Geología y Minas, Quito, 54 plus references .
Baldock, J. N. 1982b . Geological Map of Ecuador . Ministerio de Recursos Naturales y Energéticos, Dirección General de Geología y Minas, Quito, scale 1:1,000,000.
Egred, J. 1988 . Terremoto de la Provincia del Napo, Marzo 5, 1987 . Instituto Geofísico, Escuela Politécnica National , Quito , 56 .
Espinosa, A. F. 1969 . Ground amplification of short-period seismic waves at two sites near Bakersfield, California . Earthquake Notes 40 : 3–20 .
Espinosa, A. F. 1976 . The Guatemalan Earthquake of February 4, 1976 . U.S. Geological Survey Professional Paper 1002, 90.
Espinosa, A. F. 1981 . The Algerian earthquake of October 10, 1980—A preliminary report . Earthquake Information Bulletin 13 : 23–33 .
Espinosa, A. F. , and S. T. Algermissen . 1972 . A Study of Soil Amplification Factors in Earthquake Damage Areas, Caracas, Venezuela . Environmental Research Laboratories TR-280-ESL-31, 201.
Espinosa, A. F. , and S. T. Algermissen . 1973 . Ground amplification studies in the Caracas Valley and the northern coastal area of Venezuela . Proceedings of the Fifth World Conference on Earthquake Engineering , Rome 2 : 106 .
Espinosa, A. F. , R. Husid , S. T. Algermissen , and J. de las Casas . 1976a . The Lima earthquake of October 3, 1974, intensity distribution . Bulletin of the Seismological Society of America 67 : 1429–1440 .
Espinosa, A. F. , R. Husid , and A. Quesada . 1976b . Intensity distribution and source parameters from field observations of the February 4, 1976, Guatemalan earthquake, in The Guatemalan Earthquake of February 4, 1976, a Preliminary Report, A. F. Espinosa , ed. U.S. Geological Survey Professional Paper 1002 , 52–66 .
García-Lopez, M. . Evaluación de los problemas de inestabilidad del terreno causados pot los sísmos del 5 de Marzo de 1987. Bogotá: Universidad Nacional de Colombia, 41.
Richter, C.F. 1958 . Elementary Seismology . San Francisco: Freeman, 768 .


