
1
INTRODUCTION
The National Research Council (NRC) has a long and distinguished history of providing the federal government with information that is needed to develop effective policies for recruiting and retaining individuals in scientific and engineering (S&E) careers. In recent years, the Office of Scientific and Engineering Personnel (OSEP) has served as the focal point in NRC for providing information and advice on the health of the human resource base. Issues affecting women in science and engineering have been variously addressed over the last two decades (see Technical Appendix, which refers to earlier NRC efforts in this area). While some progress has been made in facilitating the entry of talented women into careers in these areas, much remains to be done in both recruiting and retaining women in science and engineering. It is no surprise, therefore, that to strengthen and clarify policies affecting the preparation and recruitment of women for careers in this area, the Governing Board of NRC concluded in 1988 that an ongoing effort was needed and requested OSEP to establish a committee that would have as its long-range goal the increased participation of women in the scientific and engineering work force.
The Committee on Women in Science and Engineering (CWSE) was established in 1990 and held its first meeting in March 1991. As a standing committee of NRC, CWSE includes in its growing portfolio four · sets of activities:
-
collecting and disseminating current data about the participation of
-
women in science and engineering to broad constituencies in academe, government, industry, and professional societies;
-
monitoring the progress of efforts to increase the participation of women in scientific and engineering careers;
-
conducting symposia, workshops, and other meetings of experts to explore the policy environment, to stimulate and encourage initiatives in program development for women in science and engineering, and to evaluate their effectiveness on a regular basis; and
-
proposing research and conducting special studies on issues particularly relevant to women scientists and engineers in order to develop reports that will document evidence and articulate NRC recommendations for action.
Specifically, CWSE will focus on the postsecondary segments of the education/employment pipeline—undergraduate, graduate, postdoctoral, and career segments—while keeping abreast of developments in precollege science education designed to recruit females into scientific and engineering careers.
The challenge in the 1990s will be to identify new opportunities for assuring that women will take their place beside men in building a strong science and technology base in the United States. This report outlines the role that the Committee on Women in Science and Engineering expects to take in achieving that goal.
The Global Policy Environment
Policies affecting the recruitment, education, and employment of women in science and engineering do not arise in a vacuum. Shifts in economic conditions, demographic patterns, and national research and development (R&D) goals stimulate the formulation of human resource policies and the selection of program goals (see, for example, Wildarsky, 1979; OSEP, 1991). The United States now faces a critical period in setting its technological and scientific priorities, and particular attention is being given to the expansion of the present pool of scientific and technical talent. It should come as no surprise that many policies affecting the role of women in science and engineering take as their starting point trends in the U.S. demography.
Demographic Issues
The Bureau of Labor Statistics predicts that the human-resource needs for science and engineering will increase, by 36 percent between the years 1986 and 2000, because of high-technology industrial growth and the increasing use of high-technology goods and services (see Table 1). How will we meet these increased human-resource needs? Richard C. Atkinson, chancellor of the University of California-San Diego and former director of the National Science Foundation (NSF), is emphatic about the current situation:
Persuading more students to pursue graduate education in science and engineering, maintaining the vitality of our universities, raising the level of technological literacy, and making more effective use of the results and
TABLE 1: Civilian Employment of Scientists, Engineers, and Technicians (SET), by Field, 1986 and 2000
|
Field |
Number Employed, 1986 |
Projected Percentage Increase in Employment, 2000 |
|
TOTAL, SET Fields |
4,245,600 |
36 |
|
Total Scientists* |
1,131,600 |
45 |
|
Computer Specialists |
331,000 |
76 |
|
Life |
140,000 |
21 |
|
Mathematical |
48,000 |
29 |
|
Physical |
180,000 |
13 |
|
Social |
432,600 |
36 |
|
Total Engineers |
1,371,000 |
32 |
|
Aeronautical/astronautical |
53,000 |
11 |
|
Chemical |
52,000 |
15 |
|
Civil |
199,000 |
25 |
|
Electrical/electronics |
401,000 |
48 |
|
Industrial |
117,000 |
30 |
|
Mechanical |
233,000 |
33 |
|
Other |
316,000 |
24 |
|
Total Technicians |
1,743,000 |
36 |
|
Computer Programmers |
479,000 |
70 |
|
Draftsmen |
348,000 |
2 |
|
Electrical/electronics |
313,000 |
46 |
|
Other engineering |
376,000 |
26 |
|
Physical, mathematical, and life sciences |
227,000 |
15 |
|
* Includes 97,300 environmental scientists. SOURCE: U.S. Department of Labor, Bureau of Labor Statistics, Outlook 2000 (Bulletin 2302), Washington, D.C.: U.S. Government Printing Office, 1990. |
||
insights of science in policy and decision making are not separate problems. Rather, they are related components of the fundamental question of the adequacy of our science-education system and its relevance to the country's needs (Atkinson, 1988).
After reviewing those needs, Eileen Collins concluded that
If present trends continue, there will be a shortage of trained engineers which cannot be filled by the natural increases in numbers of women and minority students obtaining degrees. Possible market adjustments include the injection of foreign talent, a policy decision to increase the numbers of women and minority students, and the recapture and retraining of those engineers no longer in the field (Collins, 1988).
Figure 1 reveals that only about 5.2 percent of high school sophomores are likely to pursue studies in the natural sciences and engineering culminating in receipt of bachelor's degrees in those disciplines. of those receiving baccalaureates in 1984, only 4.7 percent will have earned Ph.D.s in science and engineering by 1992. When these percentages are applied to the cohort of U.S. high school students for the 1986-2000 period, it becomes dear that the number of young scientists and engineers passing through the education pipeline may not be adequate to meet the demand projected in Table 1. Planning must be undertaken now to provide the Nation with the trained personnel who will ensure the development of new technologies and new knowledge.
Three demographic trends will further complicate the generic issue of providing a sufficient supply of U.S. scientists and engineers. First, the 18- to 24-year-old cohort that comprises our undergraduate population—traditionally, whites, both males and females—will continue to decline until
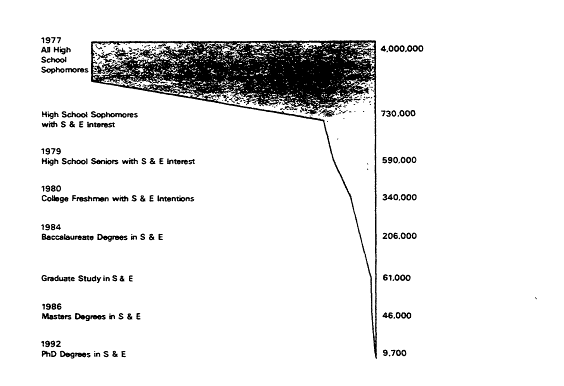
Source: Task Force on Women, Minorities, and the Handicapped in Science and Technology, Changing America: The New Face of Science and Engineering (Interim Report), Washington, D.C.: The Task Force, 1988.
Figure 1. Science and engineering (S&E) pipeline, from high school through Ph.D. degree.
1995 (Figure 2). Second, the percentage of students majoring in most fields of science and engineering has been dropping for the past few years (Table 2). and third, projections show that the increases in the U.S. population will be greatest among ethnic groups that have not heretofore participated significantly in science and engineering. All three trends add to the widespread concern about the future supply of scientists and engineers to meet national needs.
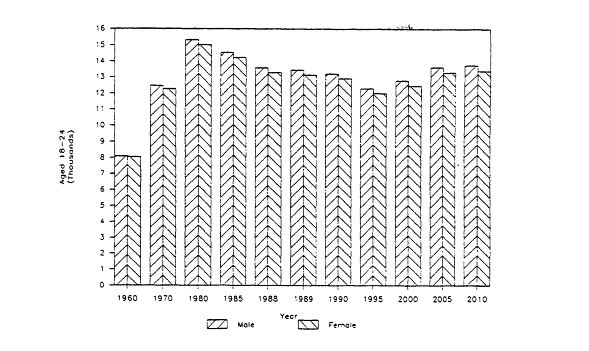
Source: U.S. Bureau of the Census, Statistical Abstract of the United States: 1990 (110th edition), Washington, D.C.: U.S. Government Printing Office, 1990.
Figure 2. U.S. population, aged 18-24, 1970-1988, and projected, 1990-2010 (in thousands).
A predicted consequence is a shortfall of faculty recruits to meet the foreseeable replacement needs due to retirements. Some estimates show that 40 percent of tenured S&E faculty will retire by 1995 and that many new faculty hires will be needed (Figure 3) (Vetter, 1989). Coupled with a decrease in the number of U.S. citizens earning doctorates in science and engineering and gaining tenure——particularly in engineering, computer science, and mathematics——these data project a disturbing picture before the start of the twenty-first century (Thurgood and Weinman, 1990).
TABLE 2: Bachelor's Degrees in Science and Engineering as Percentage of All Baccalaureates Awarded, Selected Years, 1972-1989
|
|
Science and Engineering Disciplines |
|
|
|
|
|
||
|
Year |
Comp/ Info |
Engng |
Health |
Life |
Math |
Phys |
Psych |
Social |
|
1972 |
na |
4.91 |
3.00 |
5.71 |
2.91 |
223 |
4.63 |
9.62 |
|
1974 |
na |
4.28 |
5.29 |
6.71 |
2.61 |
2.09 |
5.14 |
9.16 |
|
1976 |
na |
3.88 |
6.42 |
7.67 |
2.16 |
2.14 |
5.00 |
8.15 |
|
1978 |
.78 |
4.77 |
6.71 |
7.76 |
1.36 |
233 |
4.53 |
7.59 |
|
1980 |
1.20 |
5.88 |
6.84 |
7.11 |
1.22 |
235 |
4.22 |
7.18 |
|
1982 |
2.13 |
6.96 |
6.77 |
6.64 |
1.22 |
250 |
4.26 |
7.33 |
|
1984 |
3.30 |
7.86 |
6.65 |
5.79 |
1.36 |
2.44 |
4.14 |
7.07 |
|
1986 |
4.24 |
7.67 |
6.66 |
5.35 |
1.65 |
2.17 |
4.07 |
6.90 |
|
1987 |
4.00 |
9.39 |
6.38 |
3.84 |
1.66 |
2.01 |
4.32 |
9.70 |
|
1988 |
3.48 |
8.94 |
6.05 |
3.70 |
1.60 |
1.79 |
4.53 |
10.09 |
|
1989 |
3.01 |
8.38 |
5.81 |
3.55 |
1.50 |
1.69 |
4.77 |
10.58 |
|
SOURCE: Betty M. Vetter, Professional Women and Minorities (9th ed.), Washington, D.C.: Commission on Professionals in Science and Technology, 1991, from U.S. Department of Education, National Center for Education Statistics, ''Degrees and Other Formal Awards Conferred.'' |
||||||||
Another factor affecting science policy in this area arises from the increasing proportion of both foreign scientists and engineers in the U.S. work force and foreigners earning doctorates from U.S. institutions, which has grown steadily since 1975 (NSF, 1987; Dybas, 1990). The increase in non-U.S. citizens on engineering faculties of U.S. universities (Figure 4) has been especially rapid, but the number of foreign scientists and engineers in the U.S. industrial work force has also been growing steadily as increasing percentages of foreigners receive advanced S&E degrees in the United States (Table 3). Many within the scientific community feel that without
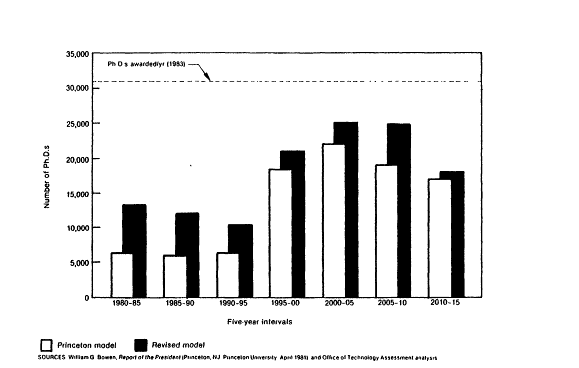
Source: U.S. Congress, Office of Technology Assessment, Demographic Trends and the Scientific and Engineering Work Force——A Technical Memorandum, Washington, D.C.: U.S. Government Printing Office, 1985.
Figure 3. High and low estimates of the number of new Ph.D. faculty hires in the sciences and engineering, every five years, 1980-2015.
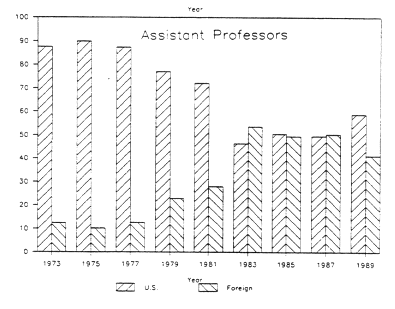
TABLE 3: Ph.D.s Awarded by U.S. Universities to Non-U.S. Citizens, 1989
|
Field |
Total Ph.D.s in Field |
Percent Earned by Non-U.S. Citizens |
|
|
|
|
Perm. Visas |
Temp. Visas |
|
Total All Fields |
34,319 |
5.1 |
21.0 |
|
Physical Sciences |
5,460 |
5.3 |
30.5 |
|
Physics/Astronomy |
1,278 |
5.3 |
36.7 |
|
Chemistry |
1,971 |
4.6 |
25.1 |
|
Earth, Atmos., and Marine |
738 |
4.4 |
17.8 |
|
Mathematics |
861 |
4.5 |
44.5 |
|
Computer Sciences |
612 |
9.9 |
31.2 |
|
Engineering |
4,536 |
8.7 |
46.5 |
|
Life Sciences* |
6,343 |
4.4 |
19.3 |
|
Biological Sciences |
4,106 |
4.6 |
15.5 |
|
Health Sciences |
985 |
2.8 |
15.2 |
|
Agricultural Sciences |
1,252 |
4.8 |
35.6 |
|
Social Sciences* |
5,955 |
4.2 |
15.5 |
|
Political Sci/Int'l Relations |
524 |
9.3 |
25.2 |
|
Economics |
898 |
6.8 |
40.8 |
|
Humanities |
3,558 |
6.4 |
10.5 |
|
Education |
6,265 |
2.8 |
7.6 |
|
Professional/Other* |
2,202 |
6.3 |
19.8 |
|
Business and Management |
1,071 |
6.9 |
26.5 |
|
Note: Totals in each field include U.S citizens and recipients with unknown citizenship status. Percentages are based on the number of doctorates with known citizenship status. * Totals include other fields not shown. SOURCE: Delores H. Thurgood and Joanne M. Weinman, Summary Report 1989: Doctorate Recipients from United States Universities, Washington, D.C.: National Academy Press, 1990. |
|||
the large number of foreign graduate students, U.S. universities would be unable to educate the next generation of scientists and engineers to meet U.S. research and development needs.
The 1990 Immigration Act, signed into law by President Bush in November 1990 to be effective in October 1991, permits 140,000 skilled workers to obtain permanent visas each year. These skilled workers include:
-
40,000 priority workers, those "whose work will prospectively benefit the U.S. and whose achievements are of international renown" as well as "the outstanding researcher or professor ... recognized internationally and [having] at least three years' teaching or research experience in an academic area;"
-
40,000 immigrants holding advanced degrees;
-
40,000 immigrants with bachelor's degrees or equivalents; and
-
10,000 foreign scientist-entrepreneurs who, in order to qualify, must guarantee a minimum investment of $1 million "in a new commercial enterprise that employs at least 10 U.S. workers" (Eisner, 1991).
The availability of foreign scientists and engineers may be decreasing, however: F. Karl Willenbrock, former assistant director of NSF's Directorate for Scientific, Technological, and International Affairs, noted just a year ago:
By the end of the century ... as a group, 29 industrialized and newly industrialized countries that are major producers of [S&E] degrees will experience a decline in college-age people. Many of these are the very countries that in the past have sent science and engineering graduates with baccalaureate degrees to the U.S. for graduate education (quoted in Vetter, 1990).
In addition, Betty M. Vetter, executive director of the Commission on Professionals in Science and Technology, reported that while "13,300 scientists and engineers immigrated to the U.S. in 1970, accounting for 3.6 percent of all immigrants admitted that year, ... in 1988, their numbers had dropped to 10,900, or 1.7 percent of all immigrants" (Vetter, 1990).
Education Issues
The Ph.D. attainment rate of women remains lower than of men in all fields of science and engineering except psychology, although "at no stage in the educational process is there an indication that the attrition is caused by lack of academic performance" (Koshland, 1988). Recent statistics highlight this attrition by women. In 1986, women received 38 percent of the awarded baccalaureates, 30 percent of the master's degrees, and 26 percent of the doctorates in science and engineering. Little improvement was found three years later, when the percentage of S&E degrees awarded to women were 39, 32, and 26 percent, respectively (Table 4).
These 1989 totals, however, conceal considerable variation by field. Women received 71 percent of bachelor's degrees in psychology, 50 percent in the life sciences (a 7 percent increase from 1986), 46 percent in mathematics, and 44 percent in the social sciences, but only 14 percent in engineering, 30 percent in the physical sciences, and 31 percent in computer and information sciences (a 6 percent decrease from 1986). Whereas women in the life sciences and social sciences are likely to complete advanced degrees, they are much less likely to do so in the physical sciences, computer and information sciences, and mathematics, where women represented 41 percent of the 1978 baccalaureates but only 16.6 percent of the 1986 doctorates. (It should be noted that women's share of math doctorates increased to 19.4 percent in 1989.) In the life sciences, on the other hand, the 30.2 percent of the 1986 doctorates earned by women were based on 36 percent of baccalaureates in 1977; and in engineering, women earned almost 7 percent of 1978 bachelor's degrees and the same proportion of 1986 doctorates. In the biological sciences, where women have traditionally comprised a large number of degree-earners, men have a higher probability
TABLE 4: Science and Engineering Degrees Granted to Women, by Degree Level, 1986 and 1989
|
|
|
Baccalaureates |
Master's Degrees |
Doctorates |
|||
|
Science and Engineering Field |
Total |
No. of Women |
% of Total |
No. of Women |
% of Total |
No. of Women |
% of Total |
|
Total |
1986 |
121,439 |
37.7 |
18,298 |
29.9 |
4,906 |
26.1 |
|
1989 |
133,395 |
39.2 |
21,298 |
31.6 |
5,482 |
26.1 |
|
|
Sciences, total |
1986 |
110,123 |
45.2 |
15,970 |
39.9 |
4,681 |
36.4 |
|
1989 |
121,773 |
47.7 |
18,112 |
42.2 |
5,082 |
34.0 |
|
|
Physical |
1986 |
6,698 |
28.1 |
1,352 |
23.3 |
605 |
16.4 |
|
1989 |
5,107 |
29.7 |
1,533 |
26.7 |
759 |
19.7 |
|
|
Mathematical |
1986 |
7,036 |
46.1 |
1,011 |
35.0 |
121 |
16.6 |
|
1989 |
7,016 |
46.0 |
1,366 |
39.9 |
171 |
19.4 |
|
|
Computer & Info. Science |
1986 |
14,431 |
36.9 |
2,037 |
28.7 |
49 |
12.3 |
|
1989 |
9,416 |
30.7 |
2,623 |
27.9 |
81 |
15.1 |
|
|
Life |
1986 |
25,149 |
43.5 |
3,491 |
39.9 |
1,448 |
30.2 |
|
1989 |
18,109 |
50.2 |
2,449 |
49.6 |
1,298 |
36.7 |
|
|
Psychology |
1986 |
27,422 |
68.2 |
5,417 |
63.9 |
1,564 |
50.9 |
|
1989 |
34,335 |
70.8 |
5,780 |
67.4 |
1,834 |
56.2 |
|
|
Social |
1986 |
29,387 |
43.5 |
2,662 |
37.8 |
894 |
32.5 |
|
1989 |
47,790 |
44.4 |
4,361 |
40.2 |
939 |
32.6 |
|
|
Engineering and Engineering technologies |
1986 |
11,316 |
14.5 |
2,328 |
11.0 |
225 |
6.7 |
|
1989 |
11,622 |
13.6 |
3,186 |
13.0 |
400 |
8.8 |
|
|
SOURCE: National Science Board, Science Indicators—1989 (NSB 89-1), Washington, D.C.: U.S. Government Printing Office, 1989; and Delores H. Thurgood and Joanne M. Weinman, Summary Report 1989: Doctorate Recipients from U.S. Universities, Washington, D.C.: National Academy Press, 1990. |
|||||||
than women of pursuing graduate study, but the difference between men and women is smaller than in many other fields: in 1985, 23.6 percent of the 93,000 recent male undergraduates enrolled in graduate school, as opposed to only 18.1 percent of the women (Hornig, 1987).
Within this environment, current data indicate the need for a concerted effort to analyze the reasons underlying the decreasing participation of U.S. students in science and engineering and to take corrective action. The declining number of college-aged students during the coming decades does not necessarily imply that the United States will have a shortage of native-born scientists and engineers, if a strategy can be found to increase the probability that young people go into scientific and engineering careers. Such a strategy should include increasing the participation of groups who in the past have been underrepresented in the S&E work force. Women are a major human resource that has traditionally been underrepresented in most fields of science and engineering in the United States. Thus, U.S. women educated in the sciences and engineering represent a potential resource for addressing projected future needs for S&E personnel.
Employment Issues
Examination of the 1988 data reveals that, while women are increasingly represented in the total U.S. work force (45 percent) and in the total professional work force, including the scientific, business, and management areas (50 percent), they are greatly underrepresented in the scientific work force (30 percent) and the engineering work force (4 percent) (Figure 5) (NSF, 1990b). In some subfields women are grossly
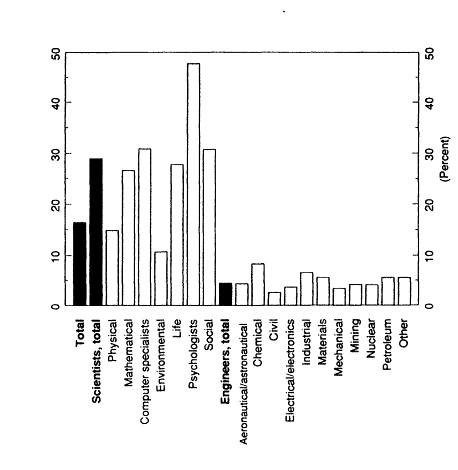
Source: National Science Foundation, Women and Minorities in Science and Engineering (NSF 90-301), Washington, D.C.: U.S. Government Printing Office, 1990.
Figure 5. Percentage of women among employed scientists and engineers, by field, 1988.
underrepresented, more so than in many foreign countries, as was revealed by a recent international study of the participation of women in physics (Table 5). Yet it is projected that by the year 2000, 85 percent of new entrants to the U.S. work force will be women and members of racial/
TABLE 5: Degrees to Women in Physics and Women as Physics Faculty (in percent)
|
|
Degrees to Recent Graduates |
|
|
|
Country |
Bachelor's |
Doctorate |
Faculty |
|
Belgium |
33 |
29 |
11 |
|
Brazil |
24 |
31 |
18 |
|
Democratic German Republic |
12 |
18 |
8 |
|
France |
24 |
21 |
23 |
|
Hungary |
50 |
27 |
47 |
|
India |
25 |
26 |
10 |
|
Ireland |
22 |
20 |
7 |
|
Italy |
29 |
21 |
23 |
|
Japan |
7 |
4 |
6 |
|
Korea |
20 |
5 |
3 |
|
Netherlands |
20 |
4 |
6 |
|
New Zealand |
10 |
11 |
6 |
|
Philippines |
28 |
60 |
31 |
|
Poland |
14 |
17 |
17 |
|
South Africa |
24 |
21 |
9 |
|
Spain |
17 |
21 |
16 |
|
Turkey |
38 |
17 |
23 |
|
Union of Soviet Socialist Republics |
34 |
25 |
30 |
|
United Kingdom |
16 |
12 |
4 |
|
United States |
15 |
9 |
3 |
|
SOURCE: W. J. Megaw, Gender Distribution in the World's Physics Departments , paper prepared for the meeting, Gender and Science and Technology 6, Melbourne, Australia, July 14-18, 1991. |
|||
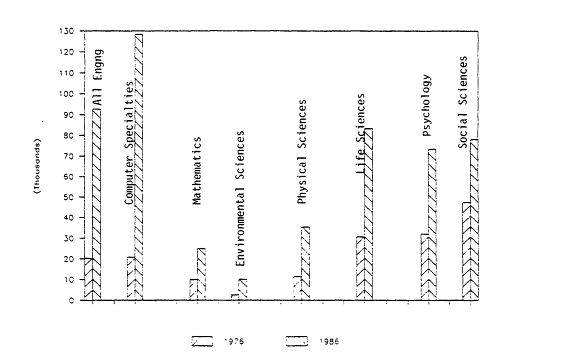
Source; National Science Board, Science Indicators—1989 (NSB 89-1), Washington, D.C.: U.S. Government Printing Office, 1989.
Figure 6. Women doctorates in science and engineering, by field, 1976 and 1986.
ethnic minority groups, groups not traditionally employed in the sciences and engineering (Department of Labor, 1990).
Analysis of their current distribution by fields (Figure 6) and types of employers (Table 6) provides some perspective on the role of doctorate women in the S&E work force:
-
Academe: Table 6 shows that most women Ph.D.s entered
TABLE 6: Employers of Doctorate Recipients in Science and Engineering, by Sex, 1989
|
Type of Employer |
Year |
Total |
Male |
Female |
||
|
|
|
|
Number |
Percent |
Number |
Percent |
|
TOTAL |
1989 |
476,340 |
393,843 |
100.0 |
82,497 |
100.0 |
|
Self-Employed |
1989 |
31,801 |
23,216 |
5.9 |
8,585 |
10.4 |
|
Business & Industry |
1989 |
111,375 |
101,097 |
25.7 |
10,278 |
12.5 |
|
Academe |
1989 |
225,803 |
183,901 |
46.7 |
41,902 |
50.8 |
|
Two-Year College |
1989 |
5,226 |
4,006 |
1.0 |
1,220 |
1.5 |
|
Medical School |
1989 |
31,711 |
23,047 |
5.9 |
8,664 |
10.5 |
|
Four-Year College |
1989 |
31,693 |
25,208 |
6.4 |
6,485 |
7.9 |
|
Other University |
1989 |
153,154 |
129,280 |
32.8 |
23,874 |
28.9 |
|
Precollege |
1989 |
4,019 |
2,360 |
0.6 |
1,659 |
2.0 |
|
Government* |
1989 |
38,493 |
32,801 |
8.3 |
5,6921 |
6.9 |
|
Nonprofit Org. |
1989 |
13,480 |
10,429 |
2.6 |
3,051 |
3.7 |
|
Other |
1989 |
18,033 |
12,568 |
3.2 |
5,465 |
6.6 |
|
Not Employed |
1989 |
36,495 |
29,164 |
7.4 |
7,331 |
8.9 |
|
No Report |
1989 |
860 |
667 |
0.2 |
193 |
0.2 |
|
* Federal, state, and local. SOURCE: Office of Scientific and Engineering Personnel, Survey of Doctorate Recipients. |
||||||
-
academe (about 50 percent in 1989), primarily medical schools and four-year colleges, with correspondingly smaller numbers finding positions in other types of employment. Another 2 percent of women Ph.D.s entered precollege teaching, compared with less than 1 percent of men. Women comprise 27.6 percent of all faculties at U.S. universities (Vetter, 1991, Tables 5-12), but only 17.5 percent of all science and engineering faculty (Table 7). and while men Ph.D.s are more likely to hold full or associate professorships, women are much more likely to be instructors, lecturers, adjunct faculty, and ''other'' faculty.
-
Industry: Overall, about 12 percent of women scientists and engineers are employed in industry, compared to about 26 percent of men scientists and engineers (Table 6). The National Research Council (1983) reported that 1981 data showed a doubling of the number of women scientists and engineers in industry since 1977, but that they remained seriously underrepresented compared to their availability and were underemployed and underpaid. Data from NSF reveal similar findings for the past decade.1
-
Government: In 1988 the U.S. work force included approximately 2.0 million scientists and 2.6 million engineers, of whom 88,106 scientists and 107,415 engineers were employed by the federal government, the largest single employer of scientists and engineers in the United States (Campbell and Dix, 1990). Overall, women and minorities find greater employment opportunities within the
TABLE 7: Academic Ranks of all U.S. Doctorate Recipients in Science and Engineering, 1989
|
|
|
|
Male |
Female |
||
|
Academic Rank |
Year |
Total |
Number |
Percent |
Number |
Percent |
|
TOTAL |
1989 |
221,784 |
181,541 |
81.9 |
40,243 |
18.1 |
|
Faculty, Total |
1989 |
199,081 |
164,254 |
82.5 |
34,827 |
17.5 |
|
Professor |
1989 |
89,821 |
82,354 |
91.7 |
7,467 |
8.3 |
|
Assoc. Professor |
1989 |
50,314 |
40,724 |
80.9 |
9,590 |
19.1 |
|
Asst. Professor |
1989 |
38,513 |
27,235 |
70.7 |
I 1,278 |
29.3 |
|
Instructor |
1989 |
2,445 |
1,473 |
60.2 |
972 |
39.8 |
|
Lecturer |
1989 |
2,395 |
1,430 |
59.7 |
965 |
40.3 |
|
Adjunct Faculty |
1989 |
3,744 |
2,476 |
66.1 |
1,268 |
33.9 |
|
Other Faculty |
1989 |
11,849 |
8,562 |
72.3 |
3,287 |
27.7 |
|
Postdoctoral Appt. |
1989 |
11,892 |
8,491 |
71.4 |
3,401 |
28.6 |
|
Does Not Apply |
1989 |
4,364 |
3,035 |
69.5 |
1,329 |
30.5 |
|
No Report |
1989 |
6,447 |
5,761 |
89.4 |
686 |
10.6 |
|
SOURCE: Office of Scientific and Engineering Personnel, Survey of Doctorate Recipients |
||||||
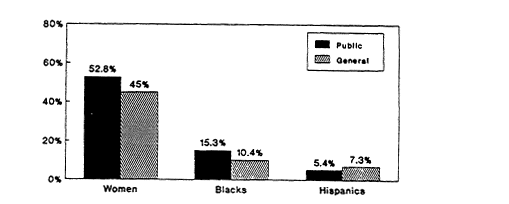
Source: Bureau of Labor Statistics, Employment and Earnings and Labor Force Statistics from the Current Population Survey, in Public Employees: Facts at a Glance, Washington, D.C.: AFL-CIO Public Employee Department, 1990.
Figure 7. Women, blacks, and Hispanics in the federal work force, 1988 (in percent).
-
federal government than within other U.S. employment sectors (Figure 7). However, "in 1988 only about 14 percent of federal scientists and engineers were female, and about 7 percent were black or Hispanic" (Falk, 1990).
Conclusion
The policy environment for recruiting and retaining women in science and engineering can be characterized currently by attention to three types of issues: (1) demographic considerations, including the rising proportion of non-U.S. citizens in the U.S. work force; (2) education issues, with emphasis on the low rate of participation of women in the component fields of science and engineering; and (3) employment conditions in the U.S. work force. The decisions that we make about our
S&E cadre today will have a significant effect on our ability to find solutions to future problems. Our ultimate success depends upon the degree to which we maximize use of all of the Nation's human resources.
Based on this policy environment, the Committee concludes that there is great potential for increasing the number of women in science and engineering, especially in areas where they are most underrepresented and where the national need is greatest. CWSE has therefore formulated a plan of action on three topics:
-
strengthening the S&E education infrastructure,
-
examining the effectiveness of intervention programs in sustaining the flow of women into science and engineering, and
-
exploring career patterns for women in S&E employment.
Within these topics are four policy issues that the Committee believes warrant consideration:
-
changing demographics,
-
changing missions of relevant agencies in the federal government and industrial organizations and their subsequent impact on university-government-private partnerships,
-
changing public attitudes toward science and scientists, and
-
the entry and retention of women into mainstream science and engineering careers.
The next three chapters of this report examine each of the three topics with these policy issues in mind.


