
Afternoon Session Opening Remarks
Forrest Young
University of North Carolina, Chapel Hill
There was talk at various times this morning about standardization and occasionally about certification. The Panel on Guidelines for Statistical Software is about neither of those, and it is important to emphasize that. Our business is guidelines, not issuing seals of approval.
If you think particularly about the three topics of exactness, richness, and guidance, it is hard to know how one would decide for the last two, richness and guidance, that something deserves a seal of approval. Making such judgments for exactness is a possibility, although I am not saying I think that is a good thing to do. The panel aims only to state guidelines, not to set standards or issue seals of approval. It is certainly possible, though, to set standards for exactness. For richness or guidance, however, standards--let alone certification--may not be possible.
Another theme that came up several times in the morning was layering, that there should be different layers of the software system. I tend to see this as related to this afternoon's featured topic of guidance in that there can perhaps be an outer layer of a statistical system whose purpose is to guide the relatively unsophisticated user.
In my ideal data analysis environment, such a layer would be there for the more naive user, but would not have to be there; it need not be used by a more sophisticated user. There would be several layers. Perhaps the innermost layer would be just a language. A complete system would need to have more layers put on the outside to help people who are less sophisticated in terms of the data analysis, but who are very interested in the application.
Another theme from this morning was that of strategy, which is a central idea in guidance. Paul Tukey mentioned that one ought to have a strategy for doing regression modeling. Also, Paul Velleman presented two strategies. One is an original strategy for doing statistical analysis based on batch submission of analyses, where one first reads in the data and then specifies the strategy, afterward producing output. That is a very linear strategy without any choices in it. Later, he presented a much more involved strategy, more in tune with exploratory data analysis, where data is read at the beginning and displayed, whereupon the user is faced with a lot of options having to do with outliers, with diagnosing problems in the data, or with putting the data into sub-groups and transforming the data. Basically, that is another idea of a strategy in data analysis. Strategies are important for providing guidance.
In a paper I presented at the ASA conference in August of 1990 on that topic [Lubinsky and Young, 1990], there were a couple of slides on guidance showing my ideas along this line. Figure 3 is a mock-up of a proof-of-concept system that David Lubinsky
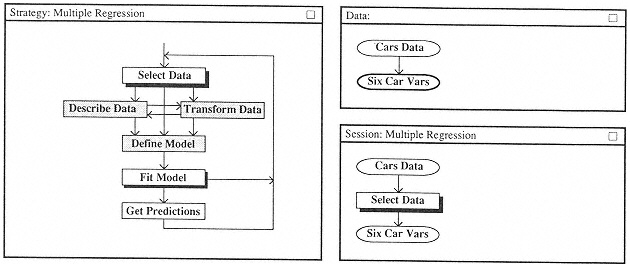
FIGURE 3: One possible way of guiding a data analysis. Reprinted, with permission, from Lubinsky and Young [1990]. Copyright © 1990 by American Statistical Association.
of AT&T Bell Laboratories and I worked on. There is a window with a cyclic graph in it. As Paul Velleman pointed out this morning, it has an entry point, but no exit. This represents the process of data analysis. It is never finished. But you can exit at any point you want. There is no specified plan of things that must be done before you can quit. But when you do exit, the system would suggest a thing to do.
For example, the grayed-in box is suggesting that the first thing to do is to select the data. When that has been done, a sub-strategy might be given, a recursive definition of a strategy. A new strategy box opens up that focuses both on variables and observations or cases. When that is finished, that box closes.
Then the user goes to the next set of possible things that the strategy would suggest, either describing the data, transforming the data, or defining a model. As the flow indicates, if you describe the data, you still can again transform data or define the model, and conversely for transforming. But once you have a model defined, the only thing the strategies then suggest you do is to fit the model. Fitting the model itself is recursively defined. Within that one would see a more involved strategy depicting what to do.
This is one possible way of guiding a data analysis. Where does this strategy graph come from? It comes from an expert. Somewhere, an expert at multiple regression must have sat down and created this graph. In fact, this graph was created by Lubinsky and me after looking at the book by Daniel and Wood [1980], where such a strategy for doing multiple regression appears on the inside front cover. There are also analogous graphs presented for principal components in a factor analysis, for example. Such sources for
guidance strategies are available, and experts can certainly be consulted for strategies to guide data analyses.
References
Daniel, C., and F.S. Wood, 1980, Fitting Equations to Data, John Wiley & Sons, New York.
Lubinsky, D.J., and F.W. Young, 1990, Guiding data analysis, Proceedings of Section on Computational Statistics, American Statistical Association, Alexandria, Va.


