
3—
Characteristics and Utilization of Human Factors Specialists
The main objectives of the study involved the following questions: What do human factors specialists do? Where do they do it? How do they do it? Obtaining answers required an examination of the work setting, the role of human factors in that setting, the nature of supervision, the extent of interaction with others, personal characteristics, and above all the specific tasks performed. In addition, differences among subsamples of specialists were examined for insights they might reveal. Any differences noted in this section were statistically significant at the 0.01 level.
THE WORK SETTING
Type of Employer
The principal workplace of the human factors specialists surveyed was in private business, with 74 percent reporting such an organization as their employer. This percentage included those employed by private nonprofit organizations and those employed by private consulting organizations. Among those remaining, 15 percent worked for government agencies and 10 percent for education institutions (Figure 3.1). To be included in the study, those who worked for education institutions also had to consult regularly for private business or government agencies. Only 1 percent reported a place of work in other than one of the three employer categories.
This distribution of employment settings existed among those who thought of themselves principally as human factors specialists as well as those who did human factors work but thought of themselves as something else, such
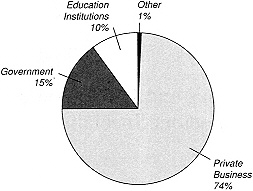
FIGURE 3.1
Principal workplace of human factors specialists.
as engineers or computer scientists. The one exception was among those who called themselves psychologists. Almost as many psychologists were employed in government agencies, 41 percent, as in private business, 47 percent.
As one would expect, the type of systems addressed by the human factors specialists was related somewhat to type of employer. For example, those who worked on office products or industrial processes were mainly in private business. Those who worked in the area of health and safety were much more likely than others to be found in education institutions, 33 percent, or government agencies, 25 percent.
Focus of Work
At the time of the study, 60 percent of human factors specialists principally worked in just three areas—computers, aerospace, and industrial processes. These and six other areas—health and safety, communications, transportation, energy, consumer products, and office products—encompass 87 percent of the sample (Table 3.1). Of the remaining 13 percent of human factors specialists, no single area accounted for more than 0.5 percent of the sample. Examples of these other areas are publishing, mining, recreation, tourism, and financial services.
A relatively large amount of human factors work was being performed for military purposes. Somewhat more than 30 percent of the sample reported that at least half of their work was for the military. The main areas of military emphasis were aerospace, computers, communications, and transportation. The distribution of work among the various areas is shown in the table.
Agencies within the Department of Defense have developed programs and procedures to help integrate efforts that address human factors issues in the development of new systems. These programs, as discussed earlier, are
known by the following acronyms: MANPRINT, HARDMAN, RAMPARTS, and IMPACT. Overall, 12, percent of the sample reported currently working under one of these programs. Of those whose work was half or more on military systems, 42 percent reported working under one of these programs.
Hours Worked Per Week
In all, 80 percent reported that they worked 40 hours or more in a typical week. There were, however, notable differences between those with supervisory responsibilities and those without them in the number of hours worked. For purposes of the study, supervisors were defined as those who reported that they supervised human factors specialists and either had a current job title of supervisor, manager, etc., or reported that they supervised three or more people. The modal category of hours worked per week was 40–44 for nonsupervisory specialists, with 47 percent reporting these numbers. The modal category for supervisors was 50 or more hours per week, with 47 percent reporting these numbers. Those who reported working fewer than 20 hours per week (17 percent) were all nonsupervisors and included educators doing part-time consulting work.
Work History
Most people working in the field of human factors have not been in their current job long—39 percent have had their present position for two years or less, and 70 percent for five years or less. Only 11 percent have had the
TABLE 3.1 Principal Areas of Work of Human Factors Specialists (percentage)
|
|
|
Percentage of Time Working for Military |
|
|
Area of Focus |
Overall |
Less than 50% |
50% or More |
|
Computers |
22.3 |
28.1 |
10.3 |
|
Aerospace |
21.6 |
7.7 |
51.9 |
|
Industrial processes |
16.5 |
23.9 |
0.4 |
|
Health and safety |
8.9 |
11.7 |
2.4 |
|
Communications |
8.2 |
7.9 |
9.1 |
|
Transportation |
5.3 |
4.2 |
7.5 |
|
Energy |
2.2 |
2.7 |
1.3 |
|
Consumer products |
1.4 |
2.0 |
0.0 |
|
Office products |
0.7 |
1.0 |
0.0 |
|
Something else |
12.9 |
10.8 |
17.1 |
|
Total |
100.0 |
100.0 |
100.0 |
same job for more than 10 years. This pattern was relatively consistent across types of employers, areas of work, supervisors and nonsupervisors, degree of involvement in military work, and sex.
In their previous job, 63 percent had a position that was primarily concerned with human factors, and in 44 percent of the cases that position was with the same organization. The distribution across types of employers—private business, government agency, or education institution—was about the same for previous as for current employment.
Salary Received
The distribution of before-tax annual salaries reported for the present job, by supervisors and nonsupervisors, is presented in Table 3.2. Salary levels for supervisors were generally higher than for nonsupervisors. The median salary for nonsupervisors was $46,000, and that for supervisors was $57,000. A finding that may come as a surprise to some and that seems to contradict popular wisdom is that the distributions of salary levels were not greatly different across types of employers, areas of work, or the degree of involvement in military work.
Salary levels did correlate positively, as expected, with variables such as age, level of highest academic degree, and number of years since receiving the highest academic degree. Level of highest academic degree was the variable that correlated most strongly with salary level. Of those holding the doctorate degree, 52 percent reported an annual salary of $60,000 or greater compared with 28 percent of those holding master's or bachelor's degrees.
Interpretation of the data in the table must be made in light of the fact that they are from somewhat less than the total sample, because of refusals by 17 percent to provide this information. Also, it should be noted that some of the lower annual salaries entailed part-time work.
TABLE 3.2 Gross Annual Salary Levels of Nonsupervisors and Supervisors (percentage)
|
Salary Level |
Nonsupervisors |
Supervisors |
|
$30,000 or less |
11.8 |
3.3 |
|
$31,000–40,000 |
24.5 |
8.1 |
|
$41,000–50,000 |
25.6 |
19.3 |
|
$51,000–60,000 |
18.3 |
21.2 |
|
$61,000–70,000 |
9.8 |
20.1 |
|
$71,000–80,000 |
2.8 |
14.4 |
|
More than $80,000 |
7.2 |
13.6 |
|
Total |
100.0 |
100.0 |
TABLE 3.3 Male and Female Human Factors Specialists in Each Age Category Paid an Annual Before-Tax Salary of at least $60,000 (percentage)
|
Age |
Male |
Female |
|
55 years and older |
54.5 |
31.6 |
|
45–54 years |
54.6 |
16.8 |
|
35–44 years |
40.3 |
27.5 |
|
Under 35 years |
12.0 |
1.6 |
Men consistently were paid more than women by different types of employers and across all areas of human factors work. However, there were some significant variations in this regard in some areas. Salary differences between men and women were greatest in aerospace, communications, and transportation; they were least in computers and health and safety. Although the women in the sample tended to be younger than the men, Table 3.3 shows that salary differences existed at each age level.
ROLE OF HUMAN FACTORS IN THE WORK SETTING
Human Factors Specialist or Something Else?
To be selected as respondents for the study, persons contacted must have indicated that in their current position they were primarily concerned with human factors, that is, with human capabilities and limitations related to the design of operations, systems, or devices. One of the questions asked later was whether or not they considered themselves to be human factors specialists or something else. In response, 66 percent of nonsupervisors and 56 percent of supervisors said they considered themselves to be human factors specialists.
Those who considered themselves as something else mainly said they were industrial engineers, engineers other than industrial, psychologists, computer scientists, or industrial designers. Thus, although a majority of people doing human factors work think of themselves as human factors specialists, a significant proportion do not see themselves as members of the human factors profession.
Importance of Human Factors to Projects
Most human factors specialists worked in settings in which human factors was considered to be important to the projects conducted. Respondents uniformly rated human factors as being important to the project on which
they spent, or had recently spent, most of their working time. Using a seven-point rating scale, 88 percent of nonsupervisors and 86 percent of supervisors used the top three scale positions to indicate the level of importance of human factors to their projects. Using an identical seven-point scale, respondents also indicated how important their supervisor considered human factors to the project that consumed most of their working time. The top three scale positions were used by 77 percent of nonsupervisors and 82 percent of supervisors to indicate that their supervisors also considered human factors to be important in their projects.
Supervisor Background In and Knowledge of Human Factors
Human factors specialists were asked about the training and experience of their supervisors. Relatively few, 9 percent, responded that their supervisors had training or experience directly in human factors. Others reported that their supervisors had training and experience in engineering (34 percent), behavioral science (16 percent), business (13 percent), industrial design (11 percent), a science other than behavioral (11 percent), or something else (6 percent) (Figure 3.2).
Specialists who did half or more of their work for the military were more likely to have immediate supervisors with a background in human factors (15 percent) and behavioral science (25 percent) than those who did less than half of their work for the military. In viewing these findings, it must be kept in mind that nearly half of the sample of specialists had some
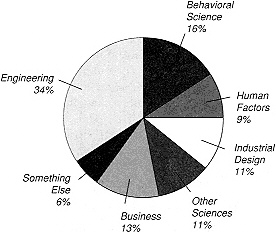
FIGURE 3.2
Training and experience of supervisors reported by human factors personnel.
supervisory responsibilities themselves. Therefore, nearly half of the immediate supervisors encompassed in this assessment were supervisors of supervisors of human factors specialists and likely to have responsibilities broader than human factors. Even so, the distribution of training and experience of immediate supervisors, as provided above, was essentially the same for supervisor and nonsupervisor specialists.
A substantial proportion of both supervisors and nonsupervisors, 37 percent, reported that their immediate supervisor knew little or nothing about the field of human factors. A somewhat larger proportion of both groups, 49 percent, reported that their immediate supervisor was quite knowledgeable about the field. Thus, most supervisors were reported to be on one end or the other of the continuum of human factors knowledge.
SUPERVISION AND INTERACTION
Nearly all human factors work is done within an organizational context—private business, government agency, or education institution. Moreover, much of it is done across multiple organizations—departments, divisions, companies, agencies—and multiple functions within organizations. Consequently, the study examined the supervision of human factors specialists and the interaction of specialists with others.
Span of Supervision
The sample of 971 human factors specialists consisted of those who had supervisory responsibilities (45 percent) and those who did not (55 percent). As indicated earlier, supervisors were defined as those who reported they supervised human factors specialists and either had a supervisory job title (supervisor, manager, etc.) or supervised three or more total personnel Distributions are provided in Table 3.4 for numbers of human factors specialists and total personnel supervised by those defined as supervisors.
As shown in the table, the span of direct supervision for most who had supervisory responsibilities was relatively narrow. More than half supervised only one or two other human factors specialists; 82 percent directly supervised five or fewer other human factors specialists; and about three-fourths supervised 10 or fewer total personnel. At the other end of the spectrum, approximately 4 percent of supervisors had direct responsibility for more than 15 human factors specialists.
Profile of Supervisory Tasks
A profile of supervisory tasks was prepared for human factors specialists who had supervisory responsibilities. The profile (Table 3.5) was prepared
TABLE 3.4 Human Factors Specialists and Total Personnel Supervisors Manage
|
Specialists Supervised |
Total Personnel Supervisors Manage |
||
|
Number Supervised |
Percentage of Supervisors |
Number Supervised |
Percentage of Supervisors |
|
1 |
31.7 |
— |
— |
|
2 |
25.2 |
— |
— |
|
3–5 |
25.0 |
3–5 |
43.2 |
|
6–10 |
10.0 |
6–10 |
30.8 |
|
11–15 |
4.2 |
11–15 |
13.6 |
|
16+ |
3.9 |
16+ |
12.4 |
|
|
100.0 |
|
100.0 |
from responses to questions about whether or not the task was performed as part of the person's job and how important it was to the performance of the job.
The tasks are ordered in the table by the percentage who stated that the task was a part of their job. The importance measure for each task was the percentage who rated the task in one of the top three points of a seven-point rating scale of importance.
Nearly all those with supervisory responsibility were performing those tasks required in the direct supervision of subordinates—selecting, assigning,
TABLE 3.5 Profile of Supervisory Tasks Performed by Human Factors Specialists With Supervisory Responsibilities
|
Task Description |
Percentage Performing Task |
Percentage Rating Task Important |
|
Select, assign, or train subordinates |
91.7 |
74.9 |
|
Schedule and monitor project activities |
90.5 |
82.1 |
|
Promote the use of human factors methods and information in projects |
90.5 |
72.1 |
|
Set group objectives and monitor the performance of subordinates |
86.7 |
80.0 |
|
Evaluate the performance of subordinates |
84.8 |
74.5 |
|
Prepare and monitor budgets |
73.4 |
71.8 |
|
Manage proposal preparation and contract negotiation |
56.2 |
75.1 |
training, monitoring, and evaluating. In addition, nearly all were engaged in the promotion of human factors methods and information in their projects. Fewer supervisors were involved with budgets and proposals than with the direct interaction with their subordinates. As shown in the table, there were no notable differences among the importance ratings given to the tasks.
Interactions With Others
Work was conducted by human factors specialists with a relatively high level of interaction with other human factors specialists; professionals in other fields; and with the ultimate users of the systems, operations, or devices developed. Interaction with other professionals occurred mainly with engineers, systems analysts, computer programmers, marketing specialists, health professionals, and industrial designers. The extent of weekly interactions with others is illustrated in Figure 3.3.
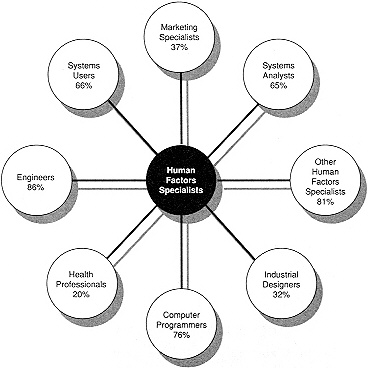
FIGURE 3.3
Extent of weekly interactions human factors specialists have with others.
As the figure shows, most interaction was with engineers and other human factors specialists, with 86 percent of the sample reporting weekly interactions with engineers and 81 percent reporting weekly interactions with other human factors specialists. At the next level were computer programmers, 76 percent; systems users, 66 percent; and systems analysts, 65 percent. Substantially lower levels were reported for marketing specialists, 37 percent; industrial designers, 32 percent; and health professionals, 20 percent.
Some significant differences were noted between supervisors and nonsupervisors. A greater percentage of supervisors interacted with others, in every specialty, than did nonsupervisors. On the average, 17 percent more supervisors reported weekly interactions with others than did nonsupervisors.
Those who did half or more of their work for the military reported relatively more extensive interaction with other human factors specialists and with systems analysts than did those who did less work for the military. Also, those who worked mostly for the military reported relatively less interaction with marketing specialists, industrial designers, and health professionals.
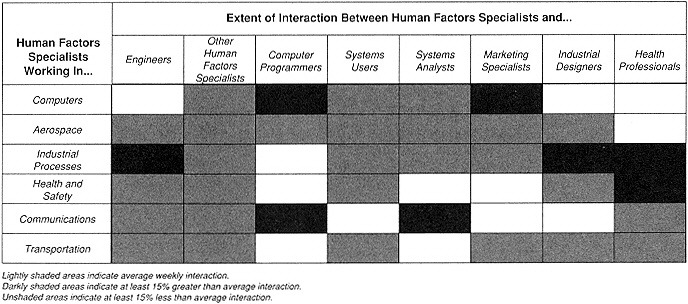
As one would expect, differences in the nature of interactions with others were found among the various areas of work. Only in the areas of computers, aerospace, industrial processes, health and safety, communications, and transportation was there a sufficient number of human factors specialists in the sample to permit analysis. A matrix, with area of work on one axis and specialty interacted with on the other axis, was prepared to facilitate comparisons (Figure 3.4). The basis for comparison was the percentage of human factors specialists reporting weekly interactions with persons in each of the' other specialties. Each cell of the matrix indicates the extent of interactions by human factors specialists working in the different areas relative ' to the extent of interactions of specialists in the total sample.
As shown in the figure, there are differences in the patterns of interaction among the different areas of human factors work, with no two areas having the same pattern. Of course, certain cells in the matrix are logically predictable, such as the greater level of interaction of specialists working in health and safety with health professionals, and specialists working on computers with computer programmers. Other differences shown in the matrix appear to be much less predictable, such as the lower level of interaction of human factors specialists in transportation with systems analysts or those in communications with systems users.
THE NATURE OF THE WORK
The deployment of human factors specialists in private business, government agencies, and other work settings was defined by the tasks that specialists perform. Building on unpublished task analyses completed by the Human Factors Society, 52 tasks of human factors specialists were identi
fied and employed to help define the nature of the work performed. The percentage of specialists who performed each task was determined by asking each respondent whether or not the task was performed as part of his or her current job. In the presentation of results, the tasks were grouped into six categories:
-
Systems analysis,
-
Risk and error analysis,
-
Design support,
-
Test and evaluation,
-
Instructional systems design, and
-
Communications.
The principal differences among human factors specialists in the tasks they performed was a function of the type of systems, operations, or devices that served as the focus of the work—computers, aerospace, industrial processes, health and safety, communications, and transportation. In addition, differences in task profiles were noted between those who worked primarily for the military and those who did not. Consequently, task performance profiles are provided for subsamples in each of these areas as well as for all areas combined.
Although more than six areas of focus were identified in the study (see Table 3.1), only six had sufficient numbers in the sample to permit the construction of separate profiles; these six areas accounted for the work of 83 percent of the sample.
A variety of other variables was investigated and found to have little effect in producing significant or practical differences among subsamples in the profiles for these tasks. These variables included: classification of respondents as supervisors or nonsupervisors, whether or not respondents considered themselves to be human factors specialists or something else (industrial engineers, psychologists, etc.), and the demographic variables of age, sex, salary level, education level, and years since receipt of highest degree.
Task performance profiles are presented in Tables 3.6 through 3.11. Each table lists a set of tasks in one of the six clusters. Tasks are listed in decreasing order relative to the percentage of human factors specialists who performed that task as a part of their current job. For example, Table 3.6 presents profiles for tasks in the systems analysis cluster. As the table shows, the task ''analyze tasks'' is performed by 81 percent of all surveyed human factors specialists. "Health and safety," which is one of the seven main subdomains of human factors work, is performed by 67: percent of all specialists surveyed. That 67 percent is more than 15 percent smaller than the 81 percent for all areas combined. It is considered a significant difference and so the respective block is shaded in the table.
TABLE 3.6 Task Performance Profiles: Systems Analysis (Percentage of Specialists in Each Area of Human Factors Work Who Perform Each Task)
|
Systems Analysis Tasks Performed |
Focus of Human Factors Work |
|||||||
|
All Areas Combined |
Computers |
Aerospace |
Industrial Processes |
Health and Safety |
Communications |
Land Transportation |
Military |
|
|
Analyze tasks |
81 |
80 |
78 |
86 |
67 |
77 |
90 |
83 |
|
Specify human user, operator, or maintainer requirements |
78 |
83 |
82 |
84 |
64 |
71 |
71 |
80 |
|
Assess mental workload |
47 |
40 |
66 |
32 |
49 |
43 |
54 |
64 |
|
Develop or conduct computer simulations |
46 |
60 |
53 |
37 |
15 |
52 |
40 |
52 |
|
Assess physical workload |
45 |
23 |
44 |
72 |
59 |
21 |
66 |
41 |
|
Analyze effects of environmental stressors |
37 |
18 |
48 |
44 |
48 |
26 |
54 |
48 |
|
Write or debug computer programs |
32 |
48 |
28 |
35 |
11 |
30 |
21 |
26 |
|
Conduct network analyses |
24 |
18 |
26 |
28 |
24 |
29 |
37 |
27 |
|
Perform human reliability analyses |
22 |
20 |
22 |
25 |
26 |
23 |
24 |
25 |
|
Shaded cells indicate a significant difference (± 15%) from the percentage for all areas combined. |
||||||||
TABLE 3.7 Task Performance Profiles: Risk and Error Analysis (Percentage of Specialists in Each Area of Human Factors Work Who Perform Each Task)
|
Focus of Human Factors Work |
||||||||
|
Risk and Error Analysis Tasks Performed |
All Areas Combined |
Computers |
Aerospace |
Industrial Processes |
Health and Safety |
Communications |
Land Transportation |
Military |
|
Collect data on errors, failures, or accidents |
39 |
37 |
32 |
55 |
52 |
33 |
48 |
36 |
|
Develop analytical models and methods |
34 |
32 |
44 |
27 |
34 |
40 |
42 |
46 |
|
Perform safety analyses |
31 |
14 |
25 |
53 |
59 |
13 |
60 |
31 |
|
Assess performance risks |
27 |
18 |
31 |
25 |
39 |
28 |
38 |
31 |
|
Conduct root-cause analyses |
20 |
14 |
11 |
38 |
20 |
81 |
33 |
14 |
|
Perform failure-mode-and-effects analyses |
14 |
11 |
16 |
13 |
24 |
5 |
22 |
15 |
|
Develop and analyze fault trees |
13 |
11 |
11 |
19 |
18 |
3 |
21 |
14 |
|
Support product-liability litigation |
11 |
3 |
10 |
11 |
37 |
3 |
24 |
9 |
|
Shaded cells indicate a significant difference(± 15%) from the percentage for all areas combined. |
||||||||
TABLE 3.8 Task Performance Profiles: Design Support (Percentage of Specialists in Each Area of Human Factors Work Who Perform Each Task)
|
Focus of Human Factors Work |
||||||||
|
Design Support Tasks Performed |
All Areas Combined |
Computers |
Aerospace |
Industrial Processes |
Health and Safety |
Communications |
Land Transportation |
Military |
|
Apply human factors criteria and principles |
85 |
89 |
90 |
86 |
88 |
83 |
90 |
88 |
|
Verify design conformance to human factors specifications |
63 |
63 |
78 |
54 |
61 |
69 |
68 |
74 |
|
Design human-equipment interfaces |
55 |
64 |
67 |
49 |
44 |
53 |
44 |
58 |
|
Design workspace layouts |
49 |
26 |
48 |
74 |
54 |
38 |
64 |
48 |
|
Design software-user interfaces |
48 |
86 |
49 |
27 |
16 |
55 |
21 |
44 |
|
Prepare or review design drawings for conformance to human factors specifications |
46 |
38 |
57 |
50 |
34 |
44 |
49 |
50 |
|
Prepare specifications for software |
45 |
75 |
44 |
23 |
18 |
60 |
27 |
42 |
|
Prepare design mockups |
38 |
44 |
49 |
29 |
26 |
35 |
40 |
39 |
|
Shaded cells indicate a significant difference (± 15%) from the percentage for all areas combined. |
||||||||
TABLE 3.9 Task Performance Profiles: Test and Evaluation (Percentage of Specialists in Each Area of Human Factors Work Who Perform Each Task)
|
Focus of Human Factors Work |
||||||||
|
Test and Evaluation Tasks Performed |
All Areas Combined |
Computers |
Aerospace |
Industrial Processes |
Health and Safety |
Communications |
Land Transportation |
Military |
|
Interpret test and evaluation results |
72 |
70 |
83 |
58 |
67 |
78 |
81 |
83 |
|
Design data collection procedures and questionnaires |
68 |
65 |
80 |
50 |
64 |
69 |
65 |
79 |
|
Specify or perform data analysis procedures and statistical tests |
61 |
54 |
75 |
47 |
55 |
71 |
53 |
73 |
|
Collect data in field settings |
61 |
55 |
53 |
64 |
59 |
53 |
75 |
60 |
|
Plan and coordinate evaluations |
57 |
54 |
73 |
40 |
42 |
56 |
76 |
67 |
|
Specify evaluation objectives |
56 |
61 |
73 |
36 |
53 |
57 |
54 |
64 |
|
Develop criterion measures |
55 |
51 |
70 |
44 |
51 |
58 |
48 |
64 |
|
Design evaluations |
48 |
49 |
68 |
23 |
42 |
45 |
49 |
60 |
|
Collect data in laboratory settings |
40 |
46 |
61 |
10 |
41 |
45 |
37 |
50 |
|
Shaded cells indicate a significant difference (± 15%) from the percentage for all areas combined. |
||||||||
TABLE 3.10 Task Performance Profiles: Instructional System Design (Percentage of Specialists in Each Area of Human Factors Work Who Perform Each Task)
|
Focus of Human Factors Work |
||||||||
|
Instructional Systems Design Tasks Performed |
All Areas Combined |
Computers |
Aerospace |
Industrial Processes |
Health and Safety |
Communications |
Land Transportation |
Military |
|
Prepare instructional or procedural documents |
47 |
47 |
41 |
60 |
32 |
48 |
31 |
43 |
|
Define instructional requirements |
44 |
45 |
38 |
45 |
33 |
47 |
47 |
43 |
|
Specify training objectives |
43 |
38 |
39 |
59 |
42 |
33 |
23 |
46 |
|
Assess the effectiveness of training (systems, courses, aids, simulators) |
42 |
37 |
33 |
51 |
48 |
27 |
28 |
45 |
|
Conduct training |
37 |
26 |
26 |
66 |
34 |
22 |
35 |
30 |
|
Design training aids |
36 |
37 |
25 |
49 |
32 |
28 |
34 |
35 |
|
Develop training content and instructional methods |
35 |
35 |
26 |
51 |
39 |
26 |
17 |
34 |
|
Design simulation systems |
24 |
25 |
40 |
10 |
16 |
27 |
14 |
34 |
|
Prepare product warnings |
18 |
15 |
18 |
16 |
34 |
19 |
18 |
17 |
|
Shaded cells indicate a significant difference (± 15%) from the percentage for all areas combined. |
||||||||
TABLE 3.11 Task Performance Profiles: Communications (Percentage of Specialists in Each Area of Human Factors Work Who Perform Each Task)
|
Focus of Human Factors Work |
||||||||
|
Communications Tasks Performed |
All Areas Combined |
Computers |
Aerospace |
Industrial Processes |
Health and Safety |
Communications |
Land Transportation |
Military |
|
Prepare and conduct oral presentations |
90 |
90 |
94 |
85 |
87 |
90 |
92 |
94 |
|
Prepare or contribute to written reports |
85 |
82 |
94 |
83 |
81 |
84 |
84 |
94 |
|
Prepare or contribute to project proposals |
80 |
78 |
85 |
85 |
75 |
79 |
78 |
82 |
|
Evaluate reports written by others |
79 |
77 |
84 |
76 |
81 |
79 |
81 |
82 |
|
Review and summarize the results of previous research |
67 |
73 |
81 |
39 |
80 |
70 |
49 |
83 |
|
Interpret research results |
64 |
70 |
81 |
31 |
81 |
68 |
49 |
78 |
|
Develop hypotheses and theories |
52 |
60 |
61 |
31 |
64 |
48 |
39 |
60 |
|
Interpret engineering drawings |
47 |
25 |
53 |
76 |
41 |
26 |
72 |
50 |
|
Prepare engineering drawings |
21 |
10 |
20 |
41 |
18 |
10 |
33 |
14 |
|
Shaded cells indicate a significant difference (± 15%) from the percentage for all areas combined. |
||||||||
The profile provided by the percentages in the first column are based on the total sample ("All Areas Combined"). The next six columns provide profiles for each of the six areas of focus of human factors work. The last column shows the profile for those who perform half or more of their work for the military, regardless of area of focus. Since somewhat more than half of these specialists worked in aerospace, there is a positive correlation between the aerospace and military profiles. Shading is used in each table to highlight differences among profiles. For any task, the percentage shown in a shaded cell is greater or lesser, by 15 percent or more, than the percentage given in the column for all areas combined.
As these tables reveal, some tasks were performed by most specialists across all areas. Prominent among these tasks were:
-
Task analyses,
-
Oral and written presentations,
-
Proposal preparation,
-
Application of human factors principles, and
-
Evaluation of reports written by others.
The range among tasks in the percentages of specialists performing them was great, however: from 90 to 11 percent. There are also wide ranges across areas of work for a given task. For example, 86 percent of specialists who work with computers design software-user interfaces, but only 16 percent of those who work in health and safety do. Thus, the task profile for any area of work must be obtained by inspecting the tables directly.
CHARACTERISTICS OF HUMAN FACTORS SPECIALISTS
Highest Academic Degree
Advanced degrees predominate the academic backgrounds of human factors specialists, with 37 percent having received doctorates and 34 percent having received master's degrees. The distributions of doctorate, master's, and bachelor's degrees in various work settings are provided in Table 3.12.
As shown in the table, those with doctorates' have greater representation among those employed by education institutions and government agencies; those who work on health and safety, computers, communications, and aerospace; and those who work mainly for the military. They have less representation among those in private business and those who work on industrial processes and transportation. The distribution of degrees among supervisors was no different from the distribution among nonsupervisors.
The areas of specialization of the highest degree were spread across a relatively broad spectrum—human factors, various fields of psychology,
TABLE 3.12 Distributions of Highest Academic Degree Among Human Factors Specialists in Different Work Settings
|
|
|
Employer |
Focus of Work |
|||||||||
|
Highest Academic Degree |
Total Sample |
Private Business |
Government Agency |
Education Institution |
Computers |
Aerospace |
Industrial Processes |
Health and Safety |
Communications |
Land Transportation |
Military |
|
|
Doctorate |
37 |
30 |
46 |
76 |
45 |
44 |
12 |
56 |
45 |
27 |
45 |
|
|
Master's |
34 |
36 |
31 |
21 |
32 |
40 |
39 |
24 |
27 |
37 |
33 |
|
|
Bachelor's |
24 |
28 |
22 |
1 |
2 |
14 |
35 |
10 |
28 |
29 |
21 |
|
|
Less than bachelor's |
5 |
6 |
0 |
2 |
1 |
2 |
14 |
10 |
0 |
7 |
1 |
|
|
Shaded cells indicate a significant difference (± 15%) from the percentage for the total sample. |
||||||||||||
engineering, business, computer science, industrial design, and a variety of other areas. Human factors was the area of specialization in only 20 percent of the total sample. Areas of specialization differed somewhat between supervisors and nonsupervisors; greater percentages of supervisors specialized in engineering and business, and lower percentages in human factors and various areas of psychology than did nonsupervisors.
Distributions of academic specialization differed also among those working in different areas. Table 3.13 shows distributions for the different areas of focus of human factors work as well as the distribution for those who work primarily for the military.
Although the table shows differences in the academic specialization of those who work in the different areas, the principal message is that no one area of specialization dominates any of the areas of work. The relatively wide spectrum that exists in the total sample also exists in the specific areas of work.
A relatively even distribution existed among human factors specialists in the number of years since receipt of the highest academic degree. This distribution is shown in Table 3.14 for both supervisors and nonsupervisors. The main difference among nonsupervisors and supervisors is the expected one for those with relatively recent degrees: recent graduates are less likely to be supervisors. This result matches the logic that some experience on the job is required prior to acquiring supervisory responsibilities.
Age, Gender, and Ethnic Origin
Over 60 percent of human factors specialists are under the age of 45; 15 percent are 55 or older. There are some differences in age distributions related to employer and to those who have supervisory responsibilities. As shown in Table 3.15, the greatest percentage (65 percent) of specialists under age 45 is found in private business, while the lowest percentage (36 percent) is in education institutions.
Compared with nonsupervisors, supervisors were mainly in the middle of the age distribution—69 percent of supervisors were 35 to 54 years of age while only 56 percent of nonsupervisors were in this range. Larger percentages of nonsupervisors were both 55 and older and under 35 than were supervisors.
Human factors specialists were predominately white males. Over 94 percent of the sample was white and over 81 percent was male. In some areas, male dominance was even greater. Of those with supervisory responsibilities, 87 percent were male, 13 percent female; of those who worked on industrial processes, 92 percent were male, 8 percent female; and of those who worked in health and safety, 86 percent were male, 14 percent female.
TABLE 3.13 Distributions of Areas of Academic Specialization Among Areas of Human Factors Work
|
|
Focus of Work |
|||||||
|
Area of Specialization of the Highest Academic Degree |
Total Sample |
Computers |
Aero-space |
Industrial Processes |
Health and Safety |
Communications |
Land Transportation |
Military |
|
Human factors |
20 |
20 |
28 |
18 |
12 |
20 |
24 |
24 |
|
Experimental psychology |
19 |
25 |
28 |
6 |
26 |
22 |
21 |
30 |
|
Engineering |
16 |
4 |
4 |
20 |
9 |
19 |
18 |
12 |
|
Business |
9 |
1 |
8 |
13 |
7 |
6 |
10 |
6 |
|
Other psychology |
8 |
9 |
14 |
3 |
4 |
7 |
11 |
12 |
|
Computer science |
4 |
9 |
4 |
3 |
0 |
0 |
7 |
3 |
|
Industrial design |
2 |
1 |
2 |
1 |
6 |
2 |
2 |
1 |
|
Other areas of specialization |
21 |
25 |
12 |
36 |
18 |
24 |
7 |
12 |
|
Shaded cells indicate a significant difference (± 15%) from the percentage for the total sample. |
||||||||
TABLE 3.14 Years Since Human Factors Specialists Received Their Highest Academic Degrees (percentage)
|
Years Since Highest Degree Received |
Nonsupervisors |
Supervisors |
|
5 or less |
27.9 |
15.0 |
|
6–10 |
20.6 |
23.5 |
|
11–15 |
15.0 |
17.7 |
|
16–20 |
10.3 |
21.0 |
|
More than 20 |
26.2 |
22.8 |
|
Total |
100.0 |
100.0 |
TABLE 3.15 Age Distribution of Human Factors Specialists (percentage)
|
Age |
Total Sample |
Private Business |
Government Agency |
Education Institution |
|
55 and over |
15.2 |
13.2 |
18.0 |
23.7 |
|
45–54 |
23.8 |
22.2 |
20.9 |
40.0 |
|
35–44 |
38.0 |
38.2 |
45.5 |
27.0 |
|
Under 35 |
23.0 |
26.4 |
15.6 |
9.3 |
|
Total |
100.0 |
100.0 |
100.0 |
100.0 |
Among those working on computers, the predominance of males was not quite so great: 70 percent were male, 30 percent female; and among those working on communications systems, 74 percent were male, 26 percent female.
With this characterization and description of human factors specialists and their work, we turn now to where they were educated, how that education is viewed by employee and employer, and how employees receive continuing education.


