
![]()
Energy Intensity Comparisons for Water, Rail, and Highway
Findings from the Available Research
Research on the question of energy efficiency usually compares some measure of energy intensity rates across modes (Comer et al. 2010; Kruse et al. 2013; Sebald 1974; USDOT 1994). Historical energy intensity comparisons between railroads and barges using British thermal units (Btu) per ton-mile (Davis et al. 2014) show that the energy efficiencies of both modes have improved. Since 1970, Class I freight rail improved by about 2 percent per year, and since 2000, rail and waterborne commerce energy intensities improved by about 1.6 and 1.8 percent per year, respectively (Davis et al. 2014, Table 2-15).
Some studies show barge to be more energy efficient, while others show rail as the more energy-efficient mode. In terms of British thermal units per ton-mile, Davis et al. report that rail (294 Btu/ton-mile in 2012) is 40 percent more energy intensive than barge (210 Btu/ton-mile in 2012), nearly the same percentage difference as reported by Kruse et al. (2013).1 These average energy intensity values represent the two-way transport average of upstream and downstream transport (upstream transport may require more energy to account for barge movement against downstream current velocities, and downstream transport energy may benefit from the river current). Alternatively, Dager (2013) reports even lower energy intensity for inland barge transport on the basis of independent data and fuel use modeling, corresponding to about 196 Btu/ton-mile, or about 60 percent better energy intensity than average rail. Moreover, commodity-specific
________________
1 Converting the report values in ton-miles per gallon reported by Kruse et al. (2013, Table 12) to British thermal units per ton-mile results in numbers consistent with those reported by Davis et al. (2014) for 2012, namely, 311 Btu/ton-mile and 223 Btu/ton-mile for rail and inland towing, respectively.
configurations may matter; for example, Dager reports that towboats moving on the Mississippi River between the mouth of the Missouri and Baton Rouge, Louisiana, averaged 867 ton-miles per gallon in 2011 versus the system average of 656. Baumel (2008) reported that unit grain trains moving from Iowa to New Orleans, Louisiana, had route-specific fuel efficiency of 640 ton-miles per gallon, 54 percent better than energy intensity for an average train.
Analysis of Selected Major Waterway Corridors
The committee examined route comparisons across major waterway corridors with respect to metrics important to modal performance: (a) distance measured geographically, (b) transport time using typical average speeds by mode, and (c) modal energy estimates per ton of cargo by multiplying the energy intensity by route distances. The analysis was conducted with data from Davis et al. (2014), Kruse et al. (2013), and Dager (2013).
Figure G-1 shows the distance and typical transport time for the Ohio River corridor (between Pittsburgh, Pennsylvania, and Saint
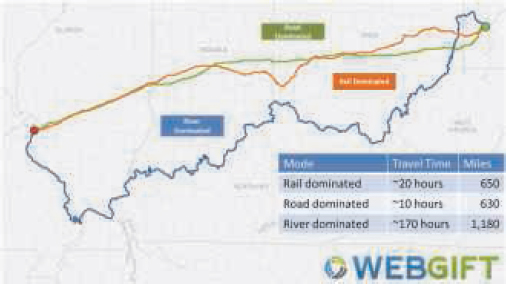
FIGURE G-1 Dominant modal routes and characteristic distances and travel times for transport between Pittsburgh and Saint Louis.
TABLE G-1 Comparison of Energy Use per Ton of Cargo Between Pittsburgh and Saint Louis
| Mode | Distance (miles) | Energy Intensity (Btu per ton-mile) | Btu per Ton Moved | Difference Using Water Mode | ||
| Rail average value | 650 | 294 | 191,100 | |||
| Water (using Davis et al. 2014 average value) | 1,180 | 210 | 247,800 | 30% more energy | ||
| Water (using Dager 2013 average value) | 196 | 231,000 | 21% more energy | |||
Louis, Missouri) for rail, road, and river routes. The online tool WebGIFT (http://webgift.rit.edu/) was used in developing the figure. Other routes describing major corridors include the Lower Mississippi (Saint Louis to New Orleans), Upper and Lower Mississippi (Minneapolis, Minnesota, to New Orleans), and Columbia River (Pasco, Washington, to Portland, Oregon); distances and times summarized for these routes were also obtained with WebGIFT (maps not shown).
Tables G-1 through G-4 below provide a first-order comparison of energy use per ton of cargo that combines mode-related differences in geographic distances of routes with energy intensity differences. The
TABLE G-2 Comparison of Energy Use per Ton of Cargo Between Saint Louis and New Orleans
| Mode | Distance (miles) | Energy Intensity (Btu per ton-mile) | Btu per Ton Moved | Difference Using Water Mode | ||
| Rail average value | 710 | 294 | 208,700 | |||
| Water (using Davis et al. 2014 average value) | 1,100 | 210 | 231,000 | 11% more energy | ||
| Water (using Dager 2013 average value) | 196 | 215,000 | 3% more energy | |||
TABLE G-3 Comparison of Energy Use per Ton of Cargo Between Minneapolis and New Orleans
| Mode | Distance (miles) | Energy Intensity (Btu per ton-mile) | Btu per Ton Moved | Difference Using Water Mode | ||
| Rail average value | 1,280 | 294 | 376,000 | |||
| Water (using Davis et al. 2014 average value) | 1,750 | 210 | 368,000 | 2% less energy | ||
| Water (using Dager 2013 average value) | 196 | 343,000 | 9% less energy | |||
analysis focuses on rail since, as explained in Chapter 2, highways are not usually an option for moving the cargo shipped by barge. The comparisons account for the potentially greater circuity of rivers than railroads in some corridors. The calculations for typical corridor-scale routes show that barge movements on the Ohio River and Lower Mississippi River use more energy than rail transport for the same origin–destination pairs, if system-average energy intensities are assumed, but that typical corridor-scale routes on the Upper and Lower Mississippi River and the Columbia River corridors may be more energy efficient than rail transport.
TABLE G-4 Comparison of Energy Use per Ton of Cargo Between Pasco and Portland
| Mode | Distance (miles) | Energy Intensity (Btu per ton-mile) | Btu per Ton Moved | Difference Using Water Mode | ||
| Rail average value | 230 | 294 | 67,600 | |||
| Water (using Davis et al. 2014 average value) | 230 | 210 | 48,300 | 29% less energy | ||
| Water (using Dager 2013 average value) | 196 | 45,000 | 33% less energy | |||
References
ABBREVIATION
| USDOT | U.S. Department of Transportation |
Baumel, C. P. 2008. The Mississippi River System Shallow Draft Barge Market—Perfectly Competitive or Oligopolistic? Journal of the Transportation Research Forum, Vol. 47, No. 4, pp. 5–18.
Comer, B., J. J. Corbett, J. S. Hawker, K. Korfmacher, E. E. Lee, C. Prokop, and J. J. Winebrake. 2010. Marine Vessels as Substitutes for Heavy-Duty Trucks in Great Lakes Freight Transportation. Journal of Air and Waste Management, Vol. 60, Issue 7, pp. 884–890.
Dager, C. A. 2013. Fuel Tax Report, 2011. Center for Transportation Research, University of Tennessee, Knoxville.
Davis, S. C., S. W. Diegel, and R. G. Boundy. 2014. Transportation Energy Data Book, 33rd ed. Oak Ridge National Laboratory, Oak Ridge, Tenn.
Kruse, C. J., D. Ellis, A. Protopapas, and N. Norboge. 2013. New Approaches for U.S. Lock and Dam Maintenance and Funding. Texas A&M Transportation Institute, Texas A&M University, College Station.
Sebald, A. V. 1974. Energy Intensity of Barge and Rail Freight Hauling, CAC Document 127, Center for Advanced Computing, University of Illinois at Urbana Champaign, May 1974. https://www.ideals.illinois.edu/bitstream/handle/2142/32274/energyintensityo127seba.pdf?sequence=2,.
USDOT Maritime Administration. 1994. Environmental Advantages of Barge Transportation, Final Report.


