
Appendix F
Annex to Chapter 3: Agency-level Data
The following section uses data provided by the awarding agencies to describe patterns for awards and applications. Because agencies did not provide identical data, the section does not provide the same analysis for each agency.
DEPARTMENT OF DEFENSE
Phase I STTR
The overall numbers of DoD Phase I STTR applications grew steadily from 2003 to 2006 but have declined since 2008 (see Figure F-1).
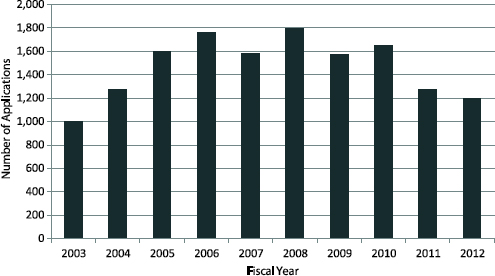
FIGURE F-1 Phase I STTR applications at DoD, FY2003-2012.
SOURCE: Data provided by DoD.
The decline in STTR applications after 2008 parallels a decline in SBIR applications, but it is steeper. The number of applications declined by one-third, from a peak of 1,796 in 2008 to a low of 1,198 in 2012, while the number of SBIR applications declined by about 15 percent.1 Applications and awards did not track closely at DoD. In particular, the number of awards did not mirror the high number of applications received during FY2005-2010 (see Figure F-2). As a result, the success rates for DoD STTR applications varied substantially from a high in FY2004 to a low in FY2008, but then largely leveled out again from FY2009 through 2012 (see Figure F-3). Success rates for STTR applications during the study period averaged 21.5 percent. In comparison, the average success rate for DoD’s SBIR program was somewhat lower, at 14.2 percent.2
Phase II STTR
DoD was particularly affected by the changes mandated under STTR program reauthorization. The requirement that all Phase I winners be permitted to apply for Phase II forced DoD to change its selection procedure substantially
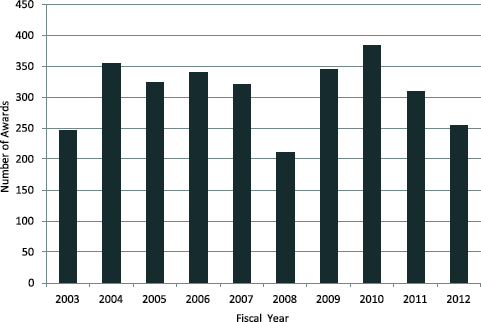
FIGURE F-2 Phase I STTR awards at DoD, FY2003-2012.
SOURCE: Data provided by DoD.
________________
1National Research Council, SBIR at the Department of Defense, Washington, DC: The National Academies Press, 2014, p. 28. Effective July 1, 2015, the institution is called the National Academies of Sciences, Engineering, and Medicine. References in this report to the National Research Council or NRC are used in an historic context identifying programs prior to July 1.
2National Research Council, SBIR at the Department of Defense, p. 30.
and led to a considerable increase in Phase II applications in FY2011 and FY2012 (see Figure F-4).
The increase in Phase II applications did not translate into an increase in the number of awards, which, in fact, declined quite sharply during the same time period (see Figure F-5).
Phase II success rates changed after the 2011 reauthorization (see Figure F-6). Previously, DoD components selected which Phase I projects to invite to apply for Phase II and typically selected less than two per topic. These actions limited the number of Phase II applicants. After reauthorization, all agencies are required to permit all Phase I winners to apply for Phase II. According to Dusty Lang, the Navy STTR manager, this change both reduced success rates and added considerable administrative burdens to both the agency and the companies.3 Reasons for the extremely high Phase II success rate in 2010 have not been determined.
STTR Awards by Component
Tables F-1 and F-2 show trends in STTR Phase I and Phase II awards by DoD component, respectively. The substantial decline in STTR Phase I awards at DoD after 2010 is driven largely by the sharp declines at Navy and Air Force and to a lesser extent at Army as well.
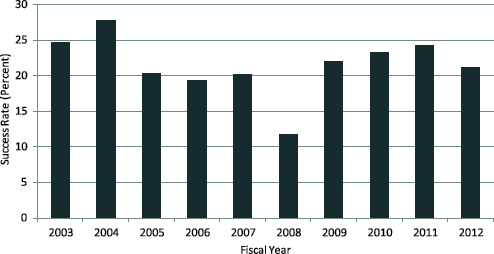
FIGURE F-3 Phase I STTR success rates at DoD, FY2003-2012.
NOTE: The success rate is the number of awards as a percentage of the number of applications.
SOURCE: Data provided by DoD.
________________
3Interview with Dusty Lang, Navy STTR program manager, September 14, 2015.
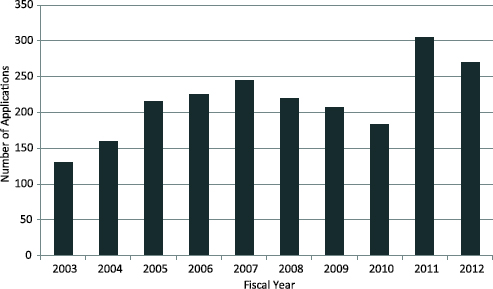
FIGURE F-4 Phase II STTR applications at DoD, FY2003-2012.
SOURCE: Data provided by DoD.
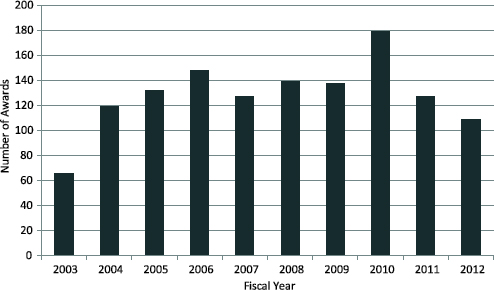
FIGURE F-5 Phase II STTR awards at DoD, FY2003-2012.
SOURCE: Data provided by DoD.
NATIONAL INSTITUTES OF HEALTH
Phase I STTR
NIH offers three deadlines annually for STTR awards. Unlike DoD, NASA, and DoE, it will consider funding any project that aligns with its
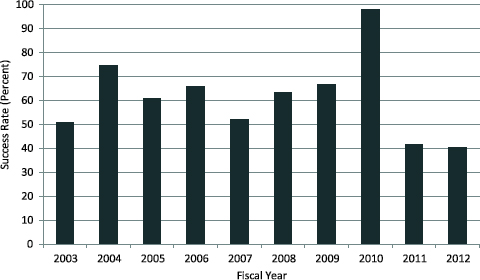
FIGURE F-6 STTR Phase II success rates at DoD, FY2003-2012.
SOURCE: Data provided by DoD.
TABLE F-1 Number of STTR Phase I Awards
| Component | Fiscal Year | ||||||||||
| 2005 | 2006 | 2007 | 2008 | 2009 | 2010 | 2011 | 2012 | 2013 | 2014 | Total | |
| Navy | 96 | 116 | 95 | 93 | 120 | 151 | 117 | 62 | 39 | 59 | 948 |
| Air Force | 106 | 87 | 107 | 31 | 145 | 125 | 87 | 100 | 45 | 53 | 886 |
| Army | 48 | 79 | 41 | 63 | 6 | 64 | 63 | 42 | 35 | 36 | 477 |
| MDA | 30 | 28 | 24 | 25 | 25 | 19 | 12 | 29 | 24 | 216 | |
| DARPA | 24 | 17 | 16 | 19 | 41 | 9 | 22 | 24 | 10 | 182 | |
| OSD | 20 | 13 | 37 | 4 | 8 | 9 | 23 | 16 | 19 | 149 | |
| Component not recorded | 34 | 34 | |||||||||
| Total | 324 | 340 | 320 | 210 | 345 | 383 | 309 | 254 | 225 | 182 | 2,892 |
NOTE: The very small number of awards at several components in 2013 is not explained in the DoD annual STTR report, although it seems likely that it reflects tracking issues, as the number of award not assigned to any component was much higher in that year than in any other.
SOURCE: Data provided by SBA.
TABLE F-2 Number of STTR Phase II Awards
| Component | Fiscal Year | ||||||||||
| 2005 | 2006 | 2007 | 2008 | 2009 | 2010 | 2011 | 2012 | 2013 | 2014 | Total | |
| Air Force | 49 | 43 | 38 | 29 | 46 | 66 | 28 | 36 | 5 | 43 | 383 |
| Army | 26 | 33 | 31 | 37 | 22 | 33 | 31 | 18 | 3 | 23 | 257 |
| DARPA | 8 | 6 | 7 | 10 | 8 | 15 | 3 | 2 | 3 | 16 | 78 |
| MDA | 16 | 16 | 12 | 9 | 8 | 13 | 6 | 12 | 6 | 12 | 110 |
| Navy | 33 | 42 | 33 | 52 | 43 | 41 | 44 | 13 | 5 | 22 | 328 |
| OSD | 8 | 5 | 2 | 8 | 4 | 3 | 5 | 1 | 4 | 40 | |
| SOE | 1 | 1 | |||||||||
| Component | |||||||||||
| not recorded | 1 | 3 | 7 | 12 | 23 | 103 | 1 | 150 | |||
| Total | 132 | 148 | 127 | 139 | 138 | 179 | 127 | 109 | 126 | 122 | 1,347 |
NOTE: SBA data for 2013 appear to be misallocated, with almost all awards in the SBA database marked as blank for component.
SOURCE: Data provided by SBA.
mission, that is, the project does not have to address a specific topic from the solicitation. The number of Phase I applications to NIH declined between FY2007 and 2011, before expanding again in 2012-2014, and especially in 2014 (see Figure F-7). NIH averaged 647 Phase I STTR applications annually over the study period.
The total number of Phase I STTR awards at NIH fell during the first part of the study period, tracking a similar decline in SBIR awards. The number of awards began to increase again in 2012, especially in 2014 (see Figure F-8). Across the study period, NIH made an average of 120 awards annually.
Phase I STTR success rates at NIH remained relatively stable across the study period, varying from slightly less than 15 percent to more than 20 percent, and averaging 18.7 percent. This was close to the success rate for Phase I SBIR at NIH (see Figure F-9).4
Phase II STTR
Phase II applications at NIH are largely but not entirely driven by the number of Phase I awards made in the previous year. After rising sharply in 2005 and 2006 to a peak of 128 in 2007, the number of Phase II applications declined to about 70 in 2012 and 2013 before increasing again in 2014 (see Figure F-10). Given the substantial increase in Phase I awards made in 2014, it seems likely that the 2015 data will show another sharp increase in the number of Phase II applications.
________________
4NIH RePorter database, Table 216.
Award numbers are more volatile than application numbers. Awards increased early in the study period, peaking at 46 in 2008 before declining to below 20 in 2013 and increasing again in 2014 to 37 (see Figure F-11).
Phase II STTR success rates were more volatile than those for Phase I,
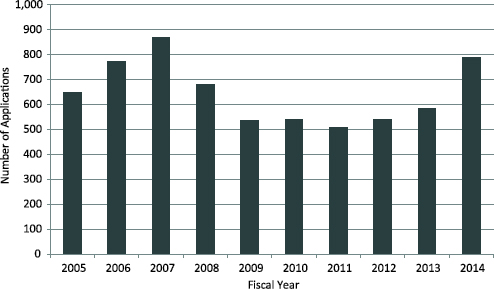
FIGURE F-7 STTR Phase I STTR applications at NIH, FY2005-2014.
SOURCE: NIH RePorter database, Table 216.
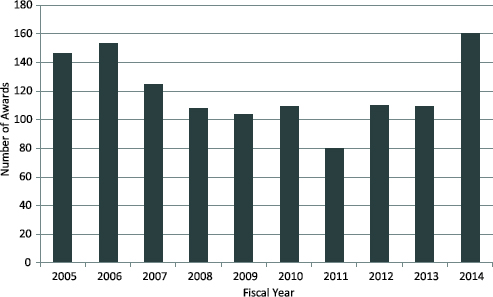
FIGURE F-8 Phase I STTR awards at NIH, FY2005-2014.
SOURCE: NIH RePorter database, Table 216.
ranging from a high of almost 50 percent in 2005 to a low of 26 percent in 2006 and 2013 (see Figure F-12). The average success rate was 35.2 percent (and that for SBIR was 38.2 percent.5
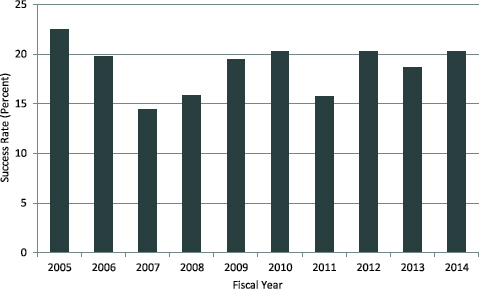
FIGURE F-9 Phase I STTR success rates at NIH, FY2005-2014.
SOURCE: NIH RePorter database, Table 216.
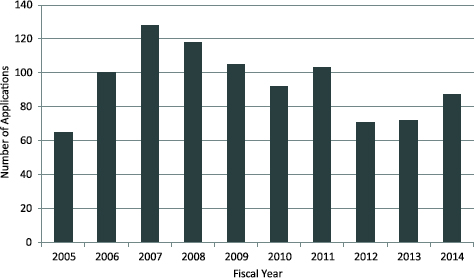
FIGURE F-10 Phase II STTR applications at NIH, FY2005-2014.
SOURCE: NIH RePorter database, Table 216.
________________
5NIH RePorter database, Table 126.
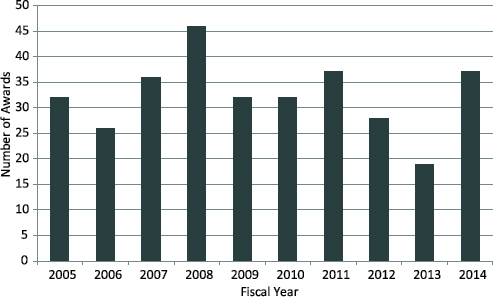
FIGURE F-11 Phase II STTR awards at NIH, FY2005-2014.
SOURCE: NIH RePorter database, Table 216.
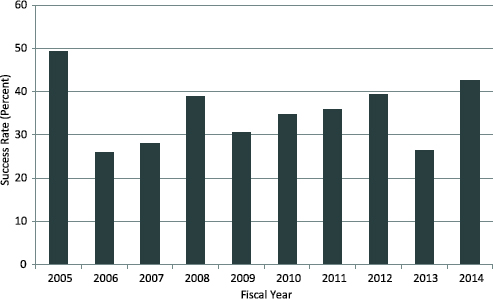
FIGURE F-12 Phase II STTR success rates at NIH, FY2005-2014.
SOURCE: NIH RePorter database, Table 216.
STTR Fast Track
NIH maintains a separate dataset covering applications and awards for Fast Track—a program through which applicants can seek funding for Phase I and Phase II through a single initial application. The number of applications was steady at just over 40 per year, with fewer in 2012 and more in 2007 and 2014 (see Figure F-13).
Since Fast Track application appears advantageous to applicants, discussions were held with NIH award recipients to assess why there are fewer applications made through Fast Track than through the traditional approach. The results suggest that many applicants believe that it is more difficult to win a Fast Track award than a Phase I award, and that NIH staff tends to discourage Fast Track applications. There is however no NIH policy to discourage Fast Track applications, according to program staff.
Although the number of Fast Track applications remained largely steady across the study period except for FY2012 and FY2014, the number of awards varied substantially in percentage terms, largely because of the small absolute numbers of awards. The difference between 4 awards (the minimum) and 12 awards (the maximum) in absolute terms is not all that large, though it represents a 300 percent increase (see Figure F-14).
High variation among the small number of Fast Track awards was also reflected in the volatility in the Fast Track success rates, which ranged from a high of 34 percent in 2012 to a low of 8 percent in 2014 (see Figure F-15).
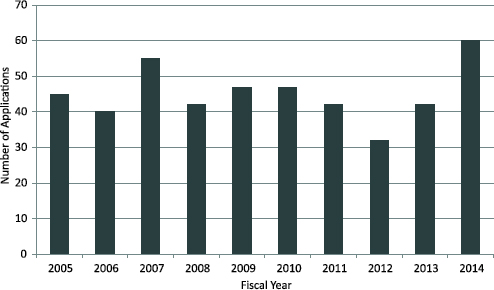
FIGURE F-13 STTR Fast Track applications at NIH, FY2005-2014.
SOURCE: NIH RePorter database, Table 216.
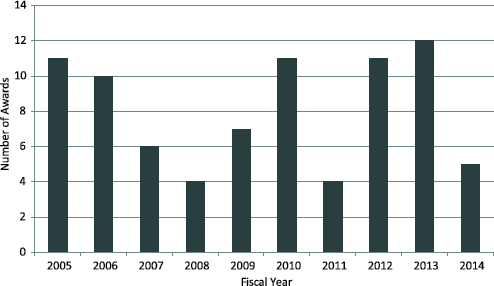
FIGURE F-14 STTR Fast Track awards at NIH, FY 2005-2014.
SOURCE: NIH RePorter database, Table 216
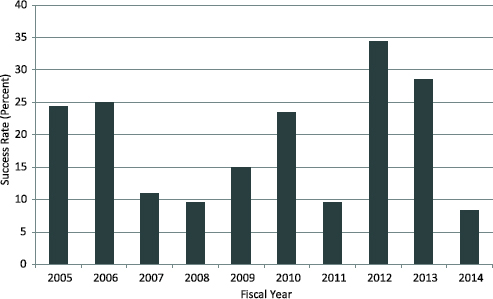
FIGURE F-15 Fast Track success rates at NIH, FY2005-2014.
SOURCE: NIH RePorter database, Table 216.
NATIONAL AERONAUTICS AND SPACE ADMINISTRATION
Phase I STTR
The number of STTR Phase I STTR awards at NASA varied sharply across the study period from a low of 101 in FY2008 to a high of almost 250 in FY2012, before declining to 101 in 2014. There were no STTR awards in 2013 due to changes in deadlines (see Figure F-16).
Over the study period, the number of Phase I STTR awards expanded from 20-25 in FY2004-2005 to 40-45 in FY2012-2014. It is unclear whether the current level will be sustained into the future, particularly in light of the recent decline in applications (see Figures F-16 and F-17).
A review of success rates reveals considerable volatility in rates, with an outlier of 39 percent in 2014 (see Figure F-18).
Phase II STTR
As with other agencies, Phase II applications at NASA are largely driven by the number of previous Phase I awards. Application levels were relatively steady during the study period, with the exception of FY2009-2011, which show the effect of ARRA funding (see Figure F-19).
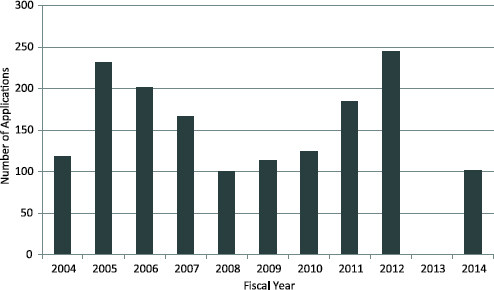
FIGURE F-16 NASA STTR Phase I STTR applications at NASA, FY2004-2014.
NOTE: Applications data for 2013 were not available.
SOURCE: Data provided by NASA.
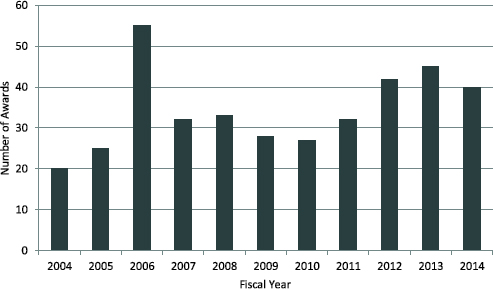
FIGURE F-17 Phase I STTR Phase Awards at NASA, FY2004-2014.
SOURCE: Data provided by NASA.
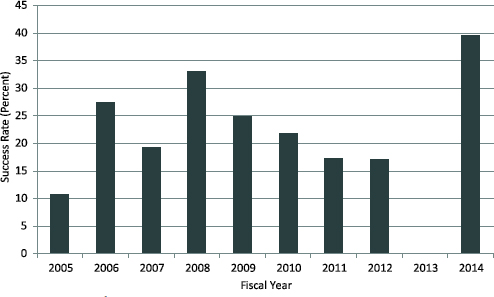
FIGURE F-18 Phase I STTR success rates at NASA, FY2004-2014.
NOTE: The absence of data for 2013 reflects the absence of applications data for that year.
SOURCE: Data provided by NASA.
Award levels doubled in 2008, from 8-9 in the preceding 3 years, and, with the exception of FY2011, remained at or above 15 awards annually through FY2013 (see Figure F-20).
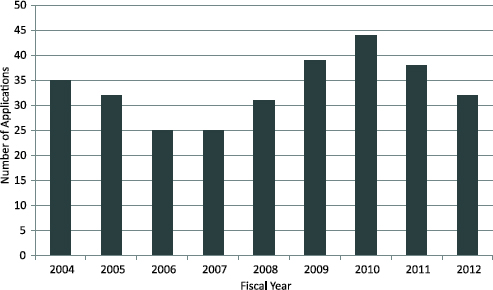
FIGURE F-19 Phase II STTR applications at NASA, FY2004-2012.
SOURCE: Data provided by NASA.
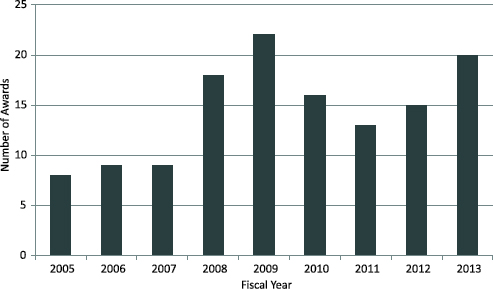
FIGURE F-20 Phase II STTR awards at NASA, FY2005-2013.
SOURCE: Data provided by NASA.
Success rates for Phase II STTR applications varied widely, from 25 percent in 2005 to greater than 50 percent in FY2008-2009, ranging between 34 and 47 percent through FY2012. The overall average from FY2005 through FY2012 was approximately 40 percent (see Figure F-21).
STTR Awards by Company
Although the 20 most prolific winners of NASA STTR of Phase I awards and of Phase II awards did not win large numbers of awards—the most prolific company won 14 Phase I awards and 7 Phase II awards during the 8-year study period—together they accounted for a substantial share of awards: 30 percent of Phase I awards and 36 percent of Phase II (see Table F-3).
TABLE F-3 STTR Awards at NASA by Company, FY2005-2012
| Top 20 Phase I Company | Number of Awards | Top 20 Phase II Company | Number of Awards | |
| CFD Research | 14 | CFD Research | 7 | |
| Nanosonic | 8 | Qualtech Systems | 4 | |
| Luna Innovations | 7 | Intelligent Fiber Optic Systems | 4 | |
| Aurora Flight Sciences | 6 | Rolling Hills Research | 4 | |
| Rolling Hills Research | 6 | Aurora Flight Sciences | 3 | |
| Streamline Numerics | 6 | Applied Sensor Research & Development | 3 | |
| Intelligent Fiber Optic Systems | 6 | Streamline Numerics | 3 | |
| Applied Sensor Research & Development | 5 | Tetra Research | 3 | |
| Tao of Systems Integration | 5 | TRACLabs | 3 | |
| Combustion Research and Flow | ||||
| TRACLabs | 5 | Technology | 3 | |
| Tetra Research | 4 | Luna Innovations | 3 | |
| Intelligent Automation | 4 | Mnemonics | 2 | |
| Qualtech Systems | 4 | Space Micro | 2 | |
| Innosense | 4 | Sigma Space | 2 | |
| American GNC | 4 | Balcones Technologies | 2 | |
| TDA Research | 4 | Sustainable Innovations | 2 | |
| Balcones Technologies | 4 | Creare | 2 | |
| Plasma Processes | 4 | Advanced Powder Solutions | 2 | |
| ZONA Technology | 4 | HyPerComp Engineering | 2 | |
| Combustion Research and Flow Technology | 3 | Sikorsky Aircraft (formerly Impact Technologies) | 2 | |
| Top 20 Total | 107 | Top 20 Total | 58 | |
| Total | 354 | Total | 160 | |
| Top 20 Percentage | 30.2 | Top 20 Percentage | 36.3 | |
SOURCE: Data provided by NASA.
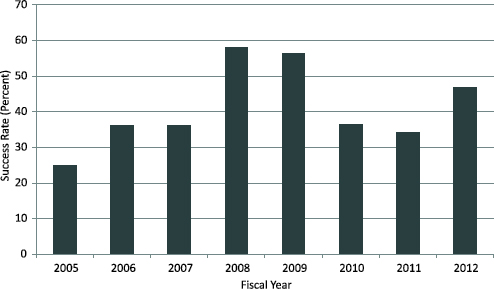
FIGURE F-21 Phase II STTR success rates at NASA, FY2005-2012.
SOURCE: Data provided by NASA.
STTR Awards by State
The distribution of awards by state may be influenced by the location of NASA research centers. States with centers may develop local innovation clusters which help SBCs to compete effectively for STTR awards. Total Phase I Awards (354) by state for the 8-year period FY2005-2012 are shown in Table F-4. Total Phase II Awards (160) by state for the 9-year period FY2004-2012 are shown in Table F-5.
NATIONAL SCIENCE FOUNDATION
Phase I STTR
The number of Phase I STTR applications at NSF varied substantially over the study period. According to NSF staff, the especially low number of applications in FY2011-2012 resulted from a pilot initiative to separate STTR and SBIR topics, creating separate topics for the former. This initiative was not popular with companies, who failed to respond, and has since been terminated. The number of applications rebounded as a result, with FY2014 seeing the highest number of applications across the study period, at almost 400 (see Figure F-22).
Phase I STTR awards at NSF tracked applications fairly well over the entire period. (See Figure F-23.)
TABLE F-4 Phase I STTR Awards at NASA by State, FY2005-2012
| State | Number of Awards |
| AL | 27 |
| AZ | 9 |
| CA | 66 |
| CO | 12 |
| CT | 10 |
| DE | 2 |
| FL | 15 |
| GA | 2 |
| ID | 1 |
| IL | 10 |
| IN | 1 |
| KS | 3 |
| KY | 2 |
| MA | 29 |
| MD | 21 |
| MI | 3 |
| MN | 3 |
| MO | 1 |
| MS | 5 |
| MT | 3 |
| NC | 1 |
| NH | 3 |
| NJ | 7 |
| NV | 2 |
| NY | 8 |
| OH | 8 |
| OK | 1 |
| OR | 1 |
| PA | 13 |
| TN | 1 |
| TX | 29 |
| UT | 4 |
| VA | 42 |
| VT | 1 |
| WA | 4 |
| WI | 4 |
| Total | 354 |
SOURCE: Data provided by NASA.
TABLE F-5 Phase II STTR Awards at NASA by State, FY2004-2012
| State | Number of Awards |
| AL | 11 |
| AZ | 5 |
| CA | 27 |
| CO | 4 |
| CT | 8 |
| DE | 1 |
| FL | 10 |
| GA | 1 |
| ID | 1 |
| IL | 5 |
| KS | 2 |
| MA | 10 |
| MD | 12 |
| MI | 3 |
| MN | 1 |
| MS | 2 |
| MT | 2 |
| NH | 2 |
| NJ | 3 |
| NV | 1 |
| NY | 4 |
| OH | 3 |
| OK | 1 |
| PA | 7 |
| TX | 16 |
| UT | 3 |
| VA | 12 |
| VT | 1 |
| WA | 2 |
| Total | 160 |
SOURCE: Data provided by NASA.
Phase I STTR success rates ranged from more than 20 percent from FY2004 to FY2009 to less than 20 percent thereafter, with the exception of FY2012, when the success rate shot up (see Figure F-24). Overall, across the
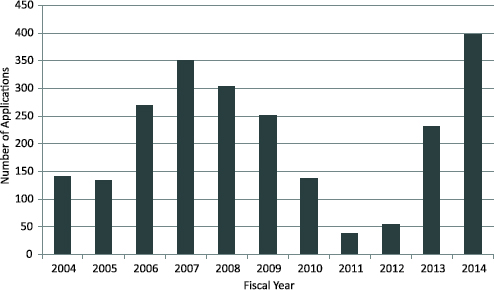
FIGURE F-22 Phase I STTR applications at NSF, FY2004-2014.
SOURCE: Data provided by NSF.
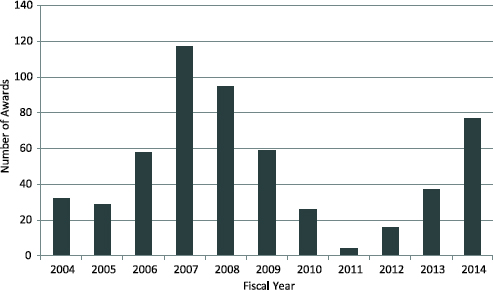
FIGURE F-23 Phase I STTR awards at NSF, FY2004-2014.
SOURCE: Data provided by NSF.
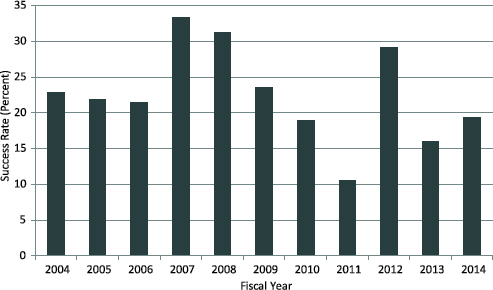
FIGURE F-24 Phase I STTR success rates at NSF, FY2004-2014.
SOURCE: Data provided by NSF.
entire study period, the success rate for Phase I STTR applications at NSF was 22.6 percent. This compares with 18.1 percent for SBIR at NSF during the same period.
Phase II STTR
As with other agencies, Phase II applications are largely driven by the number of Phase I awards made during the previous cycle. Figure F-25 shows a ramp up of Phase II STTR applications from FY2005 to FY2009, following the ramp up of Phase I awards from FY2005 to FY2007.
NSF STTR Phase II awards were particularly high in FY2008-2009, and trended down thereafter (see Figure F-26).
After the high success rates in FY2005-2006, success rates mostly varied between 30 and 40 percent (see Figure F-27). Across the 10-year study period, FY2005-2014, the average success rate for Phase II applications was 40.4 percent. The average for SBIR during the same period was 43.9 percent.
DEPARTMENT OF ENERGY
Phase I STTR
STTR applications at DoE generally remained stable during the study period. Applications averaged about 250 annually from FY2005 to FY2015 (excluding the unique ARRA solicitation in 2010) (see Figure F-28). DoE’s
application process is unique among the study agencies, in that applicants may apply simultaneously for STTR and SBIR funding. While this increases the number of applicants for STTR, it also provides what could be viewed as
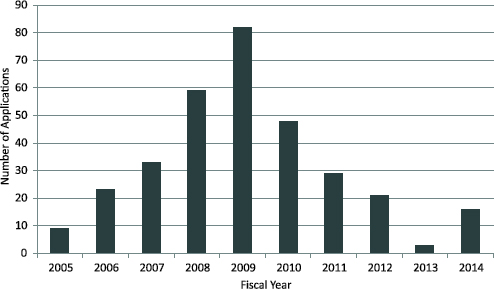
FIGURE F-25 Phase II STTR applications at NSF, FY2005-2014.
SOURCE: Data provided by NSF.

FIGURE F-26 Phase II STTR awards at NSF, FY 2005-2014.
SOURCE: Data provided by NSF.
application data that do not accurately reflect those applicants who are focused on STTR. There is no cost and no penalty to apply for both programs, as a joint application simply requires an additional checkbox entry.
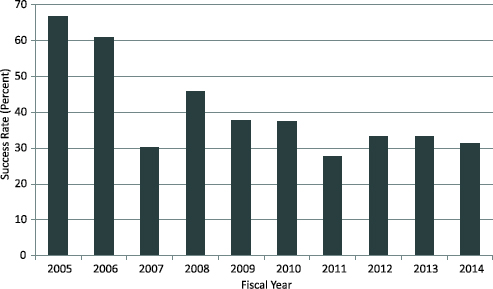
FIGURE F-27 Phase II STTR success rates at NSF, FY2005-2014.
SOURCE: Data provided by NSF.
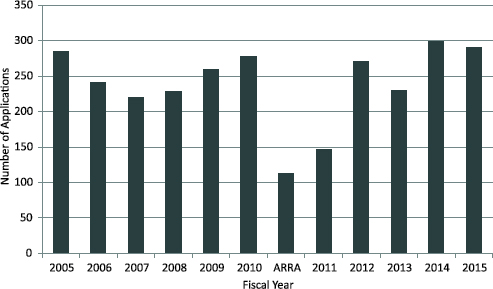
FIGURE F-28 Phase I STTR applications at DoE, FY2005-2015.
SOURCE: Data provided by DoE.
The Phase I STTR award pattern closely followed that of applications (see Figure F-29). DoE on average awarded 36 Phase I STTR awards annually (excluding the ARRA solicitation).
The close relationship between application and award patterns reflects a stable success rate (see Figure F-30). These rates are artificially low because they express Phase I STTR awards as a percentage of all applicants who checked the STTR box on the application form. Many of those were subsequently assigned to SBIR.
Phase II STTR
The steady number of Phase I STTR awards made by DoE underpins the steady flow of Phase II applications across the study period. Applications averaged 35 annually, which suggests that only 1 of the 36 Phase I projects on average per year across the study period did not apply for Phase II funding (see Figure F-31). This unusually high ratio will be explored further in an Academies report on the DoE SBIR-STTR programs, due in 2016.
Since reauthorization, Phase II STTR applications can also include Phase I SBIR winners, although DoE does not report these numbers separately. According to the DoE Program Office, it is rare for Phase I SBIR projects to apply for Phase II STTR.
During the study period, the number of Phase II awards varied from a low of 11 in the sequestration year, FY2012, to a high of 22 in FY2011. Despite
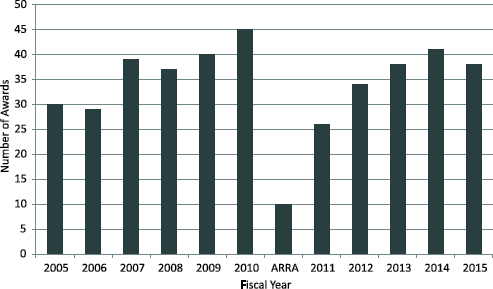
FIGURE F-29 Phase I STTR awards at DoE, FY2005-2015.
SOURCE: Data provided by DoE.
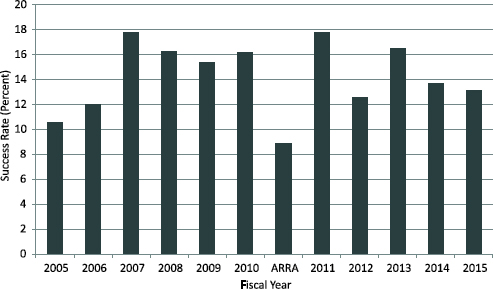
FIGURE F-30 Phase I STTR success rates at DoE, FY2005-2015.
SOURCE: Data provided by DoE.
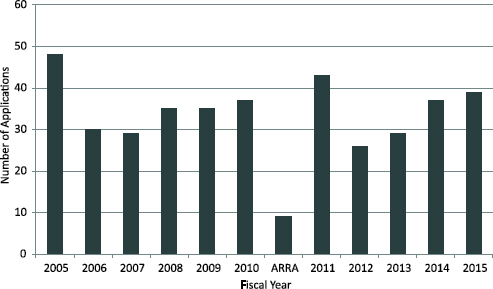
FIGURE F-31 Phase II STTR applications at DoE, FY2005-2015.
SOURCE: Data provided by DoE.
the apparent volatility, in most years DoE made between 13 and 20 awards, with an average of 16.5 (see Figure F-32, excluding the ARRA data).
The balance between awards and applications means that DoE’s success rate for Phase II STTR has been very stable, with an average success rate of 47 percent (see Figure F-33).
AWARDS BY STATE
Table F-6 shows the total number of STTR Phase I awards by state for all five agencies, along with total funding and overall share of awards by state. Previous analysis by the Academies has shown that the distribution of awards is driven primarily by state population, and then by the percentage of scientists and engineers in the working population.6 Table F-7 shows the STTR Phase II awards by state.
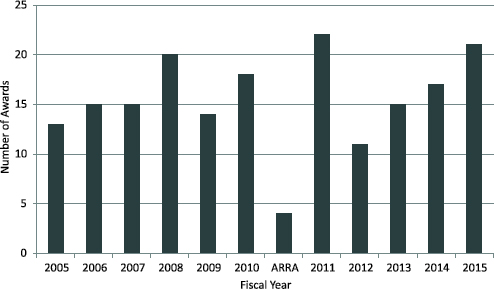
FIGURE F-32 Phase II STTR awards at DoE, FY2005-2015.
SOURCE: Data provided by DoE.
________________
6National Academies, An Assessment of the SBIR Program, Washington, DC: The National Academies Press, 2008, Chapter 3.
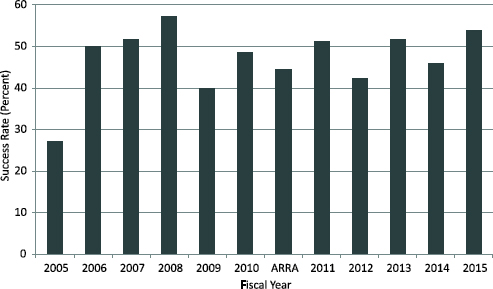
FIGURE F-33 Phase II STTR success rates at DoE, FY2005-2015.
SOURCE: Data provided by DoE.
TABLE F-6 Phase I STTR: Numbers, Amounts, and Shares of Awards by State for All Five Study Agencies, FY2005-2014
| State | Number of Awards | Amount (Millions of Dollars) | Share of Awards (Percent) |
| AL | 134 | 15.4 | 2.5 |
| AR | 34 | 7.0 | 0.6 |
| AZ | 113 | 14.9 | 2.1 |
| CA | 910 | 124.0 | 16.8 |
| CO | 220 | 27.3 | 4.1 |
| CT | 90 | 15.2 | 1.7 |
| DC | 9 | 1.9 | 0.2 |
| DE | 36 | 4.3 | 0.7 |
| FL | 154 | 18.7 | 2.8 |
| GA | 84 | 12.1 | 1.5 |
| HI | 15 | 1.7 | 0.3 |
| IA | 26 | 4.2 | 0.5 |
| ID | 8 | 0.8 | 0.1 |
| IL | 181 | 21.8 | 3.3 |
| IN | 59 | 8.5 | 1.1 |
| KS | 19 | 2.2 | 0.4 |
| KY | 57 | 10.9 | 1.1 |
| LA | 9 | 2.9 | 0.2 |
| State | Number of Awards | Amount (Millions of Dollars) | Share of Awards (Percent) |
| MA | 624 | 78.6 | 11.5 |
| MD | 249 | 35.3 | 4.6 |
| ME | 10 | 1.4 | 0.2 |
| MI | 130 | 17.9 | 2.4 |
| MN | 55 | 9.6 | 1.0 |
| MO | 45 | 6.1 | 0.8 |
| MS | 14 | 1.8 | 0.3 |
| MT | 29 | 4.8 | 0.5 |
| NC | 136 | 27.1 | 2.5 |
| NE | 18 | 3.3 | 0.3 |
| NH | 64 | 7.6 | 1.2 |
| NJ | 123 | 14.2 | 2.3 |
| NM | 70 | 7.6 | 1.3 |
| NV | 18 | 3.3 | 0.3 |
| NY | 241 | 36.5 | 4.4 |
| OH | 201 | 24.8 | 3.7 |
| OK | 23 | 4.3 | 0.4 |
| OR | 71 | 13.8 | 1.3 |
| PA | 184 | 28.4 | 3.4 |
| PR | 1 | 0.3 | 0.0 |
| RI | 13 | 2.1 | 0.2 |
| SC | 31 | 6.0 | 0.6 |
| SD | 6 | 0.8 | 0.1 |
| TN | 37 | 5.8 | 0.7 |
| TX | 267 | 34.4 | 4.9 |
| UT | 65 | 8.4 | 1.2 |
| VA | 355 | 42.2 | 6.5 |
| VT | 10 | 1.2 | 0.2 |
| WA | 83 | 12.5 | 1.5 |
| WI | 65 | 9.6 | 1.2 |
| WV | 12 | 1.2 | 0.2 |
| WY | 8 | 0.9 | 0.1 |
| Total | 5,416 | 745.6 | 100.0 |
SOURCE: SBA SBIR/STTR database.
TABLE F-7 Numbers, Amounts, and Shares of Awards by State for All Study Agencies, FY2005-2014
| State | Number of Awards | Amount Share of (Millions Awards of Dollars | Share of Awards (Percent) | State | Number of Awards | Amount (Millions of Dollars | Share of Awards (Percent) | |
| AL | 37 | 27.6 | 2.7 | NC | 19 | 13.4 | 1.4 | |
| AZ | 37 | 26.0 | 2.7 | ND | 1 | 0.4 | 0.1 | |
| CA | 234 | 168.0 | 17.4 | NE | 4 | 2.5 | 0.3 | |
| CO | 66 | 46.1 | 4.9 | NH | 15 | 12.8 | 1.1 | |
| CT | 9 | 6.5 | 0.7 | NJ | 33 | 22.9 | 2.4 | |
| DC | 1 | 0.7 | 0.1 | NM | 23 | 15.8 | 1.7 | |
| DE | 9 | 7.0 | 0.7 | NV | 2 | 0.8 | 0.1 | |
| FL | 36 | 23.4 | 2.7 | NY | 65 | 44.5 | 4.8 | |
| GA | 22 | 15.8 | 1.6 | OH | 55 | 39.8 | 4.1 | |
| HI | 5 | 3.4 | 0.4 | OK | 2 | 1.7 | 0.1 | |
| IA | 7 | 4.9 | 0.5 | OR | 4 | 3.9 | 0.3 | |
| ID | 3 | 2.0 | 0.2 | PA | 49 | 34.7 | 3.6 | |
| IL | 46 | 31.9 | 3.4 | RI | 8 | 6.0 | 0.6 | |
| IN | 19 | 14.6 | 1.4 | SC | 5 | 3.7 | 0.4 | |
| KS | 7 | 4.8 | 0.5 | SD | 1 | 0.7 | 0.1 | |
| LA | 1 | 0.6 | 0.1 | TN | 5 | 4.0 | 0.4 | |
| MA | 181 | 125.4 | 13.4 | TX | 68 | 45.4 | 5.0 | |
| MD | 56 | 37.5 | 4.2 | UT | 14 | 9.7 | 1.0 | |
| ME | 2 | 1.5 | 0.1 | VA | 103 | 70.3 | 7.6 | |
| MI | 24 | 18.0 | 1.8 | VT | 1 | 0.7 | 0.1 | |
| MN | 8 | 4.8 | 0.6 | WA | 22 | 14.9 | 1.6 | |
| MO | 8 | 5.9 | 0.6 | WI | 15 | 10.5 | 1.1 | |
| MS | 1 | 0.7 | 0.1 | WV | 6 | 4.2 | 0.4 | |
| MT | 4 | 2.7 | 0.3 | WY | 4 | 3.0 | 0.3 | |
| Total | 1,347 | 946.1 | 100.0 | |||||
SOURCE: SBA SBIR/STTR database.


