
Appendix K
Diet Quality Indexes
As described in the 2015 Institute of Medicine (IOM) report Review of WIC Food Packages: An Evaluation of White Potatoes in the Cash Value Voucher: Letter Report, options for a second index were considered by the committee based on its evaluation of the literature on existing diet quality indexes other than the Healthy Eating Index-2010 (HEI-2010) and with consideration to three criteria: (1) the index can be applied to adults and children, (2) 24-hour recall data are applied, and (3) the index is based on a metric other than comparison to the Dietary Guidelines for Americans (DGA). After reviewing potential indexes, the committee determined that responding to the task would require an index that focuses mainly on nutrient content to provide a contrast to the food-group focus of the HEI-2010. However, the committee found that existing nutrient-based indexes could not be applied directly for two reasons. First, they could not be applied because they use Daily Values based on a 2,000-calorie diet as reference standards for nutrient intake rather than age-appropriate Dietary Reference Intake (DRI) values. Second, they do not necessarily include all of the nutrients and dietary components the committee was interested in assessing, based on current knowledge about nutrients of concern in the diets of young children and women of childbearing age (the 2010 DGA) and the committee’s assessment of the nutrient intakes of the Special Supplemental Nutrition Program for Women, Infants, and Children (WIC)-eligible populations. The committee developed an adapted nutrient-based diet quality index to be scored by comparison to DRI values. The components of this index are described here.
The index examined the following “positive” nutrients included in the
2015 Dietary Guidelines Advisory Council (DGAC) as shortfall nutrients and nutrients of concern, to be updated upon release of the 2015 DGA:
- Potassium
- Dietary fiber
- Calcium
- Iron
- Vitamin C
- Folate
- Vitamin A
- Vitamin E
- Magnesium
The index is the mean percentage adequacy for these nine nutrients, calculated for each individual. The possible range is from 0 to 100.
- For nutrients with an Estimated Average Requirement (EAR): the percentage adequacy was calculated for each individual for each day. To do this, the method described in IOM (2000) was applied using the DRI for assessment of intake of individuals and groups and z-scores were computed for each respondent as follows:
- Usual intake at the individual level was first estimated as the best linear unbiased predictor of intake (BLUP). The BLUP has the smallest prediction error variance among all linear predictors.
- The difference between the individual’s estimated usual intake of the nutrient and the EAR for the nutrient was then computed.
- A z-score was computed as the ratio of the difference to the standard error of that difference.
- Finally, the probability of observing a z-value that was at least as large as the one observed for the individual was computed and multiplied by 100. These calculations were repeated for all the nutrients included in the index. The possible range is from 0 to 100.
- For the nutrients with an Adequate Intake (AI) value (potassium and dietary fiber), reasonable intake ranges based on the AI were applied, to assign 0, 25, 50, and 100 percent adequacy as follows:
- Intake equal to or above the AI, percentage adequacy = 100.
- Intake below the AI but equal to or above 75 percent of the AI, percentage adequacy = 75.
- Intake below 75 percent of the AI but equal to or above 50 percent of the AI, percentage adequacy = 50.
- Intake below 50 percent of the AI but equal to or above 25 percent of the AI, percentage adequacy = 25.
- Intake below 25 percent of the AI, percentage adequacy = 0.
- As a first step, the mean and standard deviation of the index was evaluated.
- Second, the association of the index with energy intake was examined.
- Finally, the association with the HEI-2010 was examined.
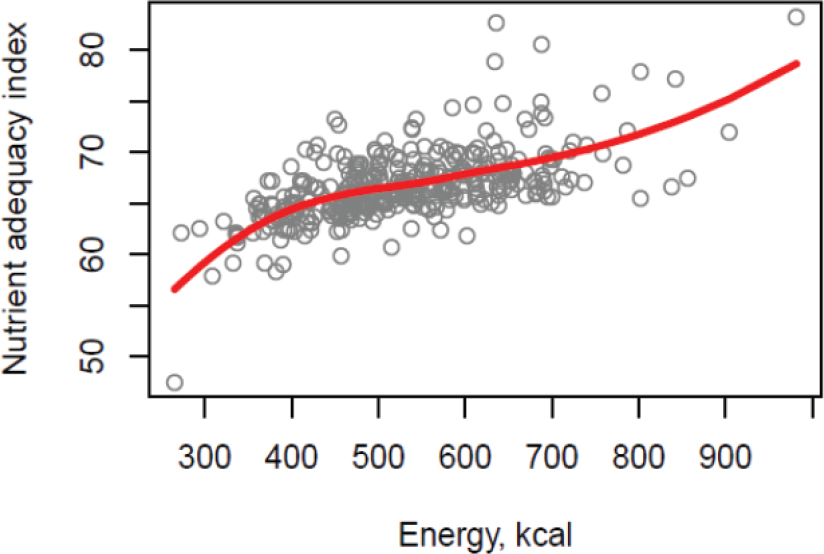
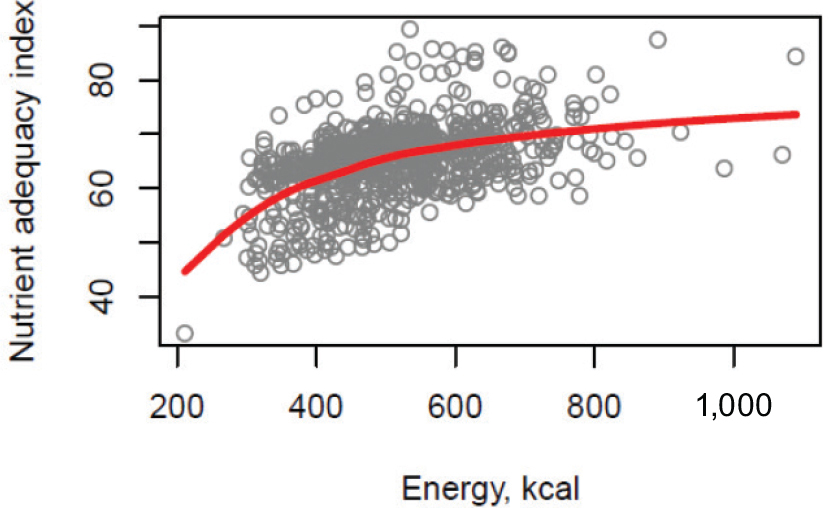
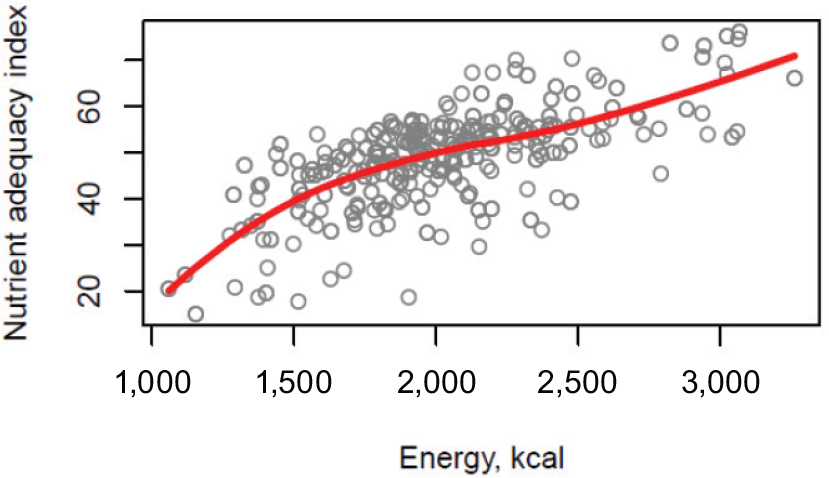
TABLE K-1 HEI-2010 Components and Scoring System
| HEI-2010 Componenta | Maximum | Standard for Maximum Score | Standard for Minimum Score of Zero |
|---|---|---|---|
| Adequacy | |||
| Total Fruitb | 5 | ≥ 0.8 c-eq / 1,000 kcal | No fruit |
| Whole Fruitc | 5 | ≥ 0.4 c-eq / 1,000 kcal | No whole fruit |
| Total Vegetablesd | 5 | ≥ 1.1 c-eq / 1,000 kcal | No vegetables |
| Greens and Beansd | 5 | ≥ 0.2 c-eq / 1,000 kcal | No dark green vegetables, beans, or peas |
| Whole Grains | 10 | ≥ 1.5 c-eq / 1,000 kcal | No whole grains |
| Dairye | 10 | ≥ 1.3 c-eq / 1,000 kcal | No dairy |
| Total Protein Foodsf | 5 | ≥ 2.5 c-eq / 1,000 kcal | No protein foods |
| Seafood and Plant Proteinsf,g | 5 | ≥ 0.8 c-eq / 1,000 kcal | No seafood or plant proteins |
| Fatty Acidsh | 10 | (PUFAs + MUFAs) / SFAs ≥ 2.5 | (PUFAs + MUFAs) / SFAs ≤ 1.2 |
| Moderation | |||
| Refined Grains | 10 | ≥ 1.8 oz-eq / 1,000 kcal | ≥ 4.3 oz-eq / 1,000 kcal |
| Sodium | 10 | ≥ 1.1 g / 1,000 kcal | ≥ 2.0 g / 1,000 kcal |
| Empty Caloriesi | 20 | ≥ 19 percent of energy | ≥ 50 percent of energy |
NOTES: c-eq = cup-equivalent; HEI = Healthy Eating Index; kcal = kilocalorie; oz-eq = ounce-equivalent; MUFA = monounsaturated fatty acid; PUFA = polyunsaturated fatty acid; SFA = saturated fatty acid.
a Intakes between the minimum and maximum standards are scored proportionately.
b Includes 100% fruit juice.
c Includes all forms except juice.
d Includes any beans and peas not counted as Total Protein Foods.
e Includes all milk products such as fluid milk, yogurt, and cheese, and fortified soy beverages.
f Beans and peas are included here (not with vegetables) when the Total Protein Foods standard is otherwise not met.
g Includes seafood, nuts, seeds, soy products (other than beverages) as well as beans and peas counted as Total Protein Foods.
h Ratio of poly- and monounsaturated fatty acids (PUFAs and MUFAs) to saturated fatty acids (SFAs).
I Calories from solid fats, alcohol, and added sugars; threshold for counting alcohol is > 13 grams / 1,000 kcal.
SOURCE: Guenther et al., 2013.
REFERENCES
Guenther, P. M., K. O. Casavale, J. Reedy, S. I. Kirkpatrick, H. A. Hiza, K. J. Kuczynski, L. L. Kahle, and S. M. Krebs-Smith. 2013. Update of the Healthy Eating Index: HEI-2010. Journal of the Academy of Nutrition and Dietetics 113(4):569-580.
IOM (Institute of Medicine). 2000. Dietary reference intakes: Applications in dietary assessment. Washington, DC: National Academy Press.
IOM. 2015. Review of WIC food packages: An evaluation of white potatoes in the cash value voucher: Letter report. Washington, DC: The National Academies Press.
USDA/HHS (U.S. Department of Agriculture/U.S. Department of Health and Human Services). 2015. The report of the Dietary Guidelines Advisory Committee on the Dietary Guidelines for Americans, 2015, to the Secretary of Agriculture and the Secretary of Health and Human Services. Washington, DC: USDA/HHS. http://www.health.gov/dietaryguidelines/2015-scientific-report/PDFs/Scientific-Report-of-the-2015-DietaryGuidelines-Advisory-Committee.pdf (accessed May 24, 2015).


