

Below is the uncorrected machine-read text of this chapter, intended to provide our own search engines and external engines with highly rich, chapter-representative searchable text of each book. Because it is UNCORRECTED material, please consider the following text as a useful but insufficient proxy for the authoritative book pages.
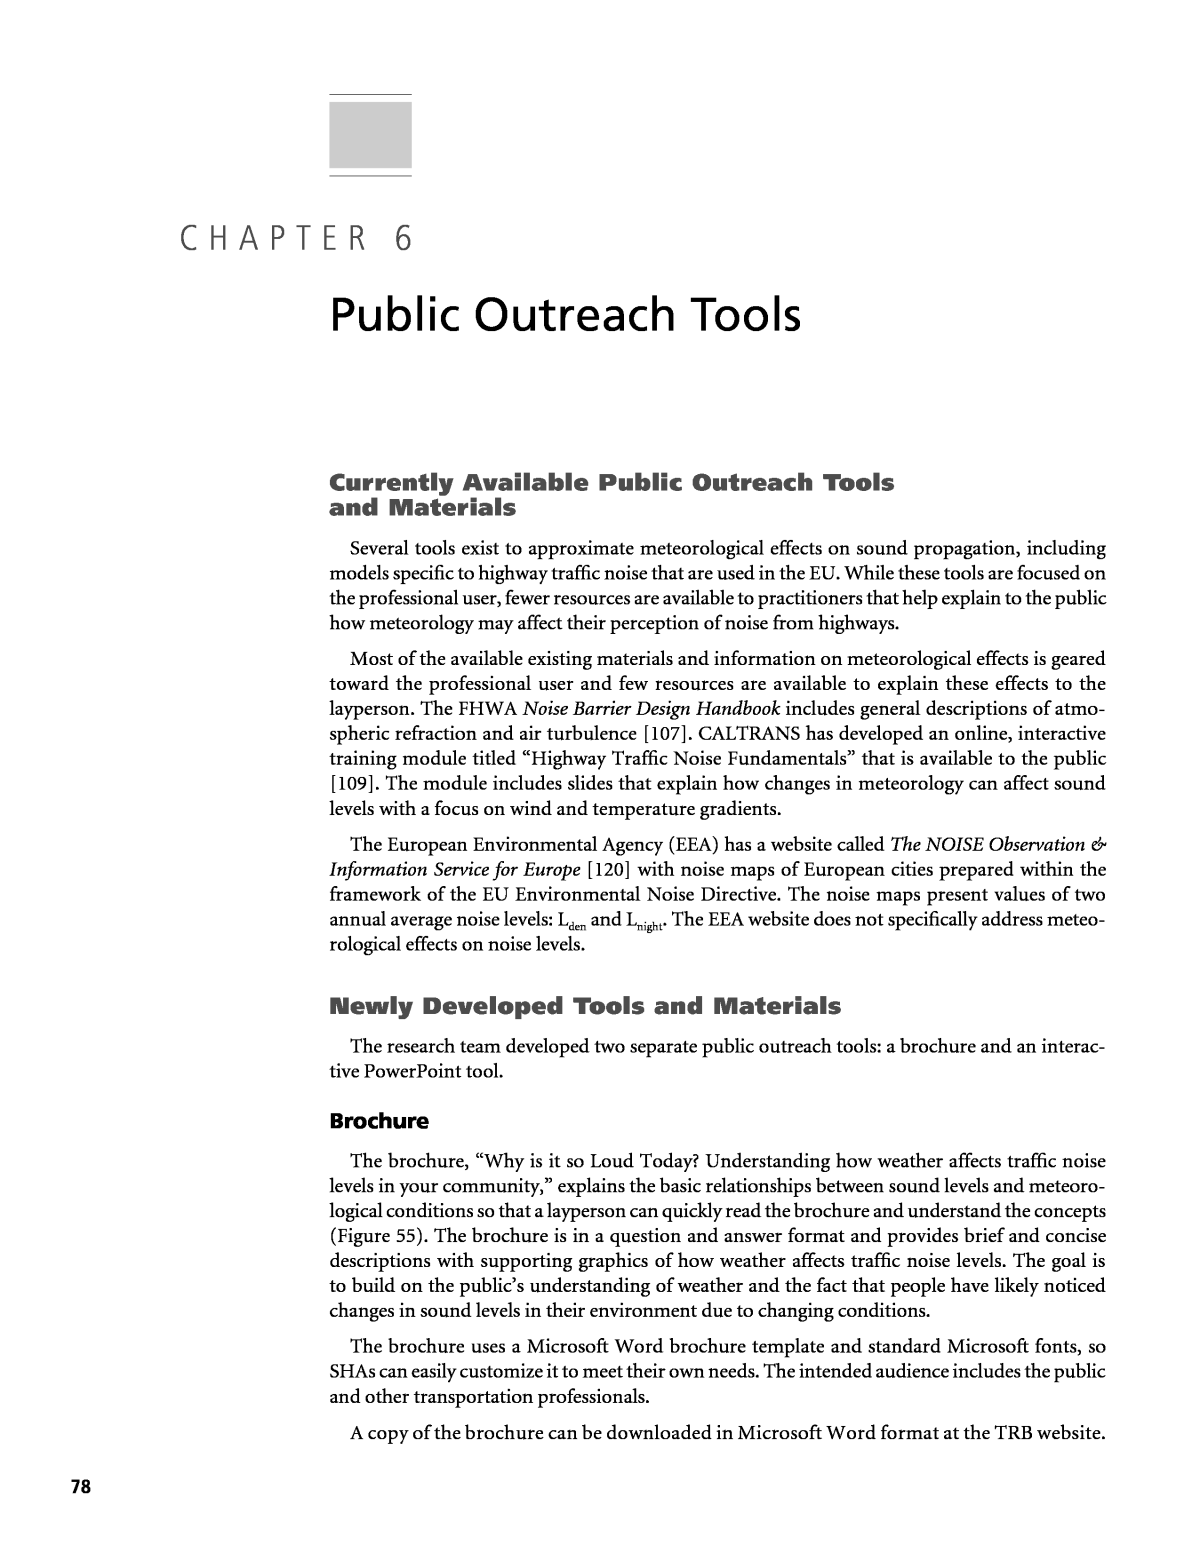
78 Currently Available Public Outreach Tools and Materials Several tools exist to approximate meteorological effects on sound propagation, including models specific to highway traffic noise that are used in the EU. While these tools are focused on the professional user, fewer resources are available to practitioners that help explain to the public how meteorology may affect their perception of noise from highways. Most of the available existing materials and information on meteorological effects is geared toward the professional user and few resources are available to explain these effects to the layperson. The FHWA Noise Barrier Design Handbook includes general descriptions of atmo- spheric refraction and air turbulence [107]. CALTRANS has developed an online, interactive training module titled âHighway Traffic Noise Fundamentalsâ that is available to the public [109]. The module includes slides that explain how changes in meteorology can affect sound levels with a focus on wind and temperature gradients. The European Environmental Agency (EEA) has a website called The NOISE Observation & Information Service for Europe [120] with noise maps of European cities prepared within the framework of the EU Environmental Noise Directive. The noise maps present values of two annual average noise levels: Lden and Lnight. The EEA website does not specifically address meteo- rological effects on noise levels. Newly Developed Tools and Materials The research team developed two separate public outreach tools: a brochure and an interac- tive PowerPoint tool. Brochure The brochure, âWhy is it so Loud Today? Understanding how weather affects traffic noise levels in your community,â explains the basic relationships between sound levels and meteoro- logical conditions so that a layperson can quickly read the brochure and understand the concepts (Figure 55). The brochure is in a question and answer format and provides brief and concise descriptions with supporting graphics of how weather affects traffic noise levels. The goal is to build on the publicâs understanding of weather and the fact that people have likely noticed changes in sound levels in their environment due to changing conditions. The brochure uses a Microsoft Word brochure template and standard Microsoft fonts, so SHAs can easily customize it to meet their own needs. The intended audience includes the public and other transportation professionals. A copy of the brochure can be downloaded in Microsoft Word format at the TRB website. C H A P T E R 6 Public Outreach Tools
Public Outreach Tools 79 Interactive Tool The PowerPoint tool expands on the contents of the brochure. The tool is more technical, but the goal is still to ensure that a layperson can understand the concepts. The narrated tool includes three modules: ⢠The Relationship Between Weather and Traffic Noise Levels: This module includes intro- ductory slides explaining how wind and temperature changes affect sound levels. These slides include the images developed for the brochure and additional three-dimensional images showing a community adjacent to a highway. ⢠Hearing the Sound Level Difference: This module provides an interactive listening experi- ence so the user can hear the differences under different meteorological conditions at a loca- tion 120 meters from an interstate. For example, the user can listen to traffic under neutral conditions and then click on the nighttime inversion condition and hear the difference. ⢠The Effect on Communities: This module demonstrates how sound levels can change in a neighborhood adjacent to an interstate with and without a noise barrier. Color gradient shading overlaid on the neighborhood indicates how sound levels could change under various conditions. A copy of the Interactive Tool, with integrated audio, can downloaded from the TRB website. Source: RSG for NCHRP Project 25-52. Figure 55. Cover of brochure explaining meteorological effects.
