
The first session of the workshop, moderated by Shiriki Kumanyika, explored disparities in the prevalence of obesity among various population groups in the United States. Three speakers presented data on disparities among different sociodemographic and racial/ethnic groups.
OBESITY IN VARIOUS DEMOGRAPHIC AND GEOGRAPHIC GROUPS
Cynthia Ogden, epidemiologist and chief of the Analysis Branch in the National Health and Nutrition Examination Survey (NHANES) Division, National Center for Health Statistics, Centers for Disease Control and Prevention (CDC), opened her presentation by declaring that disparities in obesity prevalence are complex. Before launching into the salient statistics, Ogden clarified that her data describe weight status based on body mass index (BMI), measured by weight in kilograms divided by height in meters squared. She said she would discuss three categories of BMI in adults: overweight (BMI 25 to <30), obesity (BMI ≥30), and severe obesity (BMI ≥40). In youth aged 2 to 20 years, she said, obesity is determined by comparison with a reference population. She explained further that the United States uses CDC growth charts, in which overweight is ≥85th percentile but <95th percentile, obesity is ≥95th percentile, and severe obesity is ≥120 percent of the 95th percentile in the BMI-for-age charts (CDC and NCHS, 2010).
Ogden next highlighted three nationally representative data sources she would reference to describe disparities in prevalence of obesity. In the National Health Interview Survey (NHIS), approximately 87,500 people per year report their height and weight to an interviewer during an in-person household survey. The Behavioral Risk Factor Surveillance System (BRFSS) also uses self-reported height and weight data, she said, provided via a telephone survey of approximately 400,000 people per year. NHANES, she continued, unlike the other two surveys, collects physical examination data with standardized measurements for height and weight, but has a smaller sample size. Approximately 10,000 people are assessed at mobile examination centers in each 2-year NHANES survey cycle, she explained, and data are released after each cycle. Ogden stressed the importance of distinguishing surveys that use self-reported data from those that use measured data, because people tend to overreport their height and underreport their weight. To illustrate, she compared the higher prevalence of obesity measured in NHANES (39.8 percent) with the prevalence reported in BRFSS (31.3 percent) (CDC, 2019; CDC and NCHS, 2018a; Hales et al., 2018).
For context, Ogden pointed out that the average man in the United States is 29 pounds heavier, based on data from 2011–2014, than was the case in the 1960s (Fryar et al., 2016; Ogden et al., 2004). The prevalence of adult obesity has increased from nearly 34 percent in 2007–2008 to
nearly 40 percent in 2015–2016, she reported, which translates to about 93.3 million adults currently with obesity (CDC, 2018; Hales et al., 2018). She added that no significant change in prevalence has been seen over the same time period among youth aged 2 to 19 years; the current prevalence of obesity among this age group is 18.5 percent, which translates to 13.7 million youth (CDC, 2018; Hales et al., 2018).
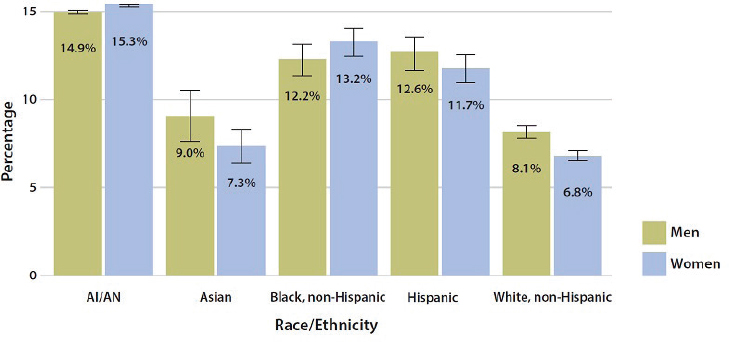
Ogden then turned to discussing disparities in the prevalence of obesity, showing data on race/Hispanic origin, income, education, geography, and rural/urban classification to show where such disparities exist. She reported that prevalence of obesity is lower among whites and Asians than among other races (see Figure 3-1). She added that differences also exist by Hispanic/Latino origin: based on NHIS data, the self-reported prevalence of obesity is 33 percent among Hispanics/Latinos and about 30 percent among non-Hispanics/Latinos, although she reminded workshop participants that these self-reported data underestimate true prevalence (CDC and NCHS, 2018b).
Ogden also reminded participants that prevalence estimates are higher according to measured height and weight data, adding that different patterns emerge upon examining data separately for men and women. To illustrate, she pointed out that the prevalence of obesity differs little between non-Hispanic black (37 percent) and non-Hispanic white (38 percent) men, but differs greatly between non-Hispanic black (55 percent) and non-Hispanic white (38 percent) women (Hales et al., 2017).
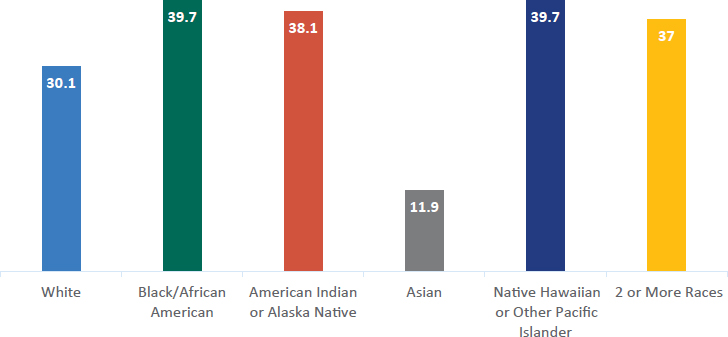
NOTE: Based on data from the 2017 National Health Interview Survey.
SOURCES: Presented by Cynthia Ogden, April 1, 2019 (data from CDC and NCHS, 2018b). Reprinted with permission.
Ogden underscored the importance of thinking granularly to identify disparities and discern nuances in the data, providing the example of differing patterns among youth versus adults. She highlighted the difference in prevalence of obesity among Asian men (about 10 percent) compared with non-Hispanic white men (about 38 percent), which can be contrasted with little difference in prevalence among male youth (aged 2 to 19 years) of the same races (Hales et al., 2017).
Racial groups themselves are heterogeneous, Ogden continued, explaining that among Asians, the prevalence of overweight and obesity in youth varies by sex and individual racial group. As an example, she highlighted large differences between Southeast Asian and Chinese boys, as well as between Japanese/Korean males and females (see Figure 3-2).
Ogden stressed that understanding the differences in the prevalence of obesity by race/ethnicity requires understanding the limitations of BMI. BMI is a screening tool that measures body mass and does not serve as a direct measure of body fat, she pointed out, and therefore, disparities based on BMI may not translate to disparities in actual adiposity. She referenced data on the varying prevalence of high BMI among girls in three racial/ethnic groups, noting that the differences disappear when the measure used is the prevalence of high adiposity (Flegal et al., 2010). She added that disparities based on BMI may not translate to the same disparities in mortality risk, showing data indicating differences in the relative risk of
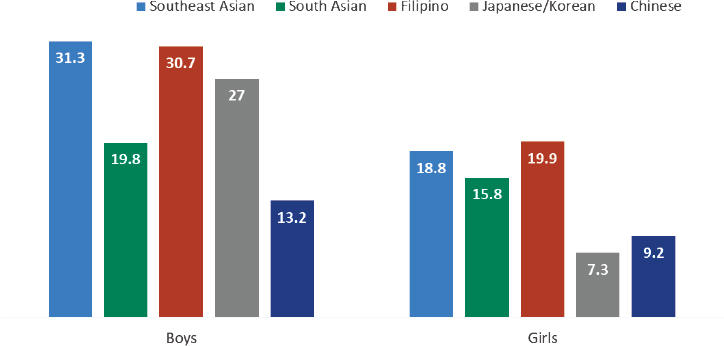
SOURCES: Presented by Cynthia Ogden, April 1, 2019 (data from APIAHF, 2016). Reprinted with permission.
mortality among Taiwanese and U.S. adults with overweight (Chu, 2005; Wen et al., 2009).
Moving on to discuss disparities in the prevalence of obesity by income, Ogden provided context for the United States based on 2017 data: median household income was about $61,000, the poverty level for a family of four was about $25,000, and the top 20 percent of households earned above $126,855 (U.S. Census Bureau, 2018b). Overall, she said, self-reported obesity is lower (about 24 percent) among adults with a family income ≥$100,000 compared with those with lower family income levels (about 33 to 34 percent) (CDC and NCHS, 2018b). Taking a closer look, she reported that differences exist among adults at three income levels (≤130 percent, 130–350 percent, and >350 percent of the federal poverty level). She added that the differences among men by income level are small, but there is a gradient of decreasing prevalence of obesity among women as income rises (Ogden et al., 2017).
Patterns by income vary by race/Hispanic origin as income increases, Ogden continued, showing two figures to synthesize the patterns for adults and youth (see Figures 3-3 and 3-4, respectively). Among men, the prevalence of obesity does not decrease with increasing income in any racial group, she observed, but among women, decreases in prevalence are observed with increasing income in several racial groups. She added that for youth, the prevalence of obesity either decreases or does not change with increasing income, but the patterns are not consistent across males and females within all racial groups. Ogden went on to report that the disparity by income is widening among girls, noting a 5.6 percentage point
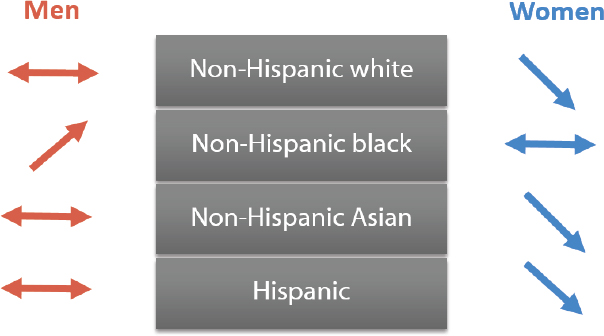
SOURCES: Presented by Cynthia Ogden, April 1, 2019 (Ogden et al., 2017). Reprinted with permission.
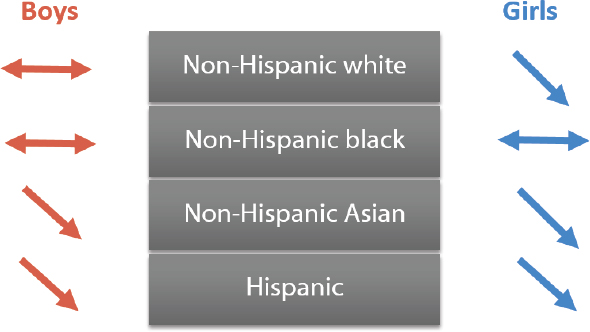
SOURCES: Presented by Cynthia Ogden, April 1, 2019 (from Ogden et al., 2018b). Reprinted with permission.
difference in the percentage of obesity between lower-income and higher-income groups in 1999–2000, compared with an 11.7 percentage point difference in 2011–2014 (Ogden et al., 2018b).
Turning to education, Ogden observed that overall, the prevalence of obesity is lower among the one-third of the U.S. population that are college graduates than among those with lower educational attainment (CDC and NCHS, 2018b). She explained that the patterns in prevalence are more consistent by education than is the case for income when compared across genders and racial/ethnic groups, but pointed to a widening gap by education (based on the head of household’s educational attainment) in the percentage of female youth with obesity (Ogden et al., 2017, 2018b).
Finally, Ogden touched briefly on geography, calling out the higher prevalence of self-reported obesity in the South (CDC, 2019b). Prevalence is higher in rural than in large urban areas for both men and women, she continued, and the prevalence of severe obesity tripled among rural men between 2011 and 2016, contributing to the large disparity in the prevalence of severe obesity between urban and rural men (Hales et al., 2018). She added that the prevalence of severe obesity in youth is nearly double in rural compared with urban areas, but pointed to the absence of significant trends in youth obesity or severe obesity in either urban or rural areas from 2001 to 2016 (Ogden et al., 2018a).
OBESITY IN AMERICAN INDIAN AND ALASKA NATIVE PEOPLE
Ann Bullock, director of the Division of Diabetes Treatment and Prevention at the Indian Health Service (IHS), reviewed prevalence and trends in obesity in American Indian/Alaska Native (AI/AN) populations. She explained that IHS is an agency of the U.S. Department of Health and Human Services, and provides direct health care services to qualified members of 573 federally recognized tribes in 36 states. She noted that health care is also provided by tribes, which have the right to assume control and management of health care programs. Sixty percent of the IHS appropriation is administered by tribes, she elaborated, and health care is also offered by 43 urban Indian organizations that provide various levels of clinical and resource services (IHS, 2019a).
Bullock stressed that AI/AN populations usually are not sufficiently included in national surveys because of their small size, adding that even when AI/AN data are present in such surveys as NHANES or BRFSS, they may or may not be representative of native people generally (CDC, 2017b). Therefore, she explained, other federally supported data sources, often IHS’s clinical database, must be used to obtain AI/AN-specific estimates, and she cautioned that this introduces “a little bit of apples and oranges” as each data source has different strengths and limitations. She identified as one difference that race/ethnicity is self-reported in national surveys, whereas AI/AN people must show documentation of membership in a federally recognized tribe to receive care at an IHS, tribal, or urban Indian health facility. Furthermore, she continued, the IHS clinical sample is drawn from patients who come to tribal facilities, as opposed to being a sample of the general population.
Bullock went on to report that AI/AN groups have the highest prevalence of adult diabetes of all racial/ethnic groups in the United States, among both men and women (CDC, 2017b) (see Figure 3-5). She noted further that, although the AI/AN-specific data are from a different, measured source than the sources providing self-reported data for other racial/ethnic groups, the methodology and application of both data sources have been consistent.
Bullock acknowledged that obesity in AI/AN people is not well characterized and said that nationally representative data for AI/AN adults have not been published. She reported that, based on available estimates, the prevalence of obesity is significantly higher among AI/AN youth (aged 2–19 years) than among U.S. youth overall, but prevalence in AI/AN youth did not increase from 2006 to 2015 except for a small increase in class 3 obesity. Furthermore, she added, AI/AN children aged 2–5 years had the lowest prevalence of obesity and a consistent decrease in the prevalence
NOTES: Error bars represent upper and lower bounds of the 95% confidence interval; AI/AN = American Indian/Alaska Native.
SOURCES: Presented by Ann Bullock, April 1, 2019 (CDC, 2017b). Reprinted with permission.
of obesity, from about 23 percent in 2010 to about 21 percent in 2015 (Bullock et al., 2017). Bullock emphasized that at least half of AI/AN youth have normal weight (BMI <85th percentile), indicating that difficulties leading to health disparities do not affect everyone equally (Bullock et al., 2017). She displayed cross-sectional data for youth aged 2–19 years, pointing out a decrease in the prevalence of normal weight and an increase in the prevalence of obesity as children approach puberty, and highlighting that both categories have higher prevalence than the overweight category among youth (Bullock et al., 2017).
Bullock turned next to the social determinants of health, which, she pointed out, are linked with obesity and chronic disease. She referenced data revealing that AI/AN people have the highest rate of poverty (nearly 22 percent) of all racial/ethnic groups, as well as high rates of food insecurity (Tomayko et al., 2017; U.S. Census Bureau, 2016). She then paused to focus on adverse childhood experiences, which she described as early-life occurrences (such as various kinds of abuse and family dysfunction) that help predetermine behaviors and physiological risk. She cited the National Survey of Children’s Health, which indicated that AI/AN children up to 17 years old were more likely than their white counterparts to have experienced multiple adverse childhood experiences. Furthermore, the AI/AN children who had three or more such experiences compared with those who had fewer than two exhibited a higher prevalence of depression, anxiety, and attention deficit-hyperactivity disorder and higher rates of school problems and needs for medication and counseling (Kenney and Singh, 2016).
Bullock reported further that in the original study of adverse childhood experiences, adults who recalled at least four such experiences were 4 to 12 times more likely to have alcoholism, drug abuse, depression, or suicide attempts; 2 to 4 times more likely to smoke, self-rate health as poor, and have sexually transmitted diseases; and 1.4 to 1.6 times more likely to be physically inactive or have severe obesity (Felitti et al., 1998). She underscored that early-life risk factors give way to risk for obesity and other social problems, urging participants to examine obesity through the lens of what has happened throughout the lifespan. She explained that for those working in native communities, a lens of historical trauma is used to examine how trauma is passed intergenerationally, and for some groups through colonization.
Bullock then shifted to discuss the Special Diabetes Program for Indians (SDPI), established by Congress in 1997 in response to rising diabetes rates in AI/AN people. The program allocates $150 million annually for grants to IHS, tribal, and urban health systems in 35 states for diabetes prevention and treatment. Comprehensive, community-based approaches are promoted, Bullock said, so that communities can determine how best to use their funds. She reported an impressive increase in availability of diabetes-related services between 1997 and 2013 from both SDPI resources and other funding (IHS, 2014). She also highlighted My Native Plate, a resource that adapts national nutrition guidelines for AI/AN populations, and referenced a tool for use by clinicians to screen for food insecurity, as well as a form they can complete to direct patients to local resources for accessing healthy foods (IHS, 2015, 2018).
Bullock moved on to discuss improvements in the prevalence of diabetes among AI/AN people, which she acknowledged as somewhat distal to obesity yet reflective of community efforts and SDPI programs. She reported that the prevalence of diabetes stopped increasing around 2011 for AI/AN adults and 2006 for AI/AN youth, based on IHS data (IHS, 2019b). She noted further that the Search for Diabetes in Youth Study reported an increase among the AI/AN sample, but she cautioned that this study used a nonrepresentative sample for native children.
With regard to complications from diabetes, Bullock continued, the period 1996 to 2013 saw a 54 percent reduction in kidney failure from diabetes among AI/AN adults, a much steeper decline than in any other population group (CDC, 2017c). Moreover, she observed that if the rate of kidney failure from diabetes were determined among people with diabetes instead of the overall population, the rates in AI/AN people would be similar to those among whites, which she added “we never thought we would ever say.” She noted further that the prevalence of both diabetic retinopathy and macular edema has declined by more than 50 percent among AI/AN people over the past few decades, and their hospital admissions for
uncontrolled diabetes decreased by 84 percent between 2000 and 2015 (AHRQ, 2018; Bursell et al., 2018). Bullock reiterated that although these outcomes are distal from obesity, they represent the ripple effect of the socioeconomic opportunities that the AI/AN population has experienced. She expressed the hope that declines in obesity will follow, and shared that she felt an even greater desire for improvements in life outcomes, such as the ability to bond with others and find joy and meaning in life. She ended her presentation by advocating for social determinants to be meaningfully addressed through both community approaches and broader policy changes.
OBESITY AMONG ASIAN AND PACIFIC ISLANDER AMERICANS
Maria Rosario (Happy) Araneta, professor of epidemiology at the University of California, San Diego, discussed obesity among Asian and Pacific Islander Americans. Asians represent 6 percent of the U.S. population, she reported, and in 2010 surpassed Hispanics as the largest immigrant population arriving in the United States annually (Lopez et al., 2018). By 2065, she added, it is predicted that Asians will make up 14 percent of the U.S. population and outnumber Hispanics as the largest foreign-born population in the United States (Lopez et al., 2018). She remarked that she was curious about the role of colonialism in these populations, noting that the Philippines was colonized by Spain and then the United States, and India by England, introducing these countries’ residents to other diets and lifestyle customs before they emigrated to the United States.
Araneta went on to observe that among the 21 million Asian Americans in the United States, the largest groups are Chinese, Asian Indians, and Filipinos; Native Hawaiian and other Pacific Islander populations are estimated to total 1.3 million people (U.S. Census Bureau, 2018a). One-third of Asians and Pacific Islanders in the United States reside in California, she continued, and one in seven California residents is Asian or Pacific Islander (U.S. Census Bureau, 2018c).
Araneta stressed that, despite the importance of disaggregating Asian and Pacific Islander data, which, she said, are often reported collectively, such disaggregated data are limited. To illustrate, she noted that, based on disaggregated data from the Hawaii BRFSS, differences in the prevalence of obesity among selected ethnic groups were not mirrored by similar differences in the prevalence of diabetes among those same groups. For example, Japanese people had the lowest prevalence of obesity but not the lowest prevalence of type 2 diabetes (Hawaii State Department of Health, 2017). According to Araneta, the highest prevalence of type 2 diabetes for adults up to age 45 was among Native Hawaiians and at age 55 and older was among Filipinos (Uchima et al., 2019).
Araneta next highlighted an assessment of the prevalence of self-reported obesity among adults disaggregated by Native Hawaiian and Pacific Islander (NHPI) groups and other racial/ethnic groups. Prevalence was lowest among Asians and highest among NHPI groups, but Araneta called out differences within the NHPI population that are apparent only when the data are disaggregated by single racial groups (see Figure 3-6): the prevalence of obesity was highest among Samoans (61 percent), a group that Araneta remarked may have a genetic polymorphism that is associated with higher BMI (Minster et al., 2016).
Araneta moved on to discuss a study of clinical measures of BMI and type 2 diabetes by ethnicity in Hawaii. She observed that whereas mean BMI was lowest among whites, Filipinos, and Japanese, the prevalence of type 2 diabetes was only 4 percent in whites compared with 19 percent and 21 percent in Filipinos and Japanese, respectively (Grandinetti et al., 2007). As for the prevalence of type 2 diabetes in a Kaiser Permanente sample in California, Araneta said that it was highest among Pacific Islanders (18.3 percent), Filipinos, and South Asians; followed by Latinos, African Americans, and Native Americans; then other Asian groups; and finally, whites (7.3 percent) (Karter et al., 2013). She emphasized that the relatively higher prevalence among Pacific Islanders and some Asian populations is masked if all Asians and all Pacific Islanders are grouped together because their combined prevalence is lower when the data are reported collectively.
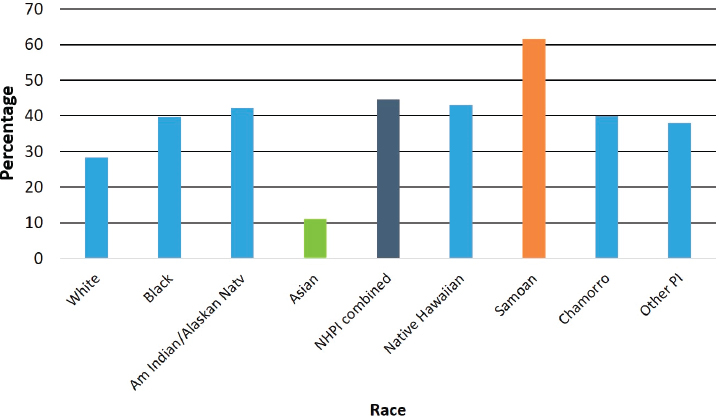
NOTE: Am = American; Natv = Native; NHPI = Native Hawaiian and Pacific Islander; PI = Pacific Islander.
SOURCES: Presented by Maria Rosario Araneta, April 1, 2019 (data from Galinsky et al., 2017). Reprinted with permission.
Another finding from the Kaiser study, Araneta pointed out, was that Chinese, Japanese, Filipino, and South Asian populations with incident or prevalent diabetes had a mean BMI below 30, and Pacific Islanders’ mean BMI was more similar to that of Latinos and African Americans (Karter et al., 2013). According to Araneta, these data emphasize that Pacific Islanders should not be combined with Asians in the reporting of such health data.
Based on the unexpected results of the Kaiser Permanente data, Araneta explained, the American Diabetes Association contacted four research groups with Asian American cohorts—because there is no national study of this population—to write a position statement that would inform revised guidelines on BMI cutpoints for diabetes screening among Asian Americans. By pooling data from the four cohorts, it was determined that at the previous BMI screening cutpoint of 25 kg/m2, more than one-third of all Asian Americans with diabetes would be missed—37 percent of women and 21 percent of men with newly diagnosed diabetes, including a woman with a BMI of 16 (Araneta et al., 2015). A “Screen at 23” campaign followed, Araneta continued, based on data indicating that a BMI screening cutpoint of 23 would lead to a diabetes diagnosis for 300,000 of the approximately 510,000 Asian Americans with undiagnosed diabetes (Araneta et al., 2015). She added that Asian Americans have the highest prevalence of undiagnosed diabetes of any racial/ethnic group, and suggested that ethnic differences in levels of adipose tissue may contribute to this statistic (Menke et al., 2015).
Araneta elaborated on these differences by referencing three studies, starting with one that compared visceral adipose tissue (VAT) in women aged 55 years and older without cardiovascular disease. African American women had higher values for BMI, waist circumference, truncal fat, and body fat relative to Caucasian or Filipina women, she stated, but only 12 percent had type 2 diabetes, compared with 32 percent of Filipinas and 6 percent of Caucasians. She showed two images of VAT obtained with computed tomography—one from a Filipina woman with a BMI of 20 and another from an African American woman with a BMI of 25. The Filipina woman had 84 cubic centimeters of visceral fat, compared with 25 cubic centimeters in the African American woman. According to Araneta, the data show that Filipina women consistently have significantly more visceral fat than their Caucasian and African American counterparts, even at normal levels of BMI (<23 for Filipinas and <25 for Caucasians and African Americans) and waist circumference (<80 cm for Filipinas and <88 cm for Caucasians and African Americans). Moreover, she continued, at normal waist circumference, Filipinas have a 23 percent prevalence of type 2 diabetes, compared with a prevalence of 3 percent in Caucasian and 10 percent in African American women (Araneta and Barrett-Connor, 2005). Araneta cited a second study in which Filipinas were observed to carry greater excess fat in the pericardial and rectus abdominus regions compared with
white and African American women (Larsen et al., 2014). Citing a third study, Araneta mentioned that for both men and women, visceral fat was lowest among African Americans and significantly higher among Chinese Americans and South Asians, and South Asians had the highest levels of intermuscular fat and lowest levels of lean body mass (Shah et al., 2016).
Araneta also noted that abdominal muscle is inversely associated with type 2 diabetes, independent of VAT, among Filipinas with a BMI of less than 25 (Larsen et al., 2015). A strategy to increase muscle mass may be a more effective and practical intervention for Asian Americans who do not have obesity, she suggested, “who you can’t convince to lose weight if they have no weight to lose.”
Araneta reported further that in two cohort studies, one-third of adults with normal weight had metabolic abnormalities. She noted that the equivalent metabolic abnormalities observed among whites at a BMI of 25 were seen at a BMI of 19 in South Asians and 20 in Chinese. For whites with a BMI of 30, she continued, equivalent metabolic abnormalities were observed at a BMI of 24 in Chinese and 23 in South Asians (Gujral et al., 2017).
Finally, Araneta mentioned the potential role of adiponectin, a hormone that is derived from adipose tissue and appears to have a favorable effect on health outcomes such as diabetes, but is down-regulated in the presence of visceral fat (Eckel et al., 2005; Lyon et al., 2003; Trayburn and Wood, 2004). One study measured 40 percent less adiponectin in Filipinos compared with whites, she said, noting that the combination of excess ectopic fat, low lean muscle mass, and poor adiponectin profile is hypothesized to contribute to the excess diabetes risk in populations that do not have obesity (Araneta and Barrett-Connor, 2007).
DISCUSSION
During a discussion period following the three presentations summarized above, speakers shared their ideal data for solving health inequities and addressed participants’ questions about health improvements in AI/AN populations and AIs in urban communities.
Ideal Data
Kumanyika began by asking the speakers what their “dream data” would be to help identify solutions, especially those related to social determinants, for achieving equity in preventing and treating obesity. Araneta cited data that would follow a uniform protocol and include information about immigration status (documented versus undocumented) and other social determinants. There are many stressors among undocumented
immigrants, she maintained, that are not captured in existing surveillance tools. Bullock requested data that would examine the full life course, from parental risk factors such as epigenetic markers and in utero exposures; to childhood experiences and growth curves; to exposures to stress, poverty, trauma, food insecurity, and other environmental influences. Such data would help paint a complete picture across the life cycle, Bullock asserted, and could suggest how each factor contributes to different levels of risk. Ogden reiterated the need for longitudinal data, and added that larger sample sizes for NHANES would add granularity to the study’s data on U.S.born and foreign-born participants, which she said were heterogeneous.
Health Improvements in AI/AN Populations
A participant expressed surprise that declines in complications of diabetes were observed in these populations amidst the poverty, food insecurity, and trauma they have experienced. Bullock proposed several potential contributors to the improvements, with the caveat that data have not been collected to support her speculations. She noted that there are large differences in the prevalence of diabetes across IHS regions, and that prevalence is lower in Alaska Natives than in white Americans. She said she was not sure that socioeconomic status had shifted enough to result in favorable changes in overall patterns of health outcomes, but the SDPI model of giving grants to communities had fostered self-determination as communities decided where to focus their efforts. Native American communities have a strong sense of community that is not always present in other parts of the United States, Bullock explained, proposing that such interdependence and community orientation and resilience are protective factors. “That is not an American value,” she observed, “but Native Americans still believe that taking care of family and community is higher [than one’s own value].” With that, she advocated for measuring social capital, which she said was strongly associated with health outcomes in children and adults in other communities.
American Indians in Urban Communities
Kumanyika remarked that IHS provides universal access for individuals who qualify by proving their racial/ethnic identity. She asked Bullock whether data for urban AIs might be more similar to data for the urban African American population than to data for the American Indian population in general. Bullock replied that more Native Americans live off than on reservations, but despite the existence of urban Indian organization clinics and IHS and tribal clinics in urban areas, most urban Native Americans do not access care consistently from one of those sources. Therefore, she observed, the data on urban Native Americans are incomplete and tend not to be broken out by the health care systems they have accessed.


