
3
Research Funding Trends
The main purpose of this chapter is to document the earlier statement that funding for all scientific research has substantially increased over the past decade. The bulk of the data were taken from the OTA report [2], which used the research expenditure compilations prepared by the National Science Foundation (NSF) in the report Federal Funds for Research and Development: Detailed Historical Tables, Fiscal Years 1955-1990 [10].
Figure 3.1 shows a history of federally funded research from 1960 through 1990. Associated with the advent of the space age, there is a large increase in federal research funding that peaks in 1965 and then gradually declines until 1975. Since 1975, the nation's research funding has shown a steady increase, resulting in better than a 40 percent growth in constant-year dollars.1 It is the past 15 years, since 1975, that the present report addresses.
This increase is also observed as an increasing share of the Gross National Product (GNP). Figure 3.2 shows both total and nondefense research and development (R&D) expenditures as a percentage of GNP for the United States and four other countries, Federal Republic of Germany (FRG, now Germany), Japan,
|
1 |
Note that Figure 3.1 shows not only a steady increase in federally funded research since 1975 but also that the bulk of the increase occurred in the area of basic research, resulting in a doubling of funds in this area over the 15 years prior to 1990. However, the actual division of resources between basic and applied research is somewhat uncertain since such a distinction is ambiguous and varies among the federal agencies. Even with this ambiguity, however, it is clear that the U.S. research program has experienced a substantial real-dollar increase since 1975. |
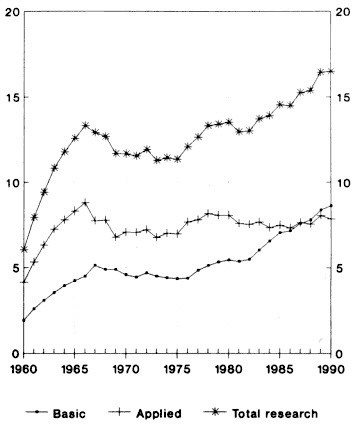
FIGURE 3.1 Federally funded research (basic and applied), fiscal years 1960-1990 (in billions of 1982 dollars). Source: National Science Foundation, Federal Funds for Research and Development, Detailed Historical Tables: Fiscal Years 1955-1990 (Washington, D.C., 1990), Table A; and National Science Foundation, Selected Data on Federal Funds for Research and Development: Fiscal Years 1989, 1990 1991 (Washington, D.C., December 1990), Table 1.
Note: Figures were converted into constant 1982 dollars using the Gross National Product (GNP) Implicit Price Deflator. For 1990 (current dollars), basc research = $11.3 billion, applied research = $10.3 billion, and total research = $21.7 billion. Figures for 1990 are estimates.
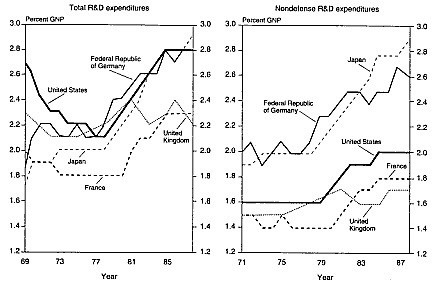
FIGURE 3.2 R&D expenditures as a percentage of gross national product, by country.
Source: National Science Foundation, National Patterns of R&D Resources: 1990, Final Report. NSF 90-316 (Washington, D.C., 1990), Tables B-18 and nbB-19.
France, and the United Kingdom. The fraction of the GNP represented by total R&D expenditures in the United States has increased by about 27 percent since 1975, while the nondefense R&D fraction has increased by about 25 percent. Thus, the growth in research funding in the United States has exceeded the growth in the GNP. The higher percentage for nondefense R&D in the FRG and Japan seen in Figure 3.2 reflects the fact that these countries have not had to support a defense-related R&D program.
Figure 3.3 shows federally funded research by performer for the years since 1969. It can be seen that the university research community, the main beneficiary of the increase shown in Figure 3.1, has received an additional 2.5 billion constant-year dollars (an increase of over 70 percent) since 1975. Note that the federal government's share has remained steady and at a relatively high level.
Figure 3.4 shows the overall research funding trend for the National Aeronautics and Space Administration (NASA) and NSF, the two main funding sources for space physics research. There was a steady funding increase through the 1980s, preceded in the case of NSF by a flat funding profile and in the case of NASA by a somewhat more variable funding profile. The overall inflation-adjusted increase since 1975 has been over 140 percent for NASA and a more modest 30 percent for NSF. Note that by 1990 funding for basic research had reached essentially the same level at both institutions.
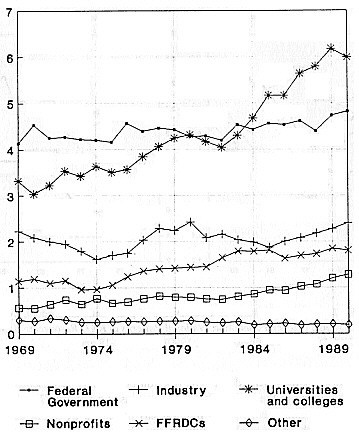
FIGURE 3.3 Federally funded research by performer, fiscal years 1969-1990 (in billions of 1982 dollars). Source: National Science Foundation, Federal Funds for Research and Development, Detailed Historical Tables: Fiscal Years 1955-1990 (Washington, D.C., 1990), Table 17; and National Science Foundation, Selected Data on Federal Funds for Research and Development: Fiscal Years 1989, 1990 and 1991 (Washington, D.C., December 1990), Table 1.
Key: FFRDCs include all Federally Funded Research and Development Centers that are not administered by the federal government. "Other" includes federal funds distributed to state and local governments and foreign performers.
Note: Research includes both basic and applied. Figures were converted to constant 1982 dollars using the GNP Implicit Price Deflator. Figures for 1990 are estimates.
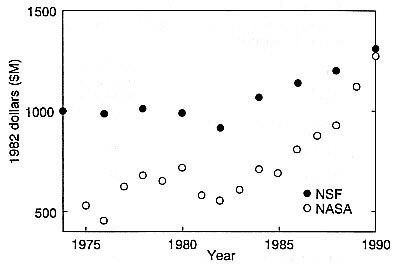
FIGURE 3.4 NSF and NASA research funding (in millions of constant 1982 dollars).
Related to the basic research funding issue is the question of how much of this funding actually leaves the funding agency and reaches the nonfederal research community, primarily universities and colleges (e.g., see Figure 3.3). It might be expected that agencies whose main responsibility is to support research would allocate the majority of their resources to the university research community. On the other hand, agencies with strong mission and operational responsibilities may perform much of their research in-house. Using data from the NSF report on federal research expenditures [10], we find that for the past 15 years the ratio of in-house research obligations to total research obligations ranged from approximately 10 percent for the NSF, 30 to 50 percent for NASA and the Department of Defense (DoD), 70 to 80 percent for the National Oceanic and Atmospheric Administration. This is in agreement with the qualitative expectations mentioned above. Data for the past several years also show that for NASA and DoD this ratio has been decreasing, showing an increased fraction of their research funding leaving these agencies.
Table 3.1 summarizes various elements of the growth in research funding in the United States from 1981 through 1989. The percentage values shown have been adjusted to the closest 5 percent increment. The top five elements are taken from the general funding data presented earlier. The bottom three elements have been synthesized from data received by a NASA-sponsored University Relations Task Force2 and refer specifically to NASA research funding to universities closely related to and including space physics programs.
TABLE 3.1 Summary of the Percentage Growth in Constant-Year Dollar Funding of Various U.S. Research Elements
|
Element |
Constant-Year Dollar Growth, 1981-1989 (%) |
|
Federally funded research (FFR) |
30 |
|
FFR basic |
55 |
|
FFR in universities |
55 |
|
NASA basic |
100 |
|
NSF |
30 |
|
NASA/OSSA with flight projects |
60 |
|
NASA/OSSA without flight projects |
45 |
|
Seven-university sample (funded by NASA/OSSA) |
20-40 |
Funding for NASA's Office of Space Science and Applications (OSSA) includes substantial amounts for project-related activities. As these activities often include substantial support for industry, they were removed from the university funding estimates to obtain a lower limit to that funding, and the result is shown in Table 3.1, where funding growth, with and without projects, is given.
An illustration of these research funding trends can be found in data from seven universities receiving NASA/OSSA funds over the 1981-1989 period. Funding changes ranged from a 35 percent decrease to a 245 percent increase, with an average value of 40 percent growth, as shown in Table 3.1. If the possibly anomalous 245 percent increase is removed from the sample, the average growth would be 20 percent. Although the sample is small and the growth experienced from university to university varied widely, it does appear that the average growth in NASA/OSSA funding in space physics fields at these seven universities has been consistent with the national trend in research funding.
In summary, we conclude that research funding in the United States, both generally and in the field of space physics, has increased substantially over the past 10 to 15 years.


