5
Base Program Funding Trends in Space Physics
Chapter 4 has shown that the increase in size of the space physics community has, within the accuracy of the available data, correlated with both the national and institutional funding trends presented in Chapter 3. All have increased measurably. This expansion may appear to contradict one assumption behind the space physics paradox, because it seems to imply that the field has benefited directly from increased funding.
In referring to "benefits" to the field, it is important to reiterate that this report examines the conduct of space physics science, that is, the funding and administrative processes that provide the foundation for research activities. It is beyond the scope of this report to judge the relative value of the discoveries made over the years or the power of the new ideas that have been generated. However, the committee does believe that there are connections between the conduct and the content of science. Because breakthroughs can come unpredictably from unexpected sources (and are often unrecognized until much later), the overall advance of knowledge can only be assured by giving a variety of researchers the opportunity to pursue their ideas.
In this chapter we look in more detail at how this era of increased funding has affected the base-funded research program in space physics. As discussed in Chapter 2, it is the base-funded program that has offered the primary support for small science opportunities and, through this support, has provided the foundation for many large science programs. Long-term base-funding data sets for the relevant fields were obtained from the Upper-Atmospheric Section (UAS) of the National Science Foundation (NSF) and the Space Physics Division of the National Aeronautics and Space Administration (NASA). The NSF UAS covers
TABLE 5.1 NSF Proposal Statistics for the Upper-Atmospheric Section
|
|
Fiscal Year |
||||||
|
|
1985 |
1986 |
1987 |
1988 |
1989 |
1990 |
1991 |
|
Number of competitive proposals |
142 |
115 |
109 |
127 |
120 |
163 |
205 |
|
Number funded |
101 |
78 |
76 |
80 |
67 |
90 |
129 |
|
Percent funded |
71 |
68 |
70 |
63 |
56 |
55 |
63 |
|
Average duration (years) |
1.9 |
2.1 |
2.0 |
2.5 |
1.9 |
2.0 |
2.1 |
|
Average size ($1,000) |
56 |
52 |
47 |
46 |
52 |
52 |
49 |
|
Average size ($1,000 1985 dollars) |
56 |
50 |
44 |
42 |
46 |
45 |
41 |
|
Total grants ($1,000 1985 dollars) |
5,656 |
3,900 |
3,344 |
3,360 |
3,082 |
4,050 |
5,289 |
aeronomy, magnetospheric, solar-terrestrial, and upper-atmospheric facilities. The UAS data on competitive proposals over a seven-year period are shown in Table 5.1. For this space physics portion of NSF, the total number of competitive proposals increased substantially in FY 1990 and FY 1991. The FY 1991 increase is due, in large part, to the start of the Geospace Environment Modeling (GEM) program. The fraction of proposals funded decreased slightly over this seven-year period, and the average grant duration remained at approximately two years. Of more significance is the observation that the average grant size in constant 1985 dollars decreased by about 25 percent over this interval.
Figure 5.1 compares these results with those from the other major source of space physics funding, the Space Physics Division of NASA. This division covers aeronomy, ionospheric, magnetospheric, cosmic rays, heliospheric, and solar physics. NASA and NSF data are shown in the Figure for an overlapping time period of several years, with both data sets normalized to FY 1985 dollars. The data all show the same downward trend, although the NASA average grant size is about $20,000 larger than the average NSF grant size. The actual buying power of an individual grant has decreased by $15,000 to $20,000 over the last seven years. (As discussed later in this chapter, this decrease is exacerbated by increasing university overhead costs for the same period.) Thus, what scientists have been saying about a shrinking grant size is confirmed by the data in Figure 5.1: the average grant buys much less today than it did seven or eight years ago.
This downward trend in the average size of an individual grant (in fixed-year dollars), combined with the actual size of each grant, suggests that an indi-
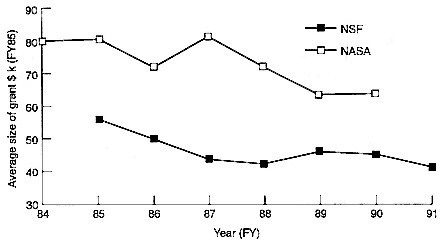
FIGURE 5.1 Space physics grant trends.
vidual researcher must write several proposals per year to remain funded and that this number is increasing. To get a rough yet quantitative measure of this trend, we can divide the annual cost of a research scientist (salary, overhead, travel, etc.) by the proposal success rate (number funded/number submitted), the average grant size (in dollars per year), and the average grant duration. For convenience, let us call this the Proposal Index (PI), where
Assuming a research scientist cost range (as defined above) of $120,000 to $180,000 and using the NASA- and NSF-supplied values for the remaining parameters, we find that to remain funded with NASA support "Dr. Average" had to write one and one-half to two proposals in FY 1989 compared to two and one-half to four proposals in FY 1992. With over 100 additional proposals submitted to NASA's Supporting Research and Technology program in 1993 as compared to 1992, the PI will continue to grow. From the NSF data we obtain a similar PI value of two to three for FY 1991. Thus, the available data indicate that full-time researchers applying for NASA or NSF core funding must write an average of two to four proposals per year, with the number expected to grow in the future.
What is the effect of having scientists spend this much time writing proposals instead of doing research? One way to address this question is to estimate the costs of writing and reviewing submitted proposals and to express these costs as
a fraction of the funds being disbursed. We assume that the average proposal takes two weeks to write and that each proposal can be reviewed in one day by each reviewer. By multiplying the number of proposals received by the average writing time, and by the average cost of a researcher (as given above in the calculation of the PI), adding the cost of the review, and dividing by the available funds, we obtain a measure of this overlooked cost burden. Let us call it the Hidden Overhead Index (HOI). Using financial data supplied by NASA, and simple assumptions about the cost of the review process, the NASA HOI was between 20 and 30 percent in FY 1989 and between 30 and 50 percent in FY 1992. For NSF, the HOI is around 10 to 15 percent for both FY 1989 and FY 1991. (This difference may be due in part to the manner in which NSF and NASA interact with their respective research communities.) Nonetheless, the magnitude of this index is alarming. It indicates that the current funding cycle is very costly. It also appears that, in the case of NASA, as proposal success rates or grant sizes drop, the entire process becomes even less cost effective.
We attempted to gain further insight into the trends in grant funding and its role in contemporary research activities by examining the results of a survey sent to over 300 members of the American Astronomical Society's (AAS) Solar Physics Division.1 Unfortunately, the response rate was low (18 percent), and no attempt was made to normalize the sample. However, in the absence of more rigorous data, it is instructive to look at the trends for 1981-1991 as extracted from the 55 responses received. The respondents reported that during that period the number of submitted proposals per scientist per year rose from 1.1 to 3.0, while the success rate dropped from 94 percent to 62 percent. Factoring in the trend for granting only a fraction of the requested budget (91 percent in 1981, versus only 45 percent in 1991), we find that for every dollar requested by these scientists, 85 cents was realized in 1981 and only 28 cents in 1991. The respondents estimated that the fraction of time spent doing actual science dropped from 74 percent in 1981 to 46 percent in 1991. (This result must be interpreted with caution since other factors may play a role as a researcher matures and accepts broader responsibilities.) Over the 1981-1991 time period, about one-third of the respondents were 100 percent dependent on research grant income for their salary support. The number of Ph.D. graduates grew by 59 (more than one per respondent), consistent with the 10- to 15-year doubling period noted in Chapters 2 and 4. The reports from these 55 individual scientists in solar physics are consistent with the other data we examined: more proposals need to be written today for scientists to stay gainfully employed, resulting in less time for research.
In an attempt to compensate for the erosion of the base-funded research program, NSF science managers have concentrated on establishing a number of "directed" research projects. In this context, directed research supports a specific, larger science program or an a priori defined science problem. In contrast, core program funding generally supports "undirected" research within a broadly defined discipline. In some cases several undirected projects are grouped based on their similar thrusts to form a larger synergistic program, thereby providing a sense of direction to this group of projects.
Recent NSF projects belonging to the directed project category are the ongoing Coupling, Energetics, and Dynamics of Atmospheric Regions (CEDAR) program, the Geospace Environment Modeling (GEM) program, and the Radiative Input from Sun to Earth (RISE) program. Of interest within the context of this study is how the awards within such directed projects compare with the more traditional core program awards. Figure 5.2 shows the new award size distribution in the CEDAR program for 1991 and 1992. We see that the average size of the CEDAR awards has decreased significantly, similar to the trend shown for regular NSF grants in Figure 4.1.
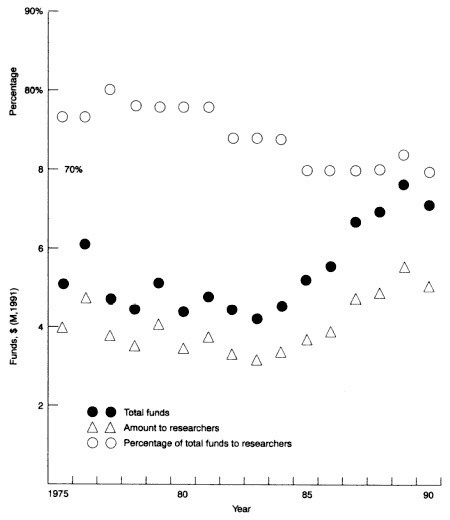
As mentioned earlier, any increases in overhead expenses will further reduce the actual dollars received by the research scientist. Chapter 3 (Figure 3.3) showed that academia has been the largest benefactor of federally funded research. Figure 5.3 shows an estimate of the cost components associated with U.S. academic research budgets. The senior scientist component of Figure 5.3 indicates that the research community has expanded, consistent with our findings for space physics discussed earlier in this chapter. Figure 5.3 further shows a marked increase in indirect costs. To see how such an indirect cost increase affects the space physics researcher, we present data from the University of California at Los Angeles (UCLA) Institute of Geophysics and Planetary Physics, the primary administrative home of space physics at UCLA. UCLA overhead charges have increased by more than 50 percent since 1978, as shown in Table 5.2. Figure 5.4 shows the effect of this adjustment on NASA research funding at UCLA. The funding level, adjusted to FY 1991 dollars (using the consumer price index [CPI]) has fluctuated, with an overall increase of 40 percent. However, because of the increase in overhead charges, the actual increase in research support is only 25 percent. Figure 5.4 shows that the fraction of grant and contract funds that actually reach the researcher dropped from 78 percent in the late 1970s to 69 percent in the early 1990s.
The increase in overhead costs is consistent with data on employment patterns at UCLA [12]. In the decade from 1977 to 1987, the academic support staff (including environmental safety staff, contract and grant officers, affirmative action officers, etc.) grew by 44 percent and the executive staff grew by 36 percent. In the same time frame, secretarial staff grew by only 1.4 percent and faculty decreased by 6.8 percent.
If these data are representative, it appears that the cost of administering
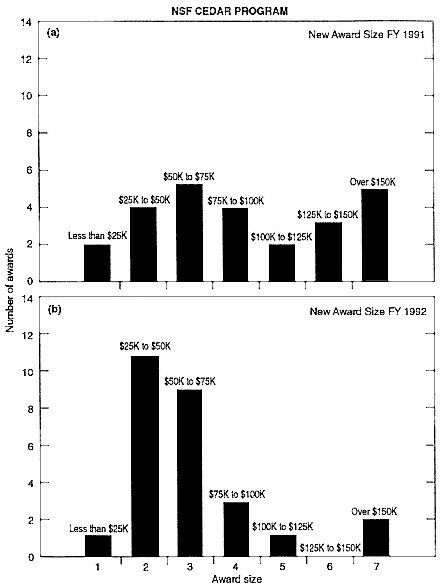
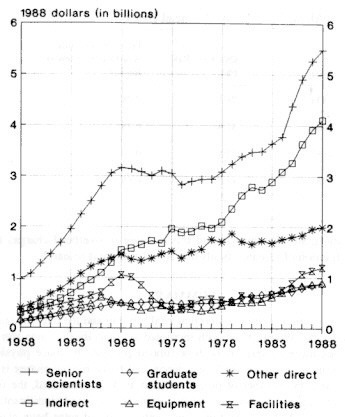
FIGURE 5.3 Estimated cost components of U.S. academic R&D budgets, 1958 to 1988 (in billions of 1988 dollars). Source: Government-University-Industry Research Roundtable, Science and Technology in the Academic Enterprise: Status, Trends, and Issues (Washington, D.C., National Academy Press, 1989), Figure 2-43.
Note: Constant dollars were calculated using the GNP Implicit Price Deflator. Definition of Terms: Estimated personnel costs for senior scientists and graduate studen ts include salaries and fringe benefits, such as insurance and retirement contributions. Other direct costs include such budget items as materials and supplies, travel, subcontractors, computer services, publications, consultants, and support costs Indirect costs include general administration, department administration, building operation and maintenance, depreciation and use, sponsored research projects administration, libraries, and student services administration. Equipment costs include reported expenditures of separately budgeted current funds for the purchase of research equipment and estimated capital expenditures for fixed or built-in research equip ment. Facilities costs include estimated capital expenditures for research facilities, including facilities constructed to house scientific apparatus. Data: National Science Foundation, Division of Policy Research and Analysis. Database: CASPAR. Some of the data within this data base are estimates, incorporated where there are discontinuities within data series or gaps in data collection. Primary data source: National Science Foundation, Division of Science Resources Studies, Survey of Scientific and Engineering Expenditures at Universities and Colleges; National Institutes of Health; American Association of University Professors; National Association of State Universities and Land-Grant Colleges.
TABLE 5.2 UCLA Overhead Rates
|
Year |
Overhead Rate (%) |
Fraction of Grants Available to Support Research |
|
1978 |
28.1 |
0.78 |
|
1982 |
35.4 |
0.73 |
|
1985 |
42.5 |
0.70 |
|
1989 |
43.5 |
0.69 |
contracts and grants has grown, and this increase in overhead charges has reduced the fraction of research funds that actually support research.
SUMMARY
Previous chapters demonstrated that total funding and the overall size of the space physics community have both increased at basically the same rate. This chapter looks more closely at the base-funded program in space physics, the traditional source of support for little science, and finds that the picture is not so rosy. Although the number of proposals submitted has increased, the fraction receiving funding and the average grant size have decreased significantly over the past decade. At the same time, university overhead rates have claimed a growing chunk of grant monies.
These factors combine to paint a picture of research scientists struggling to remain funded. The average space physics scientist must now write two to four proposals per year, twice the number required five years ago. Translating this time drain into dollars, we estimate that the writing and reviewing of submitted proposals currently represent a hidden cost that may be as large as 50 percent of the funding being awarded.
Clearly, the base-funded program has not participated proportionately in the overall space physics research funding increase. Although we do not attempt to quantify the effect this has had on the quality of science produced, we can conclude that the core program has become much less efficient during the past decade and that this trend is likely to continue in the future.