
The Federal Budget and Environmental Priorities1
ALBERT H. TEICH
American Association for the Advancement of Science
CONTENTS
INTRODUCTION
Focus
The federal budget is the central process of American government. Through the budget process, incommensurable quantities are compared, priorities are set, and the plans of federal agencies are laid out for Congress and the public to review, approve, modify, or reject. If one is to ask, therefore, what are the nation's priorities with regard to the environment, the federal budget is an obvious place to look for the answer. This paper is an attempt to take a rough first cut at examining national environmental priorities using federal budget data as its primary source. Specifically, it will attempt to respond to several questions:
-
How are federal environmental priorities reflected in budgetary patterns and trends?
-
How have these priorities shifted over the past several years?
-
What part does environmental R&D play in overall federal funding for environmental programs?
-
How does funding for environmental R&D compare to overall federal R&D funding?
-
What can be said about the relation between funding for environmental programs and current statements of environmental goals?
Caveats Regarding the Analysis
Budget analysis is a complex and tedious undertaking. Time and resource constraints limit this paper to no more than a first approximation at responding to the above questions. In addition, several conceptual and practical issues that may limit the utility of the analysis should be noted.
First is the difficulty of defining environmental programs in an unambiguous manner. A huge variety of government activities impact the environment and could be classified as environmental programs. These range from energy production and conservation programs to agricultural efforts (e.g., promotion of integrated pest management) to outdoor recreation programs. At some level, it is necessary to make fairly arbitrary distinctions in order to limit the scope of "environmental." The umbrella covering environmental programs is discussed below. Differing definitions will, of course, yield different results.
Second is the difficulty of obtaining budget data at an appropriate level of aggregation. Extracting information about individual programs from federal budget documents is an arduous task when the subject is the current year's budget. The job is made infinitely more difficult in looking at trend data, as the budget documents tend to be ephemeral and organizational changes often make it difficult to track programs from year to year.
Third, and more fundamental, is the fact that budgetary data are an imperfect indicator of priority. The spending levels of different federal programs do indicate that society (through its government) has decided to allocate more money for one than the other, which can be construed as an indicator of preference, or a measure of priority. Yet some things cost more by nature. Launching a satellite to monitor conditions in the upper atmosphere may be considerably more expensive than a project that involves conducting national field studies of water quality. Their costs may differ by a factor of ten or even 100. This does not necessarily mean that one is 100 times more important than the other.
Fourth, in judging the relations between environmental budgets and statements of environmental goals there is the problem of whose goals are "national goals." In our pluralistic society, there may be numerous conflicting views of what constitutes an appropriate set of national goals for the environment. Indeed, the very existence of the Forum for which this paper has been prepared, is evidence of the lack of consensus on such goals.
Finally, it should be remembered that the federal government is not the only source of funds for environmental programs. State and local governments as well as the private sector expend considerable sums on programs and activities related to the environment. None of these are included in the present analysis. The federal government may choose to spend more or less on a particular activity not because it is more or less important, but because others are already covering it adequately.
ENVIRONMENTAL PRIORITIES AND TRENDS IN THE FEDERAL BUDGET
EPA—A First Approximation
The Environmental Protection Agency (EPA) is the federal government's flagship agency for environmental regulation, for mitigation and remediation of problems caused by environmental pollution, for environmental monitoring, and for R&D related to these missions. It was formed in 1970 by bringing together units from several different federal departments and agencies, including components of the Department of the Interior and the then-Department of Health, Education, and Welfare. EPA's responsibilities include administration of programs under the Clean Air Act, the Clean Water Act, the Toxic Substances Control Act, the Safe Drinking Water Act, and several other major pieces of environmental legislation. Although most definitions of environmental programs include a considerable number of other federal activities, the level of funding for EPA and trends in the agency's budget are useful indicators of the priority of environmental protection at the federal level.
Overview of EPA's FY 1995 Budget
EPA's FY 1995 budget totals $5.731 billion. This figure includes $1.510 billion in rescissions enacted by the 104th Congress in the spring of 1995. Originally appropriated FY 1995 budget authority for EPA was $7.241 billion. The largest share of the rescission ($1.302 billion) was taken out of EPA's Water Infrastructure Financing program, which also represents the largest single element of the agency's budget. In the current budget, Water Infrastructure Financing represents 29 percent of EPA's total budget; prior to the rescission, it constituted 41 percent of EPA's budget. The upper portion of Table 1 shows EPA's FY 1995 budget by function, providing one view of its program priorities. (NOTE: All tables and charts are found at the end of this paper.)
As noted above, nearly a third of the agency's budget (down from two-fifths prior to the rescission) is devoted to the Water Infrastructure Financing program which provides support to state and local governments for construction and improvement projects to help meet water quality standards and ensure drinking water safety. The Clean Water State Revolving Fund awards grants to state programs that provide low cost financing to municipalities for sewage treatment projects. The Drinking Water State Revolving Fund offers loans to help governments improve their drinking water systems.
Second to Water Infrastructure in EPA's FY 1995 budget is the "Abatement, Control and Compliance" line under which EPA funds contracts, grants, and cooperative agreements for pollution abatement, control and compliance activities, as well administrative activities, including regulatory enforcement. These programs represent nearly one-fourth of EPA's current funding, a total of $1.405 billion.
Superfund, at $1.331 billion, is EPA's third major budget element in FY 1995, representing 23 percent or almost a quarter of total spending. This program is responsible for cleanup of hazardous waste sites and associated activities. Together, the three top program areas account for more than three-quarters of EPA's budget.
The "Research and Development" line, $335 million in FY 1995, represents less than 6 percent of EPA's budget. This is somewhat misleading, however. The R&D appropriations account finances mainly extramural research through grants, contracts, and cooperative agreements with industry, universities, nonprofits, and other federal agencies, as well as some in-house activities. The costs of most in-house R&D (including personnel and related costs) are funded through the "Program and Research Operations" account, and some is included in "Abatement, Control and Compliance.'' In addition, nearly $70 million of R&D is supported through Superfund and smaller amounts of R&D are supported under two other trust funds. Thus, EPA's total R&D in FY 1995 is estimated at $600 million, representing about 10.5 percent of the agency's budget. This is discussed in more detail below.
The "Program and Research Operations" account, it should be noted, also includes personnel costs and travel expenses associated with administering many other (non-R&D) EPA programs, excluding Superfund, the Water Infrastructure Financing program, and a few other areas.
A somewhat different view of EPA's budget priorities may be gained from the lower portion of Table 1, which displays FY 1995 funding by media. Again, Water Infrastructure Financing stands out, representing more than a quarter of the agency's budget when sliced in this manner. In fact, if one lumps this line together with the "Water Quality" and "Drinking Water" lines, it becomes apparent that water is EPA's dominant concern, at least in dollar terms ($2.148 billion or 37.5 percent of the total). Hazardous waste (combining Superfund and the ''Hazardous Waste" line) comes a close second ($1.623 billion, 28.3 percent), followed by air at just under 10 percent and "multimedia" at 7.6 percent ($438 million). Toxics, pesticides, and radiation account for small fractions. It should be noted that these figures do not include more than $650 million in "Management and Support" costs. The latter should be allocated among the programs and would augment their percentage shares somewhat. Figures 1 and 2 display this information in graphical format.
Trends in EPA's Budget
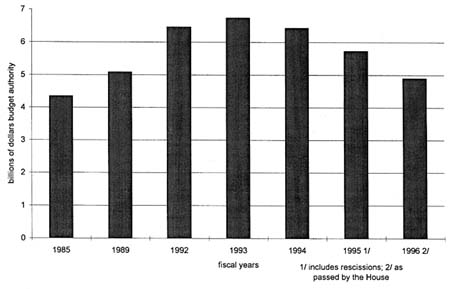
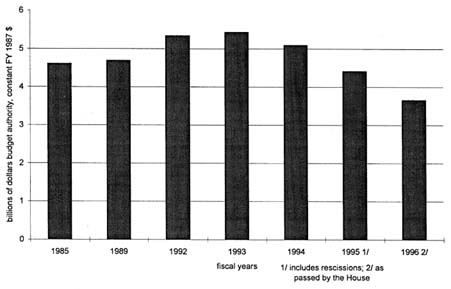
The FY 1995 rescission, following cuts in FY 1994, has turned EPA's budget trend sharply downward. As it stands now, EPA's FY 1995 budget is actually 4 percent below its level of ten years ago in constant dollars. Table 2 shows this long-term trend over the period FY 1985-1995, and Figures 3 and 4 display EPA's total budget in current and constant dollars over the decade. Table 2 also indicates that EPA's budget has been declining relative to other components of domestic discretionary spending in the federal budget. In FY 1985, EPA's budget represented 2.73 percent of total domestic discretionary spending. This figure peaked at 3.50 percent four years later in FY 1989 and has now declined to 2.67 percent. The table and charts also include the House-passed FY 1996 appropriation level. (As of this writing, the Senate has not yet considered EPA's appropriation.) As can be seen, EPA's budget would take an unprecedented cut under this legislation.
Environmental Programs in Other Federal Agencies
Defining "Environmental Programs"
While EPA is the major focus of environmental concern in the federal government, it does not come close to representing the full extent of federal efforts relating to the environment. Delimiting the federal role in the environment is not a straightforward task. In one sense, nearly everything the federal government
TABLE 1 Environmental Protection Agency Budget for Fiscal Year 1995 (budget authority in millions of dollars)
|
|
FY 1995a |
Percent of EPA Budget |
|
By Function |
||
|
Program and Research Operations |
922.0 |
16.1% |
|
Research and Development |
334.6 |
5.8% |
|
Abatement, Control & Compliance |
1,404.6 |
24.5% |
|
Buildings and Facilities |
-39.4 |
— |
|
Oil Spill Response |
20.0 |
0.3% |
|
Asbestos Loan Program |
0.0 |
0.0% |
|
Hazardous Substance Superfund |
1,331.3 |
23.2% |
|
L.U.S.T. Trust Fundb |
70.0 |
1.2% |
|
Water Infrastructure/State Revolving Funds |
1,659.6 |
29.0% |
|
Other |
28.5 |
0.5% |
|
Total, EPA Budget |
5,731.2 |
|
|
By Media |
||
|
Air |
558.4 |
9.7% |
|
Radiation |
42.8 |
0.7% |
|
Water Quality |
516.7 |
9.0% |
|
Drinking Water |
163.8 |
2.9% |
|
Water Infrastructure Financing |
1,467.1 |
25.6% |
|
Pesticides |
94.2 |
1.6% |
|
Toxic Substances |
124.9 |
2.2% |
|
Multimedia |
438.1 |
7.6% |
|
Hazardous Waste |
291.6 |
5.1% |
|
Hazardous Substance Superfund |
1,331.3 |
23.2% |
|
L.U.S.T.b |
70.0 |
1.2% |
|
Oil Spill Response |
20.0 |
0.3% |
|
Management and Support |
651.7 |
11.4% |
|
Buildings and Facilities |
-39.4 |
— |
|
Total EPA Budget |
5,731.2 |
|
|
SOURCE: EPA Budget Justification for FY 1996 and text of Public Law 104-19. a Adjusted to reflect rescissions enacted in Public Law 104-19. These rescissions total $1,509.6 million, of which $1,302.2 million are from Water Infrastructure/SRF. These rescissions are of FY 1995 as well as prior-year funds, but are scored against FY 1995 budget authority. The original FY 1995 budget authority was $7,240.8 million. b Leaking Underground Storage Tanks. |
||
does, from conducting military operations to shaping national economic policy, has an impact on the environment. In addition, the federal government owns nearly one-third of the land in the United States, holds title to the resources of the outer continental shelf, and manages fisheries and marine mammal populations in waters within 200 miles of the coast (Gramp, Teich, and Nelson 1992, p. 7).
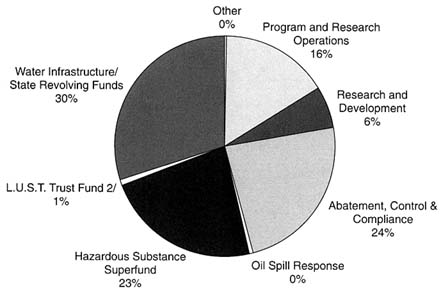
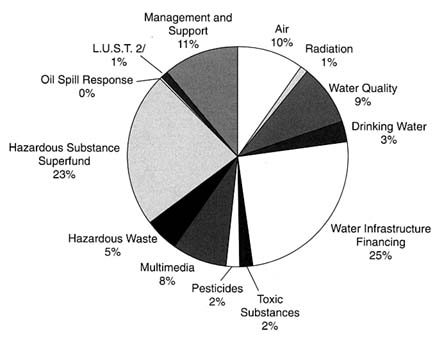
TABLE 2 Environmental Protection Agency Budget (budget authority in billions of dollars, by fiscal year)
|
|
FY 1985 |
FY 1989 |
FY 1992 |
FY 1993 |
FY 1994 |
FY 1995a |
House FY 1996b |
|
EPA budget |
4.35 |
5.08 |
6.46 |
6.74 |
6.44 |
5.73 |
4.89 |
|
Total domestic discretionary spending |
159.3 |
145.2 |
209.3 |
212.3 |
229.0 |
214.0 |
N/A |
|
EPA as % of total domestic discretionaryc |
2.73% |
3.50% |
3.09% |
3.17% |
2.81% |
2.67% |
— |
|
EPA budget (in constant FY 1987 dollars)d |
4.61 |
4.69 |
5.33 |
5.43 |
5.09 |
4.41 |
3.66 |
|
SOURCE: Office of Management and Budget, Budget of the United States Government Fiscal Year 1996 and OMB, Mid-Session Review of the 1996 Budget. a Adjusted to reflect rescissions enacted in Public Law 104-19. b Based on House-approved VA-HUD appropriations bill. c Excludes discretionary spending in defense and international programs. d Defiated using fiscal year GDP deflators from OMB. |
|||||||
Furthermore, the environment is integral to such federal functions as assisting the agricultural and energy federal sectors, managing the National Parks, predicting the weather, and assisting with natural disaster preparedness and recovery.
Rather than include practically everything the government does under the "environmental" rubric, we have taken a fairly narrow definition of environment, and included federal programs relating to pollution control and abatement, conservation and management of natural resources, and managing policy related to global climate change. This definition is essentially contiguous with the federal government's "Environment and Natural Resources" budget function, except that it excludes finding for reclamation projects, flood control, public lands acquisition, and other land management-oriented programs and it includes NASA environmental programs classified under "General Science and Space" budget function.
The scope includes environmental R&D in the various agencies, but goes well beyond R&d into operational programs. It encompasses activities in at least 12 federal civilian agencies plus the Department of Defense (DOD). Data are presented here for the eight largest among the civilian agencies. DOD (with the exception of the Army Corps of Engineers) is not included because data on its environmental programs were not available in a timely manner. Comments on DOD are included in a few places based on data obtained in the author's 1992 study of federal funding for environmental R&D (Gramp, Teich, and Nelson 1992).
Budget Trends
Table 3 presents a summary of federal programs in environment and natural resources that fit the definition presented above. The information in the table is based on federal budget documents. The total shown on the table, $22.7 billion in FY 1995, is probably a low-end estimate of the government's total effort relating to the environment. Environmental R&D not included in the data set would add approximately $1 billion to this total (including DOD, the four civilian agencies omitted, and an estimate of environmental health research not covered in this analysis). The total shown represents a bit more than 10 percent of the federal government's total domestic discretionary spending.
Somewhat surprisingly, EPA shows up not at the top of the list but in second place among the agencies whose programs are identified in this table. Ranking first is the Department of Energy, mainly because of its Defense Environmental Restoration program (i.e., the nuclear materials and weapons facilities cleanup), which includes $4.855 billion in non-R&D activities and its nondefense Environmental Restoration and Waste Management program, funded at $723 million in FY 1995. Together, these efforts total $5.578 billion, nearly as much as the entire EPA budget. DOE also conducts a significant amount of environmental R&D, which, together with its other programs, including nuclear waste disposal and uranium enrichment decontamination, bring its total environmental portfolio to more than $7 billion.
Other major players among federal agencies include the Forest Service (within the Department of Agriculture); NASA, with life sciences research and Mission to Planet Earth; and NOAA, among whose programs and agencies are the National Weather Service, the National Marine Fisheries Service, the National Ocean Service, and a range of oceanic and atmospheric research programs. Also on the chart are the Departments of the Interior (with just over $1 billion in FY 1995), the National Science Foundation, and R&D conducted by the Army Corps of Engineers. The three-year trend in the bottom line of this table is essentially flat in current dollars, indicating a loss in constant dollars. And it does not take a clairvoyant to see that the trend over the next several years is likely to be even more negative.
FUNDING FOR ENVIRONMENTAL R&D
Environmental R&D in Relation to Other Environmental Programs
As discussed in the previous section, the agencies with the largest environmental programs are DOE and EPA. In both of these agencies, environmental R&D is a relatively small part of overall spending for environmental programs. EPA's R&D represents a total of $600 million out of the agency's $5.7 billion budget, about 10.5 percent. DOE's environmental R&D, estimated at $580 million, constitutes only 8 percent of its $7.1 billion in environmental programs,
TABLE 3 Estimate of Environmental Programs in the Federal Government (budget authority in millions of dollars, by fiscal year)
|
|
Actual FY 1993 |
Est. FY 1994 |
Est. FY 1995a |
Avg. Annual % Change FY 1993-95 |
|
Environmental Protection Agency |
6,737 |
6,436 |
5,731 |
-8% |
|
NASA |
1,024 |
1,255 |
1,481 |
20% |
|
Life Sciences (incl. non-terrestrial) |
140 |
187 |
141 |
5% |
|
Mission to Planet Earth |
884 |
1,068 |
1,340 |
23% |
|
NOAA |
1,534 |
1,796 |
1,816 |
9% |
|
National Ocean Service |
168 |
202 |
180 |
5% |
|
Nat'l Marine Fisheries Service |
223 |
265 |
269 |
10% |
|
Oceanic and Atmospheric Research |
202 |
233 |
259 |
13% |
|
National Weather Service |
533 |
683 |
659 |
12% |
|
NESDIS |
347 |
351 |
387 |
6% |
|
Marine Services |
61 |
63 |
62 |
1% |
|
National Science Foundation |
594 |
655 |
685 |
7% |
|
Environmental Programs R&D |
530 |
591 |
622 |
8% |
|
Non-R&D (logistical support) |
63 |
64 |
63 |
-1% |
|
Department of the Interior |
945 |
1,021 |
1,069 |
6% |
|
Department of Agricultureb |
5,626 |
5,483 |
4,459 |
-11% |
|
Natural Resources Conservation Service |
2,021 |
1,375 |
837 |
-36% |
|
Forest Service (non-R&D) |
3,259 |
3,751 |
3,260 |
1% |
|
Environmental R&D |
345 |
357 |
363 |
2% |
|
Department of Energy |
6,612 |
7,173 |
7,126 |
4% |
|
R&D Activities |
589 |
782 |
580 |
3% |
|
Environment, Safety and Health |
138 |
105 |
127 |
-2% |
|
Nuclear Safety Policy |
24 |
15 |
17 |
-11% |
|
Environmental Analysis |
12 |
9 |
0 |
-62% |
|
Env. Restor. and Waste Mngmt. (nondefense) |
692 |
673 |
723 |
2% |
|
Defense Env. Restoration (non-R&D) |
4,580 |
4,922 |
4,855 |
3% |
|
Uranium Enrichment Decontamination |
201 |
286 |
301 |
24% |
|
Defense Nuclear Waste Disposal |
100 |
120 |
129 |
14% |
|
Nuclear Waste Disposal Fund |
275 |
260 |
393 |
23% |
|
Corps of Engineers Environmental R&D |
29 |
31 |
36 |
12% |
|
National Institutes of Health |
251 |
259 |
267 |
3% |
|
Total Environmental Spending |
23,351 |
24,108 |
22,670 |
-1% |
|
SOURCE: Author's estimates based on agency budget justifications. Does not include funds for reclamation projects, flood control, public lands acquisition and other land management-oriented programs. a FY 1995 figures reflect rescissions of $1.5 billion from EPA's budget and rescissions from NOAA enacted in Public Law 104–19, but do not reflect other rescissions enacted in Public Laws 104–6 and 104–19. Detailed information on other rescissions not available at this time. b Includes environmental R&D and programs classified as "Natural Resources and Environment." |
||||
which are dominated by the huge costs of restoring environmental quality in DOE's defense facilities. Elsewhere in the government, however, R&D is a major (or in some cases the major) part of agency environmental programs.
Definition and Overview
An overview of environmental R&D in the federal government is contained in Table 4. Details on the environmental R&D activities of the major federal agencies are shown in Tables 5 through 17. As elsewhere in this paper, these tables do not include information on Department of Defense military activities. The tables show a three-year trend, from FY 1993 through FY 1995. The definition of environmental R&D is largely the same as in the author's previous work on federal funding for environmental R&D:
-
environmental sciences, including (a) environmental life sciences, such as environmental biology, forestry, marine biology, and related fields, and (b) physical environmental sciences, such as oceanography, geology, and atmospheric sciences, excluding extraterrestrial research;
-
engineering and other sciences related to the impacts of natural and anthropogenic activities on the environment, including prevention, control, amelioration, and regulation;
-
social sciences related to the environment, such as environmental economics, and social science research on cultural and institutional factors affecting sustainable development, pollution prevention, adaptation to global change, etc.; and
-
information and data sciences related to the environment, such as computer sciences and specialized information management R&D identified in agency budgets (Gramp, Teich, and Nelson 1992, p. 2).
There are, however, a few differences. The tables in this paper include the National Institute of Environmental Health Sciences, a unit of the National Institutes of Health, which was not included in the 1992 report because the working definition chosen for that report excluded environmental health. They exclude (for reasons of time and resources) several agencies with relatively small environmental R&D portfolios: the Agency for International Development (USAID), the Smithsonian Institution, the Tennessee Valley Authority (TVA), and the Department of Transportation (DOT).
The coverage of those agencies included is generally analogous to that in the 1992 report. However, because of organizational changes and changes in budget presentation, as well as possible inconsistencies in data collection techniques, the data from the 1992 tables, which cover FY 1990–1992, have not been integrated with the FY 1993–1995 data collected for this paper. To allow readers to gain a rough sense of the trends over six years, the tables from the 1992 report are
TABLE 4 Estimate of Total Environmental R&D (budget authority in millions of dollars, by fiscal year)
|
|
Actual FY 1993 |
Est. FY 1994 |
Est. FY 1995a |
Avg. Annual % Change FY 1993–95 |
|
National Aeronautics and Space Admin. |
967 |
1,152 |
1,402 |
20% |
|
Department of Energy |
589 |
782 |
580 |
3% |
|
National Science Foundation |
530 |
591 |
622 |
8% |
|
Department of the Interior |
546 |
568 |
569 |
2% |
|
USGS |
353 |
365 |
357 |
0% |
|
Other |
193 |
204 |
212 |
5% |
|
Department of Agriculture |
345 |
357 |
363 |
2% |
|
ARS |
127 |
134 |
142 |
5% |
|
CSRS |
105 |
102 |
99 |
-3% |
|
Forest Service |
104 |
111 |
114 |
5% |
|
ERS |
10 |
9 |
9 |
-5% |
|
Environmental Protection Agencya |
497 |
588 |
600 |
10% |
|
National Oceanic and Atmospheric Admin.a |
357 |
443 |
447 |
13% |
|
AIDb |
N/A |
N/A |
N/A |
— |
|
Smithsonianc |
N/A |
N/A |
N/A |
— |
|
TVAd |
N/A |
N/A |
N/A |
— |
|
Corps of Engineers |
29 |
31 |
36 |
12% |
|
Transportatione |
N/A |
N/A |
N/A |
— |
|
National Institutes of Health |
251 |
259 |
267 |
3% |
|
Department of Defensef |
N/A |
N/A |
N/A |
— |
|
Total Environmental R&D |
4,111 |
4,771 |
4,885 |
9% |
|
SOURCE: Author's estimate based on agency budget justification and other supporting documents. a Does not reflect rescissions enacted in FY 1995 except for NOAA and EPA (see agency tables). Detailed information on rescissions in other agencies not available at this time. b FY 1992 level for AID was $45 million. c FY 1992 level for Smithsonian was $33 million. d FY 1992 level for TVA was $31 million. e FY 1992 level for DOT was $17 million. f FY 1992 level for DOD was $577 million. N/A = Data not available at this time. |
||||
included as Appendix A. The appendix tables also provide information on environmental research in DOD, not available for the more recent years. In FY 1992, DOD spent $577 million on environmental R&D, representing about 13 percent of the total federal investment in environmental R&D in that year. Adding this amount, about $100 million for the agencies with smaller environmental R&D programs, and about $400 million for environmental health not included suggests that data here understate overall federal spending on environmental R&D in FY 1995 by a bit over $1 billion.
Agency Highlights
The leading agency in environmental R&D—at least in terms of budget levels in FY 1995—is NASA, which is expected to spend $1.4 billion, the largest share of which will go to its Earth Observing System (EOS). Details are shown in Table 5. NASA's capabilities in space transportation provide it with the means for conducting important large-scale research on the earth's atmosphere and surface. The nature of these studies, and their context within a large and costly space program, make them the most expensive single element of federal environmental R&D. While some of the work relates to pollution control and abatement, the largest share is devoted to aspects of global change and other large-scale atmospheric, oceanic, and geologic processes. NASA's environmental R&D has grown at an average annual rate of 20 percent since FY 1993, although this is not likely to be sustained in coming years.
DOE (shown in Table 6) supports a wide range of environmental R&D, most of it associated with mitigation of the effects of energy production on the environment. Environmental restoration and waste management R&D, part of the much larger environmental restoration effort comprises the greatest share. Clean coal technology has also been a major focus of DOE's work, although it was sharply reduced in FY 1995. DOE's research also contributes to the national effort on global change through studies of carbon dioxide in the atmosphere, conducted mainly at national laboratories and universities. DOE's environmental R&D programs total $580 million in FY 1995, down about $200 million from FY 1994.
Basic research on the environment is the province of NSF, whose efforts total some $622 million in FY 1995 and have grown at a rate of 8 percent a year over the FY 1993–1995 period. (See Table 7.) Most of these efforts are in environmental sciences, including ecology and environmental biology, ocean sciences, atmospheric sciences, earth sciences, and polar programs. NSF also funds social science research related to global change as well as engineering research in a number of environmental areas, including earthquake hazard mitigation. NSF funds most of its environmental research through investigator-initiated grants to academic researchers and in FY 1992 NSF was responsible for nearly half of federal grant funding for environmental R&D (Gramp, Teich, and Nelson 1992, p. 26).
The Department of the Interior is another key source of support for environmental R&D, as shown in Tables 8 and 9. The U.S. Geological Survey, whose long-standing mandate is to classify and analyze the nation's water, mineral, energy, and other geologic resources, also conducts work on water quality, nuclear waste, energy development, natural hazards, and global change. Other agencies in the Interior Department that conduct environmental R&D include the National Biological Service, Bureau of Mines, Minerals Management Service, and National Park Service. Interior's environmental R&D programs total nearly $570 million.
Environmental research is supported by many units of the Department of
TABLE 5 Estimate of Environmental R&D at the National Aeronautics and Space Administration (budget authority in millions of dollars, by fiscal year)a
|
|
Actual FY 1993 |
Actual FY 1994 |
Est. FY 1995 |
Avg. Annual % Change FY 1993–95 |
|
Environmental Sciences |
||||
|
Earth Observing System (EOS) |
264 |
393 |
591 |
50% |
|
Earth Probes |
99 |
96 |
82 |
-9% |
|
Payload and Instrument Development |
35 |
26 |
20 |
-26% |
|
Mission Operations and Data Analysis |
94 |
98 |
97 |
1% |
|
Airborne Science and Applications |
21 |
25 |
26 |
12% |
|
Interdisciplinary Analysis |
4 |
5 |
42 |
376% |
|
Process Studies |
119 |
126 |
118 |
-0% |
|
Modelling and Data Analysis |
43 |
44 |
42 |
-1% |
|
Ocean Color Data |
16 |
3 |
1 |
-73% |
|
Life Sciences, Research and Analysis |
53 |
55 |
51 |
-2% |
|
Construction of Facilities, Global Change |
0 |
12 |
17 |
— |
|
Estimated Intramural Research |
70 |
75 |
80 |
6% |
|
Subtotal |
818 |
958 |
1165 |
19% |
|
Information and Data R&D |
||||
|
EOS Data and Information Systems |
131 |
188 |
231 |
33% |
|
CIESINb |
18 |
5 |
6 |
-26% |
|
Subtotal |
149 |
193 |
237 |
26% |
|
Total, NASA Environmental R&D |
967 |
1,152 |
1,402 |
20% |
|
SOURCE: Author's estimate based on agency budget justification and cross-cut by field of science. a These estimates exclude funding for environmental sciences in NASA's planetary and commercial applications programs. b Consortium for International Earth Science Information Networks. |
||||
Agriculture (USDA), as shown in Tables 10 through 13, which include the Agricultural Research Service (ARS), the Cooperative State Research, Education, and Extension Service (CSRESS), the Economic Research Service (ERS), and the Forest Service (FS). Together, these units bring the USDA total to $364 million. ARS, nearly all of whose work is done in house, represents almost 40 percent of this total. Its major foci include soil and soil-water relationships, as well as environmental biology and ecology. Other ARS studies relate to water conservation, watershed management, and pollution issues relating to agriculture. CSRESS provides nearly $100 million for grants on e environmental issues associated with agriculture. These include both formula and competitive grants. Research related to management of publicly owned national forests and rangelands, including over 12 million acres of wetlands, is carried out by the Forest Service, whose expenditures on environmental R&D totaled $114 million in FY 1995.
TABLE 6 Estimate of Environmental R&D at the Department of Energy (budget authority in millions of dollars, by fiscal year)
|
|
Actual FY 1993 |
Actual FY 1994 |
Actual FY 1995 |
Avg. Annual % Change FY 1993–95 |
|
Environmental Sciences |
||||
|
Atmospheric Science |
12 |
13 |
13 |
4% |
|
Marine Transport |
7 |
7 |
7 |
-1% |
|
Terrestrial Transport |
18 |
18 |
19 |
2% |
|
Ecosystem Functioning and Response |
7 |
4 |
6 |
-2% |
|
CO2, Core Program |
19 |
16 |
22 |
9% |
|
CO2, CHAMMPa |
11 |
10 |
10 |
-3% |
|
CO2, Atmospheric Radiation Measurement |
31 |
34 |
30 |
-0% |
|
CO2, Oceans Research |
5 |
5 |
4 |
-9% |
|
CO2, Nat'l Institute for Global Env. Change |
11 |
11 |
11 |
2% |
|
CO2, Education |
3 |
3 |
3 |
-7% |
|
Basic Energy Sciences, Geosciences |
20 |
19 |
19 |
-0% |
|
Bonneville Power, Fish and Wildlifeb |
1 |
1 |
1 |
13% |
|
Subtotal |
145 |
142 |
146 |
0% |
|
Social Sciences |
||||
|
CO2, Global Change Integrated Assessmt. |
2 |
2 |
3 |
39% |
|
Engineering and Related R&D |
||||
|
Clean Coal Technology Program |
0 |
222 |
37 |
— |
|
Atomic Defense Env. Waste and Restoration |
248 |
248 |
238 |
-2% |
|
Coal Environmental Research |
186 |
166 |
154 |
-9% |
|
Oil Shale Research |
5 |
0 |
0 |
— |
|
Subtotal |
440 |
635 |
429 |
6% |
|
Information and Data R&D |
||||
|
CO2, Information and Integration |
2 |
2 |
2 |
-8% |
|
Total, DOE Environmental R&D |
589 |
782 |
580 |
3% |
|
SOURCE: Author's estimate based on agency budget justification. a Computer Hardware, Advanced Math and Model Physics program. b Represents obligational authority financed by Bonneville Power Administration ratepayers. |
||||
The distribution of EPA's R&D budget by media, adding up to $600 million in FY 1995, is shown in Table 14: In contrast to the agency's overall budget in which expenditures for water quality and drinking water dominate, multimedia R&D, at $329 million, is the largest area of R&D at EPA, followed by air quality and Superfund (hazardous waste). The shift of resources into multimedia R&D is an important and relatively recent development. Until about five years ago, the agency's research agenda was largely reactive, focusing on areas dictated by various
TABLE 7 Estimate of Environmental R&D at the National Science Foundation (budget authority in millions of dollars, by fiscal year)
environmental statutes. As described in a recent AAAS report, EPA has sought to redirect its research program to ''support both near-term studies needed by regulatory offices and the longer-term research needed to resolve scientific uncertainties about the interrelationships among environmental problems and their efforts on ecological and human communities (AAAS 1995, p. 123). A more complete description of EPA's R&D program is contained in Appendix B.
TABLE 8 Estimate of Environmental R&D at the Department of the Interior, U.S. Geological Survey (budget authority in millions of dollars, by fiscal year)
|
|
Actual FY 1993 |
Actual FY 1994 |
Est. FY 1995 |
Avg. Annual % Change FY 1993–95 |
|
Environmental Sciences |
||||
|
Global/Climate Change |
11 |
11 |
10 |
-5% |
|
Marine and Coastal Surveys |
37 |
36 |
36 |
-1% |
|
Earthquake Hazards |
50 |
54 |
49 |
-0% |
|
Volcano Hazards |
20 |
20 |
20 |
-0% |
|
Landslide Hazards |
2 |
2 |
2 |
-0% |
|
Water Resources Research Programa |
60 |
75 |
79 |
15% |
|
Water Research Grants |
6 |
6 |
4 |
-11% |
|
Mineral Resource Surveys |
48 |
47 |
45 |
-4% |
|
Energy Resource Surveys |
27 |
26 |
25 |
-3% |
|
Geomagnetism |
2 |
2 |
2 |
-1% |
|
Deep continental studies |
3 |
3 |
3 |
0% |
|
Subtotal |
266 |
281 |
275 |
2% |
|
Information and Data R&D |
||||
|
National Geologic Mapping |
22 |
23 |
22 |
-0% |
|
Research and Technologyb |
12 |
11 |
12 |
0% |
|
Advanced Cartography |
7 |
6 |
4 |
-18% |
|
Federal-State Water Program, Data/Analysis |
24 |
24 |
24 |
-1% |
|
Water Data Collection and Analysis |
22 |
20 |
21 |
-4% |
|
Subtotal |
87 |
84 |
82 |
-3% |
|
Total, USGS Environmental R&D |
353 |
365 |
357 |
0% |
|
SOURCE: Author's estimate based on agency R&D cross-cut. a Incorporates programs in Regional Aquifer System Analysis, Core Hydrologic Research, Water Resources Assessment, Toxic Substances Hydrology, Acid Rain, Global Change Hydrology, Truckee-Carson Program, and National Water Quality Assessment Program. b Incorporates programs in Cartographic and Geographic Research, Nat'l Cartographic Requirements Coordination and Standards, and Geographic and Spatial Information Analysis. |
||||
Research on climate and weather, on marine sciences, on coastal and ocean management, and on fisheries is conducted by NOAA, the National Oceanic and Atmospheric Administration, a unit of the Department of Commerce. NOAA's environmental research totals $447 million. The Office of Oceanic and Atmospheric Research (OAR) is responsible for much of this work, and its efforts include NOAA's contributions to the interagency Global Change Research Program as well as studies called for by the 1990 Clean Air Act Amendments. Other units involved are the National Ocean Service and the National Marine Fisheries Service. NOAA's R&D program is presented in Table 15.
TABLE 9 Estimate of Environmental R&D at the Department of the Interior, Other Agencies (budget authority in millions of dollars, by fiscal year)
|
|
Actual FY 1993 |
Actual FY 1994 |
Actual FY 1995 |
Avg. Annual % Change FY 1993–95 |
|
Environmental Sciences |
||||
|
NBS, Population Dynamicsa |
15 |
14 |
14 |
-3% |
|
NBS, Ecosystems |
47 |
47 |
49 |
2% |
|
NBS, Cooperative Research Units |
18 |
15 |
15 |
-9% |
|
NBS, Research Center Maintenance |
15 |
16 |
17 |
6% |
|
National Park Service |
20 |
24 |
19 |
1% |
|
Bureau of Land Management |
0 |
0 |
2 |
84% |
|
Bureau of Reclamation, Global Change |
1 |
1 |
0 |
-24% |
|
Subtotal |
117 |
118 |
116 |
-0% |
|
Social Sciences |
||||
|
Office of the Secretary |
0 |
0 |
0 |
-55% |
|
Engineering and Related R&D |
||||
|
Bureau of Mines |
17 |
21 |
32 |
37% |
|
Minerals Management Service |
6 |
20 |
22 |
115% |
|
Bureau of Reclamation |
8 |
9 |
6 |
-11% |
|
Subtotal |
31 |
50 |
59 |
39% |
|
Information and Data R&D |
||||
|
NBS, Inventory and Monitoring |
31 |
22 |
22 |
-14% |
|
NBS, Information Transfer |
15 |
14 |
14 |
-0% |
|
Subtotal |
45 |
35 |
36 |
-9% |
|
Total, DOI, Other Agencies' Env. R&D |
193 |
204 |
212 |
5% |
|
SOURCE: Author's estimates based on agency budget justification and R&D cross-cuts. a National Biological Service. Some R&D activities of other agencies were transferred to NBS in FY 1994. FY 1993 totals have been adjusted for comparability. |
||||
The Army Corps of Engineers contributes a small, but important, component of the federal government's environmental R&D. Its programs, which are mainly in engineering and total $36 million in FY 1995, are shown in Table 16. They include modest efforts in coastal engineering, in flood control and navigation, in aquatic plant control, and a variety of other areas.
The budget for the National Institute of Environmental Health Sciences (NIEHS), which totals $267 million is shown in Table 17. In 1992, total environmental health R&D in the federal government was estimated at about $700 million. This figure included activities at NIEHS as well as environmental health R&D in the Food and Drug Administration, the Centers for Disease Control, the
TABLE 10 Estimate of Environmental R&D at the Department of Agriculture, Agricultural Research Service (budget authority in millions of dollars, by fiscal year)a
Department of Energy, and EPA. Except for NIEHS and EPA, none of this R&D is included in this paper.
Environmental R&D in the Context of Overall Federal R&D
Environmental R&D is a relatively small component of total federal R&D. According to NSF figures, in FY 1985, R&D devoted to the "environment and natural resources" budget function represented 2.1 percent of total federal R&D and 6.5 percent of nondefense R&D. By FY 1994, with defense R&D shrinking and health and space research growing, environmental and natural resources R&D had risen to 2.7 percent of total R&D, but declined to 6.0 percent of nondefense
TABLE 11 Estimate of Environmental R&D at the Department of Agriculture, Cooperative State Research, Education, and Extension Service (budget authority in millions of dollars, by fiscal year)
|
|
Actual FY 1993a |
Est. FY 1994a |
Est. FY 1995a |
Avg. Annual % Change FY 1993–95 |
|
Environmental Sciences |
||||
|
Special Grants |
13 |
11 |
9 |
-16% |
|
Competitive Grants |
21 |
22 |
22 |
3% |
|
Hatch/Agricultural Experiment Stations |
20 |
21 |
21 |
0% |
|
Cooperative Forestry |
3 |
3 |
3 |
6% |
|
1890 Colleges and Tuskegee |
3 |
3 |
3 |
1% |
|
Animal Health |
0% |
|||
|
Subtotal |
59 |
59 |
57 |
-2% |
|
Social Sciences |
||||
|
Special Grants |
1 |
0 |
0 |
-16% |
|
Competitive Grants |
2 |
2 |
2 |
3% |
|
Hatch/Agricultural Experiment Stations |
6 |
7 |
7 |
0% |
|
Cooperative Forestry |
5 |
6 |
6 |
6% |
|
1890 Colleges and Tuskegee |
1% |
|||
|
Subtotal |
14 |
15 |
15 |
2% |
|
Engineering and Related R&D |
||||
|
Special Grants |
16 |
13 |
11 |
-16% |
|
Competitive Grants |
5 |
5 |
5 |
3% |
|
Hatch/Agricultural Experiment Stations |
10 |
10 |
10 |
0% |
|
Cooperative Forestry |
0 |
0 |
0 |
6% |
|
1890 Colleges and Tuskegee |
1% |
|||
|
Animal Health |
0% |
|||
|
Subtotal |
31 |
29 |
27 |
-7% |
|
Total, CSREES Environmental R&D |
105 |
102 |
99 |
-3% |
|
SOURCE: Author's estimates. * Less than $500,000. a CSRS budget authority has been projected based on 1993 data in the Current Research Information System for goals pertaining to the environment and for environmental sciences research supporting other goals. |
||||
R&D (NSB 1993, table 4–26). AAAS's federal budget data indicate that in the post-rescission FY 1995 budget, environment and natural resources constitutes 6.2 percent of nondefense R&D.
To gain a sense of the scale of environmental research compared to other areas of research in various agencies, one can compare the figures for environmental
Table 12 Estimate of Environmental R&D at the Department of Agriculture, Economic Research Service (budget authority in millions of dollars, by fiscal year)a
Table 13 Estimate of Environmental R&D at the Department of Agriculture, Forest Service (budget authority in millions of dollars, by fiscal year)a
Table 14 Estimate of Environmental R&D at the Environmental Protection Agency (budget authority in millions of dollars, by fiscal year)
|
|
Actual FY 1993 |
Est. FY 1994 |
Est. FY 1995a |
Avg. Annual % Change FY 1993–95 |
|
By Media |
||||
|
Multimedia |
164 |
265 |
329 |
43% |
|
Air Quality |
87 |
86 |
79 |
-5% |
|
Acid Deposition |
16 |
10 |
2 |
-58% |
|
Global Change |
24 |
31 |
23 |
0% |
|
Water Quality |
30 |
27 |
22 |
-13% |
|
Drinking Water |
19 |
20 |
22 |
7% |
|
Hazardous Waste |
38 |
31 |
27 |
-17% |
|
Pesticides |
14 |
13 |
14 |
-2% |
|
Toxic Substances |
27 |
22 |
18 |
-17% |
|
Management |
6 |
6 |
7 |
11% |
|
Buildings and Facilities |
3 |
5 |
0 |
-5% |
|
Rescission from FY 1995: |
-15 |
|
|
|
|
Trust Funds |
||||
|
Superfund |
65 |
70 |
67 |
2% |
|
Leaking Underground Storage Tanks |
0 |
0 |
0 |
2% |
|
Oil Spill Response |
2 |
2 |
2 |
-7% |
|
Total EPA Environmental R&D |
497 |
588 |
600 |
10% |
|
Source: Author's estimates based on agency budget justification, R&D cross-cuts, and other supporting documents. Includes R&D management support, environmental health R&D, and other environmental R&D. a Adjusted to reflect rescissions enacted in Public Law 104-19. |
||||
R&D by agency in Table 4 to the overall R&D budgets of these agencies. These overall R&D budgets are shown in a table drawn from the most recent AAAS R&D Report and included in Appendix C. As might be expected, these figures vary widely. At one extreme is EPA, where 100 percent of the agency's R&D is (not surprisingly) classified as environmental. At the other is NIH, where the environmental research in the relatively small NIEHS comprises only 2.5 percent of NIH's total R&D. Others at the high end include the Department of the Interior (83 percent), NOAA (76 percent), and the Corps of Engineers (66 percent), while those at the low end include NASA (14 percent), DOE (9 percent), and NSF and USDA (each at 24 percent). Although FY 1995 data for DOD are not available, FY 1992 figures indicate that environmental research makes up something like 1 percent of DOD's R&D portfolio.
TABLE 15 Estimate of Environmental R&D at the National Oceanic and Atmospheric Administration (budget authority in millions of dollars, by fiscal year)a
|
|
Actual FY 1993 |
Actual FY 1994 |
Est.b FY 1995 |
Avg. Annual % Change FY 1993-95 |
|
Environmental Sciences |
||||
|
OAR, Climate and Global Change |
43 |
64 |
57 |
19% |
|
OAR, Weather Research |
27 |
42 |
41 |
28% |
|
OAR, Long-Term Climate and Air Quality |
22 |
27 |
33 |
22% |
|
OAR, Interannual/Seasonal |
7 |
7 |
7 |
-3% |
|
OAR, Marine Prediction |
18 |
18 |
18 |
1% |
|
OAR, Sea Grant/Env. Sciences |
12 |
19 |
25 |
43% |
|
OAR, Undersea Research |
8 |
21 |
16 |
69% |
|
NWS, National Weather Service |
28 |
48 |
33 |
19% |
|
NOS, Observation and Prediction |
2 |
0 |
0 |
-26% |
|
NOS, Estuarine and Coastal Assessment |
0 |
0 |
0— |
— |
|
NOS, Coastal Ocean Science |
13 |
12 |
9 |
-14% |
|
NOS, Coastal Management |
0 |
2 |
2 |
72% |
|
NOS, Ocean Management |
0 |
0 |
0 |
9% |
|
NMFS, Fisheries Resource Information |
90 |
92 |
102 |
6% |
|
NMFS, Fishery Information Analysis |
21 |
22 |
26 |
11% |
|
NMFS, Protected Species Management |
11 |
11 |
11 |
-0% |
|
NMFS, Marine Fisheries Grants to States |
6 |
6 |
9 |
27% |
|
NMFS, Fisheries Development |
16 |
17 |
17 |
3% |
|
Subtotal |
326 |
409 |
408 |
13% |
|
Social Sciences |
||||
|
OAR, Sea Grant |
1 |
1 |
1 |
0% |
|
NMFS, Fisheries Industry Information |
18 |
19 |
22 |
12% |
|
Subtotal |
19 |
20 |
23 |
11% |
|
Engineering and Related R&D |
||||
|
OAR, Sea Grant |
|
2 |
2 |
2 |
|
Information and Data R&D |
||||
|
NOS, Geodesy |
2 |
0 |
0 |
-32% |
|
NOS, Mapping and Charting |
0 |
4 |
4 |
435% |
|
National Env. Data and Information Service |
8 |
8 |
8 |
4% |
|
Subtotal |
10 |
12 |
13 |
12% |
|
Total, NOAA Environmental R&D |
357 |
443 |
447 |
13% |
|
SOURCE: Author's estimate based on agency R&D cross-cut and budget justification. a Agencies within NOAA include Oceanic and Atmospheric Research (OAR), National Weather Service (NWS), National Ocean Service (NOS), National Marine Fisheries Service (NMFS), and the National Environmental Data and Information Service. b Adjusted to reflect rescissions enacted in Public Law 104-19. |
||||
TABLE 16 Estimate of Environmental R&D at the Corps of Engineers (budget authority in millions of dollars, by fiscal year)
|
|
Actual FY 1993 |
Actual FY 1994 |
Est. FY 1995 |
Avg. Annual % Change FY 1993–95 |
|
Environmental Sciences |
||||
|
Long-Term Env. Effects of Dredging |
1 |
1 |
1 |
8% |
|
Social Sciences |
||||
|
Economic Impact of Global Warming |
0 |
0 |
0 |
-42% |
|
Risk Analysis |
1 |
1 |
2 |
10% |
|
Subtotal |
2 |
1 |
2 |
2% |
|
Engineering and Related R&D |
||||
|
Coastal Engineering |
6 |
4 |
6 |
9% |
|
Flood Control and Navigation |
4 |
4 |
5 |
19% |
|
Environmental Quality |
3 |
2 |
4 |
33% |
|
Water Resource Planning |
0 |
0 |
0 |
-2% |
|
Aquatic Plant Control |
3 |
6 |
7 |
47% |
|
Wetlands Research |
7 |
5 |
0 |
62% |
|
Coastal Inlet Research |
0 |
3 |
4 |
— |
|
River Confluence Ice Research |
0 |
0 |
1 |
— |
|
Zebra Mussel Control |
1 |
2 |
2 |
42% |
|
Oil Spill Research |
0 |
0 |
0 |
— |
|
Subtotal |
24 |
28 |
31 |
13% |
|
Information and Data R&D |
||||
|
Surveying and Remote Sensing |
2 |
1 |
2 |
24% |
|
Total, Corps of Engineers Env. R&D |
29 |
31 |
36 |
12% |
|
SOURCE: Author's estimate based on agency budget justification and related data. |
||||
ENVIRONMENTAL FUNDING AND NATIONAL ENVIRONMENTAL GOALS: CONCLUSIONS AND OUTLOOK
A quick look at Tables 3 and 4 demonstrates the pitfalls of judging the priority of environmental programs simply by looking at budget numbers. In strict dollar terms, the leading agency is the Department of Energy at $7.1 billion (out of total of $22.7 billion), the largest share of which is for defense environmental restoration. In second place is EPA ($5.7 billion) whose budget, as noted above, is dominated by Water Infrastructure Financing and Superfund—i.e., sewage treatment grants and hazardous waste site cleanup. Following are Agriculture, Interior, NOAA, and NASA. The picture is a bit different in environmental R&D
TABLE 17 Estimate of Environmental R&D at the National Institutes of Health (budget authority in millions of dollars, by fiscal year)
|
|
Actual FY 1993 |
Est. FY 1994 |
Est. FY 1995 |
Avg. Annual % Change FY 1993–95 |
|
Environmental Health Sciences |
||||
|
National Institute of Environmental Health Sciences |
251 |
259 |
267 |
3% |
|
Subtotal |
251 |
259 |
267 |
3% |
|
Total NIH Environmental R&D |
251 |
259 |
267 |
3% |
|
SOURCE: Author's estimate based on agency budget justification. |
||||
(Table 4), where NASA dominates, spending more than a quarter of the federal government's resources for environmental R&D.
These are the areas in which the federal government is investing the largest shares of the money devoted to environmental programs. They are certainly important to the future of the nation and its environment. Few would argue, however, that these are the nation's top environmental priorities or that this distribution corresponds in any meaningful way to virtually anyone's statement of environmental goals.
To get out of this trap, one first of all needs much more fine-grained data on environmental programs so as to allow one to associate the programs with particular goals. Even more importantly, one needs to look beyond the raw numbers at such issues as the relative costs of achieving different goals, the role of the federal government relative to other actors for various goals, and the availability of technical means to achieve the goals. The issue then becomes not simply the level of spending for each of the various programs, but the sufficiency of the budgetary level relative to the estimated cost of achieving the goal and federal role in its achievement. Such an analysis, unfortunately, is well beyond the means available for this paper.
A glimpse at how one might begin such an analysis, however, might be gained from a look at the author's 1992 study (Gramp, Teich, and Nelson 1992). That study took a preliminary look at federal environmental R&D priorities by breaking down and reaggregating the data by scientific and engineering focus. Of the $4.5 billion in federal environmental R&D identified in that study, the bulk ($3.1 billion) was estimated to support R&D in the environmental sciences. About 70 percent of that amount ($2.2 billion) involved fields such as oceanography, geology, chemistry, and atmospheric sciences, while the balance ($0.9 billion) went to environmental life sciences, including environmental biology, forestry, biology, and marine biology.
Engineering and other R&D related to environmental impacts of anthropogenic and natural activities accounted for $1.2 billion; a large share of this went to mitigation efforts related to fossil-fuel consumption. The smallest component of environmental R&D identified in the 1992 study was social sciences, which came in at $41 million. Also modest in financial terms was the total for information and data systems, some $0.2 billion, much of it related to space-borne observing platforms and global change studies.
These data in themselves do not answer questions about goals and priorities, but they do point to a means whereby financial data can be related to arrays of environmental goals, such as those identified by the National Science and Technology Council's Committee on Environment and Natural Resources.
REFERENCES
American Association for the Advancement of Science, Intersociety Working Group, AAAS Report XX: Research and Development, FY 1996 (Washington, D.C.: 1995).
Kathleen M. Gramp, Albert H. Teich, and Stephen D. Nelson, Federal Funding for Environmental R&D: A Special Report (Washington, D.C.: American Association for the Advancement of Science, 1992).
National Science Board, Science and Engineering Indicators—1993. (Washington, D.C.: U.S. Government Printing Office, 1993). (NSB-93-1).
APPENDIX A
From: Kathleen M. Gramp, Albert H. Teich, and Stephen D. Nelson, Federal Funding for Environmental R&D: A Special Report (Washington, D.C.: American Association for the Advancement of Science, 1992), pp. 20–26 and 55–68.
Overview Tables
Table I-1. Estimate of Federal Funding For Environmental R&D by Agency1 (budget authority in millions of dollars, by fiscal year)
|
|
FY 1990 |
FY 1991 |
FY 1992 |
Avg. Annual % Change FY 1990–92 |
|
Agency for International Development |
43 |
38 |
45 |
2% |
|
USDA, Agricultural Research Service |
129 |
144 |
162 |
12% |
|
USDA, Cooperative State Research Service |
87 |
107 |
119 |
17% |
|
USDA, Economic Research Service |
6 |
6 |
7 |
14% |
|
USDA, Forest Service |
89 |
106 |
115 |
14% |
|
Corps of Engineers |
19 |
22 |
27 |
20% |
|
Department of Defense (military) |
445 |
599 |
577 |
14% |
|
Department of Energy |
882 |
709 |
799 |
5% |
|
Environmental Protection Agency |
307 |
307 |
347 |
6% |
|
DOI, Fish and Wildlife Service |
71 |
82 |
85 |
9% |
|
DOI, Geological Survey |
310 |
360 |
367 |
9% |
|
DOI, Other Agencies |
42 |
59 |
72 |
30% |
|
National Aeronautics and Space Admin. |
575 |
735 |
826 |
20% |
|
National Oceanic and Atmospheric Admin. |
250 |
290 |
319 |
13% |
|
National Science Foundation |
440 |
492 |
541 |
11% |
|
Smithsonian Institution |
27 |
31 |
33 |
11% |
|
Tennessee Valley Authority |
19 |
25 |
31 |
27% |
|
Department of Transportation |
9 |
10 |
17 |
40% |
|
Total, Environmental R&D |
3,748 |
4,121 |
4,489 |
9% |
|
Defense2 |
632 |
768 |
801 |
13% |
|
Nondefense |
3,116 |
3,353 |
3,687 |
9% |
|
Source: Authors' Estimates. 1 Excludes administrative overhead and R&D related to environmental health. 2 Defense includes Department of Defense and the Department of Energy's Atomic Energy Defense Programs. |
||||
Table I-2. Environmental and Other Nondefense R&D by Character of Work, FY 1992 (budget authority in billions of dollars)
|
|
Nondefense Env. R&D1 |
All Other Nondefense |
Total Nondefense |
|
Basic Research |
1.4 |
10.7 |
12.1 |
|
Applied Research |
1.3 |
7.6 |
8.9 |
|
Subtotal, Research |
2.7 |
18.3 |
21.0 |
|
Development |
0.9 |
6.4 |
7.3 |
|
R&D Facilities |
0.1 |
2.2 |
2.2 |
|
Total, Nondefense R&D |
3.7 |
26.9 |
30.6 |
|
Source: Authors' estimates based on AAAS Report XXVII, Research and Development FY 1993 (AAAS, March 1992). 1 Excludes administrative overhead and R&D related to environmental health. |
|||
Table I-3. Estimate of Environmental R&D by Agency Mission1 (budget authority in millions of dollars, by fiscal year)
|
|
FY 1990 |
FY 1991 |
FY 1992 |
Avg. Annual % Change FY 1990-92 |
|
RESEARCH AGENCIES |
||||
|
National Aeronautics and Space Admin. |
575 |
735 |
826 |
20% |
|
National Science Foundation |
440 |
492 |
541 |
11% |
|
DOI, Geological Survey |
310 |
360 |
367 |
9% |
|
National Oceanic and Atmospheric Admin.2 |
136 |
166 |
184 |
16% |
|
Smithsonian Institution |
27 |
31 |
33 |
11% |
|
Subtotal |
1,487 |
1,784 |
1,951 |
15% |
|
SECTOR-SPECIFIC AGENCIES |
||||
|
Department of Energy |
882 |
709 |
799 |
-5% |
|
Department of Defense (military) |
445 |
599 |
577 |
14% |
|
USDA, Agricultural Research Service |
129 |
144 |
162 |
12% |
|
USDA, Cooperative State Research Service |
87 |
107 |
119 |
17% |
|
USDA, Economic Research Service |
6 |
6 |
7 |
14% |
|
Agency for International Development |
43 |
38 |
45 |
2% |
|
Tennessee Valley Authority |
19 |
25 |
31 |
27% |
|
Bureau of Mines |
15 |
19 |
18 |
10% |
|
Department of Transportation |
9 |
10 |
17 |
40% |
|
Subtotal |
1,635 |
1,653 |
1,775 |
4% |
|
MANAGEMENT AGENCIES |
||||
|
Environmental Protection Agency |
307 |
307 |
347 |
6% |
|
National Oceanic and Atmospheric Admin.3 |
113 |
124 |
135 |
9% |
|
USDA, Forest Service |
89 |
106 |
115 |
13% |
|
DOI, Fish and Wildlife Service |
71 |
82 |
85 |
9% |
|
DOI, Other Agencies |
27 |
40 |
54 |
40% |
|
Corps of Engineers |
19 |
22 |
27 |
20% |
|
Subtotal |
627 |
679 |
763 |
10% |
|
Total, Environmental R&D |
3,748 |
4,121 |
4,489 |
9% |
|
Source: Authors' estimates. 1 Excludes administrative overhead and R&D related to environmental health. 2 Includes Oceanic and Atmospheric Research, National Weather Service, and National Environmental Data and Information Service. 3 Includes National Marine Fisheries Service and National Ocean Service. |
||||
Table I-4. Estimate of Distribution of Environmental R&D by Field and Agency, FY 19921 (budget authority in millions of dollars)
|
|
Environmental Sciences |
Engineering & Related R&D |
Social Sciences |
Information & Data |
Total |
|
AID |
31 |
5 |
9 |
0 |
45 |
|
USDA |
324 |
61 |
16 |
3 |
403 |
|
Corps |
1 |
23 |
1 |
2 |
27 |
|
DOD (military) |
432 |
146 |
0 |
0 |
577 |
|
DOE |
129 |
667 |
1 |
2 |
799 |
|
EPA |
190 |
149 |
1 |
8 |
347 |
|
DOI |
406 |
31 |
86 |
524 |
|
|
NASA |
718 |
0 |
0 |
108 |
826 |
|
NOAA |
305 |
2 |
1 |
11 |
319 |
|
NSF |
503 |
26 |
12 |
0 |
541 |
|
Smithsonian |
33 |
0 |
0 |
33 |
|
|
TVA |
0 |
31 |
0 |
0 |
31 |
|
DOT |
0 |
17 |
0 |
0 |
17 |
|
Total, Environ. R&D |
3,072 |
1,156 |
41 |
219 |
4,489 |
|
Defense2 |
432 |
370 |
0 |
0 |
801 |
|
Nondefense |
2,641 |
786 |
41 |
219 |
3,687 |
|
Estimated Research3 |
2,533 |
388 |
39 |
147 |
3,107 |
|
Source: Authors' estimates. * Less than $500,000. 1 Excludes administrative overhead and R&D related to environmental health. 2 Defense includes Department of Defense and the Department of Energy's Atomic Energy Defense Programs . 3 Basic and applied research. |
|||||
Table I-5. Estimate of Federal Funding for R&D in Physical Environmental Sciences (budget authority in millions of dollars, by fiscal year)
|
|
FY 1990 |
FY 1991 |
FY 1992 |
Avg. Annual % Change FY 1990–92 |
|
Agency for International Development |
5 |
3 |
4 |
-15% |
|
USDA, Agricultural Research Service |
13 |
15 |
17 |
16% |
|
USDA, Forest Service |
10 |
10 |
10 |
2% |
|
Department of Defense (military) |
411 |
448 |
429 |
2% |
|
Department of Energy |
90 |
105 |
117 |
14% |
|
Environmental Protection Agency |
81 |
74 |
105 |
14% |
|
DOI, Geological Survey |
239 |
273 |
281 |
8% |
|
DOI, Bureau of Reclamation |
0 |
2 |
3 |
-- |
|
National Aeronautics and Space Admin. |
507 |
603 |
632 |
12% |
|
National Oceanic and Atmospheric Admin. |
117 |
146 |
163 |
18% |
|
National Science Foundation |
320 |
362 |
398 |
11% |
|
Smithsonian Institution |
0 |
1 |
1 |
-- |
|
Total, Physical Environmental Sciences |
1,793 |
2,044 |
2,160 |
10% |
|
Source: Authors' estimates. |
||||
Table I-6. Estimate of Federal Funding for Environmental Life Sciences R&D1 (budget authority in millions of dollars, by fiscal year)
Table I-7. Estimate of federal Funding for Engineering and Other R&D Related to Environmental Impacts (budget authority in millions of dollars, by fiscal year)
|
|
FY 1990 |
FY 1991 |
FY 1992 |
Avg. Annual % Change FY 1990–92 |
|
Agency for International Development |
2 |
2 |
5 |
56% |
|
USDA, Agricultural Research Service |
29 |
33 |
38 |
15% |
|
USDA, Cooperative State Research Service |
13 |
15 |
17 |
11% |
|
USDA, Forest Service |
6 |
6 |
6 |
2% |
|
Corps of Engineers |
17 |
19 |
23 |
17% |
|
Department of Defense (military) |
32 |
149 |
146 |
114% |
|
Department of Energy |
774 |
590 |
667 |
-7% |
|
Environmental Protection Agency |
157 |
154 |
149 |
-2% |
|
DOI, Other Agencies |
22 |
28 |
31 |
20% |
|
National Oceanic and Atmospheric Admin. |
2 |
2 |
2 |
3% |
|
National Science Foundation |
24 |
24 |
26 |
3% |
|
Tennessee Valley Authority |
19 |
25 |
31 |
27% |
|
Department of Transportation |
9 |
10 |
17 |
40% |
|
Total, Engineering and Related R&D |
1,103 |
1,055 |
1,156 |
2% |
|
Source: Authors' estimates. |
||||
Table I-8. Estimate of Federal Funding for Social Sciences R&D Related to the Environment (budget authority in millions of dollars, by fiscal year)
|
|
FY 1990 |
FY 1991 |
FY 1992 |
Avg. Annual % Change FY 1990–92 |
|
Agency for International Development |
7.0 |
7.1 |
8.7 |
11% |
|
USDA, Cooperative State Research Service |
2.7 |
2.9 |
3.2 |
8% |
|
USDA, Economic Research Service |
5.7 |
6.1 |
7.4 |
14% |
|
USDA, Forest Service |
1.9 |
2.0 |
5.1 |
62% |
|
Corps of Engineers |
0.0 |
0.0 |
1.4 |
-- |
|
Department of Energy |
2.0 |
0.0 |
0.9 |
-33% |
|
Environmental Protection Agency |
0.0 |
0.5 |
0.5 |
-- |
|
DOI, Other Agencies |
0.0 |
0.1 |
0.2 |
-- |
|
National Oceanic and Atmospheric Admin. |
0.9 |
0.9 |
1.5 |
26% |
|
National Science Foundation |
4.8 |
8.0 |
12.2 |
60% |
|
Smithsonian Institution |
0.0 |
0.1 |
0.3 |
-- |
|
Total, Social Sciences R&D |
25.1 |
27.8 |
41.4 |
28% |
|
Source: Authors' estimates. |
||||
Table I-9. Estimate of Federal Funding for Information and Data R&D Related to the Environment (budget authority in millions of dollars, by fiscal year)
|
|
FY 1990 |
FY 1991 |
FY 1992 |
Avg. Annual % Change FY 1990–92 |
|
USDA, Agricultural Research Service |
1 |
1 |
2 |
46% |
|
USDA, Forest Service |
0 |
1 |
1 |
-- |
|
Corps of Engineers |
1 |
2 |
2 |
22% |
|
Department of Energy |
2 |
2 |
2 |
0% |
|
Environmental Protection Agency |
0 |
4 |
8 |
-- |
|
DOI, Geological Survey |
71 |
86 |
86 |
11% |
|
National Aeronautics and Space Admin. |
8 |
44 |
108 |
267% |
|
National Oceanic and Atmospheric Admin. |
10 |
11 |
11 |
5% |
|
Total, Information and Data R&D |
92 |
150 |
219 |
54% |
|
Source: Authors' estimates. |
||||
Table I-10. Estimate of Environmental R&D by Agency and Character of Work, FY 19921 (budget authority in millions of dollars)
|
|
Basic |
Applied |
Development |
Facilities |
Total |
|
AID |
1 |
39 |
4 |
0 |
45 |
|
USDA, ARS |
82 |
60 |
10 |
10 |
162 |
|
USDA, CSRS |
55 |
64 |
0 |
0 |
119 |
|
USDA, ERS |
1 |
6 |
0 |
0 |
7 |
|
USDA, FS |
44 |
68 |
3 |
0 |
115 |
|
Corps |
3 |
10 |
14 |
0 |
27 |
|
DOD (military) |
167 |
171 |
240 |
0 |
577 |
|
DOE |
133 |
118 |
513 |
34 |
799 |
|
EPA |
73 |
196 |
79 |
0 |
347 |
|
DOI, FWS |
6 |
66 |
13 |
0 |
85 |
|
DOI, USGS |
180 |
165 |
18 |
4 |
367 |
|
DOI, Other |
7 |
58 |
5 |
1 |
72 |
|
NASA |
224 |
244 |
309 |
49 |
826 |
|
NOAA |
0 |
286 |
33 |
0 |
319 |
|
NSF |
516 |
18 |
0 |
8 |
541 |
|
Smithsonian |
33 |
0 |
0 |
0 |
33 |
|
TVA |
3 |
5 |
23 |
0 |
31 |
|
DOT |
0 |
6 |
11 |
0 |
17 |
|
Total, Environmental R&D |
1,528 |
1,580 |
1,275 |
106 |
4,489 |
|
Defense2 |
167 |
256 |
344 |
34 |
801 |
|
Nondefense |
1,360 |
1,324 |
931 |
72 |
72 |
|
Source: Authors' estimates. 1 Excludes administrative overhead and R&D related to environmental health. 2 Defense includes Department of Defense and the Department of Energy's Atomic Energy Defense Programs. |
|||||
Table I-11. Estimate of Environmental R&D by Agency and Performer, FY 19921 (budget authority in millions of dollars)
|
|
Federal Agencies |
Colleges & Universities |
Other Extramural |
Total |
|
Agency for International Development |
2 |
12 |
30 |
45 |
|
USDA, Agricultural Research Service |
160 |
0 |
2 |
162 |
|
USDA, Cooperative State Research Service |
0 |
115 |
4 |
119 |
|
USDA, Economic Research Service |
7 |
0 |
7 |
|
|
USDA, Forest Service |
104 |
9 |
2 |
115 |
|
Corps of Engineers |
13 |
2 |
11 |
27 |
|
Department of Defense (military) |
173 |
130 |
275 |
577 |
|
Department of Energy |
26 |
60 |
713 |
799 |
|
Environmental Protection Agency |
84 |
53 |
211 |
347 |
|
DOI, Fish and Wildlife Service |
77 |
8 |
0 |
85 |
|
DOI, Geological Survey |
325 |
26 |
16 |
367 |
|
DOI, Other Agencies |
50 |
12 |
10 |
72 |
|
National Aeronautics and Space Admin. |
150 |
81 |
595 |
826 |
|
National Oceanic and Atmospheric Admin. |
250 |
55 |
15 |
319 |
|
National Science Foundation |
4 |
405 |
132 |
541 |
|
Smithsonian Institution |
33 |
0 |
0 |
33 |
|
Tennessee Valley Authority |
17 |
14 |
31 |
|
|
Department of Transportation |
7 |
2 |
8 |
17 |
|
Total, Environmental R&D |
1,481 |
971 |
2,037 |
4,489 |
|
Defense2 |
189 |
130 |
482 |
801 |
|
Nondefense |
1,292 |
841 |
1,554 |
3,687 |
|
Source: Author's estimates derived by applying agency trends to environmental programs. These figures represent general trends, and should not be viewed as exact amounts. * Less than $500,000. 1 Excludes administrative overhead and R&D related to environmental health. 2 Defense includes Department of Defense and the Department of Energy's Atomic Energy Defense Programs. |
||||
Table I-12. Estimate of Federal Grant Funding for Environmental R&D, FY 19921 (budget authority in millions of dollars)
Agency Tables
Table II-1 Estimate of Environmental R&D at the National Aeronautics and Space Administration1 (budget authority in millions of dollars, by fiscal year)
|
|
FY 1990 |
FY 1991 |
FY 1992 |
Avg. Annual % Change FY 1990–92 |
|
ENVIRONMENTAL SCIENCES |
||||
|
Earth Observing System (EOS) |
74 |
151 |
184 |
58% |
|
Earth Probes |
14 |
52 |
93 |
162% |
|
Topex |
85 |
80 |
60 |
-16% |
|
Upper Atmosphere Research Satellite |
55 |
62 |
0 |
-100% |
|
Payload Instrument Development |
76 |
49 |
40 |
-28% |
|
Mission Operations & Data Analysis |
24 |
31 |
59 |
57% |
|
Airborne Research |
19 |
20 |
20 |
2% |
|
Process Studies |
114 |
116 |
124 |
4% |
|
Modeling & Data Analysis |
39 |
44 |
49 |
13% |
|
Interdisciplinary Analysis |
9 |
12 |
3 |
-46% |
|
Construction of Facilities, Global Change |
0 |
9 |
17 |
-- |
|
Life Sciences, Research & Analysis |
3 |
4 |
5 |
23% |
|
Estimated Intramural Research |
56 |
60 |
65 |
8% |
|
Subtotal |
567 |
691 |
718 |
13% |
|
INFORMATION AND DATA R&D |
||||
|
EOS Data and Information Systems |
0 |
36 |
83 |
-- |
|
CIESIN2 |
8 |
8 |
25 |
77% |
|
Subtotal |
8 |
44 |
108 |
267% |
|
Total, NASA Environmental R&D |
575 |
735 |
826 |
20% |
|
Source: Authors' estimates based on agency budget justification and cross-cut by field of science. 1 These estimates exclude funding for environmental sciences in NASA's planetary and commercial applications programs, which are estimated to total $305 million in FY 1990, $328 million in FY 1991, and $322 million in FY 1992. 2 Consortium for International Earth Science Information Networks. |
||||
Table II-2. Estimate of Environmental R&D at the Department of Energy (budget authority in millions of dollars, by fiscal year)
|
|
FY 1990 |
FY 1991 |
FY 1992 |
Avg. Annual % Change FY 1990–1992 |
|
ENVIRONMENTAL SCIENCES |
||||
|
CO2, Core Program |
15 |
18 |
17 |
5% |
|
CO2, Quantitative Links (ARM) |
16 |
22 |
26 |
28% |
|
CO2, CHAMMP1 |
6 |
7 |
10 |
33% |
|
CO2, Nat'l Inst. for Global Env. Change |
6 |
9 |
11 |
37% |
|
CO2, Oceans Research |
2 |
4 |
5 |
47% |
|
CO2, Education |
0 |
2 |
2 |
-- |
|
Terrestrial Transport |
14 |
15 |
14 |
1% |
|
Atmospheric Science |
12 |
10 |
10 |
-7% |
|
Ecosystem Functioning and Response |
8 |
7 |
7 |
-10% |
|
Coastal, Marine Transport |
6 |
5 |
6 |
-3% |
|
Basic Energy Sciences, Geosciences |
18 |
17 |
19 |
5% |
|
Fish and Wildlife, Bonneville Power2 |
1 |
1 |
1 |
0% |
|
Subtotal |
104 |
118 |
129 |
11% |
|
SOCIAL SCIENCES |
||||
|
CO2, Human Interactions |
2 |
0 |
1 |
-33% |
|
ENGINEERING AND RELATED R&D |
||||
|
Atomic Defense Env. Waste and Restor |
187 |
169 |
224 |
9% |
|
Clean Coal Technologies |
525 |
361 |
390 |
-14% |
|
Coal Flue Gas Cleanup |
17 |
17 |
18 |
2% |
|
Coal Gas Stream Cleanup |
17 |
17 |
17 |
1% |
|
Coal Preparation Control Technologies |
20 |
16 |
12 |
-22% |
|
Coal Advanced R&D Control Technologies |
2 |
3 |
2 |
3% |
|
Coal Waste Management |
2 |
2 |
2 |
-4% |
|
Oil & Gas Environmental Research |
2 |
1 |
2 |
-3% |
|
Oil Shale Environmental Mitigation |
2 |
2 |
0 |
-100% |
|
Subtotal |
774 |
590 |
667 |
-7% |
|
INFORMATION AND DATA R&D |
||||
|
CO2, Information |
2 |
2 |
2 |
0% |
|
Total, DOE Environmental R&D |
882 |
709 |
799 |
-5% |
|
Source: Authors' estimates based on agency budget justification. 1 Computer Hardware, Advanced Math and Model Physics program. 2 Represents obligational authority financed by Bonneville Power Administration ratepayers. |
||||
Table II-3. Estimate of Environmental R&D at the Department of Defense (budget authority in millions of dollars, by fiscal year)1
Table II-4. Estimate of Environmental R&D at the National Science Foundation1 (budget authority in millions of dollars, by fiscal year)
Table II-5. Estimate of Environmental R&D at the Department of Interior, U.S. Geological Survey (budget authority in millions of dollars, by fiscal year)
Table II-6. Estimate of Environmental R&D at the Department of Interior, Fish and Wildlife Service (budget authority in millions of dollars, by fiscal year)
|
|
FY 1990 |
FY 1991 |
FY 1992 |
Avg. Annual % Change FY 1990-92 |
|
ENVIRONMENTAL SCIENCES |
||||
|
Contaminants Research |
13 |
14 |
14 |
1% |
|
Wildlife Research |
18 |
19 |
18 |
1% |
|
Fishery Research |
16 |
19 |
19 |
9% |
|
Endangered Species Research |
6 |
8 |
8 |
13% |
|
Technical Development |
7 |
11 |
14 |
44% |
|
Cooperative Units |
7 |
8 |
8 |
8% |
|
Research Center Maintenance |
4 |
4 |
5 |
3% |
|
Total, FWS Environmental R&D |
71 |
82 |
85 |
9% |
|
Source: Authors' estimates based on agency budget justification. |
||||
Table II-7. Estimate of Environmental R&D at the Department of Interior, Other Agencies (budget authority in millions of dollars, by fiscal year)
|
|
FY 1990 |
FY 1991 |
FY 1992 |
Avg. Annual % Change FY 1990-92 |
|
ENVIRONMENTAL SCIENCES |
||||
|
National Park Service |
18 |
23 |
27 |
22% |
|
Bureau of Land Management |
3 |
5 |
11 |
89% |
|
Bureau of Reclamation, Global Change |
0 |
2 |
3 |
-- |
|
Subtotal |
21 |
31 |
40 |
39% |
|
SOCIAL SCIENCES1 |
||||
|
Office of the Secretary |
-- |
|||
|
National Park Service |
NA |
NA |
NA |
-- |
|
Subtotal |
-- |
|||
|
ENGINEERING AND RELATED R&D |
||||
|
Bureau of Mines |
15 |
19 |
18 |
10% |
|
Minerals Management Service |
2 |
3 |
6 |
73% |
|
Bureau of Reclamation |
3 |
4 |
5 |
32% |
|
Surface Mining Reclamation & Enforcement |
1 |
1 |
1 |
18% |
|
Office of the Secretary |
1 |
1 |
1 |
13% |
|
Subtotal |
22 |
28 |
31 |
20% |
|
Total, DOI, Other Agencies' Env. R&D |
42 |
59 |
72 |
30% |
|
Source: Authors' estimates based on agency budget justifications and R&D cross-cuts. * Less than $500,000. 1 The National Park Service conducts social sciences R&D related to environmental management, but data were not available on the amounts involved. |
||||
Table II-8. Estimate of Environmental R&D at the Department of Agriculture, Agricultural Research Service (budget authority in millions of dollars, by fiscal year)1
|
|
FY 1990 |
FY 1991 |
FY 1992 |
Avg. Annual % Change FY 1990–92 |
|
ENVIRONMENTAL SCIENCES |
||||
|
Soil, Plant, Water, Nutrient Relation |
24 |
26 |
30 |
11% |
|
Improvement of Range Resources |
6 |
6 |
6 |
5% |
|
Wildlife & Fish Ecology |
4 |
6 |
6 |
20% |
|
Saline and Sodic Soils and Salinity Mgt. |
2 |
2 |
3 |
9% |
|
Appraisal of Soil Resources |
1 |
1 |
1 |
5% |
|
Alternative Uses of Land |
3% |
|||
|
Env. Biology supporting other goals |
49 |
54 |
57 |
8% |
|
Physical Env. Sciences for other goals |
13 |
15 |
17 |
16% |
|
Subtotal |
100 |
110 |
121 |
10% |
|
ENGINEERING AND RELATED R&D |
||||
|
Alleviation of Pollution |
9 |
12 |
13 |
19% |
|
Watershed Protection and Management |
8 |
8 |
9 |
9% |
|
Conservation & Efficient Use of Water |
7 |
8 |
9 |
16% |
|
Efficient Drainage & Irrigation Systems |
3 |
4 |
4 |
21% |
|
Protection from Pollution |
2 |
2 |
2 |
14% |
|
Subtotal |
29 |
33 |
38 |
15% |
|
INFORMATION AND DATA R&D |
||||
|
Remote Sensing |
1 |
1 |
1 |
10% |
|
CIESIN/Global Change2 |
0 |
0 |
1 |
-- |
|
Subtotal |
1 |
1 |
2 |
46% |
|
Total, ARS Environmental R&D |
129 |
144 |
162 |
12% |
|
Source: Authors' estimates. * Less than $500,000. 1 ARS budget authority has been projected based on 1990 data in the Current Research Information System for goals pertaining to the environment and for environmental sciences research supporting other goals. 2 Consortium for International Earth Science Information Networks. |
||||
Table II-9. Estimate of Environmental R&D at the Department of Agriculture, Cooperative State Research Service (budget authority in millions of dollars, by fiscal year)1
Table II-10. Estimate of Environmental R&D at the Department of Agriculture, Economic Research Service (budget authority in millions of dollars, by fiscal year)1
Table II-11. Estimate of Environmental R&D at the Department of Agriculture, Forest Service (budget authority in millions of dollars, by fiscal year)1
Table II-12. Estimate of Environmental R&D at the Environmental Protection Agency (budget authority in millions of dollars, by fiscal year)
|
|
FY 1990 |
FY 1991 |
FY 1992 |
Avg. Annual % Change FY 1990-92 |
|
ENVIRONMENTAL SCIENCES |
||||
|
Environmental Processes & Effects |
52 |
53 |
65 |
12% |
|
Env. Sciences w/in Monitoring Systems |
25 |
28 |
49 |
40% |
|
Env. Monitoring & Assessment Pgm. (EMAP) |
17 |
16 |
21 |
11% |
|
Stratospheric Modification Program |
15 |
22 |
23 |
25% |
|
Exploratory Research |
13 |
17 |
18 |
17% |
|
Acid Deposition |
23 |
8 |
8 |
-40% |
|
Ecological Risk Uncertainty |
3 |
3 |
3 |
-1% |
|
Env. Sciences in Technical Liaison |
2 |
3 |
3 |
4% |
|
Subtotal |
150 |
149 |
190 |
12% |
|
SOCIAL SCIENCES |
||||
|
Socio-Economic Research |
0 |
1 |
1 |
-- |
|
ENGINEERING AND RELATED R&D |
||||
|
Environmental Engineering & Technology |
97 |
96 |
94 |
-1% |
|
Monitoring Systems |
32 |
31 |
29 |
-5% |
|
Exploratory Research |
13 |
16 |
14 |
7% |
|
Acid Deposition |
7 |
2 |
3 |
-40% |
|
Technical Liaison |
8 |
9 |
9 |
4% |
|
Subtotal |
157 |
154 |
149 |
-2% |
|
INFORMATION AND DATA R&D |
||||
|
High Performance Computing |
0 |
4 |
-- |
|
|
EMAP/Computer Sciences |
0 |
4 |
5 |
-- |
|
Subtotal |
0 |
4 |
8 |
-- |
|
Total, EPA Environmental R&D1 |
307 |
307 |
347 |
6% |
|
Source: Authors' estimates based on agency budget justification and cross-cut by field of science. * Less than $500,000. 1 Including administrative overhead and R&D related to environmental health, EPA's R&D funding totaled $424 million in FY 1990, $440 million in FY 1991, and $502 million in FY 1992. |
||||
Table II-13. Estimate of Environmental R&D at the National Oceanic and Atmospheric Administration1 (budget authority in millions of dollars, by fiscal year)
Table II-14. Estimate of Environmental R&D at the Agency for International Development (budget authority in millions of dollars, by fiscal year)
|
|
FY 1990 |
FY 1991 |
FY 1992 |
Aug. Annual % Change FY 1990–92 |
|
Environmental Sciences |
||||
|
Env. Science in Support of Agriculture |
15 |
15 |
16 |
3% |
|
Natural Resource Conservation/Management |
11 |
7 |
7 |
-18% |
|
Innovative Science |
4 |
3 |
3 |
-11% |
|
Marine/Coastal Resource Management |
3 |
2 |
4 |
20% |
|
Watershed Management |
1 |
1 |
1 |
4% |
|
Subtotal |
34 |
29 |
31 |
-4% |
|
SOCIAL SCIENCES |
||||
|
Economics |
3 |
3 |
4 |
29% |
|
Social Sciences |
4 |
4 |
4 |
0% |
|
Subtotal |
7 |
7 |
9 |
11% |
|
ENGINEERING AND RELATED R&D |
||||
|
Pollution Prevention |
0 |
0 |
3 |
-- |
|
Other |
2 |
2 |
2 |
5% |
|
Subtotal |
2 |
2 |
5 |
56% |
|
Total, AID Environmental R&D |
43 |
38 |
45 |
2% |
|
Source: Author's estimates based on agency budget justification and R&D cross-cut. |
||||
Table II-15. Estimate of Environmental R&D at the Smithsonian Institution (budget authority in millions of dollars, by fiscal year)
Table II-16. Estimate of Environmental R&D at the Tennessee Valley Authority (budget authority in millions of dollars, by fiscal year)
|
|
FY 1990 |
FY 1991 |
FY 1992 |
Avg. Annual % Change FY 1990–92 |
|
ENGINEERING AND RELATED R&D |
||||
|
Nutrients and Water Quality |
9 |
13 |
13 |
23% |
|
Agricultural, Municipal & Indust. Wastes |
7 |
9 |
9 |
15% |
|
Electric Power Program1 |
3 |
3 |
8 |
57% |
|
Total, TVA Environmental R&D |
19 |
25 |
31 |
27% |
|
Source: Authors' estimates based on agency budget materials and communications. 1 Represents obligational authority financed by TVA ratepayers. |
||||
Table II-17. Estimate of Environmental R&D at the Corps of Engineers (budget authority in millions of dollars, by fiscal year)
Table II-18. Estimate of Federal Environmental R&D at the Department of Transportation (budget authority in millions of dollars, by fiscal year)
|
|
FY 1990 |
FY 1991 |
FY 1992 |
Avg. Annual % Change FY 1990–1992 |
|
ENGINEERING AND RELATED R&D |
||||
|
Coast Guard |
4 |
4 |
6 |
23% |
|
Federal Highway Administration |
2 |
3 |
6 |
64% |
|
Federal Aviation Administration |
2 |
2 |
4 |
42% |
|
Total, DOT Environmental R&D |
9 |
10 |
17 |
40% |
|
Source: Authors' estimates based on agency budget justifications and R&D cross-cuts. |
||||
APPENDIX B
From: Intersociety Working Group, AAAS Report XX: Research and Development, FY 1996 (Washington, D.C.: American Association for the Advancement of Science, 1995), pp. 123–126.
ENVIRONMENTAL PROTECTION AGENCY
Over the last five years, EPA has made a concerted effort to steer its R&D resources toward integrated, multimedia studies. Prior to this shift, the agency's science agenda was largely reactive, focusing on particular contaminants or remedial technologies dictated by statutes. EPA has advocated, with considerable success, that its research program support both the near-term studies needed by regulatory offices and the longer-term research needed to resolve scientific uncertainties about the interrelationships among environmental problems and their effects on ecological and human communities. Striking a balance between the two is expected to strengthen the scientific rationale for assessing and managing environmental risks.
EPA is also taking steps to improve the quality of the research it funds. Acting on the recommendations of a 1994 study of its operations, the agency is consolidating and restructuring its research labs and offices to eliminate overhead and focus on risk-based management. The agency also is in the process of expanding the use of competitive, peer-review grants for its research and is working with NSF to develop award protocols and project reviews. The move toward competitive awards is expected to shift some activity from contract to academic researchers. Following another study recommendation, EPA is initiating a fellowship program for doctoral and masters students, beginning with 100 fellowships in FY 1995. Agency plans also call for a mentorship program, in which top scientists from industry and academia would take temporary assignments to work with EPA researchers.
The net result of these changes is that over half of the agency's $619.2 million budget for R&D in FY 1995 supports multimedia research, more than double its 20 percent share in FY 1990. Much of this growth was achieved by shifting resources from media-specific studies over this period. For example, funding for R&D related exclusively to water quality problems and Superfund sites are each about 25 percent lower than they were five years ago in constant dollar terms. The level of support for hazardous waste and toxic substances have each declined by over 40 percent in the same period.
For the coming year, EPA has requested an additional $62.4 million for R&D, which would bring the total to $681.6 million for FY 1996 (up 10.1 percent over current levels). As shown in Table II-17, funding would continue to flow to the more long-term, multimedia research. The Administration would devote the lion's share of the new money to an expansion of the Environmental Technology Initiative (ETI) under the Multimedia program, proposing $119.8 million for the
coming year, $51.8 million (or 76.2 percent) more than FY 1995. Under the ETI program, EPA supports collaborative research to advance the efficiency and cost-effectiveness of technologies related to the climate action plan (e.g., alternatives to greenhouse gases and ozone-depleting substances), advanced manufacturing, and pollution prevention. About two-thirds of the ETI R&D is administered by the Office of Research and Development (ORD).
At $76 million, ecosystems protection research would remain the second largest issue area despite relatively flat funding in FY 1996.2 These funds are used to develop scientific profiles, indicators, assessments, and strategies for ecosystems at three levels—national (e.g., characterizing esturine, forestry, range-land, and other ecosystems under the Environmental Monitoring and Assessment Program), regional (e.g., developing a scientific understanding of regional ecological problems and solutions), and watershed (e.g., predicting and understanding processes affecting watershed resources). Apart from watershed research, which accounts for most of the funding for Water Quality R&D, these projects are funded under the Multimedia budget.
The agency wants to boost funding for another priority issue area, criteria air pollutants R&D (up 10.5 percent to $46 million). This program, which is aimed at developing and improving the scientific basis of air quality standards for particular pollutants, has requested an additional $4.4 million for the criteria air pollutants program to address shortcomings identified by the National Academy of Sciences in the current strategies for tropospheric ozone. Following a series of meetings convened by EPA, various public and private organizations have formed a research consortium to fund and conduct research on this issue at a ratio of 2:1 of non-EPA to EPA money. In a related area, EPA is also seeking more money for R&D on air toxics (up $4.4 million to $14.4 million) to carry out congressionally mandated studies on urban toxics and the deposition of toxics in the Great Waters region.
Though much smaller in scale, the Administration has targeted selected health issues for significant increases in FY 1996. The $13 million requested for health effects research in FY 1996 (up 72 percent) assumes an infusion of $5.5 million primarily for studies on the effects of environmental exposure to chemicals that interact with the endocrine system. Funding for health risk assessments would rise to $19 million (up 42 percent) if Congress approves the $6 million increase requested to improve the methods and data upon which risk assessments are made, as recommended by the National Academy of Sciences. Agency-wide support for research on human exposure would fall to $15.6 million in FY 1996 (down $1.9 million or 10.9 percent), because EPA does not envision any follow-on activities
to the completed national human exposure assessment survey (saving $4.5 million). However, the agency has requested an additional $2 million under the Pesticides program to study special issues associated with the exposure of infants and children.
EPA's effort to enhance its scientific capabilities is apparent in the increases proposed for environmental education and its ''Cross Program" (components that cut across issues and programs, such as quality assurance). The environmental education budget would gain $3.2 million (for a total of $11.8 million) to double the number of fellowships from the 100 proposed for this year to 200 in FY 1996. Similarly, about half of the $4 million increase proposed for cross programs would be devoted to expand the number of grants, support the appointment of post-doctoral scientists, and fund the mentorship exchange.
As suggested by the reductions apparent in Table II-17, EPA is proposing to reduce funding for these projects to offset the cost of some of these initiatives. Perhaps the largest single source of savings is the agency's policy of halting funding on most of the "congressionally-directed" projects, which totaled $27.4 million in FY 1995. The effect of this policy is particularly pronounced on funding for exploratory grants and centers, which would drop 21 percent agency wide to $35 million because of earmarks totaling $3.6 million under Multimedia grants (e.g., EPSCoR, oil spill remediation) and $5.8 million under Superfund for the Gulf Coast and Clark Atlanta centers.
Finally, it should be noted that EPA is changing its accounting of certain working capital costs attributable to research beginning in FY 1996. Data processing, mail postage, supercomputers, and other support costs that previously were funded under the Office of Administration and Research Management will now be funded directly by ORD. Although this $35 million intra-agency adjustment does not affect the agency's overall budget or level of support for R&D, it could create the appearance of a surge in R&D funding unless prior-year budgets are presented on a comparable basis. AAAS has therefore revised the estimates of EPA's R&D for FY 1994 and 1995 upward by about $30 million each year so that the year-to-year trends shown in Table II-17 are not distorted by account changes.
APPENDIX C
From: Intersociety Working Group, AAAS Report XX: Research and Development, FY 1996 (Washington, DC: American Association for the Advancement of Science, 1995), pp. 129.
Table II-1. R&D in the FY 1996 Budget by Agency (budget authority in millions of dollars)
|
|
FY 1994 Actual |
FY 1995 Estimate |
FY 1996 Budget |
% Change FY 95–96 Current $ Constant $ |
|
|
Total R&D (Conduct and Facilities) |
|||||
|
Defense (military) |
35,509.6 |
36,272.2 |
35,161.2 |
-3.1% |
-5.9% |
|
NASA |
9,405.5 |
9,874.2 |
9,517.1 |
-3.6% |
-6.4% |
|
Energy |
6,771.2 |
6,534.4 |
7,012.9 |
7.3% |
4.2% |
|
HHS |
11,323.5 |
11,726.9] |
12,157.1 |
3.7% |
0.6% |
|
NIH |
[10,473.5] |
[10,840.2] |
[11,293.3] |
4.2% |
1.1% |
|
NSF |
2,242.7 |
2,543.6 |
2,540.0 |
-0.1% |
-3.1% |
|
Agriculture |
1,528.3 |
1,539.8 |
1,483.4 |
-3.7% |
-6.5% |
|
Interior |
707.6 |
686.1 |
679.3 |
-1.0% |
-3.9% |
|
Transportation |
640.8 |
687.0 |
619.5 |
-9.8% |
-12.5% |
|
EPA |
588.1 |
619.2 |
681.6 |
10.1% |
6.9% |
|
Commerce |
1,021.9 |
1,284.1 |
1,403.7 |
9.3% |
6.1% |
|
Education |
175.3 |
174.8 |
181.8 |
4.0% |
1.0% |
|
AID |
315.6 |
314.0 |
255.0 |
-18.8% |
-21.2% |
|
Veterans Affairs |
276.5 |
296.9 |
272.8 |
-8.1% |
-10.8% |
|
Nuclear Reg. Comm. |
90.7 |
82.0 |
81.8 |
-0.3% |
-3.2% |
|
Smithsonian |
133.9 |
134.9 |
138.9 |
3.0% |
-0.0% |
|
Tennessee Valley Auth. |
96.0 |
88.6 |
98.8 |
11.5% |
8.2% |
|
Corps of Engineers |
51.6 |
54.6 |
55.4 |
1.5% |
-1.4% |
|
Labor |
62.6 |
61.8 |
94.0 |
52.1% |
47.7% |
|
HUD |
35.6 |
40.5 |
40.8 |
0.7% |
-2.2% |
|
Justice |
45.8 |
53.7 |
55.1 |
2.7% |
-0.3% |
|
Postal Service |
51.0 |
70.0 |
72.0 |
2.9% |
-0.1% |
|
TOTAL R&D |
71,073.9 |
73,139.6 |
72,602.0 |
-0.7% |
-3.6% |
|
Defense |
38,299.1 |
38,837.5 |
37,929.9 |
-2.3% |
-5.2% |
|
Nondefense |
32,774.8 |
34,302.2 |
34,672.1 |
1.1% |
-1.9% |


