
12
Nutritional Risk Factors in the Former Soviet Union
Barry Popkin, Namvar Zohoori, Lenore Kohlmeier, Alexander Baturin, Arseni Martinchik, and Alexander Deev
Introduction
One of the legacies of the New Independent States (NIS) has been a diet, developed through decades of food and nutrition policies, that is very high in fat and particularly rich in animal food products. As discussed by Pearson and Patel in this volume, there are consistent correlations between this kind of diet and a number of chronic diseases. This chapter explores that legacy by examining current nutritional status and dietary patterns in Russia and Kyrgyz, and using historical data and related analyses to understand some of the underlying historical trends.
Changes in diet in the Soviet Union began in the mid- to late 1960s and were spurred by a number of factors. Over the following decade, there were significant increases in the production, processing, and marketing of food products, in particular meat and dairy products. Consumption was enhanced by the increased supply, combined with large subsidies for the latter products. Moreover, the gross national product of the Soviet Union increased considerably following the OPEC agreement and the increase in the world price of oil, and household income rose accordingly. There were also official guidelines promoting changes in the supply of meat and dairy products, as evidenced by the following statement by Khrushchev: "We plan the following increases in the consumption per capita: meat and meat products—2.5 times, milk and milk products—2 times . . . and some reduction in potato and bread consumption" (Khrushchev, 1961). While all of these factors appear to have been important underlying causes of the dietary changes that occurred, there is no information available that would allow us to
separate the effects of supply factors from those related to increased household income.
This chapter uses existing post-World War II data in combination with current survey information to explore both the shift in diet over the post-World War II period and more recent patterns of body composition in Russia and Kyrgyz. In particular, we focus on the use of body composition data to examine the prevalence of chronic energy deficiency and obesity. Dietary data are used to examine the macronutrient intake of energy, protein, and fat, in particular the proportion of energy derived from fat and protein. Data from Kyrgyz are used to supplement detailed information from Russia. Data on current dietary and body composition patterns are based on results from two nationally representative sample surveys-the Russian Longitudinal Monitoring Survey and the Kyrgyz Multipurpose Poverty Survey. As is shown, problems of dietary excess and obesity are common among adults even in Kyrgyz, which is one of the poorest of the NIS countries. The next section reviews the data and methods used for the analysis; this is followed by sections presenting the analysis results and discussion of their implications.
Data and Methods
Historical Data
Before the 1990s, there were no nationally representative surveys of food consumption in Russia. There were, however, surveys of food expenditures that included detailed measures of quantities of food purchased, and these data are discussed below. To understand dietary patterns for Russia during the post-World War II period, we rely primarily on food balance sheets and food expenditure survey data.
Food Balance
Food balance (often termed food disappearance) data are frequently interpreted as food consumption data, but they are not. Rather, they reflect the food supply available for human consumption at the national level during 1 year (the food available per capita at the retail level), based on imports, exports, usage of food for livestock and seed, and extraction or milling rates. These data are not adjusted for loss and waste that occurs during shipment and handling; during storage at the wholesale, retail, and household levels (e.g., due to spillage or damage by insects and pests); during commercial and household processing of the food; or during consumption at the table (plate waste). As a result, estimates of energy intake based on food balance sheets tend to be high.
However, these food balance data, which are collected on an annual basis, are useful for examining food trends when there have not been large changes in
loss and waste. There is little reason to expect that such changes occurred during the period of analysis of these historic data for the former Soviet Union and the Russian Federation.1
Consumer Budget Survey
The State Committee on Statistics, Goskomstat, collected its own series of consumption data on an annual basis. The sample was based on lists of public enterprises from the 1950s that were updated and was not representative of the enterprises in Russia.2 Within the enterprises, individuals willing to be interviewed provided very detailed income and food expenditure data on a weekly basis throughout the year. The food consumption data were based on weekly purchases. These data were converted into nutrients using complex conversion ratios, which were never carefully checked. The results are useful for understanding broad patterns of consumption. and they provide a better picture of the food available for household processing and consumption than do the food balance data, but they are from a clearly unrepresentative sample. Many Russian scholars believe that there were no major shifts in the participation rates in the Family Budget Surveys; however, there is no systematic research that can be cited to this effect.
Current Survey Information
The Russian Longitudinal Monitoring Survey and the Kyrgyz Multipurpose Poverty Survey are household-based surveys designed to understand systematically the effects of policy reforms on the economic well-being of households and individuals. This chapter presents results from rounds 1 and 3 of the Russian Longitudinal Monitoring Survey, conducted mainly in August-September 1992 and 1993, respectively, and round 1 of the Kyrgyz Multipurpose Poverty Survey, from October and November 1993. (Round 2 of the Russian Longitudinal Monitoring Survey was conducted during the winter of 1993 and is excluded here so as not to confuse the results presented with variations due to seasonal factors.)
Sampling Design
These two surveys employed the first nationally representative household-based sample frames for both countries. Both used a probability sample collected through a multistage sampling procedure designed by leading U.S. statisticians working with the authors. Both countries were stratified to accommodate large variations in geography, economic development, public resources, and health indicators. Ultimately, for the smallest area sample, random sampling of households was used. Overall, 7,200 households were targeted for interview in the first round of the Russian Longitudinal Monitoring Survey. The final sample provid-
ing round 1 data was 6,485 households and 16,845 individuals, representing a response rate of 90.1 percent. For the Kyrgyz Multipurpose Poverty Survey, the final sample consisted of 1,923 households and 9,066 individuals. The sample selected for this chapter is adults in the age group 18-59 (the elderly sample is the subject of another study already published; see Popkin et al., 1996). Details on the sampling can be obtained from the authors (see also Mroz and Popkin, 1995; Popkin et al., 1996).
Survey Instruments
Both surveys collected detailed socioeconomic and demographic data, as well as data on individual dietary intake for all family members. Trained interviewers conducted a standard 24-hour dietary recall in the household for each member, including each food item consumed, place of preparation, meal, and day of week, using color photos of foods to assist in assessing portion sizes. Another component of the individual interview was a health examination. Interviewers were trained to measure height and weight and to ask a series of questions about health behaviors (including smoking and alcohol consumption). The 1992 Russian Longitudinal Monitoring Survey data were reviewed in the field, but entered directly into an automated coding program developed by the Russian Research Center for Preventive Medicine. For the 1993 Russian Longitudinal Monitoring Survey and the Kyrgyz Multipurpose Poverty Survey, the dietary data were coded and processed by the Russian Institute of Nutrition, Academy for Medical Sciences, and included adequate documentation of foods not previously identified. By the end of 1992, over 1,000 foods and recipes had been entered, comprising what would subsequently become a revised and expanded food list for Russia.
For the calculation of macronutrients for the present study, we used a revised nutrient data bank, which includes results of the work of the Russian Research Center for Preventive Medicine on the Russian Longitudinal Monitoring Survey and earlier efforts; the Food Composition Table for Russia developed by the Russian Institute of Nutrition; and the European databases.3 Recipe data collected by this project are being used to develop a computerized recipe system that will ultimately allow complete disaggregation of composite foods into basic foods and food groups.
Data on alcohol intake reported here come from a detailed set of questions in the surveys on intake of coffee, tea, and alcohol. Data on both usual intake and intake of each alcoholic beverage during the week prior to the survey were obtained through these questions.
Nutritional Outcome Measures
Body Composition
For this study, we use the Body Mass Index (BMI), calculated as BMI = weight(kg)/height 2(m2).
BMI categories follow World Health Organization (WHO) recommendations: < 18.6 (chronic energy deficiency), 18.6 to 25 (normal), 25.1 to 30 (overweight), and > 30 (obesity) (James et al., 1988).
Dietary Measures
In analyzing the survey results, we use energy and protein as a proportion of the internationally accepted recommended daily allowances (RDA) and the proportions of energy from fat and protein as our outcome measures (Food and Agriculture Organization/World Health Organization/United Nations University, 1985).
Results
This section presents the results of our analysis with regard to current patterns of diet and body composition in Russia and Kyrgyz; it also examines the patterns of consumption following World War II.
Current Dietary Patterns
Russia
Table 12-1 shows the structure of adult dietary intake for the Russian Federation, categorized by age, for rounds 1 and 3 of the Russian Longitudinal Monitoring Survey, conducted in August-September 1992 and 1993, respectively. In both time periods, total energy intake (which also includes energy from reported consumption of alcoholic drinks) was clearly lower than the RDA, ranging from 74 to 78 percent in 1992 and from 69 to 73 percent in 1993. For all age groups, there was a lowering of total energy intake between the two survey periods, ranging from 5 to 7 percent of the RDA. The RDA are based on actual body weight and follow WHO standards (Food and Agriculture Organization of the United Nations/World Health Organization/United Nations University, 1985).
Conversely, protein intake (in the form of percentage of RDA for protein) is generally higher than the RDA. Although there was a considerable lowering of protein intake among all age groups between 1992 and 1993, in no case does this decline place these adults below the RDA. At the same time, caution is required in interpreting the results on percentage of RDA for protein. The RDA for
TABLE 12-1 Structure of Dietary Intake Categorized by Age, Russia, August-September 1992 and 1993
|
|
% RDA for Energy |
% RDA for Protein |
% Energy from Protein |
% Energy from Fat |
||||
|
Age Group |
Round 1 |
Round 3 |
Round 1 |
Round 3 |
Round 1 |
Round 3 |
Round 1 |
Round 3 |
|
18-29 |
77.4 |
70.3 |
135.2 |
110.7 |
14.1 |
12.7 |
38.1 |
34.1 |
|
30-39 |
78.4 |
73.1 |
132.3 |
111.5 |
14.6 |
13.0 |
38.1 |
34.1 |
|
40-49 |
76.0 |
71.4 |
124.3 |
105.6 |
14.6 |
13.0 |
38.9 |
34.2 |
|
50-59 |
74.2 |
69.2 |
122.0 |
102.2 |
14.5 |
13.0 |
37.6 |
33.8 |
|
Total |
76.8 |
71.2 |
128.8 |
107.7 |
14.5 |
12.9 |
38.2 |
34.0 |
|
SOURCE: Russian Longitudinal Monitoring Survey, July-October 1992 and 1993. |
||||||||
protein adds + 2 standard deviations, whereas this is not the case for energy. The implication is that the RDA for protein is much higher; hence such a high proportion of the protein RDA represents a relatively higher protein intake when protein and energy RDA results are compared. Moreover, the percentage of total energy derived from protein is high for all age groups, although again the 1993 values are lower than the 1992 values.
The proportion of energy derived from fat was quite high in both time periods, as compared with the recommended level of no more than 30 percent. For all age groups, about 38 percent of energy was derived from fat in 1992, with the value dropping to about 34 percent in 1993. This is a significant decline in the desired direction.
The above results indicate a significant change in diet from 1992 to 1993: a decrease in intake on all three measures (total energy, protein, and energy from fat), although consistently high percentages on the latter two measures. Unfortunately, there are no systematic and careful studies of other nutritional outcomes for the period—including anemia and many other deficiencies found among significant populations in earlier periods—that could be compared against these results.
In addition, there is one most important trend in diet that may be evidence of a nutritional problem: the rapid increase in alcohol consumption (see the chapters by Treml and by Shkolnikov and Nemtsov in this volume).
In Russia, a large increase in household food expenditures on alcohol (unreported here) and a concomitant increase in alcohol intake among adult men are under way. Table 12-2 presents data from the Russian Longitudinal Monitoring
TABLE 12-2 Average Consumption of Alcoholic Drinks per Day (in grams)
|
July to October 1992 |
|||||
|
Gender |
Beer |
Dry Wine |
Fortified Wine |
Vodka and Strong Drinks |
|
|
Male |
87.13 |
9.82 |
20.59 |
33.42 |
|
|
Female |
27.40 |
4.53 |
4.23 |
7.31 |
|
|
Full sample |
69.98 |
6.81 |
12.54 |
21.72 |
|
|
July to September 1993 |
|||||
|
Gender |
Beer |
Dry Wine |
Fortified Wine |
Home-Made Samogon |
Vodka and Strong Drinks |
|
Male |
241.57 |
69.50 |
86.07 |
71.91 |
58.82 |
|
Female |
46.71 |
19.16 |
17.24 |
19.82 |
13.69 |
|
Full sample |
176.81 |
40.10 |
55.81 |
59.88 |
41.60 |
|
SOURCE: Russian Longitudinal Monitoring Survey. July-October 1992 and 1993. |
|||||
Survey on intake of alcoholic drinks among men and women in 1992 and 1993. The 1992 survey did not ask for information on samogon, an illegally homebrewed alcoholic beverage almost equivalent to vodka in alcohol content. While some respondents included samogon in the vodka category in 1992, we expect that we have underestimated samogon consumption significantly for that year. Even so, the pattern shown here is evidenced by data from round 2 and other rounds of the survey, with no indication of seasonal or random year-to-year variations. The survey results show a large increase in consumption of all types of alcoholic beverages among both men and women between 1992 and 1993. Although women consume much less alcohol than men, even they more than doubled consumption of all alcoholic beverages during the period. It should be added that consistency studies have been undertaken to compare not only the food expenditure and alcohol consumption data, but also the alcohol data collected from the 24-hour dietary recall. All the data indicate remarkably consistent trends. In other unreported results, we show that the bulk of the change in alcohol consumption was due to increased consumption by drinkers. That is, the proportion who drank did not increase, but the amount consumed by drinkers increased significantly.
These patterns of alcohol consumption are important. To the extent that the dietary intake results include alcoholic drinks, the patterns presented in Table 12-1 represent an increase in low-nutrient-density foods (alcohol) and raise questions about the adequacy of many nutrients in the diet of the Russian population.
Kyrgyz
Energy and nutrient intakes of the adult Kyrgyz population are presented in Table 12-3.4 Among all age groups, fat as a proportion of total energy intake hovered at or just above the 30 percent recommended level, and protein intake
TABLE 12-3 Dietary Intake Categorized by Age, Kyrgyz, October-November 1993
|
Age Group |
Energy (kcal) |
% of Energy RDA |
Protein Grams |
% of Protein RDA |
% Energy From Protein |
% Energy From Fat |
|
18-29 |
2,207 |
90.7 |
70 |
149.5 |
12.7 |
29.5 |
|
30-39 |
2,269 |
91.7 |
74 |
148.1 |
13.0 |
31.3 |
|
40-49 |
2,146 |
85.4 |
72 |
135.7 |
13.3 |
31.5 |
|
50-59 |
2,145 |
81.8 |
71 |
131.8 |
13.3 |
30.1 |
|
Total adults |
2,204 |
88.9 |
72 |
144.4 |
13.0 |
30.4 |
|
SOURCE: Kyrgyz Multipurpose Poverty Survey, October-November 1993. |
||||||
was clearly adequate. Total energy intake was highest for adults aged 30-39, then decreased slowly with age. The protein intake of adults showed the same age-related pattern. Average energy intake was lower than the energy requirement for each age-gender group. Protein intake was considerably higher than the dietary protein RDA. These data vividly display the imbalance that favors protein over energy intake in the Kyrgyz diet. Energy derived from fat was highest among the middle-aged (30-49 years). The range of energy intake from fat was between 29 and 32 percent for all age groups—a level at the upper end of the recommended range of no more than 30 percent.
Body Composition Patterns
Russia
Table 12-4 presents the average weight and BMI measures for the Russian Longitudinal Monitoring Survey sample for both 1992 and 1993. There were increases in both measures during this 1-year period, with larger changes occurring among females than males. Table 12-5 presents the distribution of BMI patterns for different age groups in Russia. Overall, a small proportion had low BMIs indicative of chronic energy deficiency, while close to half were either overweight or obese. Other than young adults, a very small proportion showed evidence of chronic energy deficiency. On the other hand, there was evidence of excessive obesity among all age groups, particularly ages 30 and older. There is a clear, significant difference in the distribution of obesity by gender, as would be expected: females are much more likely to be obese than are males, particularly at ages 30 and older.
There has been a great deal of concern raised about the impact of the economic transformation in Russia and the other NIS countries on the welfare of the population. The specter of famine and extensive hunger has been discussed in the Western press. Examining the distributions of BMI for the 1992 and 1993 Russian Longitudinal Monitoring Survey data can help in addressing this issue.
TABLE 12-4 Descriptive Statistics, Russia, 1992 and 1993
|
|
Weight (kg) |
Body Mass Index |
||||
|
Persons Aged |
||||||
|
18-59 |
1992 |
1993 |
Change |
1992 |
1993 |
Change |
|
Males |
73.4 |
73.7 |
0.32 |
24.8 |
24.9 |
0. 11 |
|
Female |
68.6 |
69.2 |
0.63 |
26.6 |
26.9 |
0.28 |
|
Total |
70.6 |
71.1 |
0.50 |
25.9 |
26.1 |
0.22 |
|
SOURCE: Russian Longitudinal Monitoring Survey, July-October 1992 and 1993. |
||||||
TABLE 12-5 Distribution of Nutrition Status Categorized by Age/Gender (in percent)
TABLE 12-6 Changes in Weight Among Russian Adults Aged 18-59 Between 1992 and 1993 (in percent)
|
|
Weight Changes 1992-1993 (kg) |
||||||
|
1992 BMI |
<-3 |
-3 to -1.1 |
-1 to +l |
1.1 to +3 |
>+3 |
Total % (sample size) |
|
|
Underweight: BMI <18.5 |
4.2 |
11.1 |
46.8 |
12.1 |
25.8 |
100.0 |
|
|
Normal: 18.5 ≤ BMI< 25 |
11.1 |
10.8 |
47.6 |
13.6 |
16.9 |
100.0 |
|
|
Overweight: 25 ≤ BMI <30 |
16.1 |
11.0 |
43.8 |
12.8 |
16.2 |
100.0 |
|
|
Severely Overweight: BMI ≥30 |
15.5 |
11.2 |
44.2 |
13.1 |
16.0 |
100.0 |
|
|
% of sample (Total number) |
13.2 |
10.9 |
45.9 |
13.3 |
16.7 |
100.0 |
|
|
SOURCE: Russian Longitudinal Monitoring Survey, July-October 1992 and 1993. |
|||||||
Table 12-6 shows the percentage weight changes in Russia between 1992 and 1993. It should be noted that there is so little known about short-term weight changes among normal free-living populations that caution must be used in examining these results. We assume small random measurement error and other minor changes that place people in the plus or minus 1 kilogram (kg) weight change group, which is insignificant. Those with more than 3 kg of weight change are the key group. What we find is that among the sample of adults aged 18-59, close to half experienced no weight change, about 30 percent increased their weight, and 25 percent experienced a loss.
In Table 12-6, the weight changes are classified by initial BMI. There were only 190 adults in the chronic energy deficiency group in 1992 who were also weighed in 1993. Most of these adults had an increase in weight, with 25.8 percent experiencing an increase of over 3 kg and 4.2 percent a loss of more than 3 kg. Adults who had higher BMIs in 1992 had a much greater likelihood of losing weight than those with lower BMIs, while, as indicated in Table 12-4, the overall tendency within the population was toward a very slight weight gain.
Figure 12-1 presents the weight distribution for adults in 1992 and 1993. While the figure shows extensive individual weight change, it is instructive to note that the overall weight distribution did not change greatly, although there was a slight shift toward higher weight.
Earlier results indicated a downward trend in diet. The dietary assessment
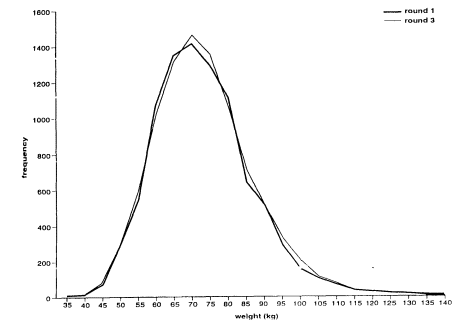
Figure 12-1
Weight distribution for adults aged 18-59.
SOURCE: Russian Longitudinal Monitoring Survey, rounds 1 and 3.
instruments did not change between rounds 1 and 3 of the survey. Thus while it is expected that the level of diet is underestimated with the 24-hour recall, we must assume that the results on trends are consistent. There are some anecdotal data to indicate a considerable increase in television viewing and a reduction in work-related physical activity, but no systematic analysis of physical activity trends has been undertaken.
Kyrgyz
Table 12-7 presents the distribution of BMI patterns for different age groups. The highest percentages of respondents with BMI lower than 18.5 were seen among those aged 18-29 and elderly people aged 60 and over. About 5 percent of the population of these ages could be considered to have chronic energy deficiency. The prevalence of chronic energy deficiency among the young and the elderly was twice as high as among the middle-aged.
Among this sample of adults, obesity was more of a problem than undernutrition. The prevalence of a BMI of 30 or more varied greatly across the different age groups. The proportion of obesity increased to 8 percent at ages 30-39 and
TABLE 12-7 Distribution of Kyrgyz Adult Nutritional Status Categorized by Age/Gender (in percent)
reached a maximum level of 16 percent at ages 40-49; it declined at age 60 and above.
A high percentage of adults in the overweight category (BMI >25.0) was found among those aged 40-59. More than 50 percent of respondents in this age group could be considered overweight. As an aside, even among the elderly aged 60+, 47 percent were overweight and 14 percent obese (data not shown). The frequencies of overweight and obesity were higher among women than men. Especially high levels of overweight and obesity were observed among women aged 40-59. In this middle-aged group, overweight and obesity were a far greater problem than chronic energy deficiency.
Historical Patterns Of Consumption: Post-World War II
The pattern of change in the Soviet Union during 1950-1970 appears to have been followed often during the past century by other countries (Popkin, 1993). Sugar intake increased rapidly, consumption of cereals and starchy tubers (mainly potatoes) declined greatly, and consumption of red meat and dairy products rose considerably. This pattern of change is depicted in Figure 12-2.
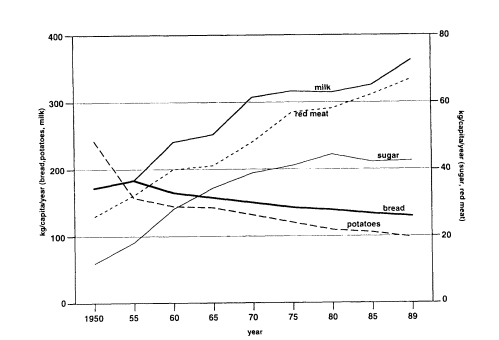
Figure 12-2
Changes in food consumption: annual intake of selected foods, Soviet Union, 1950-1989.
SOURCE: State Statistical Bureau and Ministry of Agriculture, Russian Federation.
Figure 12-2 shows that a dramatic shift in consumption patterns occurred in the 1960s. The largest increase in red meat consumption began in 1965 and continued until 1975. The increase in sugar and milk and milk product consumption was much more gradual and continuous throughout this period. These patterns occurred in both the Soviet Union and the Russian Federation; however, we do not have Russian data for as long a period, so the figure shows the data for the Soviet Union only.
Table 12-8 provides per capita food balance data for the 1965-1992 period for the Russian Federation. The trends for the former Soviet Union and the Russian Federation are comparable; for example, meat consumption increased by approximately the same proportion in both. Over the period 1950 to 1989, consumption of meat and milk products increased about 2.5 times for the former Soviet Union, and there was a similar large increase in consumption of eggs, sugar, vegetable oil, fruits, vegetables, and fish products. At the same time, there were large decreases in the consumption of bread products and potatoes, the staples of the traditional Russian diet.
Energy intake increased considerably until the 1980s and thereafter did not change greatly during that decade. However, the structure of the diet continued to change, and by 1990 over 36 percent of the Russian food supply was providing energy from fat, making this one of the richest diets in the world in terms of meat and dairy consumption. Food expenditure and food supply data provide a comparable picture of food intake trends for this period. The food expenditure data from the Goskomstat consumer budget survey (Table 12-9) show a lower level of food intake than is suggested by the food supply (based on food balance sheets) noted in Figure 12-2. However, this is a pattern found in most countries and is due to recall errors by respondents and unmeasured waste. The proportion of energy from animal products is also shown as lower in the Goskomstat data. Nonetheless, the two sets of results combine to provide an overall picture of a country that experienced a marked transformation of its diet during the post-World War II period.
Discussion
This chapter has presented both recent information on diet and body composition and a brief historical review of nutritional changes during the post-World War II period. Historical data on food availability, along with unreported policy documents (Khrushchev, 1961; Brezhnev, 1967), portray a country that quite purposely transformed its diet into one of the richest in the world. During 1960-1980, per capita consumption of cereals and starchy tubers (mainly potatoes) declined greatly, and consumption of sugar and red meat increased. As discussed in other chapters in this volume, these trends are related to adverse health patterns that led to significant increases in adult mortality, particularly from coronary heart disease.
TABLE 12-8 Annual Food Availability (Kg/Capita), Russian Federation, 1965-1992
|
|
1965 |
1970 |
1975 |
1980 |
1985 |
1990 |
1991 |
1992 |
|
Bread products |
164 |
156 |
144 |
126 |
119 |
119 |
120 |
125 |
|
Potatoes |
147 |
153 |
139 |
118 |
109 |
106 |
112 |
118 |
|
Vegetables and melon |
69 |
70 |
82 |
94 |
98 |
89 |
86 |
77 |
|
Fruits and berries |
17 |
30 |
36 |
30 |
40 |
35 |
35 |
33 |
|
Sugar |
31 |
37 |
42 |
47 |
45 |
47 |
38 |
34 |
|
Meat products |
41 |
42 |
50 |
59 |
62 |
69 |
63 |
55 |
|
Fish products |
12 |
15 |
19 |
23 |
23 |
20 |
16 |
13 |
|
Milk products |
255 |
271 |
331 |
328 |
344 |
386 |
347 |
281 |
|
Vegetable oil |
6 |
8 |
7 |
9 |
10 |
10 |
8 |
7 |
|
Eggs |
128 |
141 |
182 |
279 |
299 |
297 |
288 |
263 |
|
Daily protein intake |
83 |
82 |
87 |
85 |
84 |
88 |
81 |
81 |
|
Daily fat intake |
78 |
81 |
98 |
106 |
105 |
125 |
111 |
87 |
|
Daily calories intake |
2,844 |
2,902 |
3,045 |
3,005 |
2,923 |
3,141 |
2.906 |
2,649 |
|
Energy from fat |
0.25 |
0.25 |
0.28 |
0.31 |
0.32 |
0.36 |
0.35 |
0.30 |
|
SOURCE: State Statistical Bureau and Ministry of Agriculture. Russian Federation. |
||||||||
TABLE 12-9 Goskomstat Consumer Budget Survey: Household Food Available (Russia Only)
|
|
1970 |
1975 |
1980 |
1985 |
1990 |
1993 |
|
Energy (kcal per day) |
2,939 |
2,946 |
2,831 |
2.739 |
2,478 |
2,617 |
|
Protein (g per day) |
86.0 |
88.6 |
79.4 |
77.8 |
71.1 |
70.7 |
|
Percent energy from fat |
29.8 |
32.6 |
33.4 |
34.8 |
32.4 |
31.3 |
|
Cereals and products (kg/cap/yr) |
125 |
115 |
112 |
105 |
97 |
110 |
|
Meat products (kg/cap/yr) |
66 |
77 |
70 |
70 |
70 |
61 |
|
Milk products (kg/cap/yr) |
371 |
413 |
391 |
378 |
378 |
318 |
|
SOURCE: State Committee on Statistics (Goskomstat), Consumer Budget Survey. The sample size was about 49,000 in each year. |
||||||
The reform period officially began in January 1992, but changes in the above trends had already begun. The removal of food subsidies for meat and dairy products, high inflation rates, and the privatization of food markets have begun to result in a meaningful change (albeit smaller than might have been expected) in the structure of food consumption in Russia. To the extent that these trends reflect a decrease in higher-fat foods and an increase in the consumption of bread and potatoes, the basic staples of the Russian diet at the time of World War II, they are viewed as positive for the public health. While there has been a significant shift in the proportion of energy from fat and protein, however, the Russian population continues to consume a moderately high-protein and high-fat diet.
It is not possible to provide an analysis that can link consistent and nationally representative nutritional data from the post-World War II and recent reform periods. The first nationally representative surveys and the first large-scale studies of body composition in the country were the Russian Longitudinal Monitoring Survey and the Kyrgyz Multipurpose Poverty Survey.
Chronic energy deficiency does not appear to be a major adult health problem in Russia and Krygyz, but this is not the case for obesity and a very high-fat diet. Levels of obesity in both countries are among the highest in the world. Moreover, our results demonstrate that between 1992 and 1993, there were marked increases in alcohol intake among adult men in Russia. This represents a shift in energy intake from more nutrient-dense sources to alcohol—a source of energy that provides no other nutrients.
Available research does not provide a basis for analysis of other potential nutritional problems, such as widespread iron deficiency among women of childbearing age and other nutritional deficiencies, during the survey period. The survey data do indicate that the specter of famine, at least among adults, was not an emerging major concern during 1992 and 1993 (see also Mroz and Popkin, 1995). There was no significant shift toward weight loss among the population. The data on weight changes in Russia between 1992 and 1993 show that there were considerable shifts over a 12-month period. What is not clear is the extent to which these weight changes differ from what would be expected among other adult populations. The proportion of adults who gained weight was equal to or greater than the proportion that lost weight. Typically we worry about weight loss, which is usually related to higher rates of mortality among hospitalized populations, particularly the elderly. We have no basis for such concern with regard to the free-living Russian population. However, the increase in weight is noteworthy among a population with such a high level of obesity.
It is also noteworthy that the increase in weight shown in Table 12-6 and to a lesser extent in Figure 12-1 was accompanied by a general decrease in the availability and consumption of food during the 1990s. As seen in Tables 12-8 and 12-9, there was a general decline during the 1980s and 1990s in the amount of most foods available for consumption, including protein, fat, and total caloric intake. This is confirmed by the Russian Longitudinal Monitoring Survey data
that show a decline between 1992 and 1993 in the individual-level consumption of total energy, as well as energy from fat and protein (Table 12-1). However, without longer-term monitoring and more causal analysis, we are unable to assess the causes of these patterns. In particular, later rounds of the Russian Longitudinal Monitoring Survey have collected physical activity data. These data must be examined if we are to understand the extent to which the shift in body composition relates to diet and to declines in physical activity at work and at home.
Pearson and Patel (in this volume) focus on the types of food policy changes undertaken by the health sector. During the prereform period in Russia, food policy changes appear to have been driven by political and economic concerns and linked to shifts in agricultural supply. No systematic attempts have been made to address food policy in the postreform period. However, secure food supply as related to provision of a social safety net has been a prime concern of social policy (Mroz and Popkin, 1995).
Acknowledgments
Funding for data collection for the first three rounds of the Russian Longitudinal Monitoring Survey was provided by the World Bank and the U.S. Agency for International Development. Additional funding for file creation has come from the National Institutes of Health (1 RO1HD30880). These surveys were a collaborative project of the University of North Carolina at Chapel Hill, Goskomstat, the Russian Center of Preventive Medicine, and the Russian Institute of Sociology. The Russian Institute of Nutrition joined for work on round 3 of the Russian Longitudinal Monitoring Survey. Key collaborators of the authors in this survey are Barbara Entwisle, Michael Swafford, and Tom Mroz, University of North Carolina at Chapel Hill; Alexander Nikolarvitch Ivanov and Igor Ivanovitch Dmitrichev, Goskomstat; Polina Kozyreva and Michael S. Kosolapov, Russian Institute of Sociology; and Svetlana Shalnova and Alexander Deev, Russian Center of Preventive Medicine. A number of persons have provided important assistance in this work on nutrition. Most important have been Michael Lokshin, University of North Carolina at Chapel Hill, in the processing and handling of all the Kyrgyz data, and Karin Gleiter, Laura Kline, and David Robinson, University of North Carolina at Chapel Hill, for the Russian data. Marina Mozhina, Institute for Socio-Economic Population Studies, Moscow, is thanked for her assistance in providing background material used in this chapter. Frances Dancy assisted with support in administrative matters.
References
Black, A.E., G.R. Goldberg, S.A. Jebb, M.B.E. Livingstone, T.J. Cole. and A.M. Prentice
1991 Critical evaluation of energy intake data using fundamental principles of energy physiology: 2. Evaluating the results of published surveys. European Journal of Clinical Nutrition 45:583-599.
Brezhnev, L.I. 1967 The report of the General Secretary of the Central Committee of the Communist Party of the Soviet Union. P. 48 in The Proceedings of the XXIV Congress of the CPSU. Moscow: Gospolitizdat.
Food and Agricultural Organization of the United Nations/World Health Organization/United Nations University 1985 Energy and Protein Requirements. WHO Technical Report No. 724. Geneva: World Health Organization.
Goldberg, G.R., A.E. Black, S.A. Jebb, T.J. Cole, P.R. Murgatroyd, W.A. Coward, and A.M. Prentice 1991 Critical evaluation of energy intake data using fundamental principles of energy physiology:1. Derivation of cut-off limits to identify under-reporting. European Journal of Clinical Nutrition 45:569-581.
Heywood, P., P.W.J. Harvey, and G.C. Marks 1993 An evaluation of energy intakes in the 1983 Australian National Dietary Survey of Adults. European Journal of Clinical Nutrition 47:604-606.
James, W.P.T., A. Ferro-Luzzi. and J.C. Waterlow 1988 Definition of chronic energy deficiency in adults: Report of a working party of the international dietary energy consultative group. European Journal of Clinical Nutrition 42:969-991.
Khrushchev, N.S. 1961 The report of the first secretary of the central committee of the Communist Party of the Soviet Union. Pp. 171-172 in The Proceedings of the XXII Congress of the CPSU. Moscow: Gospolitizdat.
Mroz, T., and B. Popkin 1995 Poverty and the economic transition in the Russian Federation. Economic Development and Cultural Change 44:111-141.
Popkin, B.M. 1993 Nutritional patterns and transitions. Population and Development Review 19(1): 138-157.
Popkin B.M., N. Zohoori, and A. Baturin 1996 The nutritional status of the elderly in Russia, 1992-1994. American Journal of Public Health 86:355-360.


