
4
Budget Trends For the Research and Data Analysis Programs
The objective of this chapter is to examine budget data for trends in the 1990s in funding of R&DA programs; in allocation of R&DA funds among NASA laboratories, academia, and industry; and in size and duration of grants. The task was laborious, and the risk of inaccuracy was high because R&DA programs are dispersed through many budget categories, definitions within budget categories vary among NASA's three science program offices, and these definitions have changed from year to year.
Faced with these difficulties, the task group limited its analyses to three sources of published data: (1) NASA's budget books for FY 1991 through 1998, (2) NSF's sectoral overview of basic research funding, and (3) NASA's grants and contracts books. The budget books offer the most accurate numbers but provide surprisingly little insight about who did the work or, in fact, about how funds were actually spent. The NSF overview offers the task group's only insight into who did the work, but the numbers are aggregated at too large a level to reflect only R&DA allocations. The grants and contracts books reveal much about how funds were used by universities and, to some extent, by industry, but they provide no information about their use by NASA centers.
These three sources offer a limited window on NASA's R&DA activities, but because they represent different cuts at a complex problem, they are not perfectly consistent among themselves. That is, readers will find small differences among what might otherwise appear to be equivalent budget categories in the three data sources. Even within a single data source, certain categories were modified by the task group to achieve greater year-to-year consistency. For example, Hubble Space Telescope (HST) operations have been separated from HST MO&DA because the task group is aware that some MO&DA funds were used to build second-generation HST instruments.
4.1 OVERALL NASA FUNDING TRENDS FOR R&DA: FY 1991-1998
1NASA budget books for FY 1991 through FY 1998 were used to examine gross budget trends. Budget data, along with relevant language from budget justification documents and experience with NASA programs, allowed the task group to track R&DA-related activities through changes in accounting definitions.
The task group's definition of the NASA "research base" pulls together six categories of data extracted from the NASA budget: (1) traditional R&A line items; (2) data collected on an accumulation of relevant ground-based activities, referred to as "other science support," that have only recently begun to appear in the NASA budget; (3) suborbital programs; (4) MO&DA; (5) supporting infrastructure, a category devised to incorporate engineering, operations, and other support for science infrastructure;2 and (6) academic programs, as specifically listed in NASA budget documents. Box 4.1 defines these six budget categories. The budget trends for these and other components of NASA science-related activities during the 1990s are given in Table 4.1.
It is difficult to get a sense of the historical trends for the DA funding of MO&DA because NASA has not separated DA from MO&DA. The task group notes that the rapid increases in MO&DA early in the decade were driven by the operational needs of large space science missions such as the HST and the Gamma Ray Observatory. The summary here does not reflect the full impact of these MO&DA increases since the HST operations and servicing line have been moved to the flight hardware budget summary. (See Appendix A, Table A.2) It is important to note that NASA is implementing a major restructuring of these activities. 3
The task group makes the following observations:
-
Total R&DA funding (adjusted for inflation) grew 44 percent between FY 1991 and FY 1998, but the increase was due mainly to growth in the Earth Observing System Data and Information System (EOSDIS) (with an increase of $157 million in FY 1995 dollars over the 8-year period) and to the transfer of technology development funding from the Office of Space Access and Technology (OSAT) to OSS ($201 million in FY 1995 dollars). R&DA funding in areas other than EOSDIS and the transfer of technology funds from OSAT showed a net increase of about 7 percent in inflation-adjusted terms.
-
Traditional R&A declined by $98 million (in FY 1995 dollars), or nearly 22 percent.
-
All science-related, ground-based activities account for about 11 percent of the overall NASA budget in FY 1998, up from about 7 percent in FY 1991.
-
Funding for the suborbital program increased 19 percent in constant dollars. The increase was related to the transition from the Kuiper Airborne Observatory to the new Stratospheric Observatory for Infrared Astronomy (SOFIA).
-
Academic outreach programs increased from a small base of about $61 million for distributed activities in FY 1991 to $113 million in FY 1998.
|
1 |
The task group is grateful for the assistance of Mr. Malcolm Peterson, comptroller, National Aeronautics and Space Administration, and his staff in providing some of the data on NASA budgets. Any errors are attributable to the task group and not to NASA. |
|
2 |
The detailed historical tables in Appendix A provide information on the science discipline breakdown that has been the traditional program structure of the NASA budget. Specific R&A budget line items can be found in earlier budgets for physics and astronomy (P&A, which includes astrophysics and space and solar physics), for planetary exploration, for life sciences and microgravity research, and for the Earth sciences. |
|
3 |
"Full Costing in NASA," Office of Chief Financial Officer, National Aeronautics and Space Administration, February 1996. |
|
Box 4.1 Components of NASA Ground-based Research Research and Analysis The traditional R&A NASA budget line items differ across NASA program offices. For example, in the Office of Space Science (OSS), R&A supports designs for future missions, sensor and instrument development, and ground-based observations and experiments, among other activities. In life sciences, the R&A program supports applied and basic research in biomedicine, biology, environmental science, and related technologies, including ground-based research, as well as support facilities and technologies, among other items. In microgravity science, R&A includes ground-based experiments; experiments selected for flight; and research in biotechnology, combustion science, fluid physics, materials science, and low-temperature physics. The Earth science applied R&DA program supports the Office of Earth Science (OES) science and operations, data retrieval and storage, science for Earth Observing System (EOS) programs, airborne science, and applications, among other activities. 1 Other Science Support Other science support includes mission studies and technology development, a new category of the OSS budget; EOS science; and mission science teams and guest investigator programs in the OES budget. Suborbital Programs The category "suborbital programs" includes funding for sounding rockets, high-altitude balloon flights, and the operation of NASA's fleet of space-and Earth-science research aircraft. MO&DA MO&DA includes funding for the operations of data-collecting hardware, analysis of data, satellite operations during core missions, and continuation of data analysis after the core mission. Preflight preparations and preliminary data analysis are also supported under this category. It does not include HST operations and servicing funds, which were grouped by the task group as major flight project funding because of the large element of instrument development funding included in this line item. (See Appendix A, Table A.2.) Supporting Infrastructure2 Included in the category "supporting infrastructure" is funding for a variety of activities that support NASA science programs but are not directly focused on the performance of space research (e.g., engineering, operations, facilities support). Academic Programs Academic programs include NASA training grants (all academic levels) and minority research and education programs.
|
TABLE 4.1 NASA Research and Analysis Budgets in Context, FY 1991-1998
|
NASA Science-related Programs and Activities |
FY 1991 |
FY 1992 |
FY 1993 |
FY 1994 |
FY 1995 |
FY 1996 |
FY 1997 |
FY 1998a |
Percent Change, FY 1991-1998 |
|
In Millions of Constant FY 1995 Dollars |
|||||||||
|
R&A (traditional definition) |
453 |
426 |
431 |
438 |
430 |
417 |
388 |
355 |
-21.5 |
|
Office of Space Science |
184 |
158 |
182 |
183 |
184 |
153 |
160 |
122 |
-33.4 |
|
Office of Life and Microgravity Science and Applications |
78 |
86 |
74 |
75 |
81 |
83 |
86 |
79 |
2.3 |
|
Office of Earth Science |
191 |
183 |
175 |
179 |
165 |
181 |
142 |
154 |
-19.8 |
|
Other science support |
0 |
0 |
0 |
0 |
64 |
46 |
81 |
83 |
N/A |
|
EOS Data and Information System (EOSDIS) |
40 |
84 |
137 |
193 |
221 |
242 |
224 |
197 |
394.1 |
|
Suborbital programs |
83 |
87 |
90 |
97 |
93 |
113 |
76 |
99 |
19.3 |
|
MO&DA (adjusted) |
372 |
413 |
479 |
429 |
379 |
401 |
403 |
371 |
0.0 |
|
Supporting infrastructure |
5 |
54 |
78 |
52 |
67 |
81 |
103 |
44 |
787.1 |
|
Science-related technology programs |
0 |
0 |
0 |
0 |
0 |
0 |
192 |
201 |
N/A |
|
Academic programs |
61 |
72 |
97 |
88 |
106 |
107 |
115 |
113 |
84.6 |
|
Total ground-based activities |
1,014 |
1,134 |
1,312 |
1,297 |
1,359 |
1,408 |
1,581 |
1,464 |
44.4 |
|
As Percentage of NASA Budget |
|||||||||
|
R&A (traditional definition) |
2.9 |
2.8 |
2.9 |
2.9 |
3.1 |
3.1 |
3.0 |
2.8 |
|
|
Other science support |
0.0 |
0.0 |
0.0 |
0.0 |
0.5 |
0.3 |
0.6 |
0.6 |
|
|
EOS Data and Information System (EOSDIS) |
0.3 |
0.5 |
0.9 |
1.3 |
1.6 |
1.8 |
1.7 |
1.5 |
|
|
Suborbital programs |
0.5 |
0.6 |
0.6 |
0.7 |
0.7 |
0.8 |
0.6 |
0.8 |
|
|
MO&DA (adjusted) |
2.4 |
2.7 |
3.2 |
2.9 |
2.7 |
3.0 |
3.1 |
2.9 |
|
|
Supporting infrastructure |
0.0 |
0.3 |
0.5 |
0.3 |
0.5 |
0.6 |
0.8 |
0.3 |
|
|
Science-related technology programs |
0.0 |
0.0 |
0.0 |
0.0 |
0.0 |
0.0 |
1.5 |
1.6 |
|
|
Academic programs |
0.4 |
0.5 |
0.6 |
0.6 |
0.8 |
0.8 |
0.9 |
0.7 |
|
|
Total ground-based activities |
6.6 |
7.4 |
8.7 |
8.7 |
9.7 |
10.4 |
12.1 |
11.4 |
|
|
As Percentage of Total NASA Science-related Activities |
|||||||||
|
R&A (traditional definition) |
16.5 |
14.2 |
13.9 |
11.9 |
10.9 |
10.8 |
11.0 |
10.0 |
|
|
Other science support |
0.0 |
0.0 |
0.0 |
0.0 |
1.6 |
1.2 |
2.3 |
2.3 |
|
|
EOS Data and Information System (EOSDIS) |
1.4 |
2.8 |
4.4 |
5.3 |
5.6 |
6.3 |
6.3 |
5.6 |
|
|
Suborbital programs |
3.0 |
2.9 |
2.9 |
2.6 |
2.4 |
2.9 |
2.1 |
2.8 |
|
|
MO&DA (adjusted) |
13.5 |
13.8 |
15.5 |
11.7 |
9.6 |
10.4 |
11.4 |
10.5 |
|
|
Supporting infrastructure |
0.2 |
1.8 |
2.5 |
1.4 |
1.7 |
2.1 |
2.9 |
1.2 |
|
|
Science-related technology programs |
0.0 |
0.0 |
0.0 |
0.0 |
0.0 |
0.0 |
5.4 |
5.7 |
|
|
Academic programs |
2.2 |
2.4 |
3.2 |
2.4 |
2.7 |
2.8 |
3.3 |
3.2 |
|
|
Total ground-based activities |
36.8 |
37.9 |
42.4 |
35.3 |
34.4 |
36.5 |
44.7 |
41.2 |
|
|
Reference Data |
|||||||||
|
NASA total agency budget (million current dollars) |
13,868 |
14,333 |
14,322 |
14,549 |
13,996 |
13,884 |
13,709 |
13,638 |
-2.7 |
|
NASA Science-related Programs and Activities |
FY 1991 |
FY 1992 |
FY 1993 |
FY 1994 |
FY 1995 |
FY 1996 |
FY 1997 |
FY 1998a |
Percent Change, FY 1991-1998 |
|
Reference Data continued |
|||||||||
|
NASA total agency budget (million constant FY 1995 dollars) |
15,358 |
15,428 |
15,028 |
14,922 |
13,996 |
13,571 |
13,111 |
12,800 |
-18.2 |
|
Total science-related activities (million current dollars) |
2,486 |
2,781 |
2,947 |
3,583 |
3,950 |
3,951 |
3,695 |
3,781 |
51.7 |
|
Total science-related activities (million constant FY 1995 dollars) |
2,753 |
2,993 |
3,092 |
3,675 |
3,950 |
3,862 |
3,534 |
3,548 |
27.6 |
|
NOTE: The data presented in Table 4.1 are based on appropriated budgets or budgets proposed for the congressional appropriations process. The numbers refer to "budget authority" rather than "outlays." That is, they represent funding levels approved for spending, but they are not necessarily equal to the actual expenditures in a given year for two reasons. First, there is usually a time lag between appropriations approvals and the actual outlay of funds. Second, there are usually small differences (typically a few percent) between the total appropriated level and the funds actually issued as grants and contracts in a particular account due to funds set aside for the congressionally mandated Small Business Innovative Research program and for some NASA institutional costs. Several adjustments have been made to the data summarized in Table 4.1. In keeping with the objective of accounting for all R&DA-type funding, broadly defined, amounts for the Office of Space Science are included to accommodate the new category in NASA's recently restructured budget that is designated "mission studies and technology development." In a similar manner, the two categories in NASA's budget designated "EOS science" and "mission science teams and guest investigators" have been added to the Office of Earth Science. All three items are included in the category designated "other science support.'' In addition, the definition of the OSS MO&DA account has been narrowed by subtracting the "HST operations and servicing" component and moving these dollars to the summary of science-related flight projects. This latter adjustment was made because much of the funding in the HST operations and servicing budget is related to the development of advanced flight instrumentation for the Hubble Space Telescope. Items may not add to totals because of rounding. a Estimate. |
|||||||||
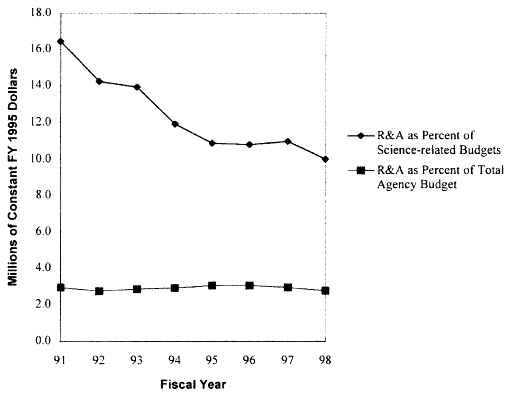
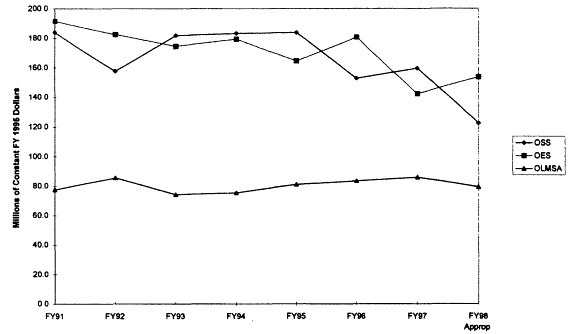
Figure 4.1 illustrates trends in the NASA budget for ground-based research. The budget trends for R&A components of the science program offices are depicted in Figure 4.2 and show widely divergent patterns with some significant year-to-year variations. From FY 1991 to FY 1998 the OSS R&A budget decreased by 33 percent, the OES budget decreased by 20 percent, and the OLMSA budget decreased by 2 percent.
Following are some additional observations:
-
From FY 1991 to FY 1998, R&A programs remained nearly constant as a proportionate share of the total NASA budget, hovering around 3 percent.
-
The proportions for R&A as a share of total NASA science-related funding (the latter concept includes the total budgets of the three science program offices plus the academic programs) declined more than 6 percentage points, from 16.5 percent for FY 1991 to 10 percent projected for FY 1998— about a 35 percent share reduction in 8 years.
4.2 DISTRIBUTION BY SECTOR OF NASA FUNDING FOR BASIC RESEARCH: FY 1991-1997
Each year, NASA submits estimates to the NSF about its research and development expenditures and where the work was performed. Expenditures are classified as basic research, applied research, or development. These data become part of NSF's annual report on federal support for research and development—the only published data of this type.
NASA's research-performing institutions are the federally funded research and development centers (FFRDCs), nonprofit institutions, NASA field centers, universities and colleges, and private industry. NASA's only FFRDC is the Jet Propulsion Laboratory (JPL) in Pasadena, California, which is the lead center for planetary programs, operates the deep-space network, and undertakes extensive technology development. Research funding for these five types of institution begins with the federal budget appropriation to NASA. The agency distributes the funds as procurements (contracts, grants, and cooperative agreements) to both internal and external scientists. Internal NASA research is currently funded both by institutional budgets for civil service salaries and facilities and by internal grants for research expenses associated with, for example, on-site contractors, hardware, or field work.
Table 4.2 provides a top-level look at NASA's allocations for basic research by performing sector. The distributions accounted for nearly $2 billion in research obligations for 1996 and included more than R&DA expenditures. For example, they included flight program and hardware procurements.4 These data are the only currently published comprehensive estimates, as far as the task group is aware, of NASA's intramural (in-house) research program.
The task group makes the following observations:
-
Colleges and universities constitute about one-quarter of the overall NASA basic research program. Basic research funding to academic institutions as a fraction of total NASA basic research rose from 21 percent in 1991 to 26 percent in 1997.
-
NASA intramural and JPL funding constituted about 40 percent of the NASA research program in 1997, down from 45 percent in 1991.
-
Although private industry constitutes about 30 percent of the research program, this may be misleading. Industry is less involved in independent research now than, for example, during the Apollo era. Some of industry's participation is likely to be contractor support to NASA field centers and to JPL. This would increase the NASA intramural and JPL share.
4.3 UNIVERSITY GRANTS AND CONTRACTS BY TYPE OF ACTIVITY: FY 1986-1995
Data in this section concern only the academic sector and were developed by the task group from extensive listings of contracts and grants awarded to universities.5 Raw data are published annually by NASA Headquarters in a ledger format.6 Because electronically scanning these ledgers to obtain data
TABLE 4.2 Distribution of NASA Basic Research Support by Performing Sector, FY 1991-1997
that could be manipulated was exceedingly labor intensive, the task group chose to limit its analyses to 3-year time increments from 1986 through 1995.7
R&DA funds are the primary means for the science community to participate in NASA programs. Although NASA keeps exhaustive records of individual procurement contracts and grants to universities, there has been no aggregation of these allocations by discipline, program office, or type of research activity. The task group believed that it was important to summarize, for the first time, the uses of research funds within the academic sector.
The task group developed the category of NASA "net space research" funding to the universities.8 Net space research means funding for research from an R&DA source, as opposed to technology development, instrument development, and academic training that may be funded by other accounts. The method for classifying accounts in this way is detailed in Appendix A. Assignments of grants to disciplines or programs were based on the task group's familiarity with the research or the category of research that was funded by a particular program officer.
|
7 |
presenting some of the data for FY 1986 through FY 1995 and some for FY 1991 through FY 1998 may appear confusing and the data may be difficult to correlate; thus different intervals were chosen for the "award data" to get a historical sense of the budget trend. |
|
8 |
Appendix A describes and explains how net space research data were developed. The basic procedure entailed filtering out thousands of award records for each year to separate the largest awards, which were then hand-coded to reflect the types of activities carried out under each award. Smaller awards (generally less than $300,000 in any of the years examined) were then allocated on the basis of field-of-science codes that had previously been assigned by NASA technical and procurement personnel involved in awarding the specific contracts and grants. |
TABLE 4.3 NASA Procurement Awards to Colleges and Universities, FY 1986-1995
|
|
Funding (obligations in million constant FY 1995 dollars) |
Composition (% of total) |
||||||
|
Category |
FY 1986 |
FY 1989 |
FY 1992 |
FY 1995 |
FY 1986 |
FY 1989 |
FY 1992 |
FY 1995 |
|
Research Contracts and Grants |
||||||||
|
OLMSA disciplines |
22 |
25 |
34 |
45 |
6.1 |
4.5 |
4.8 |
5.4 |
|
OSS disciplines |
85 |
122 |
151 |
136 |
23.6 |
22.2 |
21.1 |
16.4 |
|
OES disciplines |
67 |
69 |
103 |
119 |
18.4 |
12.5 |
14.4 |
14.4 |
|
Subtotal—net space researcha |
174 |
216 |
289 |
299 |
48.1 |
39.2 |
40.2 |
36.3 |
|
Other Space Science Activities |
|
|
|
|
0.0 |
0.0 |
0.0 |
0.0 |
|
Instrument design and development |
39 |
68 |
86 |
119 |
10.8 |
12.3 |
11.9 |
14.4 |
|
Spacecraft design and development |
16 |
23 |
31 |
48 |
4.5 |
4.2 |
4.3 |
5.8 |
|
Operation of science facilities |
3 |
16 |
25 |
30 |
0.7 |
2.9 |
3.5 |
3.6 |
|
Operation of support facilities |
12 |
20 |
8 |
9 |
3.4 |
3.6 |
1.1 |
1.1 |
|
Centers of excellence |
2 |
1 |
3 |
5 |
0.4 |
0.1 |
0.5 |
0.6 |
|
Subtotal—other space science |
72 |
127 |
153 |
210 |
20.0 |
23.1 |
21.3 |
25.5 |
|
Space Science-related Programs (sum of two categories above) |
246 |
343 |
442 |
510 |
68.1 |
62.4 |
61.5 |
61.8 |
|
Other NASA Activities |
||||||||
|
Training grants |
11 |
16 |
31 |
43 |
2.9 |
2.8 |
4.2 |
5.2 |
|
National space grant colleges |
0 |
0 |
14 |
15 |
0.0 |
0.0 |
1.9 |
1.8 |
|
Other education programs |
7 |
10 |
12 |
30 |
1.8 |
1.8 |
1.7 |
3.7 |
|
Centers of excellence (nonscience) |
5 |
30 |
46 |
41 |
1.4 |
5.4 |
6.4 |
5.0 |
|
Technology and technology transfer |
78 |
133 |
140 |
151 |
21.7 |
24.1 |
19.5 |
18.3 |
|
Not Distributed |
15 |
18 |
34 |
36 |
4.1 |
3.3 |
4.7 |
4.3 |
|
Subtotal—other NASA activities |
116 |
207 |
277 |
316 |
31.9 |
37.4 |
38.4 |
38.3 |
|
TOTAL |
362 |
550 |
719 |
826 |
100.0 |
100.0 |
100.0 |
100.0 |
|
NOTE: Details may not add to totals because of rounding. a See Appendix A. |
||||||||
Table 4.3 lists NASA awards to colleges and universities. The first category indicates contracts and grants awarded by the three NASA science program offices: OLMSA, OSS, and OES. The second shows NASA funding for space-science-related activities other than bench-level research grants.9 The most important of these are hardware design and development activities. The third category shows NASA awards that are not directly related to the performance of space research, including awards for various academic programs and activities associated with technology development and transfer. The largest of these are associated with aeronautical research and engineering programs.
NASA's definition of training grants, listed in the third category in Table 4.3, includes three segments of the NASA fellowship program: (1) the Graduate Student Research Program (GSRP) for students working on a dissertation project, (2) Global Change Research Fellowships for students concentrating in the area of global change, and (3) Minority Graduate Student Fellowships for minority students completing graduate work in space-related research. Students participating in the NASA fellowship program often work under the mentorship of an R&DA-funded professor.
The task group makes the following observations:
-
There was a significant increase in net space research in the late 1980s corresponding, in part, to resumption of launch activity after the Challenger accident.
-
During this same period, the percentage of net space research declined from 48 percent of total awards to universities in FY 1986 to 36 percent in FY 1995.
-
Funding for nonscience centers of excellence and NASA technology development and transfer programs increased over the decade.
-
Other science-related activities maintained approximately the same proportion of funding over the decade.
4.4 UNIVERSITY GRANTS AND CONTRACTS: AWARD SIZES AND DURATIONS
Its investment in developing a database of NASA procurement statistics enabled the task group to compute the average size and duration of awards to universities. Table 4.4 summarizes these data. New awards are also listed separately to show the effects on overall average award duration of the large number of NASA awards that are continued over long periods of time (in some cases a decade or longer). The median duration of new awards is 13 months and of continuing awards is 35 months. The median duration of all NASA grants was 35 months in FY 1995 compared to the historical median of 24 to 25 months in FY 1986, FY 1989, and FY 1992.
The task group makes the following observations:
-
The number of annual awards by NASA to universities (both general awards and "net space research" awards) has expanded greatly since FY 1986, but most of this expansion seems to have occurred before FY 1992. The task group's data do not indicate the extent to which this growth reflects an increase in the number of investigators being funded versus an increase in the number of multiple grants being awarded to individual investigators.
-
The use of simple mean values tends to be highly misleading in terms of what is actually happening to contract and grant sizes from the point of view of the typical NASA researcher. For example, while the average (mean) size of net space research awards (Table 4.4) to university recipients increased (in constant FY 1995 dollars) from $107,000 in FY 1986 to $113,000 in FY 1995, the most frequent award size (i.e., modal value) was $67,000 in FY 1986 and only $50,000 in FY 1995. The large difference between the modal value of all NASA university awards and the modal value of awards classified as net space research is accounted for by the several hundred training grants issued annually in NASA's graduate student fellowship programs.
-
The median size of all awards classified as net space research for purposes of this report was $68,000 in FY 1986 and $70,000 in FY 1995. This median reached a minimum during the intervening years. In comparison, the mean value of research grants awarded by the EPA was $116,000 per year,10
TABLE 4.4 Selected Statistics on NASA Awards to Colleges and Universities, FY 1986-1995
-
while the mean value of awards issued by the NSF in FY 1996 was $85,000 and the median was $52,000.11
-
The most frequent size (i.e., modal value) for awards classified as net space research declined significantly over the decade, falling from about $67,000 in FY 1986 to $50,000 in FY 1995 (in constant FY 1995 dollars).
-
The median size of OSS awards decreased by about $5,000 during the decade (see Figure 4.3).
-
The median size of OES awards remained constant at about $80,000 during the decade.
-
The median size of OLMSA awards increased significantly during the decade, from $69,000 in FY 1986 to $100,000 in FY 1995.
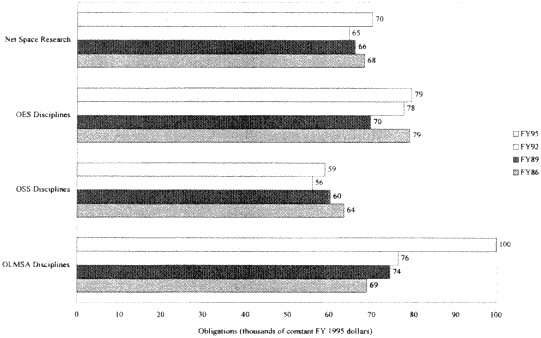
FIGURE 4.3 Median size of NASA awards for net space research and science program disciplines, FY 1986-1995.
4.5 CHARACTERISTICS OF GRANTS AT NASA FIELD CENTERS
There is a dearth of information about intramural research funding within NASA field centers or at JPL. NASA's accounting system is not structured to track the size of the in-house scientific staffs at NASA centers or the way in which these staffs are allocated between the functions of intramural research, science management, and other project or general management. Although there are procedures and policies for allowing NASA center scientists to participate in peer-reviewed NASA-funded science, there are no accompanying statistics indicating the extent (in terms of funding) to which these center scientists actually participate in the "research base."12
Data from the FY 1997 congressional budget justification books for NASA's three science program offices provide some information about budget allocations between the NASA centers and Headquarters. They do not indicate where the funds are actually being expended. Field centers do contract with universities and industry for some of their research.
Approximately 65 percent of OSS expenditures occur at the Goddard Space Flight Center and at JPL; approximately 85 percent of OES expenditures occur at Goddard Space Flight Center and at JPL,
and approximately 60 percent of OLMSA's expenditures are concentrated at Johnson Space Center, Kennedy Space Center, and Marshall Space Flight Center. The agency plans to implement a "full-cost" accounting system that should allow better estimates of intramural research costs and should aid in intramural versus extramural comparisons. Although JPL's status as an FFRDC precludes it from being treated identically with the NASA civil service centers, data concerning its in-house science programs could be collected and distributed like those of the field centers. In addition to JPL, several nonprofit institutions are involved in space research for which very few detailed data are reported. These include the Hubble Space Telescope Science Institute, the Smithsonian Astrophysics Observatory, and the Universities Space Research Association.


