
The Effects of Offsets, Outsourcing, and Foreign Competition on Output and Employment in the U.S. Aerospace Industry
Robert E. Scott
Economic Policy Institute
The debate over the employment effects of offsets is contentious because of the interplay of several closely related questions that can be quite difficult to disentangle. Overall employment has declined steeply in the U.S. aerospace industry since 1989 for a variety of reasons, including sharp reductions in public spending for defense goods and space exploration; rising imports of aircraft, engines, and components; and increasing productivity and structural changes in the defense and commercial aerospace industries, including numerous mergers and consolidations. Furthermore, industry representatives argue that, in the absence of offsets, foreign sales of commercial and defense aerospace equipment would decline or disappear, raising questions about the appropriate counterfactual exercise that should be used to analyze the effects of offsets and related issues on total industry employment.1
Barber and Scott (1995:2) examined a number of these issues and concluded that, in addition to the 500,000 jobs already lost in this industry since 1989, an additional 469,000 jobs in aerospace and related industries could be at risk by 2013 because of offset policies and increased foreign competition." In this report I update Barber and Scott (1995) and re-examine the evidence that increasing foreign competition will threaten a large number of jobs in this industry over the next one to two decades. I begin by reviewing trends in aerospace employment and then examine the principal causes of declining sectoral employment using a straightforward counterfactual exercise to assign changes in employment that
occurred between 1989 and 1996 to their proximate causes. In the next section I examine international competitive challenges and forecast the effects of offsets and other types of international competition on industry employment for the next two decades. The paper concludes with a discussion of policy alternatives for addressing the industry's problems.
Employment Trends
Overall Trends
Between 1989 and 1995 total employment in the aerospace industry declined by 545,000 workers, as shown in Table 1. In 1996 output and employment began to recover and they improved in 1997 (AIAA, 1997), and are forecast to increase for several more years (Aviation Week and Space Technology, 1997). The most important causes of the decline in employment were (1) declining defense budgets, (2) a worldwide recession in commercial aircraft demand, and (3) the effects of increased international competition. Between 1989 and 1995 overall aerospace employment declined by 40 percent. The decline in employment had very similar effects on production and non-production employment in the aerospace industry. The share of production workers in total industry employment fell only by 1.6 percentage points between 1989 and 1995, and the production worker share recovered strongly in 1997 (AIAA, 1997).
The global recession in aircraft demand caused employment to fall in all major aircraft-producing nations, as shown in Table 2. Total aerospace employment in the triad countries (the United States, Europe, and Japan) fell by more than 550,000 workers, according to the European Commission (EC).2 However, the losses were not evenly spread. Employment in the United States and the United Kingdom, as reported by the EC, fell by about 42 percent between 1989 and 1995, but declined only 20 percent in the rest of Europe, 13 percent in Canada, and was unchanged in Japan. The United States absorbed about 74 percent of the job losses during this period, although only 62 percent of total triad aerospace employment was located in the United States in 1989.
As a result of these differential impacts, the U.S. share of aerospace employment in the triad countries declined by about 6 percentage points between 1989 and 1995, as shown in Figure 1. The other members of the triad all gained employment share, relative to the United States (with the exception of the United Kingdom, as shown in Table 2). Data reviewed below suggest that one reason that employment levels remained higher in Europe was the growing share of Airbus Industrie in commercial aircraft markets.
|
2 |
The EC uses a narrower definition of the aerospace industry than does the Aerospace Industries Association of America, as shown in Table 2. |
TABLE 1 Aerospace Industry Employment, 1982-1997 (in hundreds of thousands)
|
Year |
Total Aerospace |
Total Aircraft |
Civil Aircraft |
Military Aircraft |
Missiles and Space |
Other Related |
Other Related Share of Total (%) |
|
1982 |
1,027 |
516 |
231 |
285 |
243 |
268 |
26.1 |
|
1983 |
1,027 |
484 |
174 |
310 |
259 |
284 |
27.7 |
|
1984 |
1,097 |
517 |
184 |
333 |
286 |
294 |
26.8 |
|
1985 |
1,206 |
588 |
210 |
378 |
294 |
324 |
26.9 |
|
1986 |
1,272 |
639 |
238 |
401 |
309 |
324 |
25.5 |
|
1987 |
1,300 |
653 |
257 |
396 |
316 |
331 |
25.5 |
|
1988 |
1,311 |
666 |
280 |
386 |
313 |
332 |
25.3 |
|
1989 |
1,331 |
702 |
326 |
376 |
306 |
323 |
24.3 |
|
1990 |
1,270 |
687 |
341 |
346 |
281 |
302 |
23.8 |
|
1991 |
1,180 |
660 |
345 |
315 |
251 |
269 |
22.8 |
|
1992 |
1,040 |
597 |
322 |
275 |
217 |
226 |
21.7 |
|
1993 |
907 |
523 |
275 |
248 |
176 |
207 |
22.8 |
|
1994 |
827 |
469 |
285 |
184 |
165 |
193 |
23.3 |
|
1995 |
786 |
423 |
256 |
177 |
172 |
181 |
23.0 |
|
1996a |
805 |
451 |
282 |
168 |
171 |
183 |
22.7 |
|
1997b |
826 |
469 |
304 |
165 |
172 |
185 |
22.4 |
|
a Preliminary. b Estimated. SOURCE: Economic Policy Institute analysis of AIAA (1996, 1997). |
|||||||
TABLE 2 Aerospace Employment in Europe, Canada, Japan, and the United States, 1974-1995
|
Year |
United Kingdom |
Other European Union |
Total European Union |
United Statesa |
Canada |
Japan |
Total |
|
1974 |
210,100 |
199,541 |
409,641 |
666,000 |
28,400 |
29,814 |
1,133,855 |
|
1979 |
196,566 |
227,071 |
423,637 |
775,000 |
37,700 |
31,666 |
1,268,003 |
|
1980 |
229,821 |
241,874 |
471,695 |
830,000 |
46,800 |
32,991 |
1,381,486 |
|
1984 |
203,202 |
262,318 |
465,520 |
817,000 |
44,041 |
34,200 |
1,360,761 |
|
1985 |
206,677 |
274,971 |
481,648 |
898,000 |
48,794 |
34,300 |
1,462,742 |
|
1989 |
189,911 |
295,829 |
485,740 |
992,000 |
66,106 |
38,300 |
1,582,146 |
|
1990 |
186,337 |
297,635 |
483,972 |
946,000 |
65,679 |
39,100 |
1,534,751 |
|
1994 |
119,353 |
240,954 |
360,307 |
616,000 |
54,031 |
38,100 |
1,068,438 |
|
1995 |
110,549 |
237,512 |
348,061 |
580,000 |
57,329 |
38,300 |
1,023,690 |
|
a Figures for U.S. employment include only companies in SICs 372. 376. 366. 381, and 382 and exclude other aerospace-related companies and their employees. SOURCE: European Commission (1994, 1997). |
|||||||
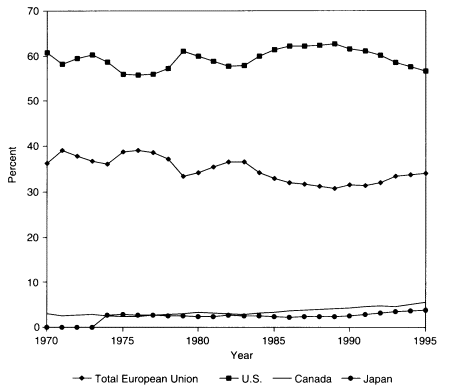
Figure 1
Shares of triad aerospace employment. Source: Economic Policy Institute analysis of data from European Commission (1997).
Causes of U.S. Aerospace Job Losses, 1989-1997
Industry revenues, measured in constant dollar terms, declined sharply in all the major sectors of demand in the early 1990s, as shown in Table 3. The sectoral changes were not evenly spread, as was the case with employment in Table 1. Total industry revenues fell 30 percent between 1990 and 1995 and increased 26 percent between 1995 and 1998. Civil aircraft sales fell by 32 percent in the first half of the 1990s, but are forecast to nearly double between 1995 and 1998. Missile sales declined much more rapidly than average and will remain flat through 1998. Space purchases (including research and development [R&D]) were essentially flat in the 1990s. Of the five major subsectors of the aerospace industry, shown in the last five columns of Table 3, civil aircraft sales were responsible for the greatest majority of the industry's $23 billion expected increase in real sales
TABLE 3 Aerospace Industry Revenues (constant 1987 dollars, in millions)
|
Year ($Millions) |
Total Aerospace ($Millions) |
Total Aircraft ($Millions) |
Civil Aircraft ($Millions) |
Military Aircrafta ($Millions) |
Missilesa ($Millions) |
Spacea ($Millions) |
Related Products and Services |
|
1979 |
71,528 |
41,546 |
20,830 |
20,717 |
7,524 |
10,307 |
12,150 |
|
1987 |
110,008 |
59,188 |
15,465 |
43,723 |
10,219 |
22,266 |
18,335 |
|
1988 |
112,426 |
59,751 |
18,664 |
41,086 |
10,079 |
23,859 |
18,738 |
|
1989 |
113,604 |
58,011 |
20,644 |
37,367 |
12,839 |
23,821 |
18,934 |
|
1990 |
121,606 |
64,573 |
28,382 |
36,281 |
12,833 |
23,933 |
20,268 |
|
1991 |
121,508 |
66,246 |
32,673 |
33,573 |
9,572 |
25,438 |
20,251 |
|
1992 |
117,251 |
62,525 |
33,754 |
28,772 |
9,947 |
25,238 |
19,542 |
|
1993 |
101,636 |
54,314 |
27,323 |
26,991 |
6,973 |
23,409 |
16,940 |
|
1994 |
89,160 |
46,490 |
20,642 |
25,848 |
6,099 |
21,710 |
14,860 |
|
1995 |
85,473 |
43,654 |
19,005 |
24,649 |
5,857 |
21,717 |
14,246 |
|
1996 |
91,364 |
46,987 |
21,074 |
25,913 |
6,309 |
22,841 |
15,227 |
|
1997b |
99,480 |
53,048 |
29,657 |
23,391 |
6,358 |
23,494 |
16,580 |
|
1998c |
108,121 |
59,540 |
36,754 |
22,785 |
6,003 |
24,559 |
18,020 |
|
Change in Constant Dollar Revenues (%) |
|||||||
|
1979-90 |
70 |
55 |
36 |
75 |
71 |
132 |
67 |
|
1990-95 |
-30 |
-32 |
-33 |
-32 |
-54 |
-9 |
-30 |
|
1995-98e |
26 |
36 |
93 |
-8 |
2 |
13 |
26 |
|
a Includes funding for research, development, testing, and evaluation. b Preliminary. c Estimated. SOURCE: Economic Policy Institute analysis of AIAA (1996, 1997). |
|||||||
TABLE 4 Relationship of U.S. Aerospace Revenues to Exports, Imports, and the Balance of Trade (billions of current dollars)
|
Year |
Total Aerospace Revenues ($) |
Total Aerospace Export Revenues ($) |
Exports as Percent of Total Aerospace |
Total Aerospace Import Revenues ($) |
Imports as Percent of Total Aerospace |
Aerospace Balance of Trade ($) |
|
1979 |
45.4 |
11.7 |
25.9 |
1.6 |
3.6 |
10.1 |
|
1989 |
120.5 |
32.1 |
26.6 |
10.0 |
8.3 |
22.1 |
|
1990 |
134.4 |
39.1 |
29.1 |
11.8 |
8.8 |
27.3 |
|
1991 |
139.2 |
43.8 |
31.4 |
13.0 |
9.3 |
30.8 |
|
1992 |
138.6 |
45.0 |
32.5 |
13.7 |
9.9 |
31.4 |
|
1993 |
123.2 |
39.4 |
32.0 |
12.2 |
9.9 |
27.2 |
|
1994 |
110.6 |
37.4 |
33.8 |
12.4 |
11.2 |
25.0 |
|
1995 |
106.3 |
33.1 |
31.1 |
11.5 |
10.8 |
21.6 |
|
1996a |
112.4 |
39.6 |
35.2 |
13.6 |
12.1 |
26.0 |
|
a Preliminary. SOURCE: Economic Policy Institute analysis of AIAA (1996, 1997). |
||||||
between 1995 and 1998. Increased sales of $3.8 billion in related products and services roughly offset losses in military sales in this period.
Imports have also been rising rapidly, as shown in Table 4. Between 1989 and 1997, imports increased by $8.1 billion in nominal terms. The import share of the domestic market increased by 5.7 percentage points. One way to assess the effects of trade on employment is to construct a counterfactual scenario in which trade remains constant as a share of domestic output. In this scenario, if demand were unchanged in 1997, then domestic sales and output could have been 5.7 percent higher than they actually were if the import share had remained unchanged at its 1989 level. This translates into about 49,500 jobs, out of the actual loss of 462,000 jobs between 1989 and 1997(see Table 1). Thus, increased imports directly account for about 11 percent of the decline in aerospace employment observed in this period.
Falling output also reduced employment, although a significant recovery had occurred by 1997, relative to the nadir reached in 1995. Total industry sales, in real terms, declined by 12.5 percent between 1989 and 1997 (Table 3). If output were unchanged in 1997, relative to 1989, then an additional 109,000 jobs would be been retained or created in this industry. Thus depressed demand for aerospace products explained about 24 percent of employment losses in this period. Declining demand in all sectors, especially in the military industries, was the most important cause of falling employment between 1989 and 1995 (as indicated in Table 3), but productivity and related factors played a more significant role after 1995.3
Productivity growth, broadly defined as output per worker, also eliminated significant amounts of aerospace employment in this period. The unexplained employment changes (those due to forces other than increased imports and demand changes) amounted to 292,000 jobs between 1989 and 1997, or two-thirds of all jobs lost in this period. However, this measure also includes the effects of changes in the capital/labor ratio, and interactions between productivity and the other factors discussed above (trade, demand, and capital intensity). In the absence of data on changes in capital inputs in this period it is impossible to estimate the effects on employment of total factor productivity growth, or pure technical change as it is usually measured by economists. Nonetheless, it appears that productivity growth does explain a substantial share of the job losses that did occur between 1989 and 1997.
In assessing the causes of declining employment, it is also important to note that trade also has indirect effects on employment that are not reflected in the
|
3 |
Editing of the proceedings for this volume permitted updating of the data reported in this chapter. The analysis in this section has been revised to reflect changes in trade and output through 1997, as a result. These revisions altered the details of the analysis, but did not affect the basic conclusions. In particular, the trend rate of growth in the ratio of imported engines and parts to aircraft sales, a key indicator in the analysis in this chapter, accelerated sharply in 1997, as shown in Figure 4, below. |
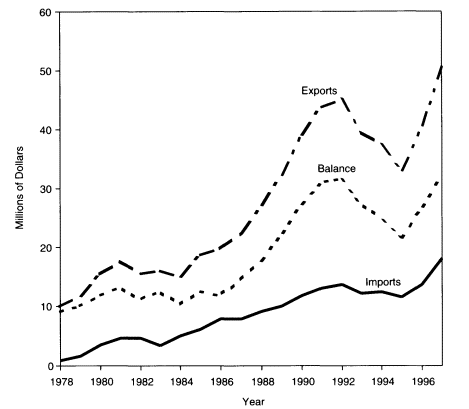
Figure 2
Aerospace exports, imports, and trade balance. Source: Economic Policy Institute analysis of AIAA (1996, 1997).
simple decomposition given above. For example, increased foreign competition may explain a significant portion of the observed productivity increase. In addition, the loss of foreign market shares also explains part of the decline in total sales. As shown below, Airbus, in particular, has sharply increased its share of foreign markets for commercial aircraft, which are some of the most important sources of demand for U.S. producers (Table 4).
The increasing international competition, and the global decline in aircraft demand, led to a sharp decline in the nominal value of U.S. exports between 1992 and 1995, as shown in Table 4 and Figure 2. Exports began to increase again in 1996, stimulated by the end of the commercial aircraft glut of the early 1990s and also by the introduction of Boeing's new 777 aircraft. The effects of the international business cycle were amplified by a technology cycle in which Airbus was
first to market with its new generation of long-haul aircraft (the A330 and A340 models, first delivered in 1993) and was therefore able to capture market share from the U.S.-based producers until the 777 was launched in 1995 (European Commission, 1997:20).
Despite these difficulties, export sales fell less sharply in the early 1990s than other types of aerospace sales (Table 4). Therefore, because their share of domestic production increased, the constant share model suggests that export markets helped sustain domestic production in this period. Exports increased from 29.1 percent of total revenues in 1990 to 38.8 percent in 1997, an increase of 9.7 percentage points. Without this increase in export sales, U.S. aerospace employment would have been reduced by a similar amount in 1996. In other words, if the export share of U.S. aerospace sales had remained constant at its 1989 level, then there would have been approximately 84,000 fewer jobs created.
The question that must be addressed is whether a constant export share is the appropriate counterfactual exercise. The United States controlled a substantial share of the world commercial aircraft industry in the 1980s, and in fact that share has fallen in the 1990s, as discussed below. It is the growth in overall world demand for commercial aircraft, in combination with the shrinkage of demand for other domestic aerospace products, that has caused the increase in the export share of U.S. aerospace sales. For these reasons it is incorrect to assume that these export sales, and the increase in the share of exports in total sales, would not have taken place in the 1990s unless imports had also increased, as suggested by some observers. The two trends are driven by different forces. Changes in imports and exports should be analyzed independently.
Future Threats to U.S. Aerospace Employment
Airbus and other potential new foreign competitors in the commercial aircraft industry are the most important direct threats to U.S. aerospace employment. This threat was realized and became increasingly important in the 1990s, as shown in Figure 3. The market share of Airbus and other European aircraft producers began to rise sharply, especially after 1992, in all significant markets. In the United States their share attained a peak of 30 percent in 1994 and has declined since. However, their share in the rest of the world (excluding the United States and Europe) increased by nearly 50 percent between 1994 and 1995, from 30 percent to nearly 45 percent. This reflects, in part, the technological cycle discussed above. However, it may also reflect (1) more aggressive sales promotions by European Union (EU) governments (for example, through more generous export financing), (2) more competitive pricing by Airbus, and (3) market-share gains through increased willingness to engage in offset transactions. In China, in particular, Airbus has increased its market share sharply and has also announced a number of joint and co-production arrangements with Chinese producers (see examples in Box 1).
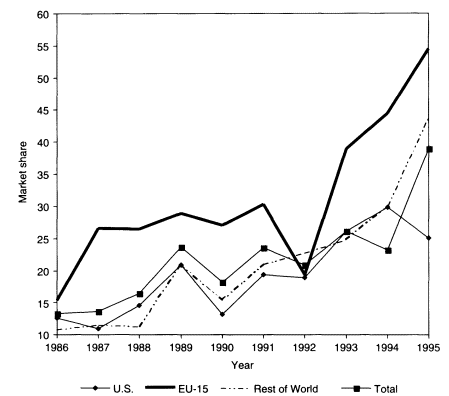
Figure 3
European Union shares of aircraft deliveries, by region of the world, 1986-1995.
Source: Economic Policy Institute analysis of European Commission (1997).
Airbus and the other European aircraft manufacturers have also maintained a larger share in their home market throughout the period shown in Figure 3. They became the dominant suppliers in Europe in the 1990s. In 1995 European firms captured 55 percent of their home market (measured in value terms), while controlling approximately one-third of the total world market for commercial aircraft sales. In 1995, 22 percent of European commercial aircraft sales were in their home market (European Commission, 1997:32). Boeing is also heavily dependent on exports. It now ''exports 70% of its commercial jets," a fraction that has been increasing in recent years (Waldmann, 1997:6). The relatively large market share of Airbus and other European aircraft producers in the EU suggests that European airlines (public, private, and mixed) may be skewing sales to European firms for non-market reasons. Although such preferences may violate the spirit or letter of the 1979 General Agreement on Tariffs and Trade (GATT) aircraft agreement (signed by the United States and the countries of the EU) or the 1992 civil
|
BOX 1 Offsets and Outsourcing in China
Source: Seattle Times (1996). |
aircraft accord, they have not yet been the subject of formal complaints or action by U.S. producers or government agencies such as countervailing duties or Section 301 actions.
The trends illustrated in Figure 3 are reflected in Table 5, which reports U.S. aerospace exports, by region, between 1991 and 1995. Exports to the eight largest European countries fell 40 percent, the largest decline of any region. This reflects the particularly strong performance of European firms in their own market in the 1990s. U.S. exports to Japan and Asia were essentially flat, although they did decline somewhat from 1992. Exports to the rest of the world declined by 25 percent in this period, also reflecting the effects of increased competitiveness of Airbus, vis-à-vis Boeing and McDonnell Douglas, although it is not clear whether this reflects market forces or unfair competition.
In the context of the offsets debate, in which China is often cited as one of the most aggressive and egregious violators of international norms, and also one of the most important and rapidly growing markets for aircraft, it is significant to note that total U.S. aerospace exports to China were quite small, representing between 3.5 and 7.5 percent of total U.S. exports in this period. The small volume of U.S. exports to China suggests that the benefits of offsets, in terms of increased sales, may be quite limited. However, the costs in terms of lost jobs and diffusion of critical technologies could be quite significant. Ultimately, foreign aerospace
TABLE 5 U.S. Aerospace Exports, by Region (millions of dollars)
|
Year |
EU-8 |
Japan |
China |
Rest of World |
Total Exports |
|
1991 |
17,647 |
3,910 |
1,244 |
12,747 |
35,548 |
|
1992 |
14,801 |
4,505 |
2,247 |
15,353 |
36,906 |
|
1993 |
11,802 |
3,581 |
2,384 |
14,056 |
31,823 |
|
1994 |
11,821 |
4,099 |
2,047 |
12,083 |
30,050 |
|
1995 |
10,620 |
3,587 |
1,250 |
9,622 |
25,079 |
|
SOURCE: Economic Policy Institute analysis of AIAA (1996). |
|||||
firms may play a key role in helping China, or a coalition of Asian aerospace firms, become a new entrant in the aircraft industry as a full-fledged designer and integrator of commercial jets, with potentially devastating consequences for both Airbus and Boeing.
Offsets as Threat to Future U.S. Aerospace Employment
Imports represent a growing share of domestic output, as noted above in the discussion of Table 4 on U.S. aerospace sales and trade. Imports have two distinct effects on output. First, an increase in the sales of finished aircraft of foreign origin reduces the level of domestic sales. In this sense, imports directly represent an opportunity cost in terms of lost sales and employment possibilities.
The second channel through which imports can affect domestic employment is when the use of foreign parts and components increases as a share of value added. In effect, the "foreign content" of domestic sales is thereby increased, and a given volume of final sales will not support the same number of domestic jobs. This is equivalent to a reduction in the amount of labor that is required to produce a given amount of output.4 Offset agreements, both voluntary and mandatory,
|
4 |
If input-output relationships are used to model the effects of trade and output on domestic employment. then an increase in the share of imported components in final sales should be reflected in a reduction in the direct and indirect labor requirements per dollar of value added. Note, however, that tables 2 through 4 report industry sales. This reporting procedure necessarily results in double counting of some elements of value added. For example, aircraft parts sold to final integrators are also included in the value of the aircraft finally delivered to domestic or foreign customers. It would be highly preferable if industry were to report domestic value added, rather than total sales. |
|
5 |
The exception to this rule would occur at later stages in the product life cycle when a foreign competitor begins to assemble finished aircraft. In this case, the aircraft assembled abroad would reduce domestic employment by either (1) reducing foreign (export) sales of the domestic firm and/or (2) increasing imports of finished aircraft. McDonnell Douglas has already reached both stages in its |
will generally have the largest effect on parts and components imports.5 It is therefore important to distinguish imports of components and complete aircraft when analyzing the effects of trade on employment.
In the 1990s, imported parts and components (including engines and engine parts) were, on average, 71 percent of total aerospace imports.6 Figure 4 shows that U.S. engines and parts imports represent a growing share of total aircraft sales.7 This share rises from about 8 percent in 1981 to over 19 percent in 1997. Between 1984 and 1997, this share increased by about 0.7 percentage points per year. As a first approximation, the increase in parts imports reflects the direct effects of offsets and all other forms of co-production and international outsourcing agreements. This measure is separate from the effects of increasing international competition in final aircraft sales, as reflected in increased imports of complete aircraft and reduced exports. This distinction will be important in predicting future jobs at risk.
Before turning to the analysis of future employment threats, we need to examine trends in some of the major components of aircraft employment. Figure 5 reports total employment in airframes (final assembly and integration), engines and parts, and other parts and equipment. Several trends stand out in these data. First, the bulk of employment in this industry is still in the airframe sector, composed primarily of the major defense and commercial aircraft integrators. Second, there appears to be a secular declining trend in employment in airframes, engines, and parts. As a location for production, the United States is internationally the least competitive in the engine sector. The United States has had roughly balanced trade (exports equaling imports) in this sector in recent years and has periodically experienced overall deficits in engine trade. This is remarkable, in part, because two of the three major engine producers are based in the United States (Almeida, 1997).
|
|
co-production arrangement involving Chinese assembly and co-production of its MD-82 and MD-90 aircraft. At least one of these aircraft has also been exported back to the United States. When final aircraft assembly is transferred abroad, parts exports will increase even while total industry employment and value added would decline, relative to what they would have been if those aircraft had been assembled in the United States. In this case, it is inappropriate to treat parts and component exports as net-job creators. Identification of appropriate counterfactual analysis in such cases will require detailed knowledge of offset sales contracts and whether or not such sales would have taken place in the absence of voluntary or mandatory offset agreements. |
|
6 |
There was no significant trend in the level of parts imports as a share of total aerospace imports in this period. This is somewhat surprising because of the decline in military production (which involves high levels of mandatory exports) and the relative increase in commercial aircraft markets noted above. Thus, the level trend in this share suggests that commercial sales may have involved increasing offsets in this period. |
|
7 |
Note that Figure 4 uses a different basis (total aircraft shipments) from the analogous exhibit in our prior research (Barber and Scott, 1995: Figure 8, p. 27). This change was made to improve the accuracy of our forecasts, as explained in the next section. |
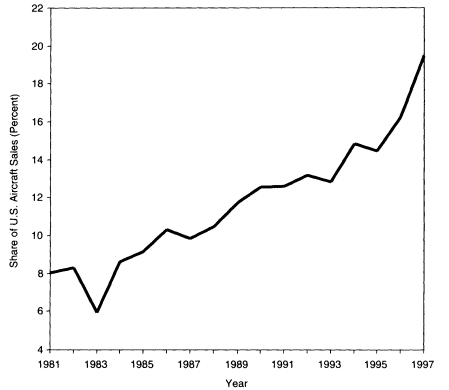
Figure 4
U.S. engines and parts imports as a growing share of total aircraft sales.
Source: Economic Policy Institute analysis of AIAA (1996, 1997).
Third, there is some evidence of a stable or increasing trend in employment in the U.S. aircraft parts industry. This is illustrated in Figure 6, which compares employment in parts with employment in the much larger airframe sector. This comparison also reveals that employment in parts is somewhat more volatile than in the airframe sector. There are several possible explanations for these trends that are consistent with the evidence on rising parts imports shown in Figure 4. First, as the technological complexity of aircraft has increased it is likely that the number and value of components (electronics, for example) has also increased, as a share of value added. Second, modularization of component production has eliminated final assembly labor in a wide range of industries, from motor vehicles to electronics, so it is not surprising to observe evidence of that trend here. Finally, products counted as parts may substitute for production that used to take place within the plants of airframe manufacturers. Several examples of this are given in Box 1 that involve Chinese offsets and outsourcing, including doors,
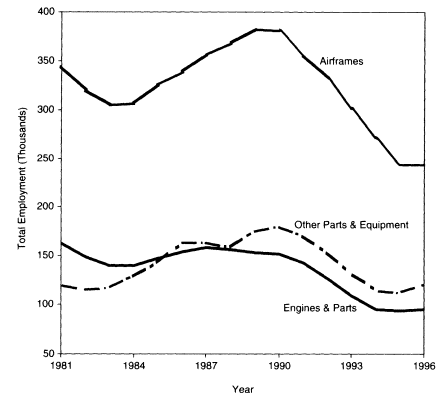
Figure 5
Long-run decline in employment in aircraft production. Source: Economic Policy Institute analysis of Bureau of Labor Statistics (1997) and AIAA (1996, 1997).
fins, stabilizers, and body parts for various types of commercial aircraft. As a consequence of each of these trends, employment in airframe manufacturing appears to be declining, relative to both domestic and foreign parts production. Thus, domestic workers in the airframe industry are correct to blame both outsourcing and imports for job loss in their industry.
The higher level of variability in parts employment suggests that employment in parts production is more heavily affected by the business cycle than is employment in the airframe sector. The secondary or sub-tier supplier base therefore appears to absorb a disproportionate share of the job losses that occur during downturns, once we control for the long-run shift of employment out of engines and airframes, as discussed above.
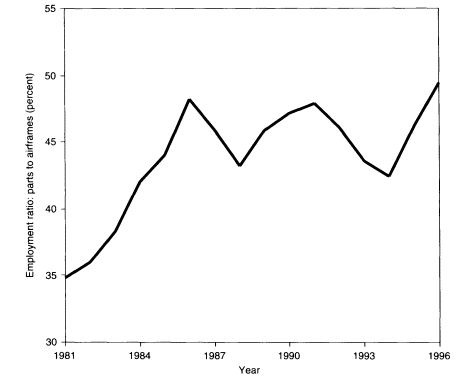
Figure 6
Employment in aircraft parts versus airframes. Source: Economic Policy Institute analysis of Bureau of Labor Statistics (1997) and AIAA (1996, 1997).
Jobs at Risk in the Future
In this section, employment effects of growing foreign competition, and also foreign outsourcing and other practices that encourage U.S. firms to shift component and parts production abroad, are briefly re-examined. As noted by several other contributors to this volume and other participants in the National Research Council conference (Wessner and Wolff, 1997), offsets are an important threat to domestic production in both military and commercial aircraft production. These problems are particularly important in the case of trade with large, non-market economies because of the role of and bargaining power exercised by government officials as the ultimate arbiters of all major import purchasing decisions. Some examples of current offset and co-production practices are illustrated in Box 1.
Boeing officials have acknowledged that their company does enter into voluntary offsets "as a means of gaining market access" (Waldmann, 1997:6). Other analysts concluded that, although the issue of offsets is "not even on the radar screen" at the present time, offsets will increase and become a "major factor over the next decade or two" (Bozdogan 1997:27). These views are confirmed by closely examining the trends discussion above and their implications for future employment in the U.S. aerospace industry.
International competition threatens U.S. production in at least two distinct ways. First, the market share of U.S. producers of commercial aircraft could decline in the future as a result of market-share gains by Airbus Industrie and/or other potential new entrants to this market.8 This will impact U.S. employment primarily by reducing U.S. exports because the majority of commercial aircraft produced in the United States are now sold in export markets, as noted above.
The second threat to domestic employment is through increases in the foreign content of domestically produced aircraft as a result of increases in offsets and other forms of international component outsourcing. Ultimately, such outsourcing could help create new competitors to U.S. producers and hence exacerbate the first type of international competition. However, such secondary effects are ignored here and only the effects of increases in the foreign content of domestically produced aircraft on U.S. aerospace employment are considered.
The foundations for my estimate of the number of jobs at risk in the future because offsets increase foreign competition are (1) the 1994 DRI/McGraw-Hill study of the U.S. manufacturer market share, as reported in Barber and Scott (1995:43-45) and (2) Boeing's estimates of the future world market for commercial aircraft. These estimates are used to forecast the future effects of increased foreign competition on total (constant dollar) sales of U.S. aerospace products.
The potential job losses that could result from offsets and other types of foreign outsourcing are estimated by extrapolating the current trend in the rate of growth of aircraft engines and parts (see Figure 4) as a share of the value of total domestic aircraft sales (military and commercial). I assume that real output remains constant at the level that prevailed in 1994 and that the trend in the rate of growth in the imported parts share continues through 2013.9
A recently released (Department of Labor, 1996) input-output-based employment requirements table is used to estimate the direct and indirect employment effects of trade for both types of employment threats. These procedures are similar to those used in Barber and Scott. However, they differ in two respects. First, use of the new input-output table provides industry-specific employment
TABLE 6 Potential Job Losses Attributable to Increased Foreign Content of Aircraft Made in the United States and Total Jobs at Risk Due to Foreign Competition, 1994-2013
|
|
Revenue ($ billions) |
Total Job Losses |
|||
|
Period |
Peak Annual Lost Revenue |
Cumulative Lost Revenue |
Total Jobs |
Direct Jobs |
Indirect Jobs |
|
1994-1998 |
1.6 |
4.0 |
17,863 |
10,219 |
7,644 |
|
1999-2003 |
3.5 |
17.8 |
39,498 |
22,596 |
16,902 |
|
2004-2008 |
5.4 |
41.1 |
60,386 |
34,546 |
25,840 |
|
2009-2013 |
7.2 |
73.5 |
80,553 |
46,083 |
34,470 |
|
Projected Losses Due to Declining U.S. Market Share |
|||||
|
|
Average Annual Lost Revenue |
|
|
|
|
|
1994-1998 |
2.1 |
10.7 |
23,933 |
13,692 |
10,241 |
|
1999-2003 |
4.2 |
31.8 |
47,194 |
26,999 |
20,195 |
|
2004-2008 |
7.3 |
68.4 |
81,863 |
46,833 |
35,031 |
|
2009-2013 |
12.0 |
128.6 |
134,650 |
77,031 |
57,619 |
|
Total Jobs at Risk Due to Increased Foreign Competition |
|||||
|
1994-1998 |
3.7 |
14.7 |
41,796 |
23,911 |
17,885 |
|
1999-2003 |
7.8 |
49.6 |
86,692 |
49,595 |
37,097 |
|
2004-2008 |
12.7 |
109.5 |
142,249 |
81,378 |
60,871 |
|
2009-2013 |
19.2 |
202.1 |
215,202 |
123,114 |
92,089 |
|
SOURCE: Economic Policy Institute analysis of DRI/McGraw-Hill (1994:9-1 1) and Boeing Company (1994: Appendix C). |
|||||
multipliers that are much more accurate (and significantly smaller) than those used in the prior study. Second, the share of imported parts and components in aircraft sales is used to estimate the effects of outsourcing. This is a much more precise and appropriate base than the one used in our previous research (trends in total imports as a share of total aerospace sales).
The resulting projections of output and job losses are shown in Table 6. The first panel in the table reports the effects of increased foreign outsourcing, assuming that the trend of increasing foreign content of the past decade continues into the future. The first column of results shows the annual loss in output, relative to
the base year of 1994 in constant dollars.10 Employment losses are calculated, using the multipliers described above, at the end point of each period. Cumulative losses in output are shown for informational purposes only and are not directly used to calculate employment effects. The employment losses shown are the permanent losses of job opportunities, based on the given annual reductions in domestic output. More than half of all jobs resulting from a given amount of expenditure on aircraft are located in the aircraft and parts industries (direct jobs). Within ten years (by 2003) of the base year, 22,596 aerospace jobs will have been eliminated by outsourcing, plus an additional 16,902 indirect jobs in industries that provide inputs to the aerospace industry, for a total loss of 39,498 jobs. Within two decades, offsets and other forms of foreign outsourcing could eliminate 46,083 aerospace jobs and 34,470 jobs in other industries for a total loss of 60,553 jobs. The direct jobs lost in 2013 would equal 9.6 percent of total aircraft employment in 1994.11
This estimate of job loss may be too small for several reasons. First, Bozdogan (1997) and others appear to suggest that the growth of offset activity could accelerate in the future. Second, these estimates do not include any "indirect offsets" in other aerospace or non-aerospace sectors. However, recent reports from the U.S. Department of Commerce (Department of Commerce, BXA, 1996) suggest that indirect offsets are increasing as a share of total offsets, at least in the military sector. Finally, the base of production in 1994 is quite low because the recovery in aircraft production had not yet occurred (see Table 3). If a later base year were assumed, or if we assume that the trend rate of growth in output is positive, then job losses as a result of outsourcing will increase. On the other hand, some suggest that the level of outsourcing is constant or leveling off (Waldmann, 1997). If so, then the outsourcing estimates in Table 6 may be too high.
The threat of reductions in the U.S. share of the world commercial aircraft market could have an even larger effect on employment than outsourcing in the next two decades, as shown in the second panel of Table 6. In this case the U.S.
share of the world market for commercial aircraft, which has been declining since at least 1970, could fall from approximately 80 percent in 1990 to 50 percent in 2003 and 35 percent in 2013, using the assumptions made by Barber and Scott (1995: Figure 11, p. 44). The new multipliers described above are used to estimate the employment effects of the output losses implied by these forecasts. By 2003, 26,999 direct jobs and 20,195 indirect jobs could be lost, for a total of 47,194 jobs lost in aerospace and related industries. Within two decades, 77,031 direct jobs and a total of 134,650 direct and indirect jobs could be lost because of declining U.S. shares of the world market.
The effects of outsourcing and potential losses of international market share are combined in the last panel of Table 6. By 2003, 49,595 direct and a total of 86,692 direct and indirect jobs could be lost in aerospace and related industries. By 2013, these totals increase to 123,114 direct and 215,202 total jobs lost. The direct jobs lost in 2013 would represent 25.6 percent of the total jobs in aircraft production in 1995. Although foreign competition will not eliminate the U.S. aerospace industry in the next two decades, it could greatly undermine employment in this critical high-skill, high-wage industry that, for at least four decades, has been one of America's leading export sectors.
These estimates of jobs at risk hold domestic output and labor requirements constant at levels prevailing in the mid-1990s. Other factors could increase or decrease actual employment in the aerospace industry. Given these assumptions, productivity growth would also reduce employment in the industry. On the other hand, if aircraft and parts exports continue to grow, they would put upward pressure on employment.12
This paper does not forecast the impact of changes in overall demand, or of productivity growth. However, it is likely that overall U.S. aerospace employment will follow a declining trend in the future. Both productivity growth and increased foreign competition will put substantial downward pressure on employment. Despite the strong upsurge in aerospace exports and revenues between 1995 and 1997, based on data in Table 3, aircraft sales and industry revenues remained 18 and 22% below their previous cyclical peaks (in constant 1987 dollars) in the early 1990s. The sharp increase in EU market shares between 1992 and 1995 (Figure 3) and the continued improvement in Airbus shares of aircraft sales in 1997, suggest that the U.S. share of the commercial aircraft market may be declining more rapidly than was assumed in Table 6. The surplus in aircraft parts, reflects, in part, aftermarket sales of the existing base of aircraft, which is dominated by U.S.-made planes. Rapid growth in the global stock of Airbus aircraft, and the retirement of older U.S.-made models, will begin to erode this surplus within the next five to ten years.
For these reasons, U.S. aerospace employment is likely to decline in the future. Offsets, outsourcing, increased foreign competition and productivity growth will all contribute to these declines. While it is not possible to say which of these factors will be most important, they are all related to the decline of the U.S. as a competitive location for aerospace production, and the falling market shares of U.S.-based aircraft integrators. Expected future job losses in the aerospace industry can only be avoided or reduced through sharp improvements in the competitiveness of the U.S., and of aerospace firms based in this country.
Conclusions and Policy Alternatives
Other countries are actively targeting the commercial aircraft industry. The Chinese and other Asian governments are using trade and industrial policies to capture production and technologies from the United States. Many of these systems were developed with public support. The U.S. aerospace industry stands at the edge of a precipice. If the challenges it faces are not addressed, at least 215,000 additional jobs in aerospace and related industries will be eliminated over the next two decades.
In Barber and Scott (1995) we develop a broad range of policy recommendations that are needed to restore and maintain the international competitiveness of the U.S. aerospace industry. These include:
- creation of an aerospace executive and an interagency task force within the National Economic Council;
- promotion of aerospace production and employment through reform of government regulatory processes, including those that encourage firms to engage in offsets, and new programs to stimulate domestic demand for aerospace research and products; and
- negotiating fair international trade agreements, including new initiatives to bring China into compliance with the GATT codes and their own Memos of Understanding and other agreements with the United States.
These policies, taken as a whole, could constitute the initiation of a coordinated industrial policy for the aerospace sector. The United States is unique among developed and many of the larger developing nations in its refusal to develop and implement conscious and coherent industrial policies for the aerospace industry. The United States clearly has industrial policies for this sector, but they are uncoordinated, incoherent, and frequently internally contradictory.
Discussion and debate over the past two years, as reflected in the National Research Council conference (Wessner and Wolff, 1997) and in other papers in this volume, clearly suggest that a new national system for monitoring commercial offsets is urgently needed. This system should encompass both mandatory and voluntary offsets.
Additional measures are also needed to address the causes of offset and
outsourcing problems. Defense demand has apparently stabilized, and the industry has begun to recover from a global aircraft glut, but the recovery has had only a small positive effect on industry employment. Foreign competition is now the most important future threat to domestic aircraft demand, as shown above. Rising imports of engines, parts, and components, in particular, are the result of offset deals that Boeing and McDonnell Douglas have made with foreign governments to trade aircraft sales for production and technology transfer. Offsets are the result of a prisoners' dilemma problem. In China, for example, there is effectively only one major buyer in this rapidly growing market (the government), and all three major assemblers are competing for sales by offering offsets. These companies are giving away more technology and production than would be warranted if the market were competitively structured.
Controlling Offsets
U.S. trade problems could be greatly improved through further agreements with the EU. The United States should open negotiations to revise the 1992 Aircraft Agreement with the EU, which technically expired in 1994 when it was excluded from the Uruguay Round Trade Agreements. In addition to reopening the subsidies provisions (which U.S. manufacturers feel are far too weak), there is an opportunity to fix the prisoners' dilemma problem from the supplier's side by prohibiting the export of jobs and technologies in exchange for sales. The EU may also be motivated to participate in such talks because of unresolved concerns about the merger of Boeing and McDonnell Douglas. U.S. firms have opposed a unilateral limit on offsets because they believe it would result in lost sales to Airbus. A new U.S.-EU agreement could benefit both Boeing and Airbus by restoring a competitive balance to this industry.
One precedent for government regulation of unfair sales practices is the Foreign Corrupt Practices Act (FCPA) of 1977, which was adopted after the discovery of a $12 million bribe paid in a sale of Lockheed L-1011 aircraft. Despite harsh penalties (both fines and imprisonment), the temptation to cheat may still be irresistible. It was recently reported that General Dynamics paid a $100 million bribe for a Korean military aircraft sale. One problem with the FCPA is that it was imposed unilaterally, and only on U.S. firms. The FCPA approach can serve as a model, but it must be modified to solve the aerospace trade problem.
The solution to the prisoners' dilemma is to impose a new marketing limit (no offsets in exchange for sales) multilaterally. The United States and the EU should adopt essentially identical measures proscribing such behavior by firms based in each region. This agreement would reduce the trade and jobs-distorting use of offsets worldwide. This measure should be acceptable to both U.S. and European aircraft manufacturers, because all would experience higher levels of future sales and production than they would without the agreement.
Defining the National Interest
Clearly, the United States has a national interest in aircraft sales and the movement of production and technologies abroad, which is different from that of the aircraft companies. Boeing and McDonnell Douglas may be content to become ''virtual companies," designing planes but outsourcing most or all of their production. Stockholders' interests may be protected by collecting royalties on technologies developed with public support in the United States. However, U.S. workers and suppliers will clearly suffer.
Decisions about key aerospace technologies should be designed to protect the national interest in jobs and exports as well as corporate profits. All three can benefit from prompt, effective government action if the United States does not wait too long. If it does, aircraft production could go the way of color TVs and DRAMs (dynamic random access memories), and with it, the U.S. trade balance and future standard of living. If the United States acts quickly, it can retain and rebuild a strong aerospace industry for the twenty-first century and the high-wage, high-skills jobs that go with it.
References
AIAA (Aerospace Industries Association of America, Inc.) 1996 and earlier editions. Aerospace Facts and Figures. Washington, D.C.: AIAA.
AIAA (Aerospace Industries Association of America). 1997. 1996 Year-end Review and Forecast UPDATE. Washington, D.C.: AIAA.
Almeida, B. 1997. Are Good Jobs Flying Away? U.S. Aircraft Engine Manufacturing and Sustainable Prosperity. Unpublished manuscript. Center for Industrial Competitiveness, Lowell, Mass.
Aviation Week and Space Technology. 1997. "Robust 1996 sales for Boeing, Airbus," January 13, 146(2):371.
Barber, R., and R.E. Scott 1995. Jobs on the Wing: Trading Away the Future of the U.S. Aerospace Industry. Washington, D.C.: Economic Policy Institute.
Boeing Company. 1994. Commercial Market Outlook, 1994. Seattle, Wash.: Boeing Company.
Bozdogan, K. 1997. Is anyone there? Monitoring U.S. strategic interests. In C.W. Wessner and A.M. Wolff, eds, Policy Issues in Aerospace Offsets : Report of a Workshop. Washington, D.C.: National Academy Press.
Bureau of Labor Statistics. 1996. Employment Outlook: 1994-2005 Macroeconomic Data, Demand Time Series and Input Output Tables. Office of Employment Projections. Washington, D.C.: U.S. Department of Labor.
Department of Commerce, Bureau of Export Administration. 1996. Offsets in Defense Trade. May, U.S. Government Printing Office.
DRI/McGraw-Hill and the Teal Group. 1994. High-Skill. High-Wage Production Jobs in the U.S. Aviation Industry. Lexington, MA: DRI/McGraw-Hill.
European Commission. 1994 and 1997. The European Aerospace Industry : Trading Position and Figures. Brussels, Belgium: European Commission, Directorate-General III.
Johnson, J. 1997. Maintaining high value-added exports amidst structural change. In C.W. Wessner and A.M. Wolff, eds., Policy Issues in Aerospace Offsets: Report of a Workshop. Washington, D.C.: National Academy Press.
Seattle Times. 1996. How Boeing Woos Beijing. Stanley Holmes, May 26, p. Al.
Waldmann, R. 1997. Strategies for success in the commercial aircraft market. In C.W. Wessner and A.M. Wolff, eds., Policy Issues in Aerospace Offsets: Report of a Workshop. Washington, D.C.: National Academy Press.
Wessner, C.W., and A.M. Wolff, eds. 1997. Policy Issues in Aerospace Offsets: Report of a Workshop. Washington, D.C.: National Academy Press.


