
9
Findings, Conclusions, and Recommendations
This chapter presents the results obtained from the priority assessment system described in the preceding chapters. Potential health benefits and potential vaccine expenditures have been calculated for each of the 29 vaccine projects.* The committee suggests that the potential global health benefit of a vaccine takes precedence in determining its initial ranking for accelerated development priority. The “affordability” of benefits, represented by the potential expenditures on vaccines, can be entered into the decision process, if desired, and the techniques for doing so are illustrated with the central analysis. The first rankings presented reflect assumptions made in the central analysis, presented in Chapters 1 through 7 and reiterated below. To illustrate the use of other assumptions (all considered plausible by the committee), several sets of sensitivity analyses have been performed. These examine the effects on the rankings of various discount rates and of alternative assumptions about the probability of successful development. The effect on the rankings of adopting alternative assumptions on the disease burden derivations is also examined for selected vaccines. The effect of adopting perspectives on the undesirability of morbidity and death different from the median set of values used in the central analysis is discussed. In addition, approaches for incorporating differential utilization into the rankings are explained.
The rankings discussed below should be used as a guide to the selection of development priorities after consideration of the assumptions and issues outlined in Chapters 3 and 8. The committee believes that one of the major strengths of this analysis is that it encourages examination of all judgments and assumptions involved in the decision process. New data should be incorporated as they become available.
This model was developed to assist the National Institute of Allergy and Infectious Diseases (NIAID) and the U.S. Agency for International Development (AID) in their decision making. The priorities identified by this model are not appropriate for all circumstances, but it is hoped that the model or some modification of it may be useful to other groups, both in the United States and elsewhere, that are faced with similar resource allocation problems.
The Central Analysis
The central analysis described below incorporates the following:
vaccine and development characteristics described in Chapter 5, including predictions on the target population, efficacy, and vaccine cost
-
estimates of the burden of each disease, derived as described in Appendixes B, C, and D-1 through D-19
-
the assumption that utilization rates would not differ among vaccine candidates (because delivery of vaccines would probably be through the World Health Organization Expanded Program on Immunization [WHO-EPI])
-
estimates of the number of new entrants to the respective target populations, as described in Appendixes D-1 through D-19 and summarized in Chapter 7, Table 7.1
-
times to licensure and adoption, delay of vaccination benefits presented in Chapter 7, Table 7.2
calculations of each vaccine candidate’s potential health benefits and associated expenditures as described in Chapters 4 and 7
-
a 5 percent discount rate for future health benefits and costs
-
a perspective, for illustrative purposes only, on the undesirability of various morbidity conditions and mortality, derived from the median values of responses from a range of health professionals in developing countries
-
independent consideration of each disease and the development of each vaccine candidate (for each target population)
-
expression of health benefits in units considered equivalent in undesirability to the death of an infant (i.e., infant mortality equivalents, see Chapter 4)
FINDINGS
The results of the central analysis (Chapter 7) are shown in Tables 9.1 and 9.2.
The range of potential benefits from the various vaccine candidates, viewed as present-day investment options, is considerable,
spanning over two orders of magnitude, as does the range of potential expenditures.*
The expenditures listed in Tables 9.1 and 9.2 do not represent the net costs of using a vaccine (which may be a cost saving if averted treatment costs outweigh development and vaccination program costs). Hence, they cannot be used in formal cost-benefit or cost-effectiveness analyses. However, they can be used to illustrate how priority rankings may differ if financial resources (mostly needed in the countries of use) become a concern.
The ranking based on health benefits in Table 9.2 would be the initial priority assignment if resource constraints were not a concern. As financial constraints become a concern, the potential health benefit values can be adjusted to reflect the expenditures that might be considered feasible to gain a unit of benefit—in this analysis an infant mortality equivalence unit (IME). At each level of “willingness to pay,” this adjustment represents the health benefit (IME units prevented) that could be obtained by spending an amount of money equivalent to the expenditures on a particular vaccine in a different manner, for example, on another vaccine. This is termed the net opportunity cost of resources. Specifically,
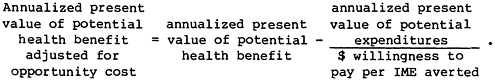
Table 9.3 shows, for the various vaccine candidates, the annualized present values of potential health benefits adjusted for opportunity costs at various levels of willingness to pay per IME averted. Positive values reflect the relative size of benefits for vaccines that are “affordable” at that level of willingness to pay. Negative values apply to vaccines that are not affordable at that level of willingness to pay, that is, the cost of obtaining a unit of health benefit with that particular vaccine exceeds the resources or willingness to pay. It must be emphasized that the values in Table 9.3 reflect the use of expenditures as a measure of affordability rather than net costs, as discussed above. Expenditures on some vaccines may return net cost savings.
Rankings developed from these adjusted values reflect, for each level of willingness to pay, both the size of the potential benefit and its affordability. Table 9.4 shows the rankings of vaccine candidates at various levels of willingness to pay.
If desired, expenditures on vaccine development and use may be incorporated into the ranking process as a decision criterion
|
* |
Expenditures represent vaccine development cost and vaccine cost (but not delivery, which is assumed uniform) for the vaccination program (see Chapter 4). |
TABLE 9.1 Health Benefits and Expenditures Associated with Various Vaccine Candidates: Central Analysis
|
Pathogen (Target Population) |
Vaccine Envisaged |
Annualized Present Value of Potential Health Benefits (IME Units) |
Annualized Present Value of Expenditures on Vaccines Necessary to Achieve Potential Health Benefits ($ millions) |
|
Dengue virus (Infants and children in endemic areas; travelers to endemic areas) |
Attenuated live vector virus containing gene for broadly cross-reacting protective antigen |
9,558 |
242 |
|
Escherichia coli (enterotoxigenic) (Infants < 6 months) |
A combination of purified colonization factor antigens and possibly other antigens |
126,454 |
722 |
|
Genetically engineered attenuated strains |
145,260 |
69 |
|
|
Hemophilus influenzae type b (Infants) |
Conjugated polysaccharide |
210,943 |
527 |
|
Hepatitis A virus (Susceptibles of all ages; routine for preschool children) |
Attenuated live virus |
15,112 |
1,058 |
|
Polypeptide recombinant vaccine produced in yeast |
14,392 |
4,029 |
|
|
Hepatitis B virus (Areas with high perinatal infection: all infants at birth (if possible). Other areas: all infants, simultaneous with other vaccinations) |
Polypeptide produced by recombinant DNA technology |
213,192 |
8,859 |
|
Japanese encephalitis virus (Children in epidemic and and endemic areas; foreign visitors to epidemic regions) |
Inactivated virus produced in cell culture |
3,232 |
614 |
|
Mycobacterium leprae (Immuno-prophylactic: all children in endemic areas. Immuno-therapeutic: all recently infected individuals) |
Armadillo-derived M. leprae |
88,481 |
271 |
|
Neisseria meningitidis (Infants, 3–6 months) |
Conjugated capsular polysaccharides, groups A,C,Y, and W135 |
13,754 |
708 |
|
Parainfluenza viruses (Infants) |
Trivalent, subunit vaccine (which must contain fusion proteins) |
43,692 |
1,697 |
|
Plasmodium spp. (All infants at risk, military personnel, travelers) |
Plasmodium falciparum, synthetic or recombinant sporozoite antigen preparation |
475,205 |
967 |
|
Multivalent synthetic or recombinant sporozoite antigen preparation (P. falciparum, P. vivax, P. ovale, P. malariae) |
426,640 |
857 |
|
|
Rabies virus (Individuals at high risk, plus post-exposure prophylaxis) (As above) |
Vero cell |
41,910 |
147 |
|
Glycoprotein produced by rDNA technology in mammalian cells |
37,983 |
139 |
|
|
(Birth cohort in areas of high risk) |
Attenuated live vector virus containing gene for protective glycoprotein antigen |
8,260 |
16 |
|
Respiratory syncytial virus (Infants) |
Polypeptides produced by recombinant DNA technology |
52,412 |
1,964 |
|
Attenuated live virus |
59,559 |
983 |
|
Pathogen (Target Population) |
Vaccine Envisaged |
Annualized Present Value of Potential Health Benefits (IME Units) |
Annualized Present Value of Expenditures on Vaccines Necessary to Achieve Potential Health Benefits ($ millions) |
|
Rotavirue (Infants, 0–6 months) |
Attenuated high passage bovine rotavirus |
521,852 |
853 |
|
Attenuated low passage bovine rotavirus |
450,795 |
655 |
|
|
Rhesus monkey rotavirus |
450,795 |
656 |
|
|
Salmonella typhi (Children; young adults at risk; travelers from developed countries to endemic areas) |
Attenuated ga1E mutant S. typhi strain TY21a |
431,471 |
358 |
|
Aromatic amino acid dependent strains of S. typhi |
194,745 |
152 |
|
|
Shigella spp. (Infants at birth; elderly for epidemic strains) |
Probably plasmid mediated outer membrane protein invasion determinant (there are a small number of promising options needing investigation to determine best approach) |
222,096 |
92 |
|
Streptococcus A (Children, < 3–4 years) |
Synthetic M protein segment (excluding portions cross-reacting with human tissue) |
180,513 |
554 |
|
Streptococcus pneumoniae (Infants) |
Conjugated polysaccharides, polyvalent |
1,363,943 |
1,310 |
|
Vibrio cholera (Children, especially < 2 years) |
Genetically defined live mutant V. cholerae (A−B+ or A−B−) with respect to toxin subunit synthesis |
94,986 |
24 |
|
Inactivated antigens |
65,548 |
44 |
|
|
Yellow fever virus (Young children) |
Attenuated live virus produced in cell culture |
11,127 |
93 |
TABLE 9.2 Benefits and Affordability of Various Vaccine Candidates
|
Vaccine |
Annualized Present Value of Potential Health Benefits (IME units) |
Vaccine |
Annualized Present Value of Potential Expenditures ($ millions) |
|
S. pneumoniae |
1,363,943 |
Rabies (live vector virus) |
15.5 |
|
Rotavirus (HPBRV) |
521,852 |
V. cholera (attenuated live) |
23.8 |
|
Malaria (monovalent) |
475,205 |
V. cholera (inactivated) |
43.6 |
|
Rotavirus (LPBRV) |
450,795 |
E. coli (attenuated live) |
69.2 |
|
Rotavirus (RMRV) |
450,795 |
Shigella |
91.6 |
|
S. typhi (Ty21a) |
431,471 |
Yellow fever |
93.0 |
|
Malaria (multivalent) |
426,640 |
Rabies (glycoprotein) |
138.7 |
|
Shigella |
222,096 |
Rabies (Vero cell derived) |
146.8 |
|
Hepatitis B |
213,192 |
S. typhi (aa-strain) |
152.2 |
|
H. influenzae b |
210,943 |
Dengue |
241.8 |
|
S. typhi (aa-strain) |
194,745 |
M. leprae |
270.6 |
|
Streptococcus group A |
180,513 |
S. typhi (Ty21a) |
358.0 |
|
E. coli (attenuated live) |
145,260 |
H. influenzae b |
526.6 |
|
E. coli (purified antigens) |
126,454 |
Streptococcus group A |
554.2 |
|
V. cholera (attenuated live) |
94,986 |
Japanese encephalitis |
614.0 |
|
M. leprae |
88,481 |
Rotavirus (LPBVR) |
655.4 |
|
V. cholera (inactivated) |
65,548 |
Rotavirus (RMRV) |
655.9 |
|
RSV (attenuated live virus) |
59,559 |
N. meningitidis |
708.1 |
|
RSV (glycoprotein) |
52,412 |
E. coli (purified antigens) |
722.3 |
|
Parainfluenza viruses |
43,692 |
Rotavirus (HPBRV) |
852.7 |
|
Rabies (Vero cell derived) |
41,910 |
Malaria (multivalent) |
856.8 |
|
Rabies (glycoprotein) |
37,983 |
Malaria (monovalent) |
967.3 |
|
Hepatitis A (attenuated live virus) |
15,112 |
RSV (attenuated live) |
982.8 |
|
Hepatitis A (polypeptide) |
14,392 |
Hepatitis A (attenuated live) |
1,058.0 |
|
N. meningitidis |
13,754 |
Streptococcus pneumoniae |
1,310.3 |
|
Yellow fever virus |
11,127 |
Parainfluenza |
1,697.1 |
|
Dengue virus |
9,558 |
RSV (glycoprotein) |
1,964.4 |
|
Rabies (live vector virus) |
8,260 |
Hepatitis A (polypeptide) |
4,029.0 |
|
Japanese encephalitis virus |
3,232 |
Hepatitis B |
8,859.3 |
|
Health benefits are expressed in units equivalent in undesirability to the death of an infant (IMEs) and are calculated using the median of IME perspectives from responding health professionals in developing countries. |
|||
TABLE 9.3 Some Relationships Between Expenditures and Health Benefitsa
|
Pathogen (Target Population) |
Vaccine Envisaged |
Annualized Present Value of Potential Health Benefits (IME Units) |
Annualized Present Value of Expenditures on Vaccines Necessary to Achieve Potential Health Benefits (dollars) |
|
Dengue virus (Infants and children in endemic areas; travelers to endemic areas) |
Attenuated live vector virus containing gene for broadly cross-reacting protective antigen |
9,558 |
241,803,765 |
|
Escherichia coli (enterotoxigenic) (Infants < 6 months) |
A combination of purified colonization factor antigens and possibly other antigens |
126,454 |
722,284,852 |
|
Genetically engineered attenuated strains |
145,260 |
69,171,586 |
|
|
Hemophilus influenzae type b (Infants) |
Conjugated polysaccharide |
210,943 |
526,603,421 |
|
Hepatitis A virus (Susceptibles of all ages; children) |
Attenuated live virus |
15,112 |
1,058,021,429 |
|
Polypeptide recombinant vaccine produced in yeast |
14,392 |
4,028,950,683 |
|
|
Hepatitis B virus (Areas with high perinatal infection: all infants at birth (if possible). Other areas: all infants, simultaneous with other vaccinations) |
Polypeptide produced by recombinant DNA technology |
213,192 |
8,859,258,746 |
|
Japanese encephalitis virus (Children in epidemic and and endemic areas; foreign visitors to epidemic regions) |
Inactivated virus produced in cell culture |
3,232 |
613,959,820 |
|
Mycobacterium leprae (Immuno-prophylactic: all children in endemic areas. Immuno-therapeutic: all recently infected individuals) |
Armadillo-derived M. leprae |
88,481 |
270,619,575 |
|
Neisseria meningitidis (Infants, 3–6 months) |
Conjugated capsular polysaccharides, groups A,C,Y, and W135 |
13,754 |
708,114,155 |
|
Parainfluenza viruses (Infants) |
Trivalent, subunit vaccine (which must contain fusion proteins) |
43,692 |
1,697,123,972 |
|
Plasmodium spp. (All infants at risk, military personnel, travelers) |
Plasmodium falciparum, synthetic or recombinant sporozoite antigen preparation |
475,205 |
967,271,590 |
|
Multivalent synthetic or recombinant sporozoite antigen preparation (P. falciparum, P. vivax, P. ovale, P. malariae) |
426,640 |
856,843,460 |
|
Expenditure per IME Prevented |
Annualized Present Value of Potential Health Benefits Adjusted for Opportunity Cost at $100,000/IME |
Annualized Present Value of Potential Health Benefits Adjusted for Opportunity Cost at $10,000/IME |
Annualized Present Value of Potential Health Benefits Adjusted for Opportunity Cost at $1,000/IME |
Annualized Present Value of Potential Health Benefits Adjusted for Opportunity Cost at $500/IME |
Annualized Present Value of Potential Health Benefits Adjusted for Opportunity Cost at $100/IME |
|
25,298 |
7,140 |
–14,622 |
–232,246 |
–474,049 |
–2,408,479 |
|
5,712 |
119,231 |
54,226 |
–595,831 |
–1,318,116 |
–7,096,394 |
|
476 |
144,568 |
138,343 |
76,088 |
6,917 |
–546,456 |
|
2,496 |
205,677 |
158,283 |
–315,660 |
–842,264 |
–5,055,091 |
|
70,014 |
4,531 |
–90,691 |
–1,042,910 |
–2,100,931 |
–10,565,103 |
|
279,946 |
–25,898 |
–388,503 |
–4,014,559 |
–8,043,509 |
–40,275,115 |
|
41,555 |
124,600 |
–672,734 |
–8,646,066 |
–17,505,325 |
–88,379,395 |
|
189,944 |
–2,907 |
–58,164 |
–610,727 |
–1,224,687 |
–6,136,366 |
|
3,058 |
85,775 |
61,419 |
–182,138 |
–452,758 |
–2,617,714 |
|
51,483 |
6,673 |
–57,057 |
–694,360 |
–1,402,474 |
–7,067,387 |
|
38,843 |
26,721 |
–126,020 |
–1,653,432 |
–3,350,556 |
–16,927,548 |
|
2,035 |
465,532 |
378,478 |
–492,066 |
–1,459,338 |
–9,197,511 |
|
2,008 |
418,072 |
340,956 |
–430,203 |
–1,287,047 |
–8,141,795 |
|
Expenditure per IME Prevented |
Annualized Present Value of Potential Health Benefits Adjusted for Opportunity Cost at $100,000/IME |
Annualized Present Value of Potential Health Benefits Adjusted for Opportunity Cost at $10,000/IME |
Annualized Present Value of Potential Health Benefits Adjusted for Opportunity Cost at $1,000/IME |
Annualized Present Value of Potential Health Benefits Adjusted for Opportunity Cost at $500/IME |
Annualized Present Value of Potential Health Benefits Adjusted for Opportunity Cost at $100/IME |
|
3,503 |
40,442 |
27,229 |
−104,901 |
–251,713 |
–1,426,205 |
|
3,650 |
36,596 |
24,117 |
–100,673 |
–239,328 |
–1,348,570 |
|
1,877 |
8,105 |
6,709 |
–7,246 |
–22,752 |
–146,802 |
|
37,480 |
32,768 |
–144,031 |
–1,912,024 |
–3,876,460 |
–19,591,949 |
|
16,502 |
49,731 |
–38,725 |
–923,284 |
–1,906,127 |
–9,768,871 |
|
1,634 |
513,325 |
436,578 |
–330,885 |
–1,183,623 |
–8,005,523 |
|
1,454 |
444,242 |
385,256 |
–204,600 |
–859,995 |
–6,103,158 |
|
1,455 |
444,237 |
385,206 |
–205,100 |
–860,995 |
–6,108,158 |
|
830 |
427,891 |
395,667 |
73,431 |
–284,608 |
–3,148,926 |
|
781 |
193,224 |
179,530 |
42,592 |
–109,562 |
–1,326,789 |
|
412 |
221,180 |
212,936 |
130,492 |
38,889 |
–693,942 |
|
3,070 |
174,971 |
125,096 |
–373,655 |
–927,823 |
–5,361,165 |
|
961 |
1,350,840 |
1,232,914 |
53,652 |
–1,256,638 |
–11,738,964 |
|
250 |
94,748 |
92,607 |
71,197 |
47,408 |
–142,902 |
|
665 |
65,112 |
61,191 |
21,976 |
–21,595 |
–370,168 |
|
8,362 |
10,197 |
1,822 |
–81,922 |
–174,971 |
–919,366 |
TABLE 9.4 The Effect of Resource Constraints on the Ranking of Various Vaccine Candidates
|
|
Rank Based on Annualized Present Value of Potential Health Benefits Adjusted for Opportunity Costsa |
||||
|
|
Willingness to Pay (dollars) per IME Averted |
||||
|
Vaccine |
Unrestricted |
100,000 |
10,000 |
1,000 |
500 |
|
S. pneumoniae |
1 |
1 |
1 |
5 |
–b |
|
Rotavirus (HPBRV) |
2 |
2 |
2 |
– |
– |
|
Malaria (monovalent) |
3 |
3 |
6 |
– |
– |
|
Rotavirus (LPBRV) |
4 |
4 |
4 |
– |
– |
|
Rotavirus (RMRV) |
5 |
5 |
5 |
– |
– |
|
S. typhi (Ty21a) |
6 |
6 |
3 |
3 |
– |
|
Malaria (multivalent) |
7 |
7 |
7 |
– |
– |
|
Shigella |
8 |
8 |
8 |
1 |
2 |
|
Hepatitis B |
9 |
13 |
– |
– |
– |
|
H. influenzae b |
10 |
9 |
10 |
– |
– |
|
S. typhi (aa-strain) |
11 |
10 |
9 |
6 |
– |
|
Streptococcus group A |
12 |
11 |
12 |
– |
– |
|
E. coli (attenuated live) |
13 |
12 |
11 |
2 |
3 |
|
E. coli (purified antigens) |
14 |
14 |
16 |
– |
– |
|
V. cholera (attenuated live) |
15 |
15 |
13 |
4 |
1 |
|
M. leprae |
16 |
16 |
14 |
– |
– |
|
V. cholera (inactivated) |
17 |
17 |
15 |
7 |
– |
|
RSV (attenuated live virus) |
18 |
18 |
– |
– |
– |
|
RSV (glycoprotein) |
19 |
21 |
– |
– |
– |
|
Parainfluenza viruses |
20 |
22 |
– |
– |
– |
|
Rabies (Vero cell derived) |
21 |
19 |
17 |
– |
– |
|
Rabies (glycoprotein) |
22 |
20 |
18 |
– |
– |
|
Hepatitis A (attenuated live virus) |
23 |
27 |
– |
– |
– |
|
Hepatitis A (polypeptide) |
24 |
– |
– |
– |
– |
|
N. meningitidis |
25 |
26 |
– |
– |
– |
|
Yellow fever virus |
26 |
23 |
20 |
– |
– |
|
Dengue virus |
27 |
25 |
– |
– |
– |
|
Rabies (live vector virus) |
28 |
24 |
19 |
– |
– |
|
Japanese encephalitis virus |
29 |
– |
– |
– |
– |
|
aRankings are based on values shown in Table 9.3. b– denotes not affordable at indicated willingness to pay. |
|||||
equivalent to potential health benefits. In this case the principle of dominance applies: vaccines yielding greater potential benefits and lower expenditures are preferred. Procedures are discussed in Chapter 3. However, because the expenditures do not reflect overall net costs, the committee believes that initial rankings of candidates should be based on their potential health benefits.
Disease Burden Assumptions
A major factor in determining the ultimate ranking of a vaccine candidate is the total disease burden value (TDBV) used as the starting point in the calculations of potential benefit. The central analysis rankings reflect the committee’s best efforts, within its resources and the reliability and quantity of available data, to generate disease
burden estimates. Some of the estimates rest on uncertain assumptions or extrapolations from limited data. Some specific examples may help demonstrate how the overall method differentiates between vaccine candidates even when the starting points are somewhat uncertain.
For the top-ranked vaccine candidate, S. pneumoniae, the total disease burden in the central analysis represents a set of assumptions, including some use of antibiotics (see Appendix D-17). A “preantibiotic” TDBV twice that used in the central analysis could have been used in calculations, but would have merely served to further separate S. pneumoniae vaccine from the runners-up. Using a different starting point for the derivation of the disease burden estimates (see Appendixes B and D-17)* yields a somewhat lower estimate of pneumococcal pneumonia, the major contributor to the S. pneumoniae disease burden. Ignoring bacteremia and otitis media, the approach in Appendix B yields estimates for the under 15 years age group that results in a disease burden value of 1,921,300 (versus 6,612,261 in the central analysis which derives from the estimates developed in Appendix D-17). Because the lower value represents the partial disease burden for the under 15 years age group, it is assumed that all of the disease is potentially preventable (i.e., VPI=1.0; see Appendix D-17). Using the lower DBV of 1,921,300 as the starting point in the analysis results in a value for the annualized present value of potential health benefits (APVPHB) of 713,367. This value still results in the candidate S. pneumoniae vaccine having highest priority. The effect of adopting alternative assumptions on the probability of success for this candidate is discussed below.
For certain diarrheal pathogens it can be argued that by the time the new vaccines are available, the disease burden will have been significantly reduced by the adoption of oral rehydration therapy (ORT), which averts dehydration deaths. For those pathogens where this scenario was plausible (E. coli and rotavirus), TDBVs were calculated from disease burden estimates which assumed that by the time of vaccine availability, ORT had reduced deaths by 50 percent. The effect of adopting these TDBVs in the analysis was examined. Even with the assumption that the disease amenable to reduction by these vaccines is reduced substantially (by about 50 percent), the degree of spacing between the other candidates resulted in these vaccines shifting only slightly in the rankings. The three rotavirus candidates dropped in the central analysis from positions 2, 4, and 5 to positions 5, 6, and 7 (total candidates = 29). The two E. coli candidates dropped from positions 13 and 14 to positions 15 and 16.
|
* |
The approach in Appendix B starts from reports on overall acute respiratory infections in developing countries; these reports probably underestimate the actual incidence of disease. The approach in Appendix D-17 starts from the assumption that pneumococcal pneumonia incidence in developing countries is likely to be similar to that in developed countries in the 1920s; such rates are reasonably well documented. |
Individuals wishing to evaluate the effect on the ultimate rankings of adopting different assumptions on the magnitude of the disease burden can do so in crude fashion by adjusting the final APVPHB in accordance with their beliefs. For example, if they believe that the overall disease incidence is twice that used in the central analysis (but that rates for complications, sequelae, case-fatality rates, etc., are reasonable) the central analysis APVPHB value should be doubled. The rank of the new APVPHB value can then be determined. More complex disagreements with disease burden determination (e.g., favoring a different frequency of complications) requires recalculation of the disease burden estimates and the TDBV.
Target Population and Assumptions on Vaccine Preventable Illness
The bases for the various disease burden proportions that are judged to be vaccine preventable are described in Appendixes D-1 through D-19. The effect of alternative assumptions can easily be examined by substituting a new value in the calculation process shown in Table 7.4. Assumptions different from those in the central analysis may alter the ranking of vaccines. For example, 50 percent of the disease burden for hepatitis B vaccine is estimated to be preventable by delivering the vaccine at the usual WHO-EPI scheduled times. If vaccines were delivered universally at birth, some higher proportion would be preventable and the potential benefits would be raised proportionally.
The targeted population may markedly affect the potential expenditures. For example, delivery of the N. meningitidis vaccine to the entire birth cohort in the developing world (115.1 million births) would cost about $708 million. Focusing vaccine delivery on births in the African meningitis belt (13.1 million births) would reduce the cost by about 90 percent to $82 million. (Because this strategy would not protect against endemic or rare epidemic disease in other parts of the world, potential health benefits would also be less; see Appendix D-8).
Similarly, immunotherapeutic use of a vaccine for M. leprae—to curtail progressive disease in all recognized new cases—would cost $10.3 million as contrasted to immunoprophylactic use in the birth cohort at risk, which would cost $270 million. These strategies are, however, significantly different, and this commentary does not suggest that immunotherapy would be more “cost-effective.” To be useful, such a strategy would require substantially increased efforts at early case detection.
Discount Rate
The committee believes that incorporating a discounting procedure for future health benefits and expenditures is justified because it reflects the preference for benefits achieved sooner rather than later (a basic concept in the establishment of a program of accelerated vaccine development). The effect of placing more or less weight on
achieving early benefits was examined by selecting discount rates higher (0.10) and lower (0.02) than in the central analysis. Results from analyses using these discount rates are compared to results from the central analysis in Tables 9.5 and 9.6.
In general, using discount rates of 10 percent or 2 percent would not substantially affect the structure of the ranking, although some vaccines are shifted slightly in position. Notable among these is hepatitis B, which drops from position 9 on health benefits to position 15 if a 10 percent discount rate is adopted. Although the development of this second generation vaccine is relatively advanced, it drops in position when a high discount rate is adopted (i.e., one that favors shorter term realization of benefits) because the delay of vaccination benefits for hepatitis B immunization is long.
Alternative Development Scenario: Probability of Success
The central analysis uses the probability of successful development indicated for each vaccine in Chapter 5. The effect of adopting a more optimistic but not unreasonable view was examined by assuming a 100 percent chance of successful development within a time period for likely time to licensure. Tables 9.7 and 9.8 show the results. Such an assumption would not substantially affect the overall rankings, but some vaccines shift slightly in position. Some vaccines with lower probabilities of success (e.g., malaria at 0.5) rise in the rankings relative to those whose probability of success was already closer to 1.0. The spacing of benefit values is such that, for certain vaccines (e.g., M. leprae) with a lower probability of success, the more optimistic assumption (p=1.0) raises the potential benefit value but does not change the ranking.
The committee performed another sensitivity analysis, by way of example, to show the effects of lowering the probability of successful development for a single, highly ranked, vaccine—S. pneumoniae (Table9.9). The original estimate, shown in Tables 9.1 and 9.2, was 80 percent. Elimination of this vaccine from the top half of the ranking on potential health benefits (Table 9.2) required assuming a probability of success less than 5 percent. Assuming a probability of success less than about 12 percent is required to eliminate it from the top five positions.
Assessing the Effect of Differential Utilization
Table 9.2 shows annualized present values of potential health benefits (APVPHBs) unadjusted for utilization because the committee assumed this factor would not differ among vaccines. If future applications of this or similar systems (e.g., for specific countries) must account for differential utilization, then the appropriate values for the annualized present values of expected health benefits can be obtained simply by multiplying the APVPHBs by the appropriate value for that proportion of the target population expected to receive the vaccine.
TABLE 9.5 Sensitivity Analysis: Effect of Discount Rate on Annualized Present Value of Potential Health Benefits for Various Vaccine Candidates
|
|
Discount Rate |
|||||
|
|
Central Analysis, 0.05 |
0.02 |
0.10 |
|||
|
Vaccine |
Rank |
Value (IME Units) |
Rank |
Value (IME Units) |
Rank |
Value (IME Units) |
|
S. pneumoniae |
1 |
1,363,943 |
1 |
1,770,510 |
1 |
897,358 |
|
Rotavirus (HPBRV) |
2 |
521,852 |
5 |
603,244 |
2 |
413,552 |
|
Malaria (monovalent) |
3 |
475,205 |
3 |
663,218 |
5 |
278,319 |
|
Rotavirus (LPBRV) |
4 |
450,795 |
6 |
568,450 |
3 |
310,708 |
|
Rotavirus (RMRV) |
4 |
450,795 |
6 |
568,450 |
4 |
310,708 |
|
S. typhi (Ty21a) |
6 |
431,471 |
2 |
686,085 |
7 |
204,973 |
|
Malaria (multivalent) |
7 |
426,640 |
4 |
640,191 |
6 |
222,440 |
|
Shigella |
8 |
222,096 |
10 |
323,742 |
9 |
121,310 |
|
Hepatitis B |
9 |
213,192 |
8 |
554,897 |
15 |
45,926 |
|
H. influenzae b |
10 |
210,943 |
12 |
281,875 |
8 |
132,474 |
|
S. typhi (aa-strain) |
11 |
194,745 |
9 |
363,189 |
12 |
71,630 |
|
Streptococcus group A |
12 |
180,513 |
11 |
317,684 |
11 |
72,869 |
|
E. coli (attenuated live) |
13 |
145,260 |
13 |
211,741 |
10 |
79,342 |
|
E. coli (purified antigens) |
14 |
126,454 |
14 |
184,238 |
13 |
69,070 |
|
V. cholera (attenuated live) |
15 |
94,986 |
16 |
126,925 |
14 |
59,652 |
|
M. leprae |
16 |
88,481 |
17 |
162,639 |
19 |
33,310 |
|
V. cholera (inactivated) |
17 |
65,548 |
17 |
82,656 |
16 |
45,179 |
|
RSV (attenuated live virus) |
18 |
59,559 |
18 |
75,104 |
17 |
41,051 |
|
RSV (glycoprotein) |
19 |
52,412 |
19 |
66,092 |
18 |
36,125 |
|
Parainfluenza viruses |
20 |
43,692 |
20 |
60,101 |
22 |
26,192 |
|
Rabies (Vero cell derived) |
21 |
41,910 |
21 |
52,088 |
20 |
29,566 |
|
Rabies (glycoprotein) |
22 |
37,983 |
22 |
47,207 |
21 |
26,795 |
|
Hepatitis A (attenuated live virus) |
23 |
15,112 |
23 |
20,787 |
23 |
9,059 |
|
Hepatitis A (polypeptide) |
24 |
14,392 |
24 |
20,379 |
24 |
8,235 |
|
N. meningitidis |
25 |
13,754 |
25 |
20,049 |
25 |
7,513 |
|
Yellow fever virus |
26 |
11,127 |
26 |
19,301 |
26 |
4,598 |
|
Dengue virus |
27 |
9,558 |
27 |
15,646 |
27 |
4,334 |
|
Rabies (live vector virus) |
28 |
8,260 |
28 |
5,630 |
28 |
2,969 |
|
Japanese encephalitis virus |
29 |
3,232 |
29 |
5,215 |
29 |
1,500 |
TABLE 9.6 Sensitivity Analysis: Effect of Discount Rate on Annualized Present Value of Expenditures to Achieve the Benefits of Various Vaccine Candidates
|
|
Discount Rate |
|||||
|
|
Central Analysis, 0.05 |
0.02 |
0.10 |
|||
|
Vaccine |
Rank |
Expenditure ($ million) |
Rank |
Expenditure ($ million) |
Rank |
Expenditure ($ million) |
|
Rabies (live vector virus) |
1 |
16 |
1 |
21 |
1 |
10 |
|
V. cholera (attenuated live) |
2 |
24 |
2 |
29 |
2 |
18 |
|
V. cholera (inactivated) |
3 |
44 |
3 |
51 |
3 |
34 |
|
E. coli (attenuated live) |
4 |
69 |
4 |
96 |
4 |
42 |
|
Shigella |
5 |
92 |
6 |
128 |
5 |
55 |
|
Yellow fever |
6 |
93 |
5 |
107 |
6 |
75 |
|
Rabies (glycoprotein) |
7 |
139 |
7 |
182 |
8 |
112 |
|
Rabies (Vero cell derived) |
8 |
147 |
8 |
193 |
9 |
119 |
|
S. typhi (aa-strain) |
9 |
152 |
9 |
195 |
7 |
103 |
|
Dengue |
10 |
242 |
10 |
341 |
11 |
140 |
|
M. leprae |
11 |
271 |
12 |
417 |
10 |
137 |
|
S. typhi (Ty21a) |
12 |
358 |
11 |
390 |
12 |
312 |
|
H. influenzae b |
13 |
527 |
13 |
663 |
14 |
364 |
|
Streptococcus group A |
14 |
554 |
14 |
749 |
13 |
344 |
|
Japanese encephalitis |
15 |
614 |
17 |
806 |
15 |
398 |
|
Rotavirus (LPBVR) |
16 |
655 |
15 |
802 |
18 |
475 |
|
Rotavirus (RMRV) |
17 |
656 |
16 |
802 |
19 |
476 |
|
N. meningitidis |
18 |
708 |
18 |
945 |
17 |
447 |
|
E. coli (purified antigens) |
19 |
722 |
20 |
1,021 |
16 |
415 |
|
Rotavirus (HPBRV) |
20 |
853 |
19 |
957 |
23 |
709 |
|
Malaria (multivalent) |
21 |
857 |
21 |
1,177 |
20 |
516 |
|
Malaria (monovalent) |
22 |
967 |
23 |
1,236 |
21 |
653 |
|
RSV (attenuated live) |
23 |
983 |
22 |
1,203 |
24 |
711 |
|
Hepatitis A (attenuated live) |
24 |
1,058 |
24 |
1,373 |
22 |
697 |
|
Streptococcus pneumoniae |
25 |
1,310 |
25 |
1,604 |
25 |
948 |
|
Parainfluenza |
26 |
1,697 |
26 |
2,267 |
26 |
1,068 |
|
RSV (glycoprotein) |
27 |
1,964 |
27 |
2,405 |
27 |
1,420 |
|
Hepatitis A (polypeptide) |
28 |
4,029 |
28 |
5,383 |
28 |
2,542 |
|
Hepatitis B |
29 |
8,859 |
29 |
9,664 |
29 |
7,700 |
TABLE 9.7 Sensitivity Analysis: Effect of an Alternative Development Scenario on Potential Health Benefits
|
|
Predicted Probability of Successful Development (Central Analysis) |
100% Probability of Successful Development |
||
|
Vaccine |
Rank |
Value (IME Units) |
Rank |
Value (IME Units) |
|
S. pneumoniae |
1 |
1,363,943 |
1 |
1,704,929 |
|
Rotavirus (HPBRV) |
2 |
521,852 |
4 |
579,836 |
|
Malaria (monovalent) |
3 |
475,205 |
2 |
950,410 |
|
Rotavirus (LPBRV) |
4 |
450,795 |
5 |
563,494 |
|
Rotavirus (RMRV) |
4 |
450,795 |
5 |
563,494 |
|
S. typhi (Ty21a) |
6 |
431,471 |
7 |
479,412 |
|
Malaria (multivalent) |
7 |
426,640 |
3 |
853,280 |
|
Shigella |
8 |
222,096 |
9 |
317,280 |
|
Hepatitis B |
9 |
213,192 |
13 |
215,346 |
|
H. influenzae b |
10 |
210,943 |
11 |
234,381 |
|
S. typhi (aa-strain) |
11 |
194,745 |
8 |
317,491 |
|
Streptococcus group A |
12 |
180,513 |
12 |
225,641 |
|
E. coli (attenuated live) |
13 |
145,260 |
14 |
207,514 |
|
E. coli (purified antigens) |
14 |
126,454 |
10 |
252,908 |
|
V. cholera (attenuated live) |
15 |
94,986 |
16 |
126,647 |
|
M. leprae |
16 |
88,481 |
15 |
176,963 |
|
V. cholera (inactivated) |
17 |
65,548 |
17 |
100,843 |
|
RSV (attenuated live virus) |
18 |
59,559 |
18 |
74,449 |
|
RSV (glycoprotein) |
19 |
52,412 |
19 |
65,515 |
|
Parainfluenza viruses |
20 |
43,692 |
20 |
54,615 |
|
Rabies (Vero cell derived) |
21 |
41,910 |
21 |
46,567 |
|
Rabies (glycoprotein) |
22 |
37,983 |
22 |
44,686 |
|
Hepatitis A (attenuated live virus) |
23 |
15,112 |
25 |
15,907 |
|
Hepatitis A (polypeptide) |
24 |
14,392 |
26 |
15,149 |
|
N. meningitidis |
25 |
13,754 |
23 |
27,509 |
|
Yellow fever virus |
26 |
11,127 |
28 |
11,713 |
|
Dengue virus |
27 |
9,558 |
27 |
12,744 |
|
Rabies (live vector virus) |
28 |
8,260 |
24 |
16,520 |
|
Japanese encephalitis virus |
29 |
3,232 |
29 |
6,465 |
CONCLUSIONS
Final decisions on the number of vaccines and the particular vaccines selected for accelerated development must incorporate various nonquantifiable factors, as well as information provided by the rankings that were derived with the proposed system for calculating benefits and expenditures. The additional factors include:
-
goals of the responsible agency and its schedule for achieving them
-
ethical questions on the distribution of benefits among socioeconomic or age groups, countries, or regions
-
most appropriate points in the development process at which the agency can exert influence and the opportunity and need for such influence
-
extent of private sector activities
TABLE 9.8 Sensitivity Analysis: Effect of an Alternative Development Scenario on Potential Expenditures
|
|
Predicted Probability of Successful Development (Central Analysis) |
100% Probability of Successful Development |
||
|
Vaccine |
Rank |
Expenditures ($ millions) |
Rank |
Expenditures ($ millions) |
|
Rabies (live vector virus) |
1 |
15.5 |
1 |
30.3 |
|
V. cholera (attenuated live) |
2 |
23.8 |
2 |
31.3 |
|
V. cholera (inactivated) |
3 |
43.6 |
3 |
66.8 |
|
E. coli (attenuated live) |
4 |
69.2 |
5 |
98.0 |
|
Shigella |
5 |
91.6 |
6 |
130.1 |
|
Yellow fever |
6 |
93.0 |
4 |
97.9 |
|
Rabies (glycoprotein) |
7 |
138.7 |
7 |
177.4 |
|
Rabies (Vero cell derived) |
8 |
146.8 |
8 |
177.5 |
|
S. typhi (aa-strain) |
9 |
152.2 |
9 |
304.2 |
|
Dengue |
10 |
241.8 |
10 |
322.0 |
|
M. leprae |
11 |
270.6 |
12 |
549.0 |
|
S. typhi (Ty21a) |
12 |
358.0 |
11 |
397.8 |
|
H. influenzae b |
13 |
526.6 |
13 |
585.0 |
|
Streptococcus group A |
14 |
554.2 |
14 |
692.1 |
|
Japanese encephalitis |
15 |
614.0 |
19 |
1,225.4 |
|
Rotavirus (LPBRV) |
16 |
655.4 |
15 |
819.0 |
|
Rotavirus (RMRV) |
17 |
655.9 |
16 |
819.5 |
|
N. meningitidis |
18 |
708.1 |
21 |
1,414.7 |
|
E. coli (purified antigens) |
19 |
722.3 |
22 |
1,443.3 |
|
Rotavirus (HPBRV) |
20 |
852.7 |
17 |
947.4 |
|
Malaria (multivalent) |
21 |
856.8 |
24 |
1,711.9 |
|
Malaria (monovalent) |
22 |
967.3 |
25 |
1,933.3 |
|
RSV (attenuated live) |
23 |
982.8 |
20 |
1,228.2 |
|
Hepatitis A (attenuated live) |
24 |
1,058.0 |
18 |
1,113.7 |
|
Streptococcus pneumoniae |
25 |
1,310.3 |
23 |
1,637.5 |
|
Parainfluenza |
26 |
1,697.1 |
26 |
2,121.1 |
|
RSV (glycoprotein) |
27 |
1,964.4 |
27 |
2,455.2 |
|
Hepatitis A (polypeptide) |
28 |
4,029.0 |
28 |
4,240.9 |
|
Hepatitis B |
29 |
8,859.3 |
29 |
8,948.7 |
-
opportunities to accelerate vaccine development through collaboration with other countries or international organizations
-
the desired balance of the development portfolio (e.g., pediatric versus adult vaccines, global versus regional diseases)
-
arguments for treating certain vaccine development projects as unique because of their potential for facilitating immunization programs in general (e.g., by eliminating constraints on delivery, such as poor stability) or by improving public confidence (e.g., by reducing adverse reactions)
-
the prospect that a particular project may serve as a useful model for a number of other desired vaccines
-
disease related factors, such as epidemiologic and clinical characteristics likely to overwhelm medical services, and the availability of alternative control strategies or safe and effective therapy
-
possible synergistic interaction with other diseases
TABLE 9.9 Effect of Varying Probability of Success on the Health Benefits of S.pneumoniae Vaccine: Central Analysis
|
Probability of Success |
Annualized Present Value of Potential Health Benefits (IME units) |
|
1.0 |
1,704,929 |
|
0.9 |
1,534,236 |
|
0.8a |
1,363,943 |
|
0.7 |
1,193,450 |
|
0.6 |
1,022,957 |
|
0.5 |
852,464 |
|
0.4 |
681,972 |
|
0.3 |
511,479 |
|
0.2 |
340,986 |
|
0.1 |
170,493 |
|
0.0 |
0 |
|
aProbability of success used in central analysis. |
|
-
the immediate U.S. interest in diseases that may be imported into the United States, that threaten travelers or personnel stationed overseas, or that are existing problems in the United States
-
the affordability of the potential health benefit, if not already used formally in the decision process
These factors are discussed in more detail in Chapter 8 and elsewhere in the report.
The analyses presented in this chapter indicate that of the 29 projects considered, vaccines for S. pneumoniae, Plasmodium spp. (malaria; both monovalent and multivalent circumsporozoite protein based versions), rotavirus (all three candidates), S. typhi (Ty21a), and shigella consistently rank in the top 10 positions in priority lists based on potential health benefits, under a wide range of assumptions and resource availability.
Vaccines for hepatitis B and H. influenzae type b rank in the top 10 in the central analysis but are dislodged under certain assumptions. Vaccines for E. coli (either candidate) or the alternative candidate for S. typhi (an aromatic amino acid requiring stain) move into the top
10 under certain assumptions: as willingness to pay drops to $1,000 or below per IME prevented, the ranking changes more significantly, as shown in Table 9.4, with vaccines for certain diarrheal diseases rising in the rankings.
A fairly consistent middle-tier of vaccines occurs in the ranking under a variety of assumptions. In addition to those candidates that will contend for higher ranking under certain assumptions, this middletier includes vaccines for Streptococcus group A, M. leprae, V. cholerae, respiratory syncytial virus, parainfluenza viruses, and rabies (Vero cell derived or glycoprotein).
Most of the vaccines that consistently rank low would prevent diseases that are often serious, but mostly restricted to relatively small regions of the developing world. In such areas they may have more benefit than the widespread diseases that rank higher when the developing world is considered as a whole.
Additional sensitivity analyses, discussed below, can be performed to identify elements that may alter decisions.
DISCUSSION
Scientific opinion differs on some of the judgments incorporated into the proposed method, and uncertainty surrounds some of the data. The system has been applied by using the best estimates and most reliable data the committee could obtain, given its resources. The attempt to be explicit about certain estimates should not be interpreted as indicating that precise, unanimous, or certain comparisons are possible with existing methods or data, when the lack of data makes expert judgment necessary. The implications of these information gaps and differences of opinion about estimates are discussed more fully in Chapter 1. In this light, the committee suggests additional analyses and research to provide further information on the key elements that may alter decisions.
Ideally, to fully assess the effect of alternative IME profiles on the rankings, calculations should be conducted using the whole range of individual sets of IME values. However, because of resource and time constraints, this was not possible in the present study. The perspective adopted to illustrate application of the system was the median set of values from responses of health professionals in developing countries. A median set of values derived from U.S. respondents differed somewhat from the perspective used (see Chapter 4, Tables 4.7 and 4.8).
It is also possible to develop hypothetical age-neutral perspectives as was done for the committee’s first report (Institute of Medicine, 1985). The committee, however, does not endorse either set of median values or the age-neutral perspective for policy formulation. The effect of adopting various IME values is discussed in Chapter 4.
Selecting or constructing a small number of profiles that have distinct differences from the committee median or the age-neutral set would be a practicable way to further examine how various opinions on the undesirability of disease conditions might affect vaccine rankings. For example, IME profiles could be developed that show more or less
aversion to chronic or acute morbidity than the median set and a constructed age-neutral profile (i.e., for each morbidity category, calculate the geometric mean of median IME values across different age groups). The results of the ranking process with these profiles would then identify the extent to which differences of opinion regarding chronic or acute morbidity could alter rankings. (For a range of 14 important diseases in the United States, adopting a hypothetical age-neutral IME perspective, rather than the committee median that disfavored death and morbidity most in the 15–24 years age group, did not significantly alter the ultimate rankings [Institute of Medicine, 1985]).
Other sensitivity studies around the central analysis are also possible. These include the effect on the rankings of various predictions about the number of vaccine doses needed (which would affect expenditures on vaccines) or various predictions about individual vaccines (e.g., the probability of successful development of a vaccine).
The impact on rankings of using alternative assumptions for choosing the target population for some vaccines could also be tested, it would entail, however, more extensive recalculations, including reestimation of the disease proportion that is vaccine preventable.
RECOMMENDATIONS
The committee believes that a major strength of this analysis is that it encourages those using it to examine all judgments and assumptions about the selected vaccine preventable diseases. The committee recommends use of the proposed system by government decision makers. New candidates should be assessed as they become technically feasible and new data should be incorporated as they become available.
Data for disease comparisons are lacking in some areas and are of variable reliability in others. Further, data on the pathogen serotypes prevalent in particular regions may also be lacking.
Better data bases in these areas would facilitate making rational choices on vaccine development priorities and vaccine formulation. Therefore, NIAID and other national and international organizations should consider means to improve available epidemiological data on infectious diseases.
REFERENCE
Institute of Medicine. 1985. New Vaccine Development: Establishing Priorities, Volume I. Diseases of Importance in the United States. Washington, D.C.: National Academy Press.


