
4
Comparison of Disease Burdens
The objective of any vaccine development program is to reduce morbidity, mortality, and costs resulting from disease. Unfortunately, time and resource limitations make it impossible to pursue intensive development programs for all vaccines simultaneously. Priorities must be set in a manner that is consistent both with the needs of the population the vaccine is intended to benefit and the capabilities of current technologies. The committee sought a methodology that would allow quantitative comparison of the burdens of morbidity and mortality resulting from diseases that afflict populations in developing countries.
The classification of developing countries used in this study is in accordance with that used by the United Nations. Table 4.1 shows the regions, their populations, and other population features. Table 4.2 further defines the population estimates for the developing regions. Population estimates used throughout this volume were adapted from the 1984 World Population Data Sheet (Population Reference Bureau, Inc., 1984). Population estimates by age group were derived with the assistance of the Population Reference Bureau.
In the proposed system for comparing diseases, information on morbidity and mortality are combined with value judgments on the undesirability of various generic conditions into a single numerical score for each disease.* The same principles have been used in the comparisons of potential health benefits anticipated from individual vaccine candidates in Chapter 7. It is possible to use the same system to compare diseases identified in Appendix A that are candidates for long-term rather than accelerated vaccine development.
For the first phase of this study, setting vaccine priorities for the United States, the committee developed a method to calculate and compare the costs associated with various diseases. This method is described briefly in the latter portion of this chapter. For the reasons explained below, no attempt is made in this analysis to compare total treatment costs for diseases or the potential cost savings from
|
* |
See Appendix F for information on the computer software used in this analysis. |
TABLE 4.1 World Population Data
|
Region or Country |
Population as of Mid-1984 (millions) |
Crude Birth Rate (per 1,000 population) |
Infant Mortality Rate (per 1,000 live births) |
Percent Population Under Age 15 |
Percent Population Over Age 64 |
Urban Population (percent) |
|
Worlda |
4,762 |
28 |
84 |
35 |
6 |
40 |
|
Less developed |
3,596 |
32 |
94 |
38 |
4 |
32 |
|
Africa |
531 |
45 |
119 |
45 |
3 |
29 |
|
Asiab |
2,662 |
30 |
91 |
38 |
4 |
25 |
|
Latin Americac |
397 |
31 |
65 |
39 |
4 |
65 |
|
Oceaniad |
5 |
41 |
89 |
43 |
3 |
18 |
|
More developed |
1,116 |
16 |
19 |
23 |
12 |
71 |
|
Europe |
491 |
14 |
15 |
22 |
13 |
72 |
|
North Americae |
262 |
15 |
11 |
22 |
12 |
74 |
|
USSR |
274 |
20 |
32 |
25 |
10 |
64 |
|
Australia, New Zealand |
19 |
16 |
11 |
25 |
10 |
85 |
|
Japan |
120 |
13 |
7 |
23 |
9 |
76 |
|
aError in total population due to rounding. bJapan is excluded. China is included. cMexico, Central America, and South America are included. dAustralia and New Zealand are not included. eCanada and the United States are included. SOURCE: Population Reference Bureau, Inc. (1984). |
||||||
TABLE 4.2 Estimated 1984 Population by Age Groups for Regions in Which Developing Countries Predominate (thousands)
|
|
Age Group (years) |
||||||
|
Region |
Under 1 |
1–4 |
Under 5 |
5–14 |
15–59 |
60 and Over |
Total |
|
Latin America |
12,736 |
44,499 |
57,235 |
100,220 |
214,415 |
25,130 |
397,000 |
|
Africa |
23,040 |
73,762 |
96,802 |
141,459 |
265,451 |
27,288 |
531,000 |
|
Asia |
73,400 |
270,300 |
343,700 |
666,402 |
1,472,242 |
179,656 |
2,662,000 |
|
Oceania |
187 |
635 |
822 |
1,285 |
2,620 |
273 |
5,000 |
|
Total |
109,363 |
389,196 |
498,559 |
909,366 |
1,954,728 |
232,347 |
3,595,000 |
|
(Percentage) |
(3) |
(11) |
(14) |
(25) |
(54) |
(6) |
|
treatment averted by vaccine candidates in the developing world. This does not mean that these techniques cannot be applied in developing regions. Individuals setting priorities for a single country or region who have access to information (or reliable estimates) necessary to calculate treatment costs and potential cost savings from vaccines could employ the methods presented in Volume I (Institute of Medicine, 1985).
ELEMENTS OF THE SYSTEM FOR COMPARING MORBIDITY AND MORTALITY BURDENS ARISING FROM VARIOUS DISEASES
The system described below was designed not only to incorporate information relating to a disease (i.e., incidence, severity, complications, sequelae, duration, and distribution), but also to allow expression of individual value judgments on the undesirability (disutility) of various consequences resulting from that disease. Such value judgments are an inevitable part of the ranking process, whether they are explicit or implicit. The committee chose to make them explicit.
A format was devised with generic categories for estimates of the annual number of cases, complications, sequelae, and deaths associated with each disease. The scheme was designed to cover all major conditions that result from infectious diseases. Three levels of severity were established for both acute and chronic morbidity, and provision was made for recording the duration of an acute illness. The scheme also was designed to allow distribution of cases, complications, sequelae, and deaths among four age groups. An example of the matrix used to compile these estimates is shown in Table 4.3; the methods used to determine the entries are described below. Data on individual diseases are presented in Appendixes D-1 through D-19.
TABLE 4.3 Examples of the Format Used to Compile Information on the Burden of Illness Arising from infectious Diseases: Hepatitis A Virusa
|
|
Under 5 Years |
5–14 Years |
15–59 Years |
60 Years and Over |
||||||
|
Morbidity Category |
Description |
Condition |
Number of Cases |
Duration (days) |
Number of Cases |
Duration (days) |
Number of Cases |
Duration (days) |
Number of Cases |
Duration (days) |
|
A |
Moderate localized pain and/or mild systemic reaction, or impairment requiring minor change in normal activities, and associated with some restriction of work activity |
|
||||||||
|
B |
Moderate pain and/or moderate impairment requiring moderate change in normal activities, e.g., housebound or in bed, and associated with temporary loss of ability to work |
|
139,843 |
7 |
635,651 |
7 |
2,256,561 |
7 |
149,378 |
7 |
|
C |
Severe pain, severe short-term impairment, or hospitalization |
Jaundice, nausea, malaise |
31,735 |
14 |
158,675 |
14 |
1,221,794 |
14 |
206,277 |
14 |
|
D |
Mild chronic disability (not requiring hospitalization, institutionalization, or other major limitation of normal activity, and resulting in minor limitation of ability to work) |
Severe jaundice, fulminant hepatitis |
|
n.a. |
|
n.a. |
|
n.a. |
|
n.a. |
|
E |
Moderate to severe chronic disability (requiring hospitalization, special care, or other major limitation of normal activity, and seriously restricting ability to work) |
|
n.a. |
|
n.a. |
|
n.a. |
|
n.a. |
|
|
F |
Total impairment |
|
n.a. |
|
n.a. |
|
n.a. |
|
n.a. |
|
|
G |
Reproductive impairment resulting in infertility |
|
n.a. |
|
n.a. |
|
n.a. |
|
n.a. |
|
|
H |
Death |
|
n.a. |
1,144 |
n.a. |
5,146 |
n.a. |
8,005 |
n.a. |
|
|
aSee Appendix D-4 for derivation. |
||||||||||
Trade-Off Values
Individual value judgments (trade-off values)* on the undesirability of particular disease states were elicited through a questionnaire (see Appendix E) completed by a range of health professionals in developing countries. Respondents to the questionnaire were first asked to judge the undesirability of one unit of each acute and chronic morbidity category against death within a specific age group. The units were specified as 1 day for each state of acute illness and 1 case for each type of chronic illness (assumed to last a lifetime). Respondents then were asked to evaluate the undesirability of deaths across age groups. An example is shown in Table 4.4. The morbidity/ mortality and age categories in the questionnaire were the same as those used to develop estimates of disease incidence.
With these trade-offs, a set of values was derived for each respondent that represented on a single numeric scale the individual’s feelings about various disease consequences. The unit of comparison was designated as the “infant mortality equivalence” (IME) value. The IME value of a morbidity category/age group combination was calculated by multiplying the trade-off value for that combination by the trade-off value assigned to a death in that age group compared with the death of a child under 5 years of age (for an example derived from Table 4.4, see Table 4.5).
Expression of Morbidity and Mortality Burdens
Specific infant mortality equivalence values can be combined with disease burden estimates, such as those given in Appendixes D-1 through D-19, to generate scores that express the seriousness of a disease relative to others as viewed by the individual making the trade-off decisions.
The procedure begins with the calculation of a subtotal for each morbidity category/age group combination, as shown:
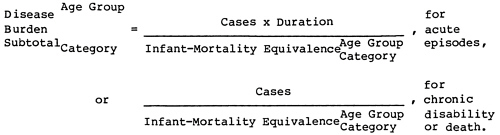
TABLE 4.4 Example of an Individual Scheme of Trade-off Values
|
|
Trade-Off Values |
|||||
|
Morbidity Category |
Description |
Unit |
Under 5 Years |
5–14 Years |
15–59 Years |
60 Years and Over |
|
A |
Moderate localized pain and/or mild systemic reaction, or impairment requiring minor change in normal activities, and associated with some restriction of work activity |
Days |
20,000 |
15,000 |
10,000 |
5,000 |
|
B |
Moderate pain and/or moderate impairment requiring moderate change in normal activities, e.g., housebound or in bed, and associated with temporary loss of ability to work |
Days |
10,000 |
10,000 |
5,000 |
500 |
|
C |
Severe pain, severe short-term impairment, or hospitalization |
Days |
1,000 |
500 |
200 |
100 |
|
D |
Mild chronic disability (not requiring hospitalization, institutionalization, or other major limitation of normal activity, and resulting in minor limitation of ability to work) |
Cases |
100 |
100 |
200 |
200 |
|
E |
Moderate to severe chronic disability (requiring hospitalization, special care, or other major limitation of normal activity, and seriously restricting ability to work) |
Cases |
5 |
5 |
10 |
2 |
|
F |
Total impairment |
Cases |
1 |
1 |
1 |
2 |
|
G |
Reproductive impairment resulting in infertility |
Cases |
5 |
5 |
2 |
100 |
|
H |
Death |
Cases |
1 |
1 |
1 |
1 |
|
|
Deaths adjusted for age group |
1 |
0.5 |
0.3 |
3 |
|
The total score or total disease burden value (TDBV) is then a summation of the subtotals. A sample calculation sheet is shown in Table 4.6.
The views of various individuals on the relative importance of diseases can be compared by ranking diseases based on their TDBVs or by normalizing values so that the highest value represents some arbitrary common number, such as 100.
Prior to presenting the results of the disease burden comparison performed by this committee, some discussion of the method is desirable.
TABLE 4.5 Example of an Individual Scheme of Infant Mortality Equivalence Values
|
|
Infant Mortality Equivalence Values |
|||||
|
Morbidity Category |
Description |
Unit |
Under 5 Years |
5–14 Years |
15–59 Years |
60 Years and Over |
|
A |
Moderate localized pain and/or mild systemic reaction, or impairment requiring minor change in normal activities, and associated with some restriction of work activity |
Days |
20,000 |
7,500 |
3,000 |
15,000 |
|
B |
Moderate pain and/or moderate impairment requiring moderate change in normal activities, e.g., housebound or in bed, and associated with temporary loss of ability to work |
Days |
10,000 |
5,000 |
1,500 |
1,500 |
|
C |
Severe pain, severe short-term impairment, or hospitalization |
Days |
1,000 |
250 |
60 |
300 |
|
D |
Mild chronic disability (not requiring hospitalization, institutionalization, or other major limitation of normal activity, and resulting in minor limitation of ability to work) |
Cases |
100 |
50 |
60 |
600 |
|
E |
Moderate to severe chronic disability (requiring hospitalization, special care, or other major limitation of normal activity, and seriously restricting ability to work) |
Cases |
5 |
2.5 |
3 |
6 |
|
F |
Total impairment |
Cases |
1 |
0.5 |
0.3 |
6 |
|
G |
Reproductive impairment resulting in infertility |
Cases |
5 |
2.5 |
0.6 |
300 |
|
H |
Death |
Cases |
1 |
0.5 |
0.3 |
3 |
Procedures Used in Deriving Disease Estimates
The committee solicited information that would enable estimates to be made in the format shown in Table 4.3 from individuals knowledgeable about particular diseases. If the disease was not one for which the World Health Organization collects information, the committee used other sources. Committee staff integrated information from various sources with the assistance of consultants. Reviews of preliminary estimates were obtained from initial sources and other individuals. Revised estimates were generated on the basis of reviews, with committee members arbitrating if reviewers made conflicting recommendations for modification of preliminary efforts.
Estimates of disease burden for the diseases that are candidates for accelerated vaccine development are included in Appendixes D-1 through D-19. For some of the diseases included in this comparison, only limited data exist on their incidence in developing countries. Estimates sometimes had to be made on the basis of reports from a few
developing countries and the assumption that extrapolation to the entire developing world was reasonably valid.
Certain general procedures and assumptions were adopted to promote consistency in the derivation of estimates:
-
Cases were included under chronic categories (D through G) only if the condition would persist for the remainder of the individual’s life; convalescence or protracted initial illness (even possibly leading to death) from which the individual eventually might recover was not considered chronic disability.
-
To simplify implementation of the scheme, acute episodes of illness usually were assigned entirely to the morbidity category representing the most severe signs and symptoms present, although the episode might include periods of recovery at less severe levels.
-
Category C was interpreted as morbidity for which hospitalization was desirable, even if probably not accessible.
-
For diseases in which the pathogen produces a broad spectrum of illness severity rather than reasonably discrete conditions, estimates of the portions falling into different morbidity categories were obtained from individuals familiar with the disease’s clinical symptoms and epidemiology. In some cases, estimates were made from the most recent epidemiologic surveys of the disease; in other cases previously reported incidence rates were applied to 1984 population figures (Population Reference Bureau, Inc., 1984).
-
It was judged that trends in the patterns of diseases under consideration (see Appendixes D-1 through D-19) were generally not of sufficient magnitude to obscure differences among diseases, that is, that the relative impact of diseases when vaccines were likely to become available would be similar to that in 1984. This is amenable to verification. The effect of trends in population numbers and disease incidence on future vaccine benefits is discussed in Chapter 7. The impact of certain diarrheal diseases (especially mortality) probably will be decreased by the increased use of oral rehydration therapy. Two scenarios are therefore included in the calculations of disease burdens and vaccine benefits for these pathogens; they are described in Appendix C.
-
For epidemic diseases, the approximate average annual incidence was calculated using epidemic incidence and the average length of the inter-epidemic period.
Limitations of the Current Estimates
Limitations on the accuracy of estimates included in Appendixes D-1 through D-19 need to be recognized. The extent to which the estimates represent true disease patterns varies among diseases for the following reasons.
-
The quality and availability of data on specific diseases vary.
-
The types of data from which estimates were made vary. (For some diseases, infection rates for certain populations could be coupled
TABLE 4.6 Example of Total Disease Burden Value Calculations: Hepatitis A Virus
-
with estimates of the proportion of clinically symptomatic infections to yield numbers of cases displaying symptoms. For other diseases, estimates were based on surveillance data, on prospective or retrospective studies in certain populations, or on reported disease incidence.) The reliability of data from such disparate sources varies considerably, even within countries.
-
It is almost universally accepted that, with few exceptions, reliable surveillance data from developing countries are unavailable. (Underreporting or overreporting may occur for many reasons, and it is
|
|
||||||||
|
15–59 Years |
60 Years and Over |
|
||||||
|
Cases |
Duration (days) |
Infant Mortality Equivalence Value |
Subtotal |
Cases |
Duration (days) |
Infant Mortality Equivalence Value |
Subtotal |
Subtotal by Category |
|
|
8,750 |
0 |
|
50,000 |
0 |
0 |
||
|
2,256,561 |
7 |
5,650 |
2,796 |
149,378 |
7 |
25,000 |
42 |
3,133 |
|
1,221,794 |
14 |
2,000 |
8,553 |
206,277 |
14 |
5,000 |
578 |
10,342 |
|
|
n.a. |
30 |
0 |
|
n.a. |
550 |
0 |
0 |
|
|
n.a. |
2.75 |
0 |
|
n.a. |
23.125 |
0 |
0 |
|
|
n.a. |
0.309 |
0 |
|
n.a. |
5 |
0 |
0 |
|
|
n.a. |
16.5 |
0 |
|
n.a. |
300 |
0 |
0 |
|
5,146 |
n.a. |
0.4 |
12,865 |
8,005 |
n.a. |
5 |
1,601 |
16,754 |
|
|
24,213 |
|
2,220 |
30,229 |
||||
-
generally not practical to determine the extent of the error. Therefore, raw data on reported disease incidence were rarely used as a sole basis for disease estimates.)
-
Conditions affecting disease incidence are not uniform. Therefore, the exceptionally broad scope of the attempted estimates and the occasional need to extrapolate data from very few countries or studies to the entire developing world led to numerical estimates of uncertain validity.
-
For certain conditions, the estimates (both absolute numbers
-
and distributions) were based on individuals’ clinical and epidemiological experience and judgment, for which no means of verification existed.
-
The resources and time available to generate estimates were limited.
As noted above, many of the estimates used in this report are highly uncertain. However, the data-based approach presented here can be refined as epidemiological information increases. The committee believes that its method ensures the optimal use of available information and is preferable to qualitative measures (e.g., high, intermediate, or low) or scaling methods (e.g., assigning scores to incidence on a scale of 1 to 10).
The committee cautions that while the current estimates have been judged sufficient for the purposes of this report, efforts to collect additional data on relative disease burdens and to refine estimates from available data would be highly desirable. Discussions of the uncertainty of each disease’s estimates appear in Appendixes D-1 through D-19.
VALUE JUDGMENTS IN QUANTIFYING MORBIDITY AND MORTALITY
The use of infant mortality equivalence (IME) values in quantifying disease burdens (as in Table 4.6) intentionally introduces into the system for comparing diseases a component that reflects variations among individuals on the relative undesirability of disease consequences within and among age groups. Each individual’s perspective is equally valid; hence, there can be no single, correct set of trade-off or IME values.
Several composite or hypothetical perspectives are worth considering, however, because they illustrate how differences in perspectives are reflected in the ultimate rankings of disease burdens and benefits expected from vaccines.
The intent of selecting priorities for accelerated vaccine development is to benefit health—in the case of this report, the health of the populations in developing countries. Hence, the perspectives of medical or public health experts in those countries are of interest. Perspectives of the population at large, the intended beneficiaries, also are important.
If a representative sample from each group (health practitioners or the general populations in developing countries) were polled, the range of trade-offs or IMEs probably would be extensive. It would be possible to calculate a median perspective for the range, but other clusters also might exist. To illustrate, consider the way individuals rate mortality at different ages: while most group members might consider an adult death (15–59 years) more undesirable than an infant death, a fairly large minority might believe just the opposite. Acute morbidity of severity sufficient to interfere with producing food or earning a living might also be relatively highly ranked for undesirability in
developing countries. In comparison, the economic impact of illness on the individual in developed countries is usually less immediate. The aggregation of these preferences is a complex issue both methodologically and ethically and needs careful consideration.
To help set IME values for this report, the committee polled a wide range of public health professionals and medical researchers from regions where developing countries predominate. Time and resource constraints did not permit polling representatives of the general population. The committee recognized that the responses obtained probably did not include the full range of perspectives required by an analysis of this type. However, the composite perspective described below was adopted to illustrate application of the system and to describe the qualitative effects of using different perspectives.
IME Perspective Used in This Study
For IME values in its calculations, the committee used a median of IME perspectives derived from the responses of health professionals in developing countries. Trade-off values elicited from these individuals were distributed over a considerable range.
The median IMEs, shown in Table 4.7, are used here and in Chapter 7 solely to illustrate the operation of the system, not to suggest the most appropriate or correct IME values. Choosing IME values to guide policy formulation is discussed at the end of this chapter.
The Effect of Adopting Other IME Perspectives
Other sets of IME values might reflect the view that morbidity and mortality in young age groups, chronic disability in adults, hospitalizations (at any age), or infertility is relatively more undesirable than expressed by the median perspective. Adopting this perspective would cause diseases inflicting or vaccines preventing a particularly disfavored morbidity or mortality to rise in the rankings of disease importance and vaccine priority. The extent of the rise would depend on the numbers of disfavored cases and the extent to which the relevant IME values differed from the median.
The committee’s first report on vaccine priorities for important diseases in the United States (Institute of Medicine, 1985) compared the effect of adopting the median of committee member perspectives with an age-neutral perspective. In the former perspective, death in the 25–59* years age group was most disfavored (and in the over 60 years age group, the least disfavored), while in the latter perspective, deaths at any age were judged equally undesirable. For the diseases in this study, the ranking was generally similar, but influenza (which causes many deaths in the over 60 years age group) ranked relatively
TABLE 4.7 The Median Infant Mortality Equivalence Values for Respondents from Developing Countries
|
|
Infant Mortality Equivalents |
|||||
|
Morbidity Category |
Description |
Unit |
Under 5 Years |
5–14 Years |
15–59 Years |
60 Years and Over |
|
A |
Moderate localized pain and/or mild systemic reaction, or impairment requiring minor change in normal activities, and associated with some restriction of work activity |
Days |
40,000 |
32,500 |
8,750 |
50,000 |
|
B |
Moderate pain and/or moderate impairment requiring moderate change in normal activities, e.g., housebound or in bed, and associated with temporary loss of ability to work |
Days |
23,713 |
17,500 |
5,650 |
25,000 |
|
C |
Severe pain, severe short-term impairment, or hospitalization |
Days |
2,000 |
2,244 |
2,000 |
5,000 |
|
D |
Mild chronic disability (not requiring hospitalization, institutionalization, or other major limitation of normal activity, and resulting in minor limitation of ability to work) |
Cases |
75 |
62.5 |
30 |
550 |
|
E |
Moderate to severe chronic disability (requiring hospitalization, special care, or other major limitation of normal activity, and seriously restricting ability to work) |
Cases |
5.5 |
5.5 |
2.75 |
23.125 |
|
F |
Total impairment |
Cases |
1 |
0.4 |
0.309 |
5 |
|
G |
Reproductive impairment resulting in infertility |
Cases |
100 |
22.5 |
16.5 |
n.a. |
|
H |
Death |
Cases |
1 |
0.5 |
0.4 |
5 |
higher in the age-neutral perspective. When fetal deaths from ectopic pregnancy were considered equal in undesirability to all other deaths/ gonorrhea also ranked relatively higher in the age-neutral perspective.
The committee derived a second set of IME values for this study based on trade-off questionnaires (see Appendix E) completed by individuals in the United States who are involved in improving health in developing countries. Table 4.8 presents these values. (The committee recognizes that the medians shown in Tables 4.7 and 4.8 were not drawn from statistically valid samples.) Adopting the perspective represented in Table 4.8 rather than Table 4.7 would lower the relative rankings for diseases that primarily cause mild acute morbidity, but would raise the rankings of diseases that cause very severe (total) chronic disability.
Adopting particular IME perspectives is comparable in some ways to ranking diseases or vaccines for particular age groups in the population. For example, an IME perspective that highly disfavors diseases affecting children would emphasize the relative ranking of pediatric
vaccines. Chapter 8 presents further discussion of the grouping of vaccine candidates.
COMPARISON OF COSTS ASSOCIATED WITH DISEASES
Another way to compare candidates for accelerated vaccine development would be to compare the extent to which they would render unnecessary expenditures for treating diseases or avert other disease-related economic losses, for example, lost work productivity, and their cost-effectiveness in doing so. To make such comparisons it is necessary to know (or to obtain reliable estimates on) the costs associated with each disease. The costs incurred in vaccine development and in vaccination programs are discussed in Chapters 5 and 7, respectively.
TABLE 4.8 The Median Infant Mortality Equivalence Values for Respondents from the United States
|
|
Infant Mortality Equivalents |
|||||
|
Morbidity |
Category Description |
Unit |
Under 5 Years |
5–14 Years |
15–59 Years |
60 Years and Over |
|
A |
Moderate localized pain and/or mild systemic reaction, or impairment requiring minor change in normal activities, and associated with some restriction of work activity |
Days |
300,000 |
140,000 |
50,000 |
10,000,000 |
|
B |
Moderate pain and/or moderate impairment requiring moderate change in normal activities, e.g., housebound or in bed, and associated with temporary loss of ability to work |
Days |
80,000 |
10,000 |
4,000 |
100,000 |
|
C |
Severe pain, severe short-term impairment, or hospitalization |
Days |
8,000 |
1,000 |
500 |
10,000 |
|
D |
Mild chronic disability (not requiring hospitalization, institutionalization, or other major limitation of normal activity, and resulting in minor limitation of ability to work) |
Cases |
500 |
80 |
25 |
5,000 |
|
E |
Moderate to severe chronic disability (requiring hospitalization, special care, or other major limitation of normal activity, and seriously restricting ability to work) |
Cases |
5 |
1 |
0.6 |
50 |
|
F |
Total impairment |
Cases |
0.2 |
0.05 |
0.025 |
1 |
|
G |
Reproductive impairment resulting in infertility |
Cases |
300 |
150 |
50 |
n.a. |
|
H |
Death |
Cases |
1 |
0.5 |
0.1 |
10 |
Estimating Aggregate Direct Costs of Diseases in the Developing World
The committee did not attempt to predict the cost associated with treating diseases included in this analysis. It would be extremely difficult and probably unrealistic to estimate, for the developing world as a whole, the proportion of cases, complications, and sequelae that receive treatment; the nature of those treatments; and their average costs. No data exist on these questions, and the committee judged that convening a group sufficiently large to develop reliable estimates of these costs would not be practical.
Estimating Costs for Diseases in Specific Countries or Regions
Although it was not feasible to include disease cost comparisons in this analysis, it might be possible to compare the costs of treating various diseases in a particular region or country in the developing world. The procedures used by the committee to estimate the direct costs (mostly treatment-related) associated with important diseases in the United States can be adopted for this purpose. Those procedures are described fully in the first volume of the committee’s report (Institute of Medicine, 1985). Excluded from those calculations are costs resulting from loss of work, loss of future earnings, and public health measures to prevent further spread of illness (e.g., contact tracing for sexually transmitted diseases).
Indirect Costs
How best to calculate indirect costs associated with disease, such as loss of work time or loss of future earnings, is quite controversial. For its analysis of vaccine priorities for the United States, the committee did not believe that monetization of health benefits was either necessary or appropriate. Reduction of the overall economic burden imposed by certain diseases is definitely an important health goal; however, if these indirect economic aspects of disease burden were included among the costs, then interpretation of the disease burden figures would have to be modified to ensure that health benefits were not double counted (because IMB and trade-off values already incorporate some psycho-social considerations). In contrast, costs associated with contact tracing, quarantine, etc., are not currently reflected in the disease burden figures; these could be addressed in future applications of the model. These considerations are also pertinent to the assessment described in this report.
FINDINGS
Application of the procedures described above to derive burden estimates for the diseases that are candidates for accelerated vaccine
TABLE 4.9 Morbidity and Mortality Burdens Resulting from Various Diseases
|
Disease |
Normalized (percent) |
|
|
Dengue virus |
34,365 |
0.52 |
|
Escherichia coli |
978,248 |
14.79 |
|
|
(550,248)c |
(8.32) |
|
Hemophilus influenzae type b |
471,336 |
7.13 |
|
Hepatitis A virus |
30,229 |
0.46 |
|
Hepatitis B virus |
2,394,256 |
36.21 |
|
Japanese encephalitis virus |
18,075 |
0.27 |
|
Mycobacterium leprae |
657,349 |
9.94 |
|
Neisseria meningitidis |
68,252 |
1.03 |
|
Parainfluenza virus |
145,954 |
2.21 |
|
Plasmodium spp. |
2,111,795 |
31.94 |
|
Rabies virus |
67,821 |
1.03 |
|
Respiratory syncytial virus |
183,326 |
2.77 |
|
Rotavirus |
925,042 |
13.99 |
|
|
(488,542)c |
(7.39) |
|
Salmonella typhi |
1,308,121 |
19.78 |
|
Shigella spp. |
828,068 |
12.52 |
|
Streptococcus Group A |
811,477 |
12.27 |
|
Streptococcus pneumoniae |
6,612,261 |
100.00 |
|
Vibrio cholera |
229,217 |
3.47 |
|
Yellow fever virus |
32,887 |
0.50 |
|
aSee Appendixes D-1 through D-19 for derivations of disease burden estimates used to calculate TDBVs. bInfant mortality equivalence units. cValues in parentheses represent the anticipated disease burden from certain diarrheal pathogens if a plausible increase in oral rehydration therapy is assumed (see Appendix C). |
development is described in Appendixes D-1 through D-19. Various assumptions were entailed in deriving such estimates. Table 4.9 shows the total disease burden values calculated for each disease (using disease burden estimates and the median of perspectives from public health professionals in developing countries). Use of these total disease burden values to rank the diseases is demonstrated in Table 4.10.
Chapter 7 describes application of the disease comparison system to the calculation of potential health benefits from candidate vaccines.
LIMITATIONS OF THE PROPOSED SYSTEM
The proposed system assesses the most obvious feature of infectious diseases, morbidity, and mortality. The aggregate nature of the total
TABLE 4.10 Ranking of Diseases by Total Disease Burden Values
|
Disease |
Total Disease Burden Value (IME units)a |
|
Streptococcus pneumoniae |
6,612,261 |
|
Hepatitis B virus |
2,394,256 |
|
Plasmodium spp. |
2,111,795 |
|
Salmonella typhi |
1,308,121 |
|
Escherichia coli |
978,248 |
|
Rotavirus |
925,042 |
|
Shigella spp. |
828,068 |
|
Streptococcus Group A |
811,477 |
|
Mycobacterium leprae |
657,349 |
|
(Escherichia coli) |
(550,248)b |
|
(Rotavirus) |
(488, 542)b |
|
Hemophilus influenzae type b |
471,336 |
|
Vibrio cholera |
229,217 |
|
Respiratory syncytial virus |
183,326 |
|
Parainfluenza virus |
145,954 |
|
Neisseria meningitidis |
68,252 |
|
Rabies virus |
67,821 |
|
Dengue virus |
34,365 |
|
Yellow fever virus |
32,887 |
|
Hepatitis A virus |
30,229 |
|
Japanese encephalitis virus |
18,075 |
|
aInfant mortality equivalence units. bValues represent the anticipated disease burden from certain diarrheal pathogens if a plausible increase in oral rehydration therapy is assumed (see Appendix C) . |
|
disease burden value for each disease may be regarded by some as obscuring important differences among disease consequences. Although they are assigned to the same generic morbidity category, some disease conditions may be regarded as more severe (more undesirable) than those of another disease. This problem exists with any category system; to assign trade-off (or IME) values to the whole spectrum of conditions arising from all diseases would be too complex and unmanageable.
Additionally, the system does not, as presently conceived, permit differentiation of diseases on the basis of episode duration. That is, it does not indicate whether hospitalization of 100 individuals for 2 days each is more or less desirable than 1 individual for 200 days, or 10 individuals for 20 days.
Other disease characteristics not recognized by the proposed system include the following:
-
The epidemic potential of the disease: the average annual incidence is used for comparative purposes, but certain epidemic
-
diseases may overwhelm available medical services and engender particular concern in the at-risk populations.
-
The potential for synergistic interaction with other diseases: the committee evaluated the possibility of incorporating into the disease burden estimates of the effects of known synergism, such as between diarrheal disease and measles. The committee concluded that current knowledge of these phenomena did not permit reliable quantification of their consequences, but that they should be recognized in the ultimate selection of priorities.
These issues are discussed further in Chapter 8.
Problems in obtaining accurate estimates of disease incidence and difficulties in deciding which IME perspectives to adopt also limit the usefulness of the system. Nevertheless, the system has the potential to be a useful tool for selecting priorities for accelerated vaccine development. Recommendations that might remedy some of the problems are made below.
SUMMARY AND CONCLUSIONS
The system described in this chapter allows quantitative comparison of the morbidity and mortality caused by various diseases. It takes into account specific information about each disease (number of cases, complications, sequelae, deaths) and can accommodate various perspectives on the undesirability of various disease consequences.
To illustrate use of the proposed system, diseases that are candidates for accelerated vaccine development have been ranked according to a median of trade-off perspectives elicited from public health experts in developing countries. The effects of adopting alternative perspectives are also discussed. Considerable uncertainty surrounds some of the estimates of disease burdens because data of the desired reliability are not available.
No attempt has been made to calculate the costs of treating diseases in the developing world as a whole because of the many uncertainties involved in such aggregate estimates. However, the committee believes that estimates of total direct costs for certain diseases could be used to help set vaccine priorities in specific countries or regions of the developing world.
RECOMMENDATIONS
The capacity to make rational choices of vaccine development priorities and vaccine formulation would be enhanced by better information on disease incidence and the pathogen serotypes prevalent in particular regions. Therefore, the National Institute of Allergy and Infectious Diseases and other national and international agencies should consider ways to improve the epidemiologic information on infectious diseases.


