
CHAPTER 2
THE SELECTION PROCESS
Underparticipation of minorities in graduate education has long been an issue of concern. 4 During the 1978-1988 period, there were increases in both the absolute numbers and shares of doctorates awarded to Native Americans, Asian-Americans, and Hispanics; however, the number and share of doctorates awarded to blacks declined. 5 As a result, blacks made up only 1 percent of the 1990 natural science and engineering doctorate recipients; the comparable statistic for the social sciences was almost 4 percent.
In an attempt to improve minority participation, the National Science Foundation in 1978, began setting aside 10 percent of its fellowships for a program targeted at U.S. citizens who are black, Native American, Puerto Rican, Native Alaskan, or Mexican-American (hereafter termed “minority”). The Minority Graduate Fellowship Program (MGFP) is run independently from the older Graduate Fellowship Program (GFP). It has its own applications, panels, and fellowships. 6 In the first year of operation (1978),
the MGFP was administered by historically black colleges and universities (HBCUs). 7 In 1979 its administration was moved to the National Research Council (NRC).
The MGFP is open to all minority U.S. citizens who plan to study science or engineering. 8 These applicants are required to hold (or be near completing) a bachelor’s degree in science or engineering; however, they cannot have more than 20 semester hours of graduate study in science or engineering to be eligible. In general, applicants are college seniors and first-year graduate students in science or engineering.
The application process consists of an application form, a proposed plan of study and research, previous research experience, academic transcripts, letters of reference from mentors/faculty, and Graduate Record Examination (GRE) scores. In the fall of each year, applications are submitted to the NRC. The NRC undertakes an initial screening to ensure that all applicants meet eligibility requirements (e.g., existing graduate study credit, ethnicity, field of study, citizenship). Eligible applications are then reviewed in March by panels of scientists and engineers who rank them on the basis of the applicant’s study plan, academic records, recommendations, and GRE scores. These panels are organized by broad field of study.
The final product of the panels is a grouping of applications into six Quality Groups. Group 1 applicants are those judged to be the most promising scholars. Group 2 and 3 applicants are judged to be strong scholars worthy of financial support.
Applicants receive notifications of the outcome of their applications in March. NSF offers fellowships to all Group 1 applicants and approximately one-half of Group 2 applicants, chosen using secondary criteria such as geographical region, gender, discipline, and other factors consistent with policy and legislative intent. Applicants in Groups 3 through 6 receive no fellowship offers; however, Group 2 nonawardees and all Group 3 applicants receive “honorable mention,” which enhances their applications to graduate school and for other forms of support. Fellowships that are declined are not offered to other applicants. Given that a significant number of fellowship offers are declined, this practice may merit further consideration.
Characteristics of Applicants
Table 2-1 summarizes the overall distribution of applicants by race/ethnic group. Two-thirds of the 1,361 applicants in 1979-1981 were black. Roughly three-tenths were Hispanic (roughly two-tenths Puerto Rican and one-tenth Mexican-American), and the remaining applicants were Native Americans.
TABLE 2-1. Distribution of Applicants to the NSF Minority Graduate Fellowship Program by Race/Ethnic Group, 1979-1981 Cohort
|
American Indian/Alaskan |
4.1 |
|
Black |
66.5 |
|
Mexican-American |
10.7 |
|
Puerto Rican |
18.7 |
|
Total |
|
|
Number |
1,361 |
|
Percent |
100 |
|
SOURCE: Cumulative Index of NSF Fellowship Applicants and Awardees. |
|
TABLE 2-2. Descriptive Statistics, 1979-1981 NSF Minority Graduate Fellowship Program Applications by Ethnicity
|
Category |
Am. Ind. Alaskan |
Black |
Mexican-American |
Puerto Rican |
Total |
|
Total Applications |
56 |
905 |
146 |
254 |
1361 |
|
APPLICANTS WITHIN RACE/ETHNIC GROUPS |
|||||
|
Female |
44.6% |
54.9% |
30.8% |
42.9% |
49.6% |
|
In EMP |
28.6% |
29.5% |
32.2% |
40.6% |
31.8% |
|
In Life Sci |
32.1% |
27.1% |
30.1% |
34.3% |
29.0% |
|
In Soc/Beh Science |
39.3% |
43.4% |
37.7% |
25.1% |
39.2% |
|
From Historically Black Institutions |
1.8% |
33.6% |
0.0% |
0.0% |
22.4% |
|
MEAN VALUES |
|||||
|
Age |
27.0 |
25.2 |
25.2 |
24.1 |
25.0 |
|
Quantitative GRE |
545 |
469 |
562 |
524 |
493 |
|
Verbal GRE |
510 |
434 |
519 |
429 |
446 |
|
GPA |
3.18 |
2.96 |
3.18 |
3.30 |
3.07 |
|
Years since B.A. |
2.4 |
3.0 |
2.6 |
2.7 |
2.9 |
|
SOURCES: Cumulative Index of NSF Fellowship Applicants and Awardees; Doctorate Records File. |
|||||
The following differences were found among minority groups (Table 2-2):
-
There was notable variability in the distribution of applicants by gender. Female applicants represent 55 percent of all black applications, but only 31 percent of applications were from Mexican-Americans.
-
Within minority groups the largest number of applicants generally applied for awards in the behavioral and social sciences. 9
-
About one-fifth of the minority applicants were from HBCUs. Obviously, this source was quite important for black applicants (one-third of whom were from HBCUs).
-
The average age of the applicants ranged from 24.1 for Puerto Ricans to 27.0 for Native Americans--several years older than the typical age of college graduates.
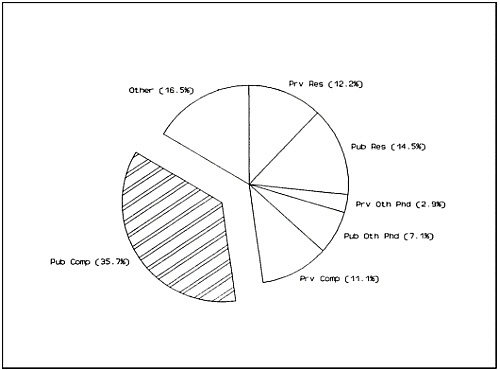
Figure 2-1. Percent distribution of applicants by Carnegie Classification * and institutional control, 1979-1981.
SOURCE: Table A-1.
Note: *The Carnegie Classification groups academic institutions into four broad categories based on the level of degree offered, the amount of federal monies awarded for research, and the comprehensiveness of mission: research university; doctorate-granting university; comprehensive universities and college and liberal arts colleges. For details, see Carnegie Classification of Institutions of Higher Education, (Princeton, NJ: The Carnegie Foundation for the Advancement of Teaching, 1987).
-
The quantitative and verbal GRE scores and undergraduate grade point averages (GPAs) of black applicants were, in general, substantially below those of the other ethnic groups. 10 Mexican-American applicants had the highest GRE scores, while Puerto Ricans had the highest GPAs.
-
Consistent with the data on mean age, applicants applied for support approximately 2.5 to 3 years after receipt of their baccalaureate degree, with the gap between graduation and application largest for blacks.
-
Public institutions were the largest source of applicants, representing almost three-fifths of all applicants (Figure 2-1). Within public institutions comprehensive universities were the dominant source, supplying over
TABLE 2-3. Cumulative GRE Scores of Applicants by Field and Gender, 1979-1981 Cohort
|
|
Males |
Females |
|
EMP |
1,052 |
967 |
|
Life Sci |
952 |
870 |
|
Behav Sci |
913 |
879 |
|
SOURCE: Cumulative Index of NSF Fellowship Applicants and Awardees. |
||
-
one-third of the total applicants. 11 But there is substantial variation in the importance of this source among race/ethnic groups. Roughly three-fifths of the black applicants were from these institutions, compared to about one-fourth of the Puerto Ricans.
-
Applicants applying for graduate support in engineering, mathematics, and physical sciences had the highest cumulative GRE scores (Table 2-3), followed by applicants for the life sciences. Applicants for behavioral and social sciences had the lowest average scores. Within fields the average scores of male applicants were consistently higher than the scores of female applicants.
Awardees
Figure 2-2 summarizes the award rate of applicants (i.e., the percentage of applicants who were offered awards). Roughly one in six applicants (16 percent) is offered an award. Like applicants, however, this average masks variations among race/ethnic groups. Only 14 percent of black applications resulted in fellowship offers, compared with 31 percent for Mexican-Americans. Puerto Ricans experienced success rates closer to those of black applicants (16 percent), while Native Americans had rates closer to Mexican-Americans (27 percent). In part, these race/ethnic differences in award rates reflect the race/ethnic differences in GRE scores and GPAs summarized earlier. 12
|
11 |
Part of the explanation behind the dominance of comprehensive universities as “feeders” to the MGFP is that this class of institution contains the majority of HBCUs. Of all HBCU applicants, 70.8 percent had B.A.s from comprehensive colleges and universities; this was weighted heavily toward public institutions (48.5 percent). |
|
12 |
See Table 2-2. |
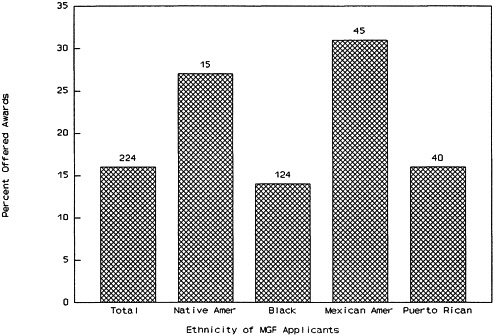
Figure 2-2. Percent of 1979-1981 applicants offered awards, by race/ethnic group.
SOURCE: Appendix Table A-2 .
Note: The number of awards is shown above the bar.
Field Differences in Recruitment and Offers
There is close correspondence between applications and offers by field 13 ( Figure 2-3 ). This implies that the number of awards by field is driven largely by the number of applications by field. However, fields varied in their ability to attract applications from the new baccalaureate population. Using the field distribution of baccalaureates as the basis of comparison, life sciences and EMP were more successful than the behavioral and social sciences in attracting female applicants. The results are essentially the same for male applicants, except for EMP fields, where there is a closer correspondence between baccalaureates and applicants.
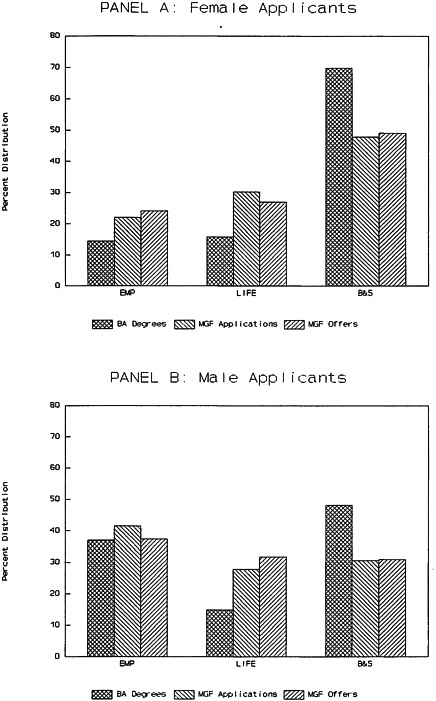
Figure 2-3. Percent distribution of applications, fellowship offers and B.A. degrees, by gender and field, 1979-1981.
SOURCE: Appendix Table A-3.
TABLE 2-4. Characteristics of MGFP Applicants Who Were Offered Fellowships, by Field, 1979-1981
|
|
Soc&Beh (N=58) |
EMP (N=38) |
Life (N=39) |
|
Characteristic |
|||
|
Total (%) |
12.4 |
26.1 |
7.6 |
|
Percent BA from Private Research 1 |
13.3 |
50.0 |
0.0 |
|
Percent BA from Private Institution |
14.7 |
33.3 |
0.0 |
|
Mean Quantitative GRE |
485 |
701 |
558 |
|
Mean Verbal GRE |
522 |
592 |
500 |
|
Females |
13.7 |
16.7 |
7.4 |
|
Mean Age |
25.0 |
23.1 |
23.2 |
|
Percent of Quality Group 1 |
10.5 |
34.4 |
6.9 |
|
Percent of Quality Group 2 |
14.0 |
18.9 |
8.1 |
|
SOURCES: Cumulative Index of NSF Fellowship Applicants and Awardees; Doctorate Records File. |
|||
Field Differences in Characteristics of Offerees
Table 2-4 compares characteristics of all offerees by field. Offerees in the EMP fields (which had the highest declination rates) are markedly different from offerees in the other fields. A higher percentage are from Group 1; they have higher average GRE scores, and relatively more are from private universities.
Effects of GRE Scores on Offers
Figure 2-4 displays the percentage of applications that resulted in fellowship offers by gender and Quantitative GRE (QGRE) score. It reveals the following:
-
A significant positive association exists between the QGRE score and the proportion of applicants offered a fellowship.
-
Given quantitative scores, females on average were more likely to receive an offer than males.
-
Fellowship offers were made to some applicants with low scores.
-
Some applicants with high scores did not get offers.
The latter two findings reflect the impact of factors other than GRE scores on the award decisions made by the panels.
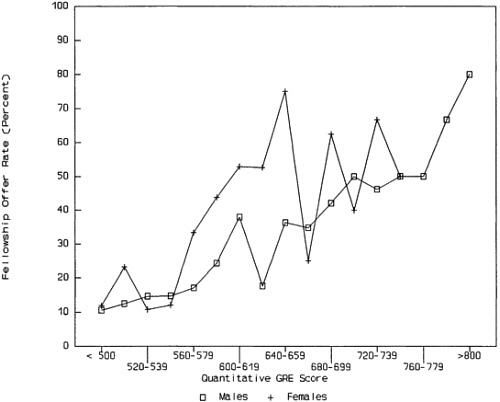
Figure 2-4. Proportion of applicants who received fellowship offers by gender and quantitative GRE score, MGFP, 1979-1981.
SOURCE: Appendix Table A-4 .
Award Rates by Type of Baccalaureate Institution
In this section the association between undergraduate institution and applicant success is explored. How successful were the graduates of different types of baccalaureate institutions in getting fellowship offers? Figure 2-5 summarizes award rates (proportion of applications resulting in fellowship offers) by B.A. institution type. Private Research 1 university applicants had the highest rates. Within each Carnegie Classification, applicants from private colleges and universities were generally more successful in obtaining fellowship offers than applicants from public institutions. 14
|
14 |
The major exception to this is the “other” classification; this is due mainly to the very small number of applications from private B.A. institutions in this classification (see Appendix Table A-9 ). |
|
Special Focus: Sources of Applicants (Baccalaureate Institutions) Where did MGFP applicants come from? Listed below are the top institutions, in rank order by the number of 1979-1981 applicants and awardees:
Major research universities and predominantly minority institutions (including HBCUs) are equally represented among the top 10 producers of applicants. Of particular interest is the success of the University of Puerto Rico in Rio Piedras: 60 of the applications to the MGFP during this period listed it as their baccalaureate institution; this crop of applicants resulted in 9 fellows, more than any other undergraduate institution. |
||||||||||||||||||||||||||
|
Special Focus: Most Popular Graduate Programs for MGFP Awardees Where did MGFP awardees choose to attend graduate school? Listed below are the top institutions selected by MGFP awardees during the 1979-1981 period:
Awardees from the MGFP opt to attend institutions with strong research programs. |
||||||||||||||
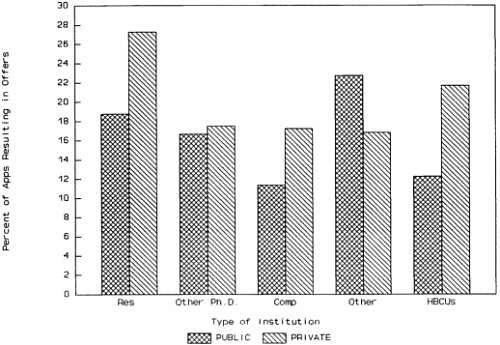
Figure 2-5. Proportion of applicants who received fellowship offers by type and control of B.A. institution, 1979-1981.
SOURCE: Appendix Table A-1.
Historically Black Colleges and Universities
Because almost two-thirds of the applicants to the MGFP were black, the importance of HBCUs as sources of these applicants is large. Given their importance, how successful were the applicants who received their undergraduate training at these institutions? Overall, HBCU graduates were less successful in obtaining fellowship offers than black applicants with B.A.s from non-HBCUs ( Figure 2-6 ). This difference is particularly large in the EMP fields, where only 7 percent of black applicants from HBCUs were offered fellowships, compared with 19 percent of other black applicants. 15
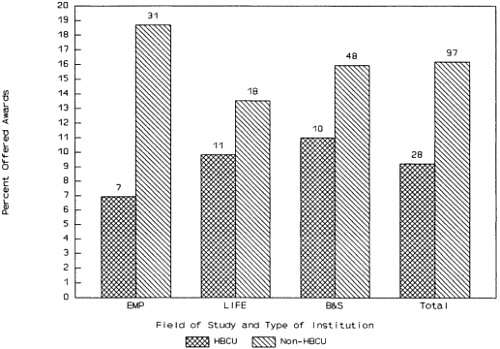
Figure 2-6. Proportion of black applicants who were offered awards, by field and type of institution.
SOURCE: Appendix Table A-5.
Declinations
Not all applicants who are offered a fellowship accept it. One would expect the declination rate (the percentage of fellowship offers that are refused) to reflect, among other factors, the attractiveness of graduate study as an NSF fellow relative to other alternatives. Factors that could affect the declination rate include the potential earnings from immediate employment, the size of the NSF fellowship stipend, the attractiveness of alternative means of graduate study support, the employment characteristics of the graduate field of study (e.g., expected salary, grant availability, prestige of university position), expected probability of completing the Ph.D., and the time to complete the Ph.D. The state of the Ph.D. labor market at that time could also affect declination rates in all fields. Because many of these factors vary across fields of proposed study and applicant characteristics, one would expect declination rates to also vary across fields.
Figure 2-7 displays declination rates for offerees by major field and gender for the period 1978-1981. Overall, these rates are notably higher than comparable rates in the
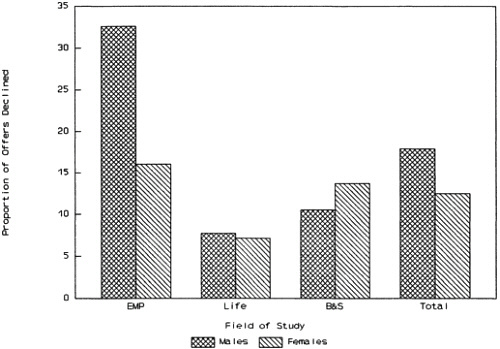
Figure 2-7. Declination rates* by field and gender for MGFP program, 1979-1981.
SOURCE: Appendix Table A-6.
Note: *Declination rates are equal to 100 minus acceptance rates.
GFP. 16 Within the MGFP, declination rates are highest in the EMP fields and lowest in the life sciences. One-third of the males and one-sixth of the females offered fellowships in engineering, math, and physical sciences declined them.
Are those who decline fellowships going on to graduate school under other means of support? Since almost one in five of the declinees in EMP fields--but none in other fields--acquired a doctorate eventually, one can infer that some of the EMP declinees went to graduate school, presumably with other sources of support. One cannot infer the converse for declinees in other fields, however; the fact that none of these declinees has yet acquired a Ph.D. does not necessarily lead to the conclusion that none went to graduate school. Further research will be required to refine our understanding of the reasons for these declinations and whether high rates of declination persisted among more recent offerees.


