
4
ASSESSMENT
The central task of this study was to provide a critical evaluation of the CMAQ program. The committee was charged to investigate whether projects funded under the program are effective and cost-effective, how they compare with alternative strategies for achieving the program’s air quality goals, and whether the program offers other benefits that cannot be quantified. The results of this assessment are described in this chapter. In the first section, what is known about the cost-effectiveness of CMAQ-eligible projects and alternative strategies for pollution reduction is reviewed; a discussion of how the results of this review should be interpreted is included. This section draws heavily on the two papers commissioned for this study—one that reviews the literature on the cost-effectiveness of transportation-related strategies eligible for CMAQ funding (Appendix E) and another that examines the literature on the cost-effectiveness of non-CMAQ-eligible control strategies, particularly new-vehicle emission and fuel standards (Appendix F). In the second section, an assessment of some of the more difficult-to-measure, qualitative outcomes of the program is presented, drawing primarily on the case studies and briefings provided to the committee. The chapter ends with a summary of key findings drawn from this assessment.
COST-EFFECTIVENESS OF CMAQ PROJECTS AND ALTERNATIVE POLLUTION CONTROL STRATEGIES
In theory, it would be desirable to examine both the effectiveness and cost-effectiveness of projects funded under the CMAQ program. Effectiveness is a measure of the scale or magnitude of project
impacts, whereas cost-effectiveness is an efficiency measure that quantifies the cost of achieving a unit of project effectiveness.1
Measuring the relative effectiveness of actual CMAQ projects did not prove feasible. The available data on the effectiveness of CMAQ projects are location specific; project data are valid only for the particular context and strategy involved. Sufficient data were not available on the effectiveness of similar strategies in several regions, making it difficult to generalize from particular project results or to compare types of projects systematically.
The committee decided to examine the literature for data on similar types of projects—primarily transportation control measures (TCMs)—and focused its review on project cost-effectiveness as requested in its charge. The committee selected cost per ton of emissions reduced as the primary cost-effectiveness measure by which to compare the pollution reduction potential of various strategies. The committee would have preferred as an effectiveness measure an indicator of the exposure of affected populations to various pollutant concentrations, and as a cost measure the total tangible and intangible costs to all segments of society, including both government agencies and users. A simple illustration explains why. Moving the position of exhaust stacks on public buses could reduce the exposure of affected populations, particularly those inside the bus, to particulate emissions, even though it would not change emission levels (Rodes et al. 1998). Thus, the project would show a positive impact if reducing exposure were used as the effectiveness measure, but it would have a neutral impact if reducing emissions were used. Unfortunately, the necessary data on neither exposure nor social costs were available. Moreover, the data on emissions were limited. Most of the studies report emission reductions for volatile organic compounds (VOCs) and nitrogen oxides
(NOx), but not for carbon monoxide (CO) or particulate matter (PM10). The inclusion of these pollutants could change the relative ranking of projects on cost-effectiveness, as discussed later in the chapter. In addition, most of the results of the project evaluations are based on modeled estimates of emission reductions instead of on reductions measured after project implementation.
The literature was also examined for data on the cost-effectiveness of reducing congestion, using decreased hours of delay as a measure of effectiveness. However, the effects of CMAQ projects on travel delay have rarely been measured, so it was not possible to determine their cost-effectiveness in reducing congestion. CMAQ projects may have effects other than pollution and congestion reduction (e.g., mitigating adverse ecological effects of pollution, stimulating economic development), but a lack of well-developed performance measures and the data needed to quantify them precluded attempts to analyze such effects.
Analysis Approach
The papers commissioned for this study review the literature on the cost-effectiveness of a wide range of mobile source pollution control strategies (see Table 4-1). For CMAQ-eligible measures, the national CMAQ database was consulted to identify the primary strategies for which funds have been obligated over the life of the program. Particular attention was paid to transit and traffic flow improvement projects because the majority of CMAQ funds have been obligated in these two categories (see Chapter 3). Project subcategories were identified, and to the extent possible, similar strategies were grouped for analysis. The database was also explored as a source of information on the cost-effectiveness of CMAQ projects. As discussed earlier, states are required to report annually on the funds obligated and the estimated emissions reduced for each relevant pollutant for each CMAQ-funded project. However, given the lack of consistency in methods for estimating either project costs or emission reductions, the database was not deemed suitable for use in cost-effectiveness analyses.2
The non-CMAQ-eligible pollution control strategies reviewed were focused primarily on mobile source measures, mainly new-vehicle
|
2 |
See more detailed discussion in Appendix C. |
TABLE 4-1 Mobile Source Pollution Control Strategies and Potential Impacts Analyzed for This Study
|
Pollution Control Strategy |
Potential Impacts |
|
|
Travel Response |
Emission Reduction |
|
|
CMAQ-eligible |
||
|
Transit improvements |
Yes |
Yes |
|
Traffic flow improvements |
Yes |
Yes |
|
Ridesharing programs |
Yes |
Yes |
|
Travel demand management programs |
Yes |
Yes |
|
Telecommute/telework programs |
Yes |
Yes |
|
Bicycle and pedestrian improvements |
Yes |
Yes |
|
Vehicle inspection and maintenance programs |
No |
Yes |
|
Conventional- and alternative-fuel vehicle programsa |
No |
Yes |
|
Pricing measuresb |
Yes |
Yes |
|
Non-CMAQ-eligible |
||
|
New-vehicle emission standards |
No |
Yes |
|
Clean conventional and alternative fuels |
No |
Yes |
|
Vehicle scrappage programs |
No |
Yes |
|
Remote sensing |
No |
Yes |
|
a The purchase of publicly owned alternative-fuel vehicles and related fueling facilities and the incremental cost of upgrading privately owned vehicle fleets to alternative fuels are the only CMAQ-eligible expenditures in this category (FHWA 1999, 13). b Some pricing strategies are not CMAQ-eligible. |
||
emission and fuel standards.3 The cost-effectiveness of stationary source emission control measures, such as controls on electric power plants, was also reviewed in response to the congressional request. The committee recognized the need for as much consistency as possible between the two papers in the treatment of cost-effectiveness calculations. Thus, similar methods were adopted by the authors for addressing such issues as the handling of multiple pollutants and related weighting factors and the treatment of emissions and costs for multiyear projects. Several rounds of revisions were undertaken to make the methods as comparable as possible. Both authors were
also charged with discussing the sources and extent of uncertainty for each class of strategy reviewed.
The methodological adjustments made are discussed in detail in the papers; only the highlights are mentioned here. One important issue is the selection of a baseline from which the emission reductions are estimated. For example, older studies that report on strategies designed to reduce hydrocarbons tend to show larger emission reductions because recent federal engine and fuel standards have greatly reduced emissions of these pollutants, as reflected in the lower emission rates of the current vehicle fleet. Combining the results of recent and more dated studies thus distorts cost-effectiveness estimates. The authors tried to minimize this problem by selecting more recent studies that cover roughly comparable time frames.
Another important issue relates to the handling of multiple pollutants. Although some mobile source emission control measures are focused on a particular pollutant, many affect multiple pollutants. To improve comparability among control measures, the authors adopted a uniform approach for combining and weighting pollutants for which data were available—VOCs and NOx—in deriving a single cost-effectiveness estimate.4 Sensitivity analyses were then conducted using different weighting schemes to test the stability of the results.
Virtually all the studies reviewed rely on emissions models or model inputs to estimate emission reductions.5 Although emissions models have been improved, they have generally tended to overestimate emission reductions. For example, a recent evaluation of inspection and maintenance (I&M) programs (NRC 2001) revealed that many of the programs have not been structured to meet their potential; the actual emission reductions attributable to them range from zero to about one-half of the reductions predicted
by the models.6 There was no way of addressing the problem of uncertainties introduced by the models except to acknowledge them.
The committee was aware of the shortcomings of cost-effectiveness analysis. Therefore, as discussed later in the chapter, its response to the congressional request for such an analysis includes explanations of the many uncertainties and qualifications associated with the results.
Results
Cost-Effectiveness of CMAQ-Eligible Strategies
As noted earlier, the majority of CMAQ-eligible strategies reviewed for this study were TCMs, measures that affect vehicle emissions indirectly by changing travel behavior. The two exceptions are vehicle I&M programs and alternative-fuel vehicle projects.7 Both of these strategies affect vehicle emissions directly—the former through identification and repair of vehicles that do not meet a threshold level of emission control, and the latter through replacement of conventional-fuel vehicles with those burning cleaner fuels. Introduced in the early 1970s, TCMs include both supply-side strategies designed to improve traffic management and demand-side strategies intended to manage travel demand through such measures as encouraging higher vehicle occupancies; reducing trips and travel, at least during peak hours; and providing nonmotorized forms of transportation (Apogee Research, Inc. 1994, 1; Meyer 1999, 576).
Unfortunately, the long history of TCM implementation is not matched by a strong track record of evaluating the effectiveness or cost-effectiveness of the strategies employed. After considerable research in the late 1970s and early 1980s, little work was done until interest in TCMs as a way of controlling mobile source emissions was renewed by the 1990 Clean Air Act Amendments (CAAA), the 1991 Intermodal Surface Transportation Efficiency Act (ISTEA), and the CMAQ program in particular (GAO 1993, 7). Since that time,
evaluation studies have been conducted, ranging from assessments of individual strategies to more comprehensive literature reviews, but the state of the art is not well suited to measuring the effects of TCMs, particularly those on emissions and air quality.8 With some exceptions, the effects of TCMs are highly localized; many tend to have modest impacts—on the order of 1 percent or less—when examined from a regional perspective or over long time periods (Cambridge Systematics, Inc. 2000, xx; Ferguson 2000, 288). Most analysis tools, such as travel demand models and emissions models, are not well suited to analysis of subregional effects (Ferguson 2000, 289). As a result, the imprecision of current models is apt to be larger than the effects of the TCMs they are used to estimate (Cambridge Systematics, Inc. 2000, xx).9 Finally, there has been little postimplementation evaluation of TCMs to ascertain whether model-predicted travel and emission effects have actually been realized.
The studies selected for this review are recent and methodologically sound and have complete data; only a modest number of studies meet these criteria. The range of results, from the lowest to the highest cost per ton of emissions reduced as reported in the literature and adjusted by the author for consistency, is presented for each strategy in Figure 4-1 and Table 4-2. To make it possible for the cost-effectiveness information to be matched with program expenditures for each strategy, Table 4-2 also indicates the amount of CMAQ obligations expended to date for each strategy analyzed, drawing on data collected from the FHWA CMAQ database (see Appendix C)
|
8 |
See Ferguson (2000, Chapter 16) for a review of many key studies since 1978, and also the bibliography in Appendix E, which cites many of the more recent studies. |
|
9 |
Difficulties involved in detecting the emissions effects of many TCMs also help explain why it was not possible for this study to take the next step of analyzing the ambient air quality effects of most TCMs. A recent review (Cambridge Systematics, Inc. 2000, xx) notes that control measures must reach a threshold level of emission reduction—generally greater than about 10 percent—before statistical approaches can successfully discern effects on ambient air quality levels, a threshold well beyond most CMAQ-eligible TCMs. In addition, even if controls meet the higher threshold, detecting the effects on secondary pollutants, such as ozone or fine particulates, is considerably more difficult than detecting changes in primary pollutants, such as CO. |
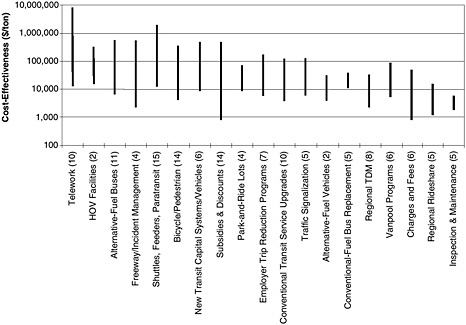
FIGURE 4-1 Range of cost-effectiveness results (dollars per ton) for CMAQ-eligible strategies (in 2000$, VOC-equivalent emission reductions). Note: HOV = high-occupancy vehicle; TDM = travel demand management. (Source: Appendix E.)
TABLE 4-2 Summary of Cost-Effectiveness of CMAQ-Eligible Projects by Strategy (VOC-equivalent emission reductions)
|
CMAQ Project Category |
Number of Projects |
Cost-per-Ton Range (2000$) |
Fiscal Year 1992–1999 CMAQ Obligations (%) |
|
|
Low |
High |
|||
|
Traffic flow improvements |
33.1 |
|||
|
Traffic signalization |
5 |
6,000 |
128,000 |
8.5 |
|
Freeway/incident management |
4 |
2,300 |
544,000 |
8.1 |
|
HOV facilities |
2 |
15,700 |
337,000 |
4.6 |
|
Intersections, traveler info., other |
0 |
NA |
NA |
11.9 |
|
Ridesharing |
3.8 |
|||
|
Regional rideshare |
5 |
1,200 |
16,000 |
|
|
Vanpool programs |
6 |
5,200 |
89,000 |
|
|
Park-and-ride lots |
4 |
8,600 |
70,700 |
1.4 |
|
Travel demand management |
2.9 |
|||
|
Regional TDM |
8 |
2,300 |
33,200 |
2.1 |
|
Employer trip reduction programs |
7 |
5,800 |
176,000 |
0.8 |
|
Telework |
10 |
13,300 |
8,230,000 |
0.0 |
|
Bicycle/pedestrian |
14 |
4,200 |
345,000 |
3.2 |
|
Transit improvements |
28.3 |
|||
|
Shuttles, feeders, paratransit |
15 |
12,300 |
1,970,000 |
7.4 |
|
New capital systems/vehicles |
6 |
8,500 |
471,000 |
12.0 |
|
Conventional service upgrades |
10 |
3,800 |
120,000 |
7.4 |
|
Park-and-ride lots |
1 |
56,000 |
56,000 |
1.5 |
|
Fuels and technology |
20.6 |
|||
|
Conventional-fuel bus replacementsa |
5 |
11,000 |
39,900 |
12.7 |
|
Alternative-fuel busesb |
11 |
6,700 |
569,000 |
3.1 |
|
Alternative-fuel vehiclesc |
2 |
4,000 |
31,600 |
0.6 |
|
Inspection and maintenanced |
5 |
1,800 |
5,800 |
4.2 |
|
Other |
2.8 |
|||
|
Rail freight |
0 |
NA |
NA |
0.4 |
|
Paving and sweeping (PM) |
0 |
NA |
NA |
0.9 |
|
All other improvements |
0 |
NA |
NA |
1.5 |
|
STP/CMAQe |
5.4 |
|||
|
Pricing |
0.0 |
|||
|
Subsidies and discounts |
14 |
800 |
471,000 |
0.0 |
|
Charges and fees |
6 |
800 |
49,400 |
0.0 |
|
Total |
100.0 |
|||
|
Note: The following pollutant weighting scheme was assumed: 1:4 for VOC:NOx. NA = not available; HOV = high-occupancy vehicle; TDM = travel demand management. a Replacement of diesel buses with newer-vintage diesel buses. b Replacement of diesel buses with alternative-fuel buses. c Non-transit-vehicle fleet conversions to alternative fuels. d A recent report (NRC 2001) reveals that the actual effectiveness of many I&M programs fell short of model predictions. e CMAQ funds that can be used for either CMAQ or Surface Transportation Program projects; project categories are undefined. Source: Appendix E. |
||||
from the inception of the program to fiscal year 1999, the most recent year for which national data were available. Table 4-3 displays the results by cost-per-ton increments to illustrate the dispersion (or concentration) of results by strategy.
Using a threshold of approximately $10,000 per ton of emissions reduced10—the cutoff point used for selecting control measures under many regulatory approaches to emission reductions (E. H. Pechan and Associates 1997)—results for only one of the 19 strategies reviewed—I&M—lie entirely below the $10,000-per-ton cutoff (see Figure 4-1).11 Half or more of the results lie below the $10,000-per-ton cutoff or are fairly concentrated (i.e., less than $50,000 per ton) (see Table 4-3) for the following five strategies:
-
Regional ridesharing programs (areawide programs that provide information, promotion, and assistance in matching potential car poolers);12
-
Regional travel demand management programs (areawide programs that are generally aimed at commute travel);13
-
Replacement of conventional-fuel buses;
-
Alternative-fuel vehicle programs (e.g., conversion of public and private nontransit vehicle fleets to alternative fuels); and
-
Charges and fees (e.g., workplace parking fees, mileage fees, congestion pricing).14
TABLE 4-3 Number of CMAQ Project Examples by Project Category and Cost-Effectiveness Level
|
Project Category |
Cost per Ton (2000$, VOC-equivalent emission reductions) |
Total |
|||||||||
|
<10,000 |
$10,000–$19,999 |
$20,000–$29,999 |
$30,000–$39,999 |
$40,000–$49,999 |
$50,000–$59,999 |
$60,000–$69,999 |
$70,000–$99,000 |
$100,000–$249,999 |
$250,000+ |
||
|
Traffic signalization |
2 |
|
2 |
|
|
|
|
|
1 |
|
5 |
|
Freeway/incident management |
2 |
|
|
|
|
|
|
|
1 |
1 |
4 |
|
HOV facilities |
|
1 |
|
|
|
|
|
|
|
1 |
2 |
|
Regional rideshare |
3 |
2 |
|
|
|
|
|
|
|
|
5 |
|
Vanpool programs |
2 |
2 |
1 |
|
|
|
|
1 |
|
|
6 |
|
Park-and-ride lots |
1 |
1 |
|
|
|
|
1 |
1 |
|
|
4 |
|
Regional TDM |
4 |
1 |
2 |
1 |
|
|
|
|
|
|
8 |
|
Employer trip reduction programs |
1 |
2 |
1 |
|
1 |
1 |
|
|
1 |
|
7 |
|
Telework |
1 |
|
|
|
|
|
|
1 |
3 |
5 |
10 |
|
Bicycle/pedestrian |
1 |
1 |
1 |
|
|
|
2 |
5 |
2 |
2 |
14 |
|
Shuttles, feeders, paratransit |
|
1 |
1 |
1 |
1 |
2 |
|
2 |
1 |
6 |
15 |
|
New capital systems/vehicles |
1 |
1 |
|
1 |
|
|
|
|
2 |
1 |
6 |
|
Conventional service upgrades |
1 |
2 |
4 |
1 |
|
|
|
1 |
1 |
|
10 |
|
Alternative-fuel buses |
3 |
|
|
1 |
1 |
|
|
|
2 |
4 |
11 |
|
Conventional-fuel bus replacements |
|
3 |
1 |
1 |
|
|
|
|
|
|
5 |
|
Alternative-fuel vehicles |
1 |
|
|
1 |
|
|
|
|
|
|
2 |
|
Inspection and maintenance |
5 |
|
|
|
|
|
|
|
|
|
5 |
|
Subsidies and discounts |
5 |
|
1 |
1 |
|
1 |
2 |
|
3 |
1 |
14 |
|
Charges and fees |
3 |
1 |
1 |
|
1 |
|
|
|
|
|
6 |
|
Total |
36 |
18 |
15 |
8 |
4 |
4 |
5 |
11 |
17 |
21 |
139 |
|
Percent |
26 |
13 |
11 |
6 |
3 |
3 |
4 |
8 |
12 |
15 |
100 |
|
Note: The following pollutant weighting scheme was assumed: 1:4 for VOC:NOx HOV = high-occupancy vehicle; TDM = travel demand management. Source: Appendix E. |
|||||||||||
At the other extreme, results for two strategies—telework facilities and new transit shuttle and feeder services—exceed $1 million per ton.15 Results for the remaining 11 strategies lie between these extremes, in several cases being widely dispersed (see Figure 4-1 and Table 4-3). It is important to note that there is no way to be sure that implementing these strategies would result in cost-effectiveness values similar to those found in the studies. Nevertheless, the study results offer the only guidance available at this time.
As noted previously, the majority of CMAQ funds provided since the program’s inception has been spent on traffic flow and transit improvements. Yet with the exception of conventional-fuel bus replacements, which could be categorized under transit instead of under fuels and technology as shown, transit and traffic flow improvements are not among the most cost-effective strategies listed above. However, $10,000 is near the lower end of the range of cost-effectiveness estimates for many transit and traffic flow improvement projects; other results range across the cost intervals, suggesting that performance depends on where and how a particular strategy is implemented.
A sensitivity analysis was conducted using different weighting schemes for VOCs and NOx.16 The ranking of strategies was relatively invariant with respect to the different scenarios (see Appendix E). However, had data been available on particulate reductions, for example, and included in the cost-effectiveness calculations, the ranking of strategies focused on sources of particulate emissions, such as alternative-fuel buses, would likely have shown more promising cost-effectiveness results.
|
15 |
Results for two of the nine telework projects reviewed exceeded $1 million per ton; those for three more projects exceeded $250,000 per ton. Results for 1 of the 15 transit shuttle and feeder service projects exceeded $1 million per ton; those for 5 exceeded $250,000 per ton. The poor cost-effectiveness results for some of the telecommuting projects reflect the inclusion of the capital cost of telework facilities, which results in very high costs relative to emission reductions. The capital costs of constructing telework facilities are not CMAQ-eligible; hence these projects are not as comparable as they could be to telecommuting activities funded under the CMAQ program. |
|
16 |
Two alternative weighting schemes were used. The first weighted NOx equivalently with VOCs [i.e., VOCs (1) + NOx (1)]. The second weighted NOx much more heavily than VOCs [i.e., VOCs (1) + NOx (8)], in part as a surrogate for particulates, for which data were unavailable; NOxis one component of secondary particulate formation (see Appendix E). |
In sum, for only one of the 19 strategies reviewed—I&M programs—is the entire range of results below the $10,000 cutoff. The majority of the strategies (11), for which the bulk of CMAQ funds has been spent show a wide range of cost-effectiveness results. That having been said, many of these strategies are exemplified by one or more projects that fall below the $10,000-per-ton threshold and thus may have the potential to demonstrate more positive results.
Cost-Effectiveness of Non-CMAQ-Eligible Pollution Control Strategies
Figure 4-2 and Table 4-4 summarize the cost-effectiveness results for mobile source strategies that for the most part are ineligible for CMAQ funding.17 This analysis, too, was constrained by a limited number of usable studies, as well as by a wide range of results for some strategies. Nevertheless, using the same threshold of $10,000 per ton of emissions reduced, the range of cost-effectiveness estimates was well below the threshold (see Figure 4-2) for half of the 16 strategies reviewed:
-
Passenger and heavy-duty vehicle emission standards,
-
California’s Phase 3 reformulated gasoline program,
-
I&M programs,
-
Use of remote sensing,18 and
-
Vehicle scrappage programs.
|
17 |
The exceptions are I&M programs and alternative-fuel buses, which were included in both reviews. In the case of the former, the results from the two papers are quite similar. In the latter case, the opposite is true. The estimates in Appendix F, which show that compressed natural gas (CNG) buses are highly cost-effective (i.e., below $10,000 per ton), are based on two studies, which are engineering estimates. The results in Appendix E are based on 11 studies that include other fuel options and represent bus replacement programs in metropolitan areas. The results show poor cost-effectiveness for this strategy; however, the range is wide, from $6,700 to $568,700 per ton. |
|
18 |
Remote sensing refers to a method for measuring pollution levels in a vehicle’s exhaust while the vehicle is in use (NRC 2001, 192). |
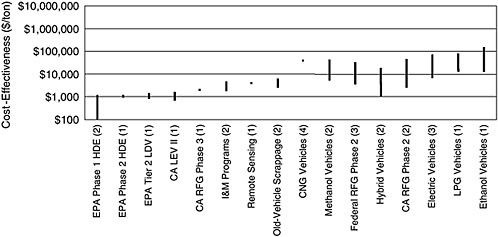
FIGURE 4-2 Range of cost-effectiveness results (dollars per ton) for non-CMAQ-eligible mobile source control measures (in 2000$ , VOC-equivalent emission reductions) . Note: two of the strategies are CMAQ-eligible: I&M programs and CNG buses. CA = California; CNG = compressed natural gas; EPA = Environmental Protection Agency; HDE = heavy-duty engine; I&M inspection and maintenance; LDV = light-duty vehicle; LEV = low-emission vehicle; LPG = liquid petroleum gas; RFG = reformulated gasoline. ( Source: Appendix F. )
TABLE 4-4 Summary of Cost-Effectiveness of Non-CMAQ-Eligible Mobile Source Control Measures (VOC-equivalent emission reductions)
|
Control Measure |
Number of Studies |
Cost-per-Ton Range (2000$) |
|
|
Low |
High |
||
|
Vehicle emission standards |
|
|
|
|
EPA Phase 1 HDE standards |
2 |
100 |
1,200 |
|
EPA Phase 2 HDE standards |
1 |
900 |
1,200 |
|
EPA Tier 2 LDV standards |
1 |
800 |
1,400 |
|
CA LEV II program |
1 |
700 |
1,600 |
|
Reformulated gasoline |
|
|
|
|
CA Phase 3 RFG |
1 |
2,000 |
2,000 |
|
Federal Phase 2 RFG |
3 |
3,600 |
83,500 |
|
CA Phase 2 RFG |
2 |
2,600 |
45,000 |
|
In-use vehicle emission reductions |
|
|
|
|
I&M programsa |
2 |
1,800 |
4,600 |
|
Remote sensing programs |
1 |
4,100 |
4,100 |
|
Old-vehicle scrappage |
2 |
2,500 |
6,400 |
|
Alternative-fuel vehicles |
|
|
|
|
CNG vehicles |
4 |
0 |
36,000 |
|
Methanol vehicles |
2 |
5,300 |
43,600 |
|
Hybrid electric vehicles |
2 |
1,100 |
18,900 |
|
Electric vehicles |
3 |
6,600 |
72,400 |
|
LPG vehicles |
1 |
13,000 |
80,000 |
|
Ethanol vehicles |
1 |
12,600 |
152,200 |
|
Note: A single study may have several scenarios. The following weighting scheme was assumed: 1:4 for VOC:NOx. CA = California; CNG = compressed natural gas; EPA = Environmental Protection Agency; HDE = heavy-duty engine; I&M = inspection and maintenance; LDV = light-duty vehicle; LEV = low-emission vehicle; LPG = liquefied petroleum gas; RFG = reformulated gasoline. a A recent report (NRC 2001) reveals that the actual effectiveness of many I&M programs fell short of model predictions. Source: Appendix F. |
|||
The least cost-effective strategies are federal and earlier California (Phase 2) reformulated gasoline programs19 and vehicle fleet conversions to alternative fuels (i.e., liquefied petroleum gas, compressed natural gas, electricity, ethanol, and fuel cells) (see Figure 4-2).20 However, with one exception—fleet conversion to ethanol vehicles—the top of the range for even the least cost-effective strategies falls below $100,000 per ton.
The results also tend to be more clustered than those found in the review of CMAQ-eligible strategies (see Table 4-5).21 This might be because fewer studies were reviewed. Nevertheless, many of the evaluations are comprehensive analyses of large programs, such as new-vehicle emission and fuel standards, that include several different scenarios, so the clustering probably indicates less variation among measures than in the case of CMAQ-eligible projects—exactly what one would expect given that CMAQ intentionally encourages experimental strategies.
The committee was also charged with analyzing the cost-effectiveness of stationary source control measures. A recent comprehensive analysis of stationary source control measures and a limited number of mobile source control strategies (E. H. Pechan and Associates 1997) conducted for the Environmental Protection Agency (EPA 1997a; EPA 1997b) was used to address this task. Most of the stationary source measures controlled for a single pollutant only and thus could not be directly compared with the previous results for mobile source strategies that affected multiple pollutants. Where comparisons were possible—primarily for VOC control measures—mobile source non-CMAQ-eligible control measures (e.g., new-vehicle emission and fuel standards) appeared to be competitive with stationary source VOC control measures.22 Many
|
19 |
The cost-effectiveness of such other fuel measures as the low-sulfur diesel fuel standards was evaluated as part of the heavy-duty vehicle emission standards (Table 4-4, first two rows), which were found to be highly cost-effective. |
|
20 |
Table 4-2 also includes a high and low cost-effectiveness result for alternative-fuel vehicles, both within the range shown in Table 4-4. |
|
21 |
Note that studies may have multiple observations or scenarios, which accounts for the larger numbers of measures included in Table 4-5 than in Table 4-4 and Figure 4-2. |
|
22 |
For this comparison, the cost-effectiveness of mobile source control strategies is expressed in VOC-equivalent emission reductions (see Appendix F). |
TABLE 4-5 Number of Non-CMAQ-Eligible Mobile Source Control Measures by Project Category and Cost-Effectiveness Level
|
|
Cost per Ton (2000$, VOC-equivalent emission reductions) |
Total |
|||||||||
|
<10,000 |
$10,000–$19,999 |
$20,000–$29,999 |
$30,000–$39,999 |
$40,000–$49,999 |
$50,000–$59,999 |
$60,000–$69,999 |
$70,000–$99,000 |
$100,000–$249,999 |
$250,000+ |
||
|
CA LEV II Program |
2 |
|
|
|
|
|
|
|
|
|
2 |
|
EPA Tier 2 LDV standards |
1 |
|
|
|
|
|
|
|
|
|
1 |
|
EPA Phase 1 HDE standards |
3 |
|
|
|
|
|
|
|
|
|
3 |
|
EPA Phase 2 HDE standards |
1 |
|
|
|
|
|
|
|
|
|
1 |
|
CA Phase 2 RFG |
1 |
|
|
1 |
|
|
|
|
|
|
2 |
|
Federal Phase 2 RFG |
1 |
|
1 |
|
1 |
|
|
|
|
|
3 |
|
CA Phase 3 RFG |
1 |
|
|
|
|
|
|
|
|
|
1 |
|
I&M programsa |
2 |
|
|
|
|
|
|
|
|
|
2 |
|
Old-vehicle scrappage |
3 |
|
|
|
|
|
|
|
|
|
3 |
|
Remote sensing programs |
1 |
|
|
|
|
|
|
|
|
|
1 |
|
Methanol vehicles |
1 |
|
1 |
|
|
|
|
|
|
|
2 |
|
Ethanol vehicles |
|
|
|
|
|
|
|
1 |
|
|
1 |
|
LPG vehicles |
|
|
|
|
1 |
|
|
|
|
|
1 |
|
CNG vehiclesa |
3 |
|
|
1 |
|
|
|
|
|
|
4 |
|
Electric vehicles |
|
|
1 |
1 |
|
1 |
|
|
|
|
3 |
|
Hybrid electric vehicles |
1 |
1 |
|
|
|
|
|
|
|
|
2 |
|
Total |
21 |
1 |
3 |
3 |
2 |
1 |
0 |
1 |
0 |
0 |
32 |
|
Percent |
66 |
3 |
9 |
9 |
6 |
3 |
0 |
3 |
0 |
0 |
100 |
|
Note: The following pollutant weighting scheme was assumed: 1:4 for VOC:NOx. Some studies have more than one scenario. This is true for the CA LEV II Program, EPA Phase 1 HDE standards, and old-vehicle scrappage programs. CA = California; CNG = compressed natural gas; EPA = Environmental Protection Agency; HDE = heavy-duty engine; I&M = inspection and maintenance; LDV = light-duty vehicle; LEV = low-emission vehicle; LPG = liquefied petroleum gas; RFG = reformulated gasoline. a These strategies are exceptions. I&M programs and CNG buses are CMAQ-eligible. Source: Appendix F. |
|||||||||||
mobile source emissions occur in populated areas, whereas stationary sources are often located outside of population centers. The higher health-related damages from greater population exposure could justify implementation of some higher-cost mobile source control measures.
Interpreting the Results
The limited evidence available from the papers commissioned for this study suggests that control strategies aimed directly at emission reductions (e.g., new-vehicle emission and fuel standards, I&M programs, remote sensing programs, vehicle scrappage programs) have generally been more cost-effective than behaviorally oriented CMAQ-funded TCMs. Results of a few TCMs, however—those involving regional ridesharing, regional transportation demand management, and some CMAQ-eligible charges and fees—compare favorably with those of strategies aimed directly at emission reductions, suggesting that the former may have the potential to yield more cost-effective results.
There is considerable uncertainty about these conclusions, especially regarding their applicability to emission control measures that may be implemented in the future. First, the wide range of cost-effectiveness results for many TCMs, even within the same project category, suggests that performance depends largely on context, that is, on where and how projects are executed (see Table 4-3). Regional differences affect both the choice of projects for CMAQ funding and their effectiveness in reducing emissions. Project costs and effects can vary greatly within one metropolitan area, as well as among areas. Project performance depends on the transportation systems already in place, the air quality and congestion mitigation measures already implemented, and the projects (CMAQ-funded and others) carried out together with any CMAQ projects.
Second, the cost-effectiveness comparisons reported here were limited to ranking strategies on the basis of their cost per ton of VOC and NOx reduced. Many CMAQ-eligible TCMs may have other benefits, including particulate reduction, congestion relief, and other environmental and ecological benefits (e.g., reduction of greenhouse gases). It was not possible to quantify these other benefits
for this study, but their absence from the cost-effectiveness calculations may have resulted in higher cost-effectiveness estimates than would have been obtained if the costs had been spread across a larger number of benefits.
Third, the estimates for nearly all strategies are affected by modeling uncertainties. Modeled estimates have generally tended to overstate emission reductions. Modeling uncertainties are compounded for TCMs, which require the prediction of travel as well as emission effects, adding to the uncertainty of the estimates.
Fourth, several of the most cost-effective strategies, such as federally mandated new-vehicle emission and fuel standards, have already been implemented. Other cost-effective strategies, such as I&M and regional ridesharing programs, have been applied in particular nonattainment areas, but these areas may require additional measures to reach or maintain conformity. Adopting more stringent versions of these strategies would probably be possible only at much higher cost. Thus, as vehicles become cleaner and the most cost-effective strategies are put in place, obtaining further emission reductions will likely require TCMs and other control strategies that may be less cost-effective than measures already implemented.
Finally, one may question whether it is appropriate to compare CMAQ-eligible TCMs with many of the other pollution control strategies reviewed here. One could argue that, at least in the short run, if the CMAQ program were not reauthorized, the funds, which come from Highway Trust Fund revenues, would more likely be folded into the Surface Transportation Program and the federal transit program than used to support these other pollution control measures. Thus, the relevant comparison would be with more traditional highway and transit expansion and rehabilitation projects that are currently ineligible for CMAQ funding. Although an in-depth review of these projects from the perspective of the goals of the CMAQ program, particularly their effect on emissions, was beyond the scope of this study, there is some evidence to suggest that they would generally not represent a cost-effective way of reducing emissions. For example, an assessment of the effects of highway capacity improvements on air quality (TRB 1995, 8) indicated that many of these projects would have negligible or adverse effects on emission
levels.23 Another review of expanding capacity through the use of intelligent transportation system technologies on highways (e.g., highly automated freeway and HOV lanes) and expanded light rail transit (Johnston and Rodier 1997) showed that each of these strategies increased emissions as compared with a no-build option.24 Of course, as noted earlier, traditional highway and transit rehabilitation and maintenance projects are not eligible for CMAQ funding precisely because they maintain existing levels of highway and transit service and thus are not expected to result in further progress toward reducing emissions.
PERSPECTIVES FROM THE CASE STUDIES
Several of the more difficult-to-measure, qualitative aspects of the CMAQ program were investigated as part of the five case studies conducted by the committee. In particular, respondents were asked to comment on such issues as value added by the CMAQ program, impact on local spending priorities, consideration of objectives in addition to air quality improvement and congestion mitigation in project selection, and incentives to innovate. In this section, the views of the agencies interviewed at each case study site regarding these and other program strengths, weaknesses, and suggested areas for improvement are summarized; material from briefings presented to the committee is also brought to bear.
Program Goals
To provide some perspective on how the case study respondents viewed the effectiveness of the CMAQ program, this section begins with a summary of their thoughts on what the program is attempting to accomplish.
The vast majority of agencies interviewed were in agreement that the primary objective of the CMAQ program is and should be to improve air quality. There was less agreement about the legitimacy of the congestion mitigation goal of the program. More specifically, transportation departments in the sites visited generally took the position that congestion relief projects, such as traffic signalization and intersection improvements, meet program goals and can result in air quality benefits. For example, the major transportation agencies in Houston and Los Angeles supported the dual goals of the program and saw no major conflict between them, particularly if projects were structured appropriately, a viewpoint that may reflect the high levels of congestion in both regions. Some transportation agencies went further, recommending that the program restriction against the use of funds to expand highway capacity for single-occupant vehicle (SOV) travel be relaxed for projects that remove bottlenecks by making small capacity additions, such as auxiliary lanes, where it could be shown that these improvements would reduce emissions.
Other respondents—mainly transit operators, environmental groups, and some air agencies—thought the program should be focused primarily on nonhighway projects or at least on alternatives to SOV travel. They argued that other funds are available for congestion relief and that many of the projects that support this goal are of dubious value or less cost-effective than others in helping reduce pollution. In a briefing to the committee, the South Coast Air Quality Management District, the local air agency for a major part of the Los Angeles region, articulated this position. According to that agency, when viewed in the context of the greatest air quality improvement per CMAQ dollar spent, projects focused directly on vehicle emission reductions, such as the replacement of fleet engines with engines that burn clean fuel and support for clean-fuel infrastructure, rank higher than many transportation congestion relief projects.
Few of the respondents mentioned other objectives, such as improved mobility and economic development, as important goals for expenditure of CMAQ funds. In some regions, however, these considerations do play a role in determining which projects should be selected for CMAQ funding. For example, the Washington Metropolitan Area Transit Authority takes into account access, affordable
transit, and economic development as well as criteria relating to emission reductions in considering projects for CMAQ funding. Quality-of-life issues frequently arise in evaluating the desirability of bicycle and pedestrian projects for CMAQ funding. These factors also play a role as “tie breakers” when two projects are ranked equally.
Program Benefits and Weaknesses
According to most of those interviewed, the CMAQ program is valuable because it helps regions with air quality problems develop and fund strategies aimed at reducing pollution and related congestion. Although the program represents only a small fraction of federal transportation funding, it is one of the few examples of a funded mandate: CMAQ funds are dedicated to helping local areas comply with the stringent conformity requirements of the 1990 CAAA.
Local agencies view the restrictions imposed on the use of CMAQ funds as one of the program’s most important strengths. The restrictions are seen as particularly important in large metropolitan areas where needs for transportation infrastructure preservation are numerous and would likely be given higher priority, claiming most available funds if the restrictions were lifted. In fact, when asked what would be the likely effect if the restrictions were relaxed or the program discontinued, the majority of those interviewed agreed that some projects would be delayed, while others would simply not be undertaken. Projects such as telecommuting and suburban transit shuttle services have no alternative federal funding sources. Of course, state and local funds could always be used, but competing needs for these funds reduce the attractiveness of this option. A few respondents did not agree with this assessment. They claimed that areas with severe air quality problems would be forced to spend on projects that would reduce, or at least not increase, pollution regardless of whether CMAQ funds were available.
Although restricted in purpose, the CMAQ program provides local governments with considerable flexibility and a diverse set of options in making their spending choices. Projects can readily be tailored to multimodal approaches to local pollution and congestion problems. Federal funds are often restricted to specific programmatic areas (e.g., highways, bridges). Thus, funds that can be used for a
wide array of projects are highly valued. Flexible funds can also be used to support projects that encourage interagency collaboration and attract new project sponsors. For example, in the Chicago area, CMAQ funds were used to support projects in many suburban jurisdictions, helping overcome a history of divisive city–suburban relations. In Chicago as well as in other cities, CMAQ funds support transportation management associations (TMAs), groups of individuals and employers who organize to address local transportation issues. CMAQ funds have been used both to establish TMAs and to support such activities as suburban shuttle and express bus services.25 The CMAQ program complements ISTEA in its effort to include a broad range of participants in planning and executing transportation solutions to local problems.
On the other hand, to the extent that flexibility encourages widespread use of CMAQ funds to ensure that everyone gets a “slice of the pie,” it can lead to an unfocused program and failure to concentrate on projects that are likely to yield the largest air quality benefits. This dilemma was voiced during the Chicago site visit. Although the process for allocating funds in the northeastern Illinois region is noted for having involved many new groups and ensured a fair and equitable distribution of funds, a frequently heard complaint of case study participants was the lack of a strategic program focus and scattering of projects.
The CMAQ program is also viewed as a source of funds to encourage innovation by developing new strategies for controlling emissions from transportation sources (Farrell et al. 1998, ii). Both the Federal Highway Administration (FHWA) and the Environmental Protection Agency (EPA) have documented projects that local officials have identified as nontraditional, either because of the type of project (e.g., a daycare center near a transit hub, a taxicab alternative-fuel program) or because of the process (e.g., involvement of nontraditional partners, such as business or community groups) (FHWA 1996; EPA 1999). During the site visits, many respondents acknowledged
the positive incentives provided by the program to consider innovative transportation strategies for which there are few traditional funding sources. The program is focused on new services and offers the ability to fund small pilot demonstration projects. According to the Houston–Galveston Area Council, the metropolitan planning agency for the Houston area, an important role of the CMAQ program has been to “buy down the risk of pilot projects.” Furthermore, the program offers the opportunity to involve a wide range of nontraditional participants, including nonprofit and private-sector organizations, and leverage other funds in support of these projects. Box 4-1 describes four projects that local officials in the case study sites identified as innovative and that FHWA and EPA have showcased as CMAQ success stories (EPA 1999; FHWA 1996). They include a shuttle service in suburban Chicago to connect a commuter rail transit line with a major suburban employment center, creating a viable suburban transit alternative to drive-alone commuting; a public education and month-long reduced transit fare program in Houston to reduce emissions during August, typically the month with the highest number of ozone exceedance days; an employer outreach effort in the Washington, D.C., metropolitan area in support of an areawide integrated program of ridesharing services; and a high-tech facility to allow real-time traffic monitoring and coordinated rapid response to incidents on Houston’s congested freeways.
Nontraditional projects typically represent a small fraction of a region’s CMAQ program in any given year. The extent of innovation depends in large part on the willingness and capacity of local agencies to support new activities. A recent report on CMAQ-funded demonstration projects26 in the Chicago area (Jackson and Murtha 2001) provides a sense of the challenges faced by local agencies undertaking nontraditional projects. Of the 17 projects covered in that report, 4 were considered successful, 5 were failures (were cancelled or had disappointing results), and 8 had unknown outcomes.
|
BOX 4-1. CMAQ Success Stories Suburban Transit: Lake Cook (Chicago) Shuttle Bug Shuttle Bug service was started in 1996 as a CMAQ demonstration project. The Transportation Management Association of Lake Cook, representing several major area employers, acted as a catalyst for establishing a free shuttle service to connect commuters from a new commuter rail train station to a major suburban center with some 30,000 employees along a 6-mile corridor on Lake Cook Road (EPA 1999, 23–24). Riders who commute out of Chicago were targeted, but significant ridership also comes from suburban residents. CMAQ funds were used to defray the cost of operating the shuttles, with additional support provided by employer contributions and Metra, the Chicago region’s commuter rail service provider. Pace, which is responsible for Chicago’s suburban bus service, operates the Shuttle Bug. Demand for the shuttle service has grown steadily—from 110 trips per day in 1996 to more than 800 daily trips in 2001; buses have replaced vans (Jackson and Murtha 2001, 5–6). The most recent survey of users indicated that prior to the shuttle service, approximately 55 percent of users drove alone to work. Thus, an estimated 2.7 tons of VOCs has been eliminated through a reduction of 1.8 million vehicle-miles traveled (VMT) each year (Jackson and Murtha 2001, 20). Preliminary estimates of project costs relative to pollution reduction benefits alone are high (between $165,000 and $200,000 per ton of VOCs eliminated), but continuing ridership gains and calculation of other uncounted benefits (e.g., congestion reduction) should improve this performance. Encouraging Transit Use on High-Ozone Days: Clean Air Action Program, Houston The Clean Air Action Program, sponsored by the Houston– Galveston Area Council and the Metropolitan Transit Authority of Harris County (METRO), is designed to educate the public |
|
about the region’s ozone problem and encourage voluntary actions to reduce motor vehicle emissions through proper vehicle maintenance, reduced vehicle trips, and combining of trips (EPA 1999, 7–8). One of the most successful elements of the program is the “August Is Clean Air Month” transit fare subsidy campaign. CMAQ funds were used in 1997 through 1999 to subsidize transit fares by 50 percent during August, which typically has the highest number of ozone exceedance days. An evaluation of the program by METRO revealed that 13 percent of the 36 percent increase in transit ridership over the 3-year period could be attributed to the program, although the evaluation showed diminishing returns in the third year (METRO 2000, 1). One of the benefits of the program has been an increase in year-round ridership, resulting in an estimated annual reduction of 27 million VMT (assuming 50 percent retention of August ridership) and elimination of 18 tons of VOCs annually (EPA 1999, 8; METRO 2000, 16). Program costs are high [nearly $300,00 per ton of VOCs eliminated (EPA 1999, 8)], but do not include the benefits of increased transit ridership and reduced highway congestion. Commuter Connections Employer Outreach Program: Washington, D.C., Metropolitan Area The Washington, D.C., region’s Commuter Connections program was developed to reduce drive-alone commuter travel. It includes a telework resources center, a guaranteed ride home and ride matching services, and an employer outreach program. With the help of CMAQ funds, the program now includes a dedicated sales force that promotes transportation demand strategies directly to region employers (EPA 1999, 11–12). Employers can access Commuter Connection services by simply dialing an easy-to-remember 800 number. In 1997, the first year of operations, the program resulted in 15 employers establishing new |
|
transit benefit programs (i.e., subsidized transit passes for employees), 12 commuter information displays at employer work sites, and 43 on-site commuter information fairs. An evaluation of the employer outreach program from 1997 through mid-1999 showed 415 participating employers with estimated daily trip reductions of 7300 and daily VMT reductions of 90,000 attributable to the outreach effort (Ramfos et al. 1999, 21). Together these reductions were estimated to have eliminated 23 tons of VOCs and 39 tons of NOX annually at a cost of approximately $18,000 per ton of VOCs eliminated, not counting the benefits of NOX reductions or other nonenvironmental benefits (e.g., congestion reduction) (Ramfos et al. 1999, 21). TranStar: Houston’s Traffic Control and Incident Management Center Local agencies in the Houston area combined resources to open a TranStar Management Center in 1996 to manage Houston’s highly congested freeway traffic using the latest transportation management technologies. Under a single roof and a unified management structure, the city of Houston, Harris County, the Metropolitan Transit Agency, the Texas Department of Transportation, and law enforcement authorities monitor traffic conditions in real time, detect incidents, and coordinate rapid response to traffic crashes and vehicle breakdowns (FHWA 1996, 18–19). Funded originally as part of an intelligent transportation system demonstration corridor, the center recently sought CMAQ funds to finance projects that benefit multiple agencies; the local match is provided by contributions from agency members. For example, CMAQ funding was used to fund the TranStar computer facility. Cost-effectiveness estimates are not available, but response time to incidents by authorities has been reduced by one-third, resulting in more rapid clearance of incidents, reducing congestion, and enabling motorists to maintain higher and more constant travel speeds (FHWA 1996, 18). |
The high risk of failure inherent in any innovation and the lack of experience of many project sponsors in implementing federally assisted projects were cited as the primary reasons for the relatively low success rate (Jackson and Murtha 2001, 2). Nevertheless, local agency staff noted that both failures and successes add to the body of knowledge about which strategies work better and why (Jackson and Murtha 2001, 2).
Public–private partnerships, encouraged by the program, were evident in many of the case study sites. For example, in Southern California, the San Bernardino Associated Governments is working with a private utility in a pilot project to convert forklifts to clean-fuel operation. The Riverside County Transportation Commission was also engaged with a private utility, California Edison, to electrify truck stops to eliminate idling emissions, but the project was canceled because of the energy crisis in California. The Ventura County Transportation Commission is working with the Southern California Gas Company to provide compressed natural gas (CNG) fueling facilities to ensure long-term fueling capabilities and price stability for local CNG transit buses and other vehicles. In Chicago, the CMAQ program is supporting a partnership between the City of Chicago and the Wendella Sightseeing Company, Inc., to improve ferry service along the Chicago River to better serve commuter rail lines (see Box 4-2). As with demonstration projects, however, these arrangements can pose large administrative burdens on the public partner, particularly when they include not-for-profit agencies or private-sector partners that have little experience with regulations and requirements of federal programs. Moreover, because these projects are often one-of-a-kind, they can require the development of new or modified administrative procedures, a time-consuming process for the lead public agency. For example, the Wendella Boat project required a special ordinance between the city and the boat company authorizing the execution of the CMAQ grant agreement, which resulted in a significant delay in the project (Poska et al. 2001, 13).
Many of those interviewed noted the lack of ex-post project evaluations as an important program weakness. They stressed that the focus should be not on individual project assessments, such as the effects of a single traffic signalization improvement, but on how
|
BOX 4-2. Wendella RiverBus Service, Chicago Wendella Boats has operated a commuter ferry service along the Chicago River since 1962. In 1999 the Chicago Area Transportation Study, the metropolitan planning organization for the Chicago region, conducted a survey to determine whether the service was eligible to receive CMAQ funds for the purchase of additional boats to improve commuter service. The RiverBus operates from April to early November on docks along the Chicago River, strategically located to efficiently serve many Metra commuter rail customers. For example, the Madison Street dock is one block from the Ogilvie Transportation Center, which serves Union Pacific rail lines, and is linked to the dock by an enclosed pedestrianway (Poska et al. 2001, 2, 5). The survey revealed that the vast majority of RiverBus users are Metra riders, who were diverted from either taxi service or a commute by passenger vehicle because of the ferry service (Poska et al. 2001, 6, 8). A small but positive effect on reducing VMT and vehicle emissions was identified, signaling the go-ahead for the city to engage in a contractual arrangement with the boat service. The cost per ton of VOCs eliminated over the 20-year life of the project was estimated at $16,850 (Poska et al. 2001, 13). |
groups of similar projects affect the system. Suggestions for encouraging more evaluation ranged from a federal set-aside of CMAQ funds for evaluation activities (although many did not want to see funds taken away from projects) to a more active federal role in project evaluation and sharing of best practices (e.g., using samples of similar projects across nonattainment areas to analyze which projects are most effective and most cost-effective and which factors most influence these outcomes).
Another important program weakness from the local perspective is the lack of provision for operation and maintenance of new CMAQ-funded facilities and services. Several of those interviewed
thought the CMAQ program encourages short-term solutions. In their view, CMAQ provides startup funds for new facilities, equipment, and services, but leaves local governments with the burden of financing equipment replacement and operating expenses because of program restrictions on funding for operations.27 Suggested changes ranged from relaxing the current 3-year limit for most projects to enable local areas to locate alternative funding sources, to doing away with the restrictions altogether.
Future Program Scope and Activities
A broad range of regional transportation planners, operating agency staff, air quality officials, and interest groups who were interviewed for the case studies or briefed the committee at its meetings supported reauthorization of the CMAQ program. This is not surprising because the program offers local agencies a targeted source of federal funds to address the stringent CAAA requirements in areas with poor air quality. However, program funding is modest by transportation standards, and some regions have a backlog of unfunded projects. Thus, many respondents were hesitant about the advisability of broadening the scope of the program to cover additional pollutants unless funding levels are also expanded. They suggested that the focus should be on making the current program better. Those interviewed in Chicago perhaps expressed the reservation best: “We barely understand VOCs; we need to stay focused.” Others thought the program should keep pace with whatever pollutants come to be regulated, even if this means spreading the funds more widely as new regions become noncompliant. They also recommended that newly regulated pollutants be added to the CMAQ apportionment formula as a basis for future allocation of funds.
Despite the flexibility of the current program, there were numerous suggestions for expanding project eligibility—too numerous to catalogue fully here. Those who were favorably disposed toward expanding the scope of the program to include other pollutants had
several suggestions for new activities. For example, some suggested that as greater attention is focused on fine particulates and air toxics, such as those from diesel fuel, projects directed toward emissions of heavy-duty vehicles and even off-road vehicles should be made eligible because these vehicles are large contributors to pollution from these sources. Others went a step further and recommended that any project that can demonstrate the potential to reduce mobile source emissions should be eligible. The other most frequently suggested area for expanding project eligibility was land use. Smart-growth measures (e.g., sidewalks and other pedestrian-friendly strategies) were among those most frequently mentioned.
COMMITTEE ASSESSMENT AND FINDINGS
In this chapter, the available evidence has been assembled to address the key evaluation issues raised in the committee’s charge. Early in its review, the committee concluded that it could not provide a scientifically grounded, quantitative evaluation of the cost-effectiveness of the CMAQ program as a whole at the national level. Program funds represent a relatively small fraction of any given region’s transportation budget, and they are often broadly distributed within an area for diverse projects. In the spirit of ISTEA and TEA-21, decisions about project spending priorities have been devolved to the states, and within the states to local agencies in nonattainment and maintenance areas. The regional and sometimes more localized character of pollution and congestion problems means that regions differ in their spending priorities and selection of individual strategies. Thus, it is more sensible and feasible to evaluate individual strategies funded by the program as they have been implemented in different regions.
Two in-depth literature reviews were commissioned to examine the effectiveness of strategies similar to those funded by the program in relation to their cost and to other strategies for achieving the CMAQ program goals. The limited available evidence presented in these papers suggests that, when compared on the sole criterion of emissions reduced per dollar spent, strategies aimed directly at emission reductions (e.g., new-vehicle emission and fuel standards, well-structured I&M programs, remote sensing programs, vehicle scrap-
page programs)—some of which are eligible for CMAQ funding, but most of which are not—generally have been more successful in reducing emissions than most CMAQ-eligible TCMs that rely on changes in travel behavior.28
The committee agreed with this finding, but found the evidence inadequate to address fully the questions posed under its charge. First, nearly all the results are based on modeled estimates and thus are susceptible to modeling uncertainties. The results for I&M programs illustrate the problem. Modeled results show I&M as a highly cost-effective strategy, but a recent study (NRC 2001) revealed that the emission benefits are overestimated for many I&M programs. TCMs are particularly affected by modeling uncertainties because travel behavior as well as vehicle emissions must be estimated, and the available models are not suited to analyzing small-scale projects typical of many TCMs. Second, emission data were available only for VOCs and NOx; if data on particulates had been available, the ranking of projects that address particulates (e.g., alternative-fuel buses) would likely have been higher. Third, as the wide range of TCM cost-effectiveness results shows, the performance of individual strategies is context specific even for projects in the same category. Fourth, many TCMs have benefits other than emission reductions (e.g., congestion mitigation), which were not captured in the analyses. Finally, several of the most cost-effective strategies have been implemented, but nonattainment areas still require additional emission reductions to reach or stay in conformity. Thus, TCMs are likely to be employed in meeting the next round of required reductions even if they are less cost-effective than other strategies. For all these reasons, the committee concluded that the evidence on project cost-effectiveness was not sufficient for a definitive evaluation of the program.
The strongest evidence for the program is qualitative. The information gathered by the committee during the site visits and the briefings conducted for this study offered strong support for continuation of the program. First, the CMAQ program helps fund the
strict mandates and regulations required of nonattainment areas by the 1990 CAAA. The committee supports funding of federal mandates and recognizes the CMAQ program as the only transportation program explicitly targeted to meeting the transportation-related air quality goals of the CAAA. Second, the committee sees value in a program limited to expenditures on projects with demonstrable potential air quality benefits. If CMAQ projects had to compete with the large backlog of infrastructure preservation projects in most large metropolitan areas, the air quality focus of these funds likely would not be a priority. Third, the program provides an incentive to encourage nontraditional approaches to solving air quality and congestion problems. By focusing on new facilities and services and providing funds for projects that have limited alternative funding sources, the program has enabled areas to experiment with what they believe are innovative strategies. The fact that these projects are not numerous and are often small should not be surprising. By its nature, innovation is risky, with high failure rates, and thus only a limited number of such projects can be undertaken at any given time. Finally, the CMAQ program gives local areas great flexibility in tailoring funds to projects that address specific air quality and congestion problems. Deployed in this way, CMAQ funds can also foster interagency cooperation and encourage participation of new groups in project planning and selection—all desirable outcomes.
On the basis of the evidence just described, the committee concludes that the program should be reauthorized, but several modifications are in order. First, a more strategic approach may be needed in some nonattainment areas to link CMAQ-funded projects more closely to local air quality and congestion problems, and to identify measurable objectives so that project performance can be monitored more closely and strategies altered as new information becomes available. Second, project cost-effectiveness could be enhanced if the program recognized emerging knowledge about the health hazards of various pollutants (e.g., particulates) and directed more funds toward these problems (e.g., heavy-duty vehicle projects). Finally, perhaps the greatest potential benefit of the CMAQ program is the development of new strategies for pollution reduction. However, this benefit is now mostly lost because there is no reliable way to tell how
successful different strategies are and no mechanism for sharing the information among program recipients. The committee believes more extensive evaluation, at both the local and national levels, should be undertaken, using CMAQ funds to help ensure that the wealth of accumulated experience can be examined and shared more systematically in the future.
REFERENCES
Abbreviations
EPA U.S. Environmental Protection Agency
FHWA Federal Highway Administration
GAO General Accounting Office
METRO Metropolitan Transit Authority of Harris County
NRC National Research Council
TRB Transportation Research Board
Apogee Research, Inc. 1994. Costs and Effectiveness of Transportation Control Measures (TCMs): A Review and Analysis of the Literature. Bethesda, Md., Jan.
Cambridge Systematics, Inc. 2000. Quantifying Air Quality and Other Benefits and Costs of Transportation Control Measures. Final Report. NCHRP Project 8-33. Dec.
E. H. Pechan and Associates. 1997. Additional Control Measure Evaluation for the Integrated Implementation of the Ozone and Particulate Matter National Ambient Air Quality Standards and Regional Haze Program. Prepared for the Office of Air Quality Planning and Standards, U.S. Environmental Protection Agency, Research Triangle Park, N.C., July 17.
EPA. 1997a. Regulatory Impact Analyses for the Particulate Matter and Ozone National Ambient Air Quality Standards and Proposed Regional Haze Rule. EPAOAQ 0041187. Innovative Strategies and Economics Group, Office of Air Quality Planning and Standards, Research Triangle Park, N.C., July 16.
EPA. 1997b. Regulatory Impact Analyses for the Particulate Matter and Ozone National Ambient Air Quality Standards and Proposed Regional Haze Rule, Appendix A: Emissions and Air Quality. EPAOAQ 0041605. Innovative Strategies and Economics Group, Office of Air Quality Planning and Standards, Research Triangle Park, N.C., July 16.
EPA. 1999. Creating Transportation Choices: Congestion Mitigation and Air Quality Improvement Program Success Stories. EPA-420-K-99-001. Aug.
Farrell, D., W. Harrington, and A. J. Krupnick. 1998. Evaluation of CMAQ Projects. Discussion Paper 98-18. Resources for the Future, Washington, D.C., Feb.
Ferguson, E. 2000. Travel Demand Management and Public Policy. Ashgate Publishing Co., Burlington, Vt.
FHWA. 1996. Innovations in Transportation and Air Quality: Twelve Exemplary Projects. FHWA-PD-96-016. U.S. Department of Transportation.
FHWA. 1999. The Congestion Mitigation and Air Quality Improvement (CMAQ) Program Under the Transportation Equity Act for the 21st Century (TEA-21): Program Guidance. U.S. Department of Transportation, April.
GAO. 1993. Urban Transportation: Reducing Vehicle Emissions with TCMs. GAO/RCED-93-169, Washington, D.C., Aug.
Jackson, T., and T. Murtha. 2001. A Synopsis of CMAQ Demonstration Projects. Working Paper 01-10. Chicago Area Transportation Study, May.
Johnston, R. A., and C. Rodier. 1997. A Comparative Systems-Level Analysis: Automated Freeways, HOV Lanes, Transit Expansion, Pricing Policies, and Land Use Intensification. California PATH Research Report, April.
Levin, H. M. 1993. Cost-Effectiveness: A Primer. Sage Publications, Newbury Park, Calif.
METRO. 2000. 1999 Clean Air Month Transit Fare Subsidy Evaluation. Houston, Tex.
Meyer, M. D. 1999. Demand Management as an Element of Transportation Policy: Using Carrots and Sticks to Influence Travel Behavior. Transportation Research A, Vol. 33, No. 7/8, Sept./Nov., pp. 575–599.
NRC. 2001. Evaluating Vehicle Emissions Inspection and Maintenance Programs. National Academy Press, Washington, D.C.
Poska, S., T. Jackson, and T. Murtha. 2001. Wendella River Bus Service Analysis. Working Paper 01-16. Chicago Area Transportation Study, Chicago, Ill., Aug.
Ramfos, N., D. Sivasailam, and L. Diggins. 1999. Metropolitan Washington Council of Governments Commuter Connections Program Transportation Emission Reduction Measure (TERM) Analysis Report. LDA Consulting, Redondo Beach, Calif., Sept. 15.
Rodes, C. E., L. Sheldon, D. Whitaker, A. Clayton, K. Fitzgerald, J. Flanagan, F. DiGenova, S. Hering, and C. Frazier. 1998. Measuring Concentrations of Selected Air Pollutants Inside California Vehicles. Final Report. No. 95-339. California Air Resources Board, Sacramento, Calif.
TRB. 1995. Special Report 245: Expanding Metropolitan Highways: Implications for Air Quality and Energy Use. National Research Council, Washington, D.C.


