
– 9 –
Measurement of the Group Quarters Population
9.1 WHAT ARE GROUP QUARTERS AND WHY ARE THEY IMPORTANT?
Group quarters (GQs) are places where people live or stay in a group living arrangement, and that are owned or managed by entities or organizations providing housing and/or services for the residents. These services may include custodial or medical care as well as other types of assistance. GQs differ from typical household living arrangements because the people living in GQs are usually not related to one another. GQs include correctional facilities, college/university student housing (e.g., dormitories and Greek society houses), and nursing homes and other health care facilities, as well as a variety of other places both institutional (e.g., psychiatric hospitals) and noninstitutional (e.g., group homes and residential treatment facilities) in nature. Moreover, GQs also include locations where people who have no fixed addresses receive services, such as shelters for those experiencing homelessness.
With just 8.2 million persons in a nation of more than 333 million, at first glance it seems reasonable to conclude that any analysis of GQs would be inconsequential for an evaluation of 2020 Census quality. That is hardly the case, however, for two reasons. The first has to do with the outsized impact of the GQ population, due to the very uneven distribution of GQs throughout the country. Second, GQs are not a monolith but a combination of various groups of people that are very different in their living arrangements and other characteristics, as with those living in college/university housing, correctional
facilities, and nursing homes. Thus, each GQ type usually requires a unique set of procedures, rules, and processes for census data collection. Further, when GQ populations are enumerated incorrectly, the impact can be severe—not only on population totals, but on the distribution of persons by characteristics. Consider the influence of a skilled nursing facility or a college dormitory on the age distribution of a small town, for example.
9.2 ACCURATE COUNTS OF GROUP QUARTERS POPULATIONS MATTER FOR LOCAL GOVERNMENTS
Although persons in GQs are a small percentage of the total population—just 2.5–3.0% for the last four censuses—there is wide variation by locality. The GQ population may be negligible in some places, while in others it is the dominant population, as when localities host a college, correctional facility, or other large GQ facility. For these localities’ own uses of census data, and for uses that involve shares of a fixed pie (e.g., redistricting, fund allocation), accurate listing of GQ locations and accurate enumeration of GQ residents are critical census functions.
It is instructive to illustrate the local importance of GQs using two examples from the 2020 Census P.L. 94-171 redistricting data file, issued in August 2021:
- College towns—In the 50 incorporated places with the highest proportion of students in college housing, students accounted for 35–95% of the population. Some examples are: Shepherdstown, WV, home to Shepherd University, which accounted for 47% of about 1,500 people; Prairie View, TX, home to Prairie View A&M University, which accounted for 71% of about 8,200 people; and Alfred Village, NY, home to Alfred University and Alfred State College, which accounted for 78% of about 4,000 people.
- Correctional facilities towns—In the 50 incorporated places with the highest proportion of people in adult correctional facilities, the residents accounted for 45–88% of the population. Some examples are: Florence, AZ, site of several federal, state, and private prisons, where incarcerated persons accounted for 57% of about 26,800 people; Sheridan Village, IL, site of Sheridan Correctional Center, where incarcerated persons accounted for 68% of about 1,700 people; and Nicholls City, GA, site of the Coffee County Correctional Facility, where incarcerated persons accounted for 76% of about 3,100 people.
The presence of a large GQ in a small governmental jurisdiction (e.g., place or minor civil division) can result in age, race/ethnicity, and sex profiles that are strikingly different from those of similarly small jurisdictions without such facilities. Such differences underscore the importance of correctly locating and enumerating GQ populations; see Box 9.1 for an example in Pennsylvania.
9.3 NUMBER OF PERSONS IN GROUP QUARTERS BY TYPE
It is impossible to capture the diversity of GQ populations in a simple set of categories. Nonetheless, Table 9.1 divides GQs into seven types used by the U.S. Census Bureau, with each major category encompassing several subcategories,1 many of which have unique populations requiring specialized data-collection methods. Three major types account for more than 77% of all persons in GQs: correctional facilities for adults, college/university student housing, and nursing facilities.
___________________
1 For a detailed list of all subcategories, see Appendix Table A-1.
- College/university student housing: Students or family members of any age who reside in living quarters affiliated with a college or university comprise the largest group, with almost 2.79 million persons or about one-third of the GQ population in 2020.
- Correctional facilities for adults: Those who are under correctional supervision of some type (i.e., adjudicated as opposed to pretrial in a local jail) constituted the next-largest GQ group, 1.97 million or 24% of the GQ population.
- Nursing facilities: Those in nursing homes, including those requiring skilled nursing care, numbered 1.63 million persons, making up about 20% of all persons in GQs.
- Other noninstitutional GQs: More than 1.36 million persons fall into this category, a little less than 17% of all persons in GQs. The largest subcategories include group homes and residential treatment facilities for adults, as well as those without a permanent residence, such as persons who receive services in shelters, soup kitchens, and from mobile food vans, and who are counted in the Service-Based Enumeration (SBE) operation. Also included here are those enumerated in targeted non-sheltered outdoor locations (TNSOLs).
| Group Quarters Type | Population | Change, 2010 to 2020 | ||
|---|---|---|---|---|
| 2010 | 2020 | Number | Percent | |
| Institutionalized population | 3,993,659 | 3,753,401 | −240, 258 | −6.0 |
| Correctional facilities for adults | 2,263,602 | 1,967,297 | −296, 305 | −13.1 |
| Juvenile facilities. | 151,315 | 88,115 | −63, 200 | −41.8 |
| Nursing facilities/skilled-nursing facilities | 1,502,264 | 1,627,046 | 124, 782 | 8.3 |
| Other institutional facilities | 76.478 | 70,943 | −5, 535 | −7.2 |
| Noninstitutionalized population | 3,993,664 | 4,485,615 | 491, 951 | 12.3 |
| College/university student housing | 2,521,090 | 2,792,097 | 271, 007 | 10.7 |
| Military quarters | 338,191 | 328,372 | −9, 819 | −2.9 |
| Other noninstitutional facilities | 1,134,383 | 1,365,146 | 230, 763 | 20.3 |
| Total | 7,987,323 | 8,239,016 | 251, 693 | 3.2 |
NOTES: Unless indicated otherwise, tabulations in this analysis are for the 50 states and the District of Columbia. Totals may differ slightly between tables in this chapter because of the application of noise and rounding to maintain the confidentiality of respondents.
SOURCE: U.S. Census Bureau tabulations from 2010 Census Advance Group Quarters Summary File (updated) and 2020 Census Redistricting Data (P.L. 94-171) Summary File, published at https://www.census.gov/library/stories/2021/08/united-states-group-quarters-in-2020-census.html.
- Military quarters: This category includes active-duty military living in military barracks located on a base or aboard a ship. They numbered about 328,000 persons or 4% of all persons in GQs.
- Juvenile facilities: Group homes for juveniles (noncorrectional), which account for about 1% of persons in GQs, include community-based group-living arrangements for youth in residential settings; residential treatment centers for juveniles (noncorrectional) for the treatment of drug/alcohol abuse, mental illness, and emotional/behavioral disorders; and correctional facilities intended for juveniles, such as facilities that provide strict confinement for their residents and detain juveniles awaiting adjudication, commitment or placement, and/or those being held for diagnosis or classification.
- Other institutional GQs: Adults who require assistance with activities of daily living and have difficulty functioning independently are just under 1% of all persons in GQs. These GQs include: psychiatric hospitals and psychiatric units in other hospitals; hospitals with patients who have no usual home elsewhere; in-patient hospice facilities; active-duty military in hospital; and live-in residential schools for persons with disabilities.
From 2010 to 2020, the total GQ population increased by 251,693 persons (a 3.2% change), with change unevenly distributed among the seven primary
types of GQs (Table 9.1). For the three largest GQ categories there were sizable changes: persons in correctional facilities for adults declined by 13%, while increases occurred for those in nursing facilities (8.3%) and in college/university student housing (11%). Those in other noninstitutional facilities increased by 230,000 (20%) between 2010 and 2020, a reflection of increases in the number of persons enumerated in small group homes, residential treatment facilities, and in the SBE.
The largest percent change between 2010 and 2020 occurred among those in juvenile facilities—a decline of 41% or 63,000 persons. A definitional change occurred between 2010 and 2020 that affects this comparison—those juveniles in residential treatment centers for mental health conditions were counted at their home residence in 2020, rather than at the facilities where these individuals were counted in 2010 (Fontenot, 2018b).
9.4 GROUP QUARTERS ADDRESS LIST DEVELOPMENT
In the development of the 2010 Census, the process of building the initial address list for Group Quarters Enumeration (GQE) was very field intensive. Living quarters were roughly classified as housing units, GQs, or transitory locations (TLs) during the all-field Address Canvassing operation, and a separate Group Quarters Validation (GQV) operation sent field staff to visit individual GQ locations, to more precisely determine the GQ type and obtain initial information about the size of the GQ. Consistent with the desire to make address updating more efficient, the Census Bureau opted not to reinstate GQV but instead defined a GQ/TL suboperation within In-Office Address Canvassing (IOAC), with the intent of validating GQ addresses in areas of change as identified by the Active Block Resolution (ABR) operation. Much of the work would be done in-office, using administrative data, local geographic information systems files, and commercial information, coupled with phone calls to GQ facility contacts (Fontenot, 2021g; Richmond and Hanks, 2022).
However, as described in Chapter 2, the ABR component of IOAC was discontinued in early 2017 due to funding uncertainty—with major implications for the GQ/TL list-development operation. No longer able to build on ABR work, the GQ/TL component was redesigned to try to review all GQ/TL entries on the MAF—albeit purely as a telephone-based operation using a standard calling script. As documented by Richmond and Hanks (2022), the GQ/TL list-development operation encountered problems from its start in summer 2017—much of the difficulty attributable to GQ facility respondents’ skepticism over the validity of the operation given the early date (the 2020 Census not being high in public view in 2017). Not least of the problems was a subtle, cosmetic one—the fact that the dialing system was such that respondents’ Caller ID systems failed to identify the call as being from “U.S. Census Bureau.”
The problems were sufficiently major that the GQ/TL component of IOAC was itself terminated early, in March 2018, citing continuing funding concerns. Moreover, there was sufficient concern over the limited information that had been collected thus far—in particular, the suspicion that the small set of results already gathered was laden with duplicate entries—and the Census Bureau opted not to forward the IOAC GQ/TL results to update the Master Address File (MAF) (Richmond and Hanks, 2022:72).
Difficulties continued in In-Field Address Canvassing (IFAC) as well, due principally to field lister error or, at least, unfamiliarity with the concepts at hand. The Census Bureau’s assessment of IFAC (Lane et al., 2022) notes that IFAC listers routinely inflated the counts of both GQs and TLs by counting each individual unit (i.e., every individual room in a college dormitory) as a GQ when only the parent site/facility should have been labeled a GQ. Moreover, quality-control work suggested that unit-type conversions by IFAC field staff (e.g., housing unit to GQ, or vice versa) tended to be problematic. Accordingly, the Census Bureau opted for the same solution as in IOAC, which was to largely refrain from using IFAC GQ/TL results to directly update the MAF—paring back clusters of newly added GQs to a single entry and treating unit-type conversions as verified housing units to be resolved in further field work (Lane et al., 2022:91).
Part of the rationale for not using 2019’s Address Canvassing information to directly update GQ information on the MAF is that there remained a key opportunity for verification and review of the GQ list prior to census operations: the Group Quarters Advance Contact (GQAC) operation, a carryover from the 2010 Census design. In GQAC in January–February 2020, field staff contacted each GQ, drawing from GQ records already on the MAF and updates from state and local governments (i.e., the Local Update of Census Addresses program).2 The GQAC interview verified the GQ name and type, collected address and contact information, and elicited an expected population count for April 1, 2020. Importantly, it also served to broker the eventual enumeration, asking which enumeration option (e.g., in-person interviewing, electronic response) would be preferred and attempting to schedule an appointment to perform the actual enumeration. Parallel work occurred for the enumeration of persons in TNSOLs, with an advance contact operation run between February 6–21, 2020, commencing final planning for the count.
___________________
2 Experimentation with contact by phone to verify the GQ list was conducted as part of the 2018 Census Test in Providence, Rhode Island. In that test, the Census Bureau found that phone contact was not effective and, as a result, decided to adopt in-person visits for the 2020 Census GQAC verification operation. The GQAC operation for the 2018 Census Test was conducted between June 18–July 10, 2018, for an enumeration in July and August of the same year. See https://www.census.gov/programs-surveys/decennial-census/decade/2020/planning-management/plan/testing-activities/2018-census-test/test/providence/group-quarters/gqac.html
This advance work fell to the wayside in March 2020 with the arrival of the COVID-19 pandemic, the shutdown of all census field operations, and the major subsequent disruption to GQ living situations—not least of which the abrupt emptying of college and university campuses and sudden sensitivity to group gatherings of all sorts. As the Census Bureau resumed field work, it had to readminister the advance contact operations for GQs, TNSOLs, and TLs to account for changed situations. In the GQAC context in particular, as we describe later, the new contacts involved a concerted push to get GQs to use electronic (and field-staff contactless) response options as much as possible. In the case of TNSOLs, another round of advance contact was held August 17–September 11, 2020, with the field enumeration beginning on September 22.
9.5 NATURE AND ORIGIN OF GROUP QUARTERS ADDRESSES
In the analysis of GQ addresses in the MAF Development Dataset (examined intensively in Chapter 5), the wide range of complexity and nuance associated with GQ addresses became apparent. Certain GQ addresses remain stable over long periods of time, such as for large correctional facilities or longstanding college/university student housing or nursing facilities, while others are far more malleable, such as small group homes for adults, residential treatment facilities, and facilities that provide services to those without a permanent address, such as shelters for people experiencing homelessness. As a consequence, no single precensus program can be expected to capture all addresses needed to conduct a complete enumeration of the GQ population.
Table 9.2 shows the origins of GQ addresses in the 2020 Census. Close to 56% were from previous censuses and older Delivery Sequence Files from the U.S. Postal Service. The largest single category of addresses resulted from GQ operations themselves (GQAC and GQE): 93,500 MAF units or 35% of the total, with another 7% from Local Update of Census Addresses submissions, Address Canvassing3 and Update Leave/Transitory Location operations. While many GQs are older and established, others are “moving targets” for data collection, with the latter requiring concerted listing efforts around the time of or even during the census.
Thus, there is a “churn” of GQ addresses around census time, which is largely the product of the more malleable group, as when the Census Bureau pays special attention to areas with large numbers of new housing units. Table 9.3 shows the distribution of the more than 95,000 MAF units involved in “transitions” during the census, in which the final disposition was a GQ MAF unit (e.g., a housing unit that transitions to a GQ during the enumeration), or in which a GQ was added as a result of one or more census address-building
___________________
3 Despite rejecting the results of Address Canvassing for the validation of GQs, a small number of those addresses ultimately made it into the 2020 GQ address list.
Table 9.2 Origins of Group Quarters Addresses in the 2020 Census
| Original Source of MAF Address | Number | Percent |
|---|---|---|
| On MAF Before 2020 | ||
| 2000 Census and Earlier | 67,000 | 25.3 |
| 2010 Census | 46,000 | 17.4 |
| Pre-2020 Delivery Sequence Files | 34,500 | 13.0 |
| Other Pre-2020 Operations & Tests | 5,200 | 2.0 |
| 2020 Census Operations | ||
| Group Quarters Operations | 93,500 | 35.3 |
| LUCA Program | 11,000 | 4.2 |
| Address Canvassing | 6,600 | 2.5 |
| Update Leave/Transitory Locations | 1,000 | 0.4 |
| Total Group Quarters MAF Units* | 265,000 | 100 |
* Estimates are based on MAF Units from the MAF Development Dataset and differ slightly from the number enumerated in the census.
NOTES: MAF, Master Address File; LUCA, Local Update of Census Addresses
SOURCE: 2020 Census MAF Development Dataset. See Disclosure Review Statement; CBDRB-FY23-0221.
operations. More than 94% of this “churn” is dominated by two categories, both involving the identification of new GQ MAF units—that is, units that did not exist in the MAF prior to enumeration activities and were added, most as a result of the GQAC operation.
The large majority of GQs in these two largest categories are considered “other noninstitutional” GQs, which mostly consist of group homes for adults and SBE sites, especially those classified as TNSOLs.4 These are the true “moving targets,” both from the standpoint of listing and enumeration. Their changing nature makes them difficult to detect ahead of time and to classify correctly, which means that good operations will always be needed in the years immediately prior to—and even during—the census to cover them well. Underscoring the difficulty, a sizable number of these MAF units, especially TNSOLs, were recoded as having 0 population in the 2020 Census.
9.6 POSTCENSUS REVIEW
Before delving into the mechanics and content of GQE in the 2020 Census, it is useful to continue the thread of GQ list/frame development, skipping ahead briefly to the aftermath of census data collection and discussing postcensus GQ review.
___________________
4 Email correspondence with Stuart Irby of the U.S. Census Bureau Geography Division, November 23, 2022.
Table 9.3 Transitions and Additions for Group Quarters Master Address File Units in the 2020 Census
| Transition or Addition | MAF Units | Percent |
|---|---|---|
| Sent to enumeration as HU, classified as vacant GQ | 1,200 | 1.3 |
| Sent to enumeration as HU, enumerated as GQ | 2,200 | 2.3 |
| Sent to enumeration as TL, classified as vacant GQ | 100 | 0.1 |
| Sent to enumeration as TL, enumerated as GQ | 200 | 0.2 |
| Added (existing MAF unit) by census and classified as vacant GQ | 50 | 0.1 |
| Added (existing MAF unit) by census and enumerated as GQ | 1,600 | 1.7 |
| Added (new MAF unit) by census and classified as vacant GQ | 26,000 | 27.2 |
| Added (new MAF unit) by census and enumerated as GQ | 64,000 | 67.0 |
| 95,500 | 100.0 |
NOTE: MAF, Master Address File; HU, housing unit; GQ, group quarters; TL, transitory location. Table covers MAF units with a final disposition as a GQ location.
SOURCE: Special tabulation from the MAF Development Dataset by Stuart Irby, Geography Division, U.S. Census Bureau. See Disclosure Review Statement; CBDRB-FY23-0221.
In the 2010 Census, the Census Bureau—working with the Federal-State Cooperative on Population Estimates—conducted a check of GQ addresses to identify missing GQs, holding this review late in the data-collection and processing stages so that problems could be fixed before the release of apportionment counts on December 31, 2010. The Census Bureau hosted a group of local officials who had Special Sworn Status and access to local data, to review interim GQ data and assess deficiencies.
After the successful implementation in 2010, a similar late-stage check of GQ data was planned in the 2020 cycle as adjunct to the Count Review program. However, the COVID-19 pandemic-induced delays and tight operational deadlines—as well as restrictions on in-person gatherings—caused the GQ review program to be conducted on a much more limited scale. Ultimately, the release of the apportionment counts was delayed beyond December 31, 2020, but it was too late to perform the GQ review program. In lieu thereof, and acknowledging likely problems with the count, the Census Bureau worked with local stakeholders to construct a post-census review program called Post-Census Group Quarters Review (PCGQR). While this review program could not prevent GQ coverage problems entering the census tabulations, it provided an opportunity for local governments to identify missing GQ addresses and for the Census Bureau to correct the base for population estimates going forward. See Box 9.2 for a description and current status of the program.
This experience has major ramifications for any program aimed at preparing for the 2030 GQ enumeration. While it is important to curate a list of GQs throughout the decade with some equivalent of an ongoing GQAC
program, it is unrealistic to expect that such an activity alone will provide good coverage of the GQ universe for 2030. A vital part of good coverage needs to involve verification and discovery activities immediately prior to and during the enumeration itself.
9.7 THE COLLECTION OF GROUP QUARTERS DATA IN THE 2020 CENSUS
9.7.1 Occupancy Status
The changing nature of GQs in and around the 2020 Census enumeration is reflected in their occupancy status, which is shown in Table 9.4. The most salient finding was the relatively high level of vacancy overall, with 23% of GQs deemed vacant during the census, and another 4% subject to deletion. Except for nursing facilities, vacancy levels were in the double digits for all major GQ types. It is important to keep in mind that vacant GQ units are part of the census enumeration, not unlike vacant housing units with recognized addresses that are part of the housing stock, irrespective of occupancy status.
Owing to the unpredictable nature of military deployments and changing status of military bases, 39% of military GQs were deemed vacant in the enumeration. In contrast, nursing homes and college/university student housing had lower levels of vacancy, with the latter offering at least some reassurance about their count, given the special circumstances surrounding dorm residents. Among the large group of “other noninstitutional” GQs,
Table 9.4 Group Quarters by Occupancy Status and Type, 2020 Census
| GQ Type | Total GQs | Occupancy Status (%) | ||
|---|---|---|---|---|
| Occupied | Vacant | Delete | ||
| Correctional (Adults) | 17,000 | 79.4 | 18.8 | 1.8 |
| Juvenile | 9,000 | 73.3 | 24.4 | 2.2 |
| Nursing Homes | 29,000 | 89.7 | 9.0 | 1.6 |
| Other Institutional | 3,100 | 67.7 | 29.0 | 2.9 |
| College/University Student Housing | 39,000 | 84.6 | 13.8 | 2.1 |
| Military | 5,900 | 57.6 | 39.0 | 3.4 |
| Other Noninstitutional | 161,000 | 65.8 | 28.0 | 5.8 |
| Total | 264,000 | 72.3 | 23.3 | 4.4 |
NOTE: GQ, group quarters.
SOURCE: Tabulation from Census Unedited File (CUF), originally prepared for American Statistical Association Task Force on the Quality of the 2020 Census (WRF T2 ASADQS Table 11A All TEAs). See Disclosure Review Statement; CBDRB-FY23-0221.
including small group homes for adults and SBE locations, 28% were deemed vacant, with another 6% deleted during the enumeration. The level of deletions among “other noninstitutional” GQs was, by far, the highest for any major GQ type and, again, is likely evidence of the higher level of instability among addresses in this category, despite many being added just prior to or during the enumeration itself.
9.7.2 Imputation of Occupancy Status and Population Counts
As the 2020 Census was nearing completion, the Census Bureau recognized that many GQs had not provided the information necessary to determine occupancy status, much less population counts (Fontenot, 2022a). In response to this problem, the Census Bureau assembled a team to make final determinations regarding the occupancy status of GQs and, where appropriate, their population counts. The team conducted a telephone operation to contact GQs for which there was incomplete data. The results of this calling operation were then combined with information from the GQAC in January/February 2020, to determine occupancy status and population counts. (Recall that the GQAC operation collected the expected population and maximum population capacity expected on Census Day as well as notes from the interviewer regarding the GQ’s operational status, including whether the GQ would be nonexistent or vacant on Census Day.) The GQAC information was especially important for those situations in which a population count of zero was indicated and a decision needed to be made about the accuracy of that count. In those situations in which the Census Bureau had a completed interview but no population
count, it was largely inferred that the GQ was vacant on Census Day. Moreover, due to the transient nature of GQs that provide services, such as shelters, soup kitchens, mobile food vans, and TNSOLs, the Census Bureau usually determined that a count of zero obtained during the enumeration was accurate and those GQs were deemed to be vacant.
For GQs that were determined to be occupied but with no population count, an imputation method provided a count. The method relied heavily on the expected and maximum counts from the GQAC operation in January/February 2020 and a series of indicators, called auxiliary data, which consisted of information from Census Bureau surveys (e.g., American Community Survey), various lists, and, in some cases, administrative data from other agencies (e.g., National Center for Education Statistics). If these sources were not available, the Census Bureau used data for the same GQ type within the same state as a basis for imputing counts. Thus, to the extent possible, the new GQ imputation process involved using other sources of data for the same GQ location and—barring that—information about different GQs of the same type.
An important feature of the imputation method was the use of ratios between the auxiliary information and the reported count for each GQ type within the state. The count from auxiliary data was then multiplied by the relevant ratio to get a final count for a GQ. For example, if the Census Bureau found that the count from a reporting hospital was, on average, 95% of the estimated count from their 2020 GQAC visits for all such hospitals across the state, a 2020 count was imputed for nonresponding hospitals that was 95% of the hospitals’ estimated counts from 2020 GQAC (Fontenot, 2022a).
Of the 264,000 GQs, about 9% were deemed eligible for count imputation, with about one-quarter of those actually receiving imputed counts, which amounts to about 2% of all GQ facilities in the enumeration (Table 9.5). For the three largest GQ types by population, the percent of all GQs that were count imputed was very low for adult correctional facilities and nursing facilities (1.2%), but was well above the average for college/university student housing (3.1%). While “other noninstitutional” GQs had a count imputation rate slightly below the average for all GQs, these facilities accounted for more than one-half of all GQs with imputed counts—54%. The highest percentage of GQs with imputed counts was among two small groups—“other institutional” facilities (6.5%) and juvenile facilities (4.4%).
9.7.3 Methods of Data Collection by Group Quarters Type
The original operational plan for persons in GQs aimed to collect data in ways tailored to the characteristics of residents. In some cases, data were available electronically from records maintained by federal agencies (e.g., military, federal penitentiaries) or from administrators of facilities (e.g., state
Table 9.5 Count Imputation for Group Quarters, 2020 Census
| GQ Type | Total GQs | Eligible for Count Imputation | Eligible and Count Imputed | Percent Distribution | |||||
|---|---|---|---|---|---|---|---|---|---|
| N | Percent of All GQs | N | As Percent of Eligible GQs | As Percent of All GQs | All GQs | Eligible GQs | Eligible and Count Imputed | ||
| Total Eligible GQs | 264,000 | 23,000 | 8.7 | 5,500 | 23.9 | 2.1 | 100.0 | 100.0 | 99.1 |
| Correctional (Adults) | 17,000 | 1,500 | 8.8 | 200 | 13.3 | 1.2 | 6.4 | 6.5 | 3.6 |
| Juvenile | 9,000 | 1,200 | 13.3 | 400 | 33.3 | 4.4 | 3.4 | 5.2 | 7.3 |
| Nursing Homes | 29,000 | 800 | 2.8 | 350 | 43.8 | 1.2 | 11.0 | 3.5 | 6.4 |
| Other Institutional | 3,100 | 500 | 16.1 | 200 | 40.0 | 6.5 | 1.2 | 2.2 | 3.6 |
| College/University Student Housing | 39,000 | 2,000 | 5.1 | 1,200 | 60.0 | 3.1 | 14.8 | 8.7 | 21.8 |
| Military | 5,900 | 500 | 8.5 | 100 | 20.0 | 1.7 | 2.2 | 2.2 | 1.8 |
| Other Noninstitutional | 161,000 | 16,500 | 10.2 | 3,000 | 18.2 | 1.9 | 61.0 | 71.7 | 54.5 |
NOTES: GQ, group quarters.
SOURCE: U.S. Census Bureau - RFI21.3 GQ_CI_NI_GQtype. See Disclosure Review Statement; CBDRB-FY23-0221.
prisons and other correctional facilities). For many GQ types, however, the options available for data collection were far more varied, for example for skilled nursing facilities, where records are usually kept for licensing and/or reporting purposes, but where access can be an issue, depending on local recordkeeping requirements and methods. In other cases, such as the collection of data for persons experiencing homelessness, collection usually involves fieldwork at places where services are obtained, such as shelters and mobile food van sites.
The Census Bureau temporarily suspended field operations on March 18, 2020, in response to the emerging COVID-19 pandemic. As the pandemic continued, it became clear that the Census Bureau needed to adjust its plans for enumerating GQs. This was especially the case for three populations: those living in college/university student housing, who left campus early and were no longer present to complete a form; and nursing homes and correctional facilities, where restrictions on access frustrated data-collection efforts. In these cases, the Census Bureau contacted facility administrators who originally opted for in-person enumeration, to encourage the submission of information electronically. In-person visits to GQs did not resume until July 1, 2020. Finally, the Census Bureau issued a letter to college and university presidents on June 15,5 noting the importance of counting college students “where they usually live as of April 1, 2020, even if they left town early because of a school closure or shift to distance learning.” However, the letter mentioned the GQ effort—collecting data on the on-campus student housing population—only in passing; instead, the letter’s principal focus was the off-campus student population, living in housing units near campus that are not owned by the college or university. The letter advised the schools that the Census Bureau would soon request their assistance in obtaining “basic information about students who live off-campus, including local address information,” by sending “records through a secure portal or by other arrangements.”
Promoting electronic response on the college/university student housing population (both the GQ on-campus and regular housing unit off-campus segments) was a necessary measure given the COVID-19 pandemic conditions. However, it had the effect of exacerbating a known and long-standing mismatch between census law (in Title 13 of the U.S. Code) and the Family Educational Rights and Privacy Act (FERPA; codified at 20 U.S.C. § 1232g). In short, absent direct interview of students (and hence expressed consent), FERPA prohibits colleges and universities from releasing personally identifiable information from education records with very few exceptions, the decennial census not being defined as such an exception. However, FERPA does permit the release of “directory information” without express consent, provided that a student has not explicitly opted out of such disclosure. The FERPA language itself defines
___________________
5 See https://www.census.gov/content/dam/Census/newsroom/press-kits/2020/addp-2l-students-2020-letter.pdf.
“directory information” as including “name, address, telephone listing, [and] date and place of birth,” as well as such data as major field of study and dates of attendance at the school; however, the definition ultimately depends on what information the college or university designates as “directory information” through public notice. In August 2019, the Census Bureau circulated a letter to student housing administrators reiterating its commitment to collect data in compliance with FERPA, foreshadowing its intent to request “permitted disclosure under FERPA” of directory information “for students who do not respond;” on January 29, 2020, the U.S. Department of Education circulated a detailed letter to all institutions of higher education reiterating its interpretation of FERPA as it applies to the 2020 Census, explicitly noting that it has, “since at least 1991, . . . consistently advised that the disclosure of a student’s sex, ethnicity, or race as directory information would not comply with the regulatory definition.”6 In short, the Census Bureau found itself in a position of having to push for increased electronic submission of at least some information on college students, even though FERPA generally prohibits the sharing of key census data items through “directory information” submitted directly by the college or university.
In light of the COVID-19 pandemic, the need to temporarily abandon efforts to conduct the SBE—at places including temporary shelters, soup kitchens, mobile food van locations, and certain outdoor locations—also became apparent. Because it is intended to represent the service-receiving population of persons without a permanent residence as of the Census Day reference point, SBE was planned to occur similarly to 2010—with deployment of field staff to conduct the count on or very near Census Day (in this case, scheduled for March 30–April 1, 2020). After consulting with stakeholders and experts on how best to conduct the SBE on a different date (and in a different season of the year), SBE operations were moved to September 22–29, 2020. The Census Bureau closely coordinated visits to shelters and TNSOLs with administrators and local officials in advance, to facilitate the count of persons experiencing homelessness.
For most GQ types, quality checks were performed. Cases were assigned for reinterviews and a special form was used to follow up. Area Census Office staff used the reinterview form to telephone each GQ and confirm that the enumerator visited the correct facility at the correct address. The reinterview determined if the enumerator obtained a population count within an acceptable range (defined as plus or minus 20%) of the count provided by the GQ contact during reinterview.
___________________
6 See https://studentprivacy.ed.gov/sites/default/files/resource_document/file/ED_SPPO%20Letter%20to%20IHEs%20re%202020%20Census_v_01292020.pdf; the August 2019 Census Bureau letter is copied as an attachment to the U.S. Department of Education letter.
As data collection proceeded, gaps and inconsistencies in the information appeared, in the form of partial responses and missing information. In addition, for college/university student housing, the Census Bureau observed that students were being reported in more than one location on campus, for example in a main location and a specific dormitory building. This observation prompted the Census Bureau to reinitiate contact with more than 10,000 GQs to collect additional information and to reconcile and/or confirm information that was already collected. This operation occurred from December 10–21, 2020, and involved a cadre of staff in field offices, the National Processing Center, and Census Bureau headquarters. When information was still missing, the Census Bureau used count imputation to fill in the gaps, which was the first time that count imputation was deployed for the GQ population.
As mentioned earlier, the Census Bureau collected data for persons in GQs using methods that differed based on the population to be enumerated and their residential living arrangements. The manner in which each enumeration mode was used in the 2020 Census also depended on the effects of the COVID-19 pandemic on residents. A broad outline of the methods used for selected GQ types is presented in Table 9.6, which provides a list of the methods, with notation indicating necessary changes implemented by the Census Bureau based on pandemic-related restrictions and logistical problems.
In-Person Enumerations occurred through face-to-face interviews using Individual Census Questionnaires administered by census fieldworkers. Originally, this operation was to take place in the field from April 1–June 12, 2020, in the United States and Puerto Rico. With the onset of the COVID-19 pandemic, however, the operation was postponed and took place from July 1–August 26, 2020. It is important to note that in-person enumeration was the sole source of data for persons enumerated in SBE locations other than shelters, including soup kitchens, mobile food vans, and in TNSOLs.
Drop-Off/Pick Up involved enumerators setting a time to drop off paper questionnaires to a GQ administrator or other contact person, as well as a time to pick up the completed questionnaires. Using a paper roster, the enumerator compared the number of questionnaires collected with the number of residents listed on the roster. If the numbers differed, the enumerator reached out to the GQ administrator or other contact person for a resolution.
Facility Self-Enumeration involved a Census Bureau-sworn GQ representative (e.g., facility staff member) conducting the enumeration of residents at the GQ. This method was used in correctional facilities, military installations, and medical facilities. In some cases, other GQ facilities requested to self-enumerate their residents, given the risks posed by the COVID-19 pandemic and potential disruption to their operations.
Paper Response Data Collection (PRDC), sometimes referred to as Paper Listing, involves enumerators picking up a template containing resident response information, specifically, first and last name, age, date of birth, ethnicity, race,
Table 9.6 Allowable Enumeration Methods by Group Quarters Type and Code, 2020 Census
| In-Person Interview | Drop Off/Pick Up | Facility Self-Enumeration | Paper Response Data Collection | eResponse | |
|---|---|---|---|---|---|
| Federal Correctional Facilities (101, 102)a | No | No | No | No | Yes |
| State, Local Prisons (103, 104, 105); Juvenile Facilities (202, 203); Other Institutional (401, 402, 403) | Yes | Yes | Yes | Yes | Yes |
| Military Jails (106) | No | No | Yes | No | Yes |
| Juvenile Group Homes (201); College/University Student Housing (501, 502); Adult Group Homes (801); Workers’ Group Living Quarters (901) | Yes | Yes | Yesb | Yes | Yes |
| Skilled Nursing Facilities (301); Adult Residential Treatment (802) | Yes | Yes | Yes | Yes | Yes |
| Military Treatment Facilities (404); Military Quarters (601) | No | Yesb | Yes | Yesb | Yesb |
| Shelters (701) | Yes | Yesb | No | Yes | No |
| Soup Kitchens, Mobile Food Vans (702, 704) | Yes | No | No | No | No |
| Targeted Non-Sheltered Outdoor Locations (706) | Yes | No | No | No | No |
a Drop Off/Pick Up, Facility Self-Enumeration, Paper Response Data Collection, and eResponse were all offered to code 101 and 102 correctional facilities operated by the Bureau of Indian Affairs.
b These modes were not initially offered to these GQ types, but were made available when operations were altered due to the COVID-19 pandemic.
SOURCE: Adapted from Group Quarters Operations Integrated Project Team, “2020 Census Group Quarters Operational Assessment Study Plan—Final.” Version 1.22, June 8, 2022. See Disclosure Review Statement; use of this table was included in CBDRB-FY23-0221.
and alternate address information. After undergoing a series of checks at the Area Census Office level, the lists were sent to the National Processing Center, where clerks entered response information for the GQ into the Decennial Tracking and Control System (DTCS).
In addition, the Census Bureau offered an alternate Paper Response Data Collection method, in which GQ contact persons could mail back paper listings to Area Census Offices, which would then send the information to the National Processing Center for entry into the DTCS. This method was especially useful in situations in which COVID-19-related restrictions discouraged face-to-face contact. PRDC templates were used for these two operations from April 20–August 26, 2020.
The eResponse option provided facility administrators with a means of submitting electronic records to the Census Bureau via the Secure Web Incoming Module portal, which was developed to permit transfer of geographic data from local partners to the Census Bureau. The point of contact for the facility was given a unique user ID to electronically submit response data for each person living or staying at the facility on Census Day. The electronic portal provided viewable and printable information, including: a message to GQ administrators encouraging participation in the census; a confidentiality statement; the standard template (in Microsoft Excel format) and a sample entry; and a toll-free help desk number. Data were expected to be entered into the Excel template provided by the Census Bureau and uploaded to the portal; when submitted in the expected manner, GQ administrators were notified that their data had been received, and also notified of any missing records or errors in the data received. Submissions that did not follow the standard template format were sent to the National Processing Center and treated as paper data-collection responses. eResponse was the sole method used for the collection of data for federal correctional facilities, based on data from the Federal Bureau of Prisons. With the onset of the COVID-19 pandemic, the Census Bureau extended eResponse availability through August 28, 2020, and urged facilities to utilize eResponse whenever practical.
The large majority of all GQs in the 2020 Census provided data to the Census Bureau via eResponse and Paper Listings. Almost half of all GQs used eResponse and about one-third used Paper Listings (Table 9.7). Another 11% provided data via Facility Self-Enumeration. A submission by an administrator, based on facility records, is not considered to be an administrative records enumeration, but part of the general data collection; hence the very small number in the Administrative Records column.7 The HU to GQ, UHE Processing column includes enumerations initially thought to be housing units,
___________________
7 This category consists largely of administrative records enumerations of what were originally deemed housing units but were converted to GQs, and records of the deployed military. In addition, some records submitted through the Off-Campus Administrative Records Program for what were deemed GQs are included.
| GQ Type | Method of Data Collection (%) | |||||||
|---|---|---|---|---|---|---|---|---|
| Paper Overall | eResponse Listing | Facility | Self-Enumeration | Administrative Records | HU to GQ, UHE Processing | Other Operational Sources | Count Imputation | |
| Total | 8,238,969 | 49.0 | 33.5 | 10.7 | 0.0 | 1.0 | 3.7 | 2.0 |
| Correctional (Adults) | 1,960,127 | 76.8 | 17.7 | 2.2 | 0.0 | 0.1 | 2.2 | 0.9 |
| Juvenile Facilities | 87,252 | 46.0 | 32.3 | 11.9 | 0.0 | 1.0 | 3.2 | 5.6 |
| Nursing Homes | 1,622,249 | 37.4 | 42.0 | 14.1 | 0.0 | 0.4 | 4.8 | 1.2 |
| Other Institutional | 70,894 | 33.2 | 40.7 | 10.4 | 0.0 | 0.9 | 6.2 | 8.7 |
| College/University Housing | 2,790,556 | 58.1 | 32.7 | 1.6 | 0.1 | 0.3 | 4.4 | 2.8 |
| Military | 328,833 | 4.3 | 71.7 | 14.1 | 0.2 | 0.2 | 7.0 | 2.5 |
| Other Noninstitutional | 1,379,058 | 16.6 | 38.2 | 36.4 | 0.0 | 4.5 | 2.1 | 2.2 |
NOTES: GQ, group quarters; HU, housing unit; UHE, usual home elsewhere.
SOURCE: WRF T2 ASADQS Table 11A All TEAs. See Disclosure Review Statement; CBDRB-FY23-0221.
but that turned out to be GQs, as well as processing for persons with Usual Home Elsewhere (UHE) resulting in persons counted in a GQ instead of a housing unit. This accounted for about 1% of all persons in GQs. Other Operational Sources of GQ counts consisted of counts collected through the GQ Calling Operation, and the redistribution of facility-level counts to a single GQ. Concerning the latter, it is common for individual GQs (e.g., dormitories, hospital buildings, military barracks), to be part of larger GQ facilities. In some instances, the Census Bureau had to redistribute total facility-level counts that were inadvertently assigned to a single building, leaving other buildings without populations (e.g., total hospital facility count assigned to a single GQ building on a medical campus). Another similar problem occurred when some universities submitted counts for all students in college/university student housing for each dorm on campus, creating duplication that necessitated correction (Fontenot, 2022a; Thieme, 2021).
As emphasized in the earlier discussion, overall numbers for GQs can be very deceiving as a measure for any one type or category. For the three largest GQ categories, the methods used to collect data varied substantially. Correctional facilities made maximum use of eResponse (77%), likely the result of the requirement for federal facilities to participate via that route, unlike those at state and local levels, for which other response modes were permitted. Among responses from college/university student housing, reliance on eResponse also accounted for a majority of all responses (58%); but, given the wider variety of response options available, about one-third used Paper Listings as a response pathway. For the third largest GQ group—residents of nursing homes—the picture is even more varied. With all response mode options available, 42% responded with Paper Listings, 37% via eResponse, and an additional 14% used Facility Self-Enumeration.
For those in other noninstitutional GQs, response options also varied. Those in group homes for adults and in shelters for persons without a permanent residence had a fairly wide set of response options available; but, for those in soup kitchens, mobile food van locations, and TNSOLs, the only available mode was an in-person interview. Thus, Paper Listings and Facility Self-Enumeration accounted for the majority of enumerations. At the other end of the spectrum were military GQs, for which the large majority (72%) of responses were collected via Paper Listings, and Facility Self-Enumeration accounted for 14%. Originally, to enumerate military personnel in GQs, the Census Bureau planned to use administrative records through the Defense Manpower Data Center. After initial testing demonstrated that these files were faulty, the Census Bureau decided to permit other response pathways, the primary one being a paper-based reporting using Military Census Reports (Fontenot, 2021g:4).
SOURCE: WRF T2 ASADQS Table 11A All TEAs. See Disclosure Review Statement; CBDRB-FY23-0221.
9.7.4 Facility Self-Enumeration
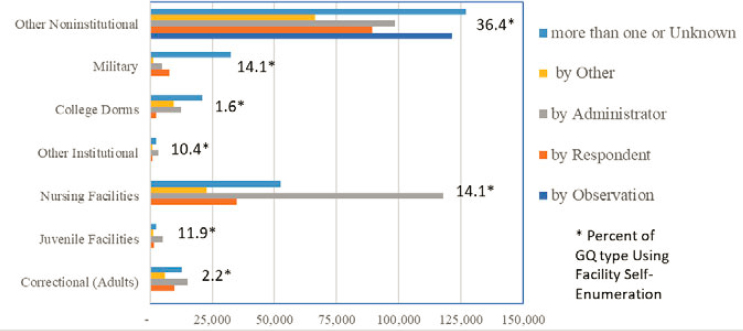
As discussed earlier, Facility Self-Enumeration involved a Census Bureau-sworn GQ representative (e.g., facility staff member) conducting an enumeration of residents at the GQ. Depending on the living arrangements and circumstances of residents, difffering personnel or methods could be used to collect the characteristics data within a facility: through observation, administrator queries, or interview with respondents themselves. Figure 9.1 shows how Facility Self-Enumeration was carried out within each of the GQ types. The large and varied mix of intake methods for those in “other noninstitutional” GQs is a testimony to the variety of subgroups in this category. This is quite significant because more than 36% of all data collection in “other noninstitutional” GQs made use of this method. The other observation that stands out is the substantial contribution of facility administrators in the data collection for nursing facilities. While comprising just 14% of all data collection for such places, the data obtained through administrators was likely pivotal, given the difficulties encountered in these facilities as a result of the COVID-19 pandemic.
9.7.5 Item Nonresponse by Group Quarters Type
Beyond the counts themselves, collecting data on the characteristics of GQ residents proved to be difficult for a number of GQ types in the 2020 Census
Table 9.8 2020 Census Item Nonresponse Rates for Group Quarters Person-Level Items, by Type
| GQ Type | Sex (%) | Age/Date of Birth (%) | Hispanic Origin (%) | Race (%) |
|---|---|---|---|---|
| All GQs | 22.0 | 17.8 | 43.9 | 30.2 |
| Institutional GQs | 4.7 | 4.8 | 27.1 | 8.7 |
| Correctional Facilities for Adults | 3.2 | 3.4 | 25.9 | 5.0 |
| Juvenile Facilities | 4.8 | 5.8 | 22.8 | 10.8 |
| Nursing Facilities | 6.4 | 6.2 | 28.7 | 12.9 |
| Other Institutional Facilities | 9.9 | 9.4 | 34.0 | 16.1 |
| Noninstitutional GQs | 36.7 | 28.9 | 58.0 | 48.4 |
| College/University Student Housing | 43.9 | 27.2 | 62.4 | 54.3 |
| Military Quarters | 25.6 | 40.5 | 76.6 | 62.8 |
| Other Noninstitutional Facilities | 24.9 | 29.4 | 45.3 | 33.5 |
NOTE: GQ, group quarters.
SOURCE: 2020 Census Unedited File, tabulation by DeJesus and Konya (2023:16).
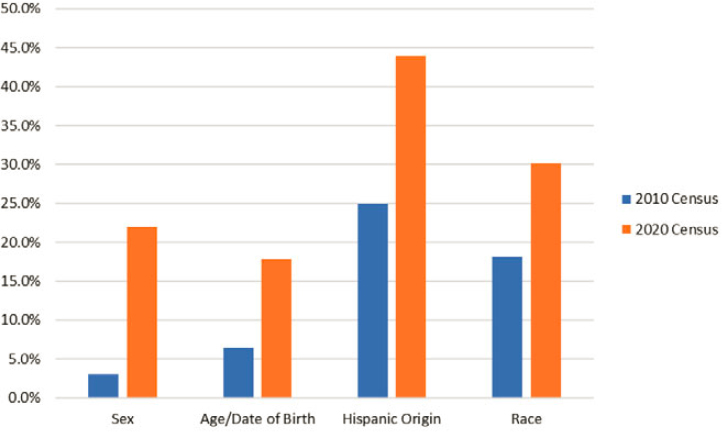
(Table 9.8). For all GQs, the level of missing data was substantial, across the board by characteristic: age (18%), sex (22%), race (30%), and Hispanic origin (44%). All of these rates represent substantial increases over rates seen in 2010 (Figure 9.2). For the missing characteristics the Census Bureau developed an imputation method to fill the void (see Box 9.3 for a description of imputation for GQ characteristics).
Like so many observations involving GQs, however, overall numbers can be deceiving and only begin to tell the story of missing data. In general, institutional GQs had much lower rates of missing information on each of the four key variables than did noninstitutional GQs. While it is impossible to reach any definitive conclusions with the available data,
SOURCE: 2020 Census Unedited File, tabulation by DeJesus and Konya (2023:49).
it is likely that the differences between institutional and noninstitutional GQs relate to the less stable nature of populations in these specific settings. Residents in noninstitutional GQs come and go more freely, which may make capturing their characteristics more difficult, as with college students living in college/university student housing, persons in small group homes for adults, and those in service-based locations.
Just 5% of residents in institutional GQs were missing data on sex and age, while the percentages were 37 and 29%, respectively, for noninstitutional GQs. For race, the picture was similar, albeit more pronounced—9% for persons in institutional settings, compared with 48% for those in noninstitutional settings. While higher nonresponse was also characteristic of reporting on Hispanic origin for those in noninstitutional GQs (54%) compared to institutional GQs (27%), even more important was the very high level for all GQ types. For specific types of GQs, two observations stand out: First is the high level of missing data for sex and age for the three noninstitutional GQ types—no less than one-quarter of residents missing this very basic information. Especially noteworthy are the college/university enumerations missing data on sex and the military enumerations missing information on age. Second are the ultra-high levels of missing data on race and Hispanic origin for these
same noninstitutional GQ types, with the military having the highest levels of missing data for Hispanic origin (77%) and race (63%). As a next step, it is instructive to ask whether patterns of missing data may bear some relationship to the mode of data collection. To this end, we now examine item nonresponse by GQ type by mode of data collection, with a focus on the two modes that accounted for the largest part of the data collection: eResponse and Paper Listings.
eResponse
The effort to automate data collection using eReponse is laudable and represents an important innovation, especially given the circumstances surrounding the COVID-19 pandemic. In general, missing data rates were low for all items obtained via eResponse for most GQ types, a very important and instructive finding given the high overall rates of missing data for GQs (Figure 9.3). For sex, age, and race, rates of missing data for most GQ types that reported via eResponse were well under 5%. Rates of missing data for Hispanic origin were higher for “other institutional” GQs, but only for adult correctional facilities was the rate higher than 10%, modest by overall standards. This is especially important for those large-category GQ types that made heavy use of eResponse, such as adult correctional facilities, of which 76% utilized this mode, and among nursing facilities, of which close to 40% used eResponse. Perhaps the automated nature of eResponse and programmed completeness checks paid off in the form of better reporting.
The one big exception to this encouraging pattern occurred for college/university student housing, for which eResponse was used heavily but the FERPA restrictions on sharing anything but “directory information” (see Section 9.7.3) resulted in very high rates of missing data for basic items: age (16%), sex (27%), race (32%) and Hispanic origin (35%).
Reporting of Hispanic Origin by State: A Closer Look at College/University Student Housing Using eResponse
To understand where the higher rates of missing data for college/university student housing GQs had the most impact, Table 9.9 shows the states with the highest levels of missing data for the question on Hispanic origin. Of those states with the highest percentages missing for Hispanic origin, all used eResponse well in excess of the 49% average for all states. Delaware, the District of Columbia, and Arizona stand above the pack, with rates of missing data of at least 70% and utilization of eResponse between 63–77%—high by any standard and, as a result, very impactful on overall levels of missing data on this attribute. An examination of the level of missing data for college/university student housing on the Hispanic-origin question for all states reveals a moderate positive

SOURCE: WRF10 GQ INR Rates by Response Type. See Disclosure Review Statement; CBDRB-FY23-0221.
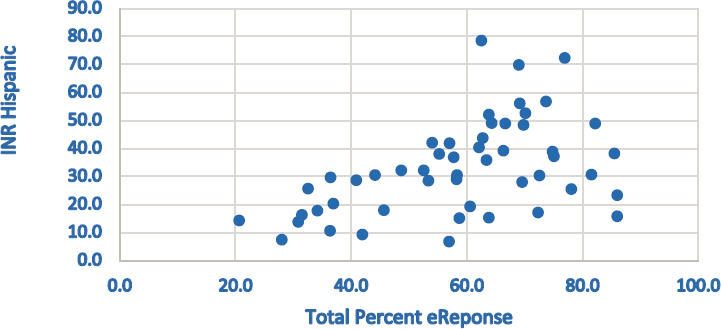
relationship (r = 0.48) with the total utilization of eResponse (Figure 9.4). This begs the question of whether this relationship is somehow related to the Hispanic-origin composition of a state, given the concerns about answering the census in Hispanic communities throughout the nation. Figure 9.5 shows that there is little relationship between percent Hispanic origin in a state and the level of missing data for Hispanic origin (r = 0.09). It is important to remember, however that this analysis is for the population in college/university student housing whose information was collected via eResponse, a subset of the population that may be far different from the overall Hispanic-origin composition at the state level.
The unique results for college/university student housing, relative to other GQ types, certainly imply that the deficiency in the reporting of missing data is related to respondent resistance and/or confusion over the proper interpretation of FERPA. However, more research is needed to examine why the eResponse system failed to detect and/or correct this deficiency.8 Further, work needs to be done at executive and legislative levels to clarify reporting methods for institutions of higher education, given the FERPA requirements,
___________________
8 Attention should also be paid to possible effects of high rates of missing data items for off-campus college students, to the extent to which such data were gathered through eResponse-type directory information from institutions of higher education.
| State | College/University Housing Responses (all modes) | Total eResponse | Percent Total eResponse | Hispanic Item Nonresponse, in eResponse |
|---|---|---|---|---|
| Delaware | 11,147 | 6,970 | 62.5 | 78.6 |
| District of Columbia | 23,839 | 18,340 | 76.9 | 72.4 |
| Arizona | 38,948 | 26,890 | 69.0 | 69.8 |
| New Hampshire | 22,792 | 16,808 | 73.7 | 56.8 |
| Alabama | 45,486 | 31,428 | 69.1 | 56.2 |
| Oregon | 25,398 | 17,801 | 70.1 | 52.6 |
| Georgia | 82,345 | 52,536 | 63.8 | 52.2 |
| Rhode Island | 25,945 | 16,694 | 64.3 | 49.1 |
| Maryland | 46,124 | 30,715 | 66.6 | 49.0 |
| Wisconsin | 60,151 | 49,468 | 82.2 | 48.9 |
| Ohio | 111,714 | 78,013 | 69.8 | 48.5 |
NOTE: Table is limited to states with approximately 49% or more nonresponse to the Hispanic-origin item.
SOURCE: WRF10 GQ INR Rates by Response Type. See Disclosure Review Statement; CBDRB-FY23-0221.
and to clarify operational improvements in time for the 2030 Census. Given the level of automation, it should be possible to conduct checks on the eResponse system to further drill down and, with some qualitative interviews with college administrators, try to determine why levels of missing data were so high for college/university student housing in some states and not in others.
Paper Listings
As discussed earlier, the Paper Listings mode involves the use of a template that is filled out by GQ administrators and reviewed at a number of points by census workers in Area Census Offices and in the National Processing Center, as the data from a facility or location are entered into the system. With the exception of college/university student housing, data collection via Paper Listings was subject to higher levels of missing data on characteristics across GQ types, relative to data collected via eResponse (see Figure 9.6).
More than any other GQ type, those in military GQs had high levels of missing characteristics data, which is especially important because of the high reliance of this GQ type on Paper Listings (70%). The high item nonresponse for Hispanic origin was 69% and helps explain the high overall item nonresponse for Hispanic origin of 77%, discussed earlier. The elevated
NOTE: INR, item nonresponse.
SOURCE: Source: WRF10 GQ INR Rates by Response Type. See Disclosure Review Statement; CBDRB-FY23-0221.
level of missing data on the other three items for military GQs is indicative of a data-collection anomaly that needs to be addressed for 2030—especially given the breakdown of quality-assurance checks that were supposed to occur during the Paper Listing template-intake process.
The fact that college/university student housing has elevated levels of missing information on characteristics via the Paper Listings mode lends credence to the idea that this problem relates more to the rules regarding administrative data access than to the mode of collection. Again, a remedy that addresses the rules regarding FERPA needs to be developed for the 2030 Census.
Finally, two other observations are instructive. The first is the inability of Paper Listings to capture data on Hispanic origin, relative to other characteristics, across the board by GQ type. The pervasiveness of this finding necessitates further research, to understand the underpinnings of the apparent reticence on this attribute. Did something in the mechanics of reporting or an attribute of the environment produce this shortfall? A second observation concerns the completeness of data for “other noninstitutional” GQs, which in this case includes a large number of adult group homes, residential treatment facilities for adults, and shelters for those experiencing homelessness—three ever-changing populations that can be particularly challenging to enumerate.

NOTES: INR, item nonresponse. Percent Hispanic is derived from 2021-vintage population estimates by the U.S. Census Bureau.
SOURCE: Source: WRF10 GQ INR Rates by Response Type. See Disclosure Review Statement; CBDRB-FY23-0221.
Yet in this case, missing data levels were modest compared with military GQs and college/university student housing, and in the same range for several institutional GQ types.
9.8 CONCLUSIONS AND RECOMMENDATIONS
The diversity of living situations falling under the broad heading of the nonhousehold GQ population makes it a perennial challenge in the decennial census. GQ enumeration is always difficult, and the COVID-19 pandemic-induced operational adjustments were particularly hard to grapple with in this regard. As with other parts of the 2020 Census, Census Bureau staff rendered laudable and extraordinary efforts to adapt to the conditions and make the GQ count as complete as possible. Yet it is only fair to reiterate that not all of the 2020 Census challenges in GQ were unique to the circumstances of 2020.
Conclusion 9.1: The enumeration of nonhousehold group quarters (GQ) locations in the 2020 Census experienced major shortcomings, some of which can be directly attributed to COVID-19 pandemic adjustments to the data-collection scheduling (e.g., the scuttling of

SOURCE: WRF10 GQ INR Rates by Response Type. See Disclosure Review Statement; CBDRB-FY23-0221.
prearranged plans for in-person enumeration worked out in the Group Quarters Advance Visit operation). Yet several important operational and conceptual shortcomings cannot be attributed solely to the pandemic, such as the mismatch between census content and the U.S. Department of Education’s interpretation of permissible data provision under federal privacy law, the shortfalls in the enumeration of people in military GQs, as well as the fluctuation in status (and resulting problems in the address list) in more fluid GQ types like group homes.
Indeed, in pondering root causes and opportunities for improvement, we find ourselves in alignment with a predecessor National Academies of Sciences, Engineering, and Medicine panel. Seventeen years ago, the Panel on Residence Rules in the Decennial Census looked back on the conduct of GQ enumeration in the 2000 Census and found the situation “unacceptably bad. Failure to reconcile the group quarters roster with the MAF contributed to a host of census errors. Group quarters frames were constructed without sufficient standardization and awareness of diversity in housing unit and group quarters stock,” and some GQ data (particularly those generated from long-form questionnaire information from a sample) were “marred by extremely high levels of nonresponse” (National Research Council, 2006:Finding 7.1). That panel argued that the prevailing notion that this relatively small but very important segment of the population can be enumerated using exactly the same methods and approaches is “fundamentally flawed;” the living situations falling under the broad GQ heading are too diverse for a single methodology to be viable.
Preparations for the 2030 Census could benefit from an approach that acknowledges the reality that the GQ enumeration is not a monolithic entity, but a number of very different, distinct censuses, each with unique requirements. Consequently, no single precensus program can be expected to capture all addresses needed to conduct a complete enumeration of the GQ population, just as no single approach and contact strategy is completely satisfactory.
In some instances, GQs are stable, longstanding facilities, as with large correctional facilities, nursing homes, college/university student housing, and military bases, for which addresses are likely stable over time, and thus changes can be easily documented. Still, these need to be treated differently because of the unique enumeration issues, involving mismatches with other parts of privacy law (e.g., FERPA for college/university student housing and the Health Insurance Portability and Accountability Act of 1996 for nursing homes) and quality of facility records data (e.g., military bases).
In other cases, addresses for GQ respondents may be fleeting at best, and can only be “discovered” just before or during the enumeration. Such is the
case with more transient GQ locations, such as small group homes, residential treatment facilities, and places where those without a usual residence receive services. For this class of GQs, agility—in the form of flexible listing and enumeration procedures—needs to be the order of the day. Therefore, while it is important to curate a list of GQs throughout the decade, with some equivalent of an ongoing GQAC program, it is unrealistic to expect that such an activity alone will provide adequate coverage of the entire GQ universe for 2030.
For the 2010 Census, the Census Bureau hosted a group of local officials who had Special Sworn Status and access to local data, which permitted the Census Bureau to fix problems before release of the apportionment counts by December 31. For 2020, that review process was almost nonexistent, given the necessary data-collection delays but unchanging data-delivery deadline. The prerelease quality check process should be resurrected for the 2030 Census, given the malleable nature of certain GQ types and the exigencies surrounding their accurate enumeration.
To its credit, the Census Bureau promoted the use of eResponse when circumstances permitted, a beneficial option given the COVID-19 pandemic. Almost half of all persons in GQs were enumerated using eResponse. Moreover, with the exception of college/university student housing, eResponse yielded relatively low item nonresponse rates, which was of great benefit to those GQ types that made substantial use of that pathway, such as adult correctional facilities and nursing homes. The beneficial attributes of eResponse make extension of this data-collection mode a logical choice for 2030 Census data collection, wherever practical. Thus, in the panel’s view, the Census Bureau should continue to explore ways to increase utilization of this pathway.
The high level of missing data for characteristics for persons in college/university student housing is likely tied to the reliance on administrative data for students, given their physical absence from student housing as a result of the COVID-19 pandemic. Differences in the level of directory information that was available, combined with the rules governing its release (i.e., FERPA), likely hampered the use of such data for enumeration purposes; and this was the case irrespective of data-collection mode. This begs for a combination of administrative, regulatory, and/or legislative solutions that clarify the use of these data for enumeration purposes.
Paper Listing data collection was subject to higher levels of item nonresponse, especially for persons in military GQs and those in college/university student housing. While FERPA is likely a reason for the latter, the remarkably high levels of missing data for the military, most of which were collected via Paper Listings, necessitates additional research to discover a way to effectively capture existing data that elude the current system. In general, more work is needed to determine why the checks built into the overall Paper Listing capture process failed to detect what are substantial deficiencies in reporting, especially
on Hispanic origin and to a lesser degree race, and in some instances, even sex and age.
Recommendation 9.1: The U.S. Census Bureau’s steps to make the Master Address File an ongoing, continuous inventory of all living quarters—including group quarters (GQs)—should continue, with an eye toward developing updated information for GQs on par with the regular updating of conventional housing units. This should include a separate inventory of GQ types that have longstanding address provenance and those that need to be tracked more closely because they are continually changing.
Recommendation 9.2: Group quarters (GQs) require more than updated address information; they require continually updated contact strategies as well. The U.S. Census Bureau should develop “selected advance contact” protocols with GQ facilities by type (and their parent companies, as appropriate), akin to follow-ups performed with businesses, and state, local, and tribal partners should be engaged in this update activity.
Recommendation 9.3: In light of the 2020 experience, the U.S. Census Bureau should convene group quarters (GQ) stakeholders in a discussion of more effective and useful options for electronic provision of data for GQ residents, and on the issues involved in obtaining access to administrative records for GQ facilities. The completeness of such records should also be assessed by GQ type.


