
as the Turing test, in which a human interacts with a computer behind a curtain. If the responses of the computer are so accurate that the human cannot tell it is a machine, the machine passes the Turing test. At present, software engineers lack the ability to program such a machine, even if it had a 30-petaflop speed. Some machines can do self-learning on a small scale, such as using natural language technology to categorize e-mails. In a bank, for example, a system might be able to route e-mail to the loan department, the mortgage department, or investments. When it makes mistakes it is self-learning in the sense that it will improve the algorithms. Many people are working on system management to deploy computer systems and make them more adaptable. So far these systems are not holistic in the sense of being able to do actual learning across the spectrum of all aspects of managing complex systems. Very serious investment is being applied in this area.
Dr. Wessner asked whether the pharmaceutical companies are working actively on deep computing to produce new products. Mr. Ganek replied affirmatively, noting that “there is a frenzy in this area, trying to understand how to take advantage of these technologies,” especially with the new genomic data becoming available. He pointed out that some of the most promising techniques have nothing to do with hardware but with finding better patterns of discovery algorithms that can reduce algorithmic complexity and speed up problem solving.
MICROPROCESSORS AND COMPUTERS: THE PHENOMENON OF PRICE DECLINES
Kenneth Flamm
University of Texas at Austin
Dr. Flamm prefaced his remarks by saying that he was an economist who has been looking at the field of microprocessors and computers for about 15 years. He has seen, until recently, a picture of relative continuity rather than dramatic shifts. He confessed, however, that he has now begun to lean toward Dr. Jorgenson’s view that there was a point of inflection around 1995.
Some Problems with Models and Weighting
He began with: Let me tell you what I thought I knew until recently. He said he had a good picture of the rate of price performance improvement in semiconductors and computers over time, through both his own studies and the literature on rates of price performance in computers and semiconductors. He suggested two difficulties. The first is that typically the numbers used in national income accounts are too low. For example, the computer price deflators in current use are those of the Bureau of Labor Statistics (BLS), not the Bureau of Economic Analysis (BEA). The BLS uses a methodology of hedonic adjustments
to matched models, which have at times underestimated the true rate of price performance improvement in computers.14
Dr. Flamm’s second point was that some people have done credible studies suggesting that if one tries to calculate the percentage of the improvement in computers that comes from semiconductors, the answer depends on the weight of semiconductors in the value of computers. The problem is that national income accounts for the United States do not have good information for this weighting. According to Dr. Flamm, if the semiconductor content in computers is 15 to 20 percent, then about half the technological improvement in computers has come from semiconductors. If the content is as high as 40 percent, then virtually all the improvement is coming from semiconductors. This, he reminded his audience, has to be amended by the fact that computer numbers are probably too low, so other factors beyond semiconductors must play a role. It is a “giant mess” if you look only at the traditional numbers.
Dramatic and Surprising Price Declines
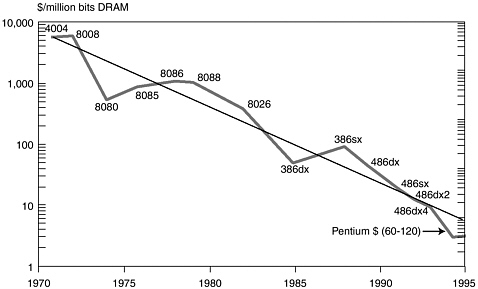
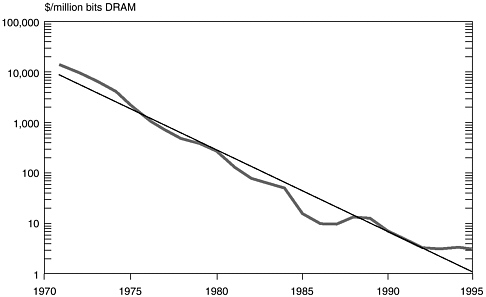
Dr. Flamm added a note from his personal experience in working on litigation questions. An interesting aspect of litigation work, he said, is the occasional access to proprietary data, which may be more detailed and more accurate than publicly available data. The public data show price performance improvements in personal computers in the range of 30 to 35 percent for the early 1990s. That is an uptick from a historical rate, which has been closer to 20 percent since the 1950s. Recently, however, unpublished hedonic studies of price performance indexes for personal computers have shown annual rates in the 40-45 percent range. He said he could not make public the proprietary data underlying these statements, but remarked that credible hedonic studies have shown these really dramatic and surprising price declines in personal computers after adjusting for other factors (Figures 10 and 11).
Where, he asked, is this large and surprising number coming from? He returned to Moore’s Law, and suggested there might be an economic corollary. This extension of Moore’s Law might argue that the industry is able to produce four times as many devices every three years per square centimeter of area. If one adds the assumption that wafer-processing costs remain roughly constant, the result is a minus 37 percent per year compound annual growth rate in the cost of the device.
Analysis of DRAM Price Performance
He went on to say that instead of being four times as many devices every three years, recent acceleration in the pace of semiconductor innovation may mean there are as many as four times as many devices every two years. The annual cost decline would then be 50 percent instead of 37 percent. He asked his audience to remember that number and then expressed some doubts about it. He said that the most manufacturing-intensive product he could think of is the DRAM, which is basically a commodity product, a regular feature reproduced over and over on a single chip. If there is any place where a pure manufacturing cost improvement will appear, he said, it is in DRAM prices. Has there been a shift in DRAMs from a 37 percent decline in costs to a 50 percent decline? He said that any such decline is hard to detect, especially in light of the difficulty of separating cyclical downturns in this highly cyclical industry from sector trends over time.
He then turned to a comparison of DRAM and microprocessor costs. The typical microprocessor diagram shows a simplistic measure of cost per MIPS per microprocessor cost and a typical DRAM diagram shows the change over time of cost per million bits of DRAM. For simple averages, the two diagrams gave trend rates for data from 1971 to 1995, showing about 29 percent per year per dollar per MIPS and about 38 percent per year per dollar for DRAM—almost exactly what this economic corollary to Moore’s Law would predict.
Sharp Declines in Microprocessor Prices Around 1995
He then offered a more sophisticated view of these trends, adjusting for quality, which showed a slowing rate of price performance improvement from the decade 1975–1985 to the decade 1985–1994.15 However, when this improvement is averaged over the period, trying to separate the secular trend from the cyclical ups and downs, both microprocessors and DRAMs are “pretty much right on the money” at about 32 percent. What about more recent changes, he asked? He said that he recently found a rich data set on Intel and AMD microprocessor prices, and he developed an estimated hedonic price index for microprocessors over the period on a monthly basis, from about January 1996 to relatively recently, and compared this with the Producer Price Index (PPI) (Figure 12). The PPI changed little until mid-1997, and the index is now roughly synchronized with the previous numbers. When he looked at the rates of change, however, for the four-year period, he found declines in quality-adjusted price performance of 60 to 68 percent. The PPI, while somewhat lower, was in the same range. He called this “an extraordinary noticeable increase in the rate of decline of microprocessor prices—substantially higher than any numbers I have seen for anything
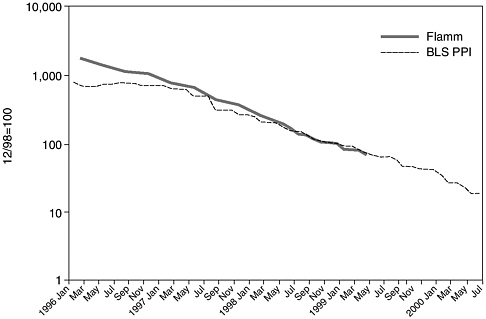
FIGURE 12 Microprocessor Price Indexes.
like DRAMs.” A re-examination of the most recent data for DRAMs revealed that they, too, declined at similar rates in the late 1990s.
Possible Causes of the Decline
In speculating about the causes, he looked at the rates of decline in personal computer prices and compared them to estimated rates of decline in microprocessors (controlling for innovations such as the location of level-two caches on the same module as processors, higher bus speeds, and higher clock rates) (Table 2). Following a period of deceleration in the rate of price performance in the 1980s, he saw what appeared to be an acceleration around 1995. He now agrees with Dr. Jorgenson on the grounds that although no single obvious causes are apparent, this collection of data points leads to the conclusion that there has been a marked acceleration in the rate of price performance improvement in the last five years, “unbelievable though it may seem.”
Dr. Flamm returned to semiconductors to ask about their impact on the U.S. economy. First, he pointed out that the raw numbers were pretty impressive. Semiconductors were now the largest manufacturing industry in the United States in terms of value added. Measured by value added (i.e., contribution to U.S. GDP), he said, semiconductors were number one in the list of Standard Industrial Classification codes. Second, he said, the percentage of U.S. GDP coming out of this
TABLE 2 Quality-Adjusted Microprocessor Prices Computer Annualized Rates of Decline
|
Period |
Flamm (percent) |
BLS PPI (percent) |
|
2/96 to 2/98 |
–62.3 |
–46.0 |
|
2/98 to 2/99 |
–69.0 |
–56.8 |
|
2/98 to 4/99 |
–67.9 |
–58.6 |
|
4/99 to 7/00 |
|
–66.8 |
one four-digit industry was approaching 1 percent and much of this increase has been recent. The latter data points have an element of estimation and were “just a calculation of semiconductor nominal value added as a percentage of GDP,” but he suggested it could be added “as another data point in our ‘something happened in the 1990s’ story.”
The Large Impact of Information Technology on GDP
Dr. Flamm’s last point was that there has been a major change in the relationship between the semiconductor and computer industries. It is obvious to people who follow the industry that more of what used to be done in the computer industry is now being done in the semiconductor industry. Historically, the computer industry has been the major customer for the semiconductor industry. Among several little noticed changes, however, is the emergence of the communications industry as a much larger consumer of semiconductors. He said there is little data to describe this relationship.
In addition, he noted a rise in the R&D intensity of semiconductors and a fall in the R&D intensity of computers. “That is not rocket science,” the major retailers, such as Dell and Compaq, are doing little R&D on personal computers (he noted IBM as an exception). To a large extent, Intel and its competitors are doing the R&D for the personal computer industry. If one totals the value added in computers and semiconductors and asks how that total is distributed between the two industries, again there is obviously a sharp uptick in the early to mid-1990s.
“How do we evaluate the impact of this change on the economy?” he asked. The usual custom for economists is to calculate how much producers gain and how much consumers gain and derive a total number.16 The mathematics shows, he said, that one year’s technological improvement at the old historical rate
amounted to about 0.16 percent of GDP and that one year’s improvement is realized for the rest of calendar time. That is, it lowers costs forever, so that next year’s improvement is added to it. If this were compounded for 20 years, the technological improvement would amount to about 5 percent of GDP; if it were compounded over 30 years (which would require a lot of brave assumptions), the improvement would equal about 20 percent of GDP—an enormous figure.
An Important Message from the Railroads
Dr. Flamm then compared the economic role of the semiconductor with that of the nineteenth-century railroads, which have been studied extensively by economic historians as examples of technological change. Those studies show that there were two waves of railroad building in the United States: one from 1830-1860 and a second from 1860-1890. At the end of the first period the total benefit to consumers in lowered transportation costs was about 4 percent of GDP. At the end of the second period, after 60 years of railroad building, the benefit to consumers exceeded 10 percent of GDP (GNP then).
In contrasting the benefit of railroads with that of semiconductors it is important to recognize the role of the government, which has a very price-inelastic demand for semiconductors. Depending on how government purchases are treated, the estimated benefit to consumers from semiconductor improvement is somewhere between two and four times the benefit from railroads.
He concluded by saying that something very significant for the economy has happened, and that another insight from the case of the railroads may also apply to the case of information technology. That is, economic historians have looked at railroads not only in the United States but also in other countries, and they have concluded that the impact of railroad building in Brazil or Mexico or Serbia as a percentage of GNP was considerably higher than in the United States. The reason is that before the railroads were built in other countries there was virtually no competing transportation infrastructure. In the United States railroads had to compete with a well-developed system of canals and macadam roads and turnpikes. Therefore, in Mexico or Brazil the benefit over 60 years might have been 20 to 40 percent instead of 10 percent of GDP.
The present digital economy is an obvious analog to the transportation economy of the nineteenth century. Those countries with well-developed infrastructures of information technology and computing experienced a large benefit from the recent decline in technology costs. Countries lacking a basic information technology infrastructure are likely to gain even larger relative benefits from cost declines in information technologies. If the analogy with railroads is sound, he concluded, other countries may look forward to very large benefits in the near future, especially in the developing world.


