
E
Inputs of Petroleum Hydrocarbons into the Oceans Due to Transportation Activities
Petroleum hydrocarbon inputs into the oceans from transportation activities are developed herein. Significant sources include operational discharges from ships, oil spills from tankers and non-tank vessels, operational discharges from recreational craft, and discharges from aircraft. Inputs due to atmospheric deposition of volatile organic compounds (VOC) vented from tankers are covered in Appendix H.
INPUTS TO THE SEA FROM MARITIME TRANSPORTATION
Operational Discharges in International Waters
Oil inputs into the sea from marine sources are naturally correlated to the number and types of vessels in operation in the marine environment. The number of tankers is significant because tankers are permitted discharges related to both cargo and propulsion machinery. The number of other ships is significant because they are permitted machinery related discharges. Table E-1 shows the comparison of the world’s seagoing merchant fleet of ships not less than 100 GT for 1971, 1980, 1989, and 1999 (IMO, 1990 and Lloyd’s Register, 1999).
The International Convention for Prevention of Pollution from Ships (MARPOL 73/78) regulates the design, construction, and operation of commercial vessels 100 gross tons (GT) and over worldwide with the goal of reducing or eliminating the discharge of oil and other pollutants into the sea. Many aspects of MARPOL (73/78) are of particular relevance during the calculations of estimates of input of petroleum hydrocarbon to the sea associated with marine transportation, including:
-
All commercial vessels between 100 and 400 gross tons are required to retain all oily waste on board, unless discharged at sea through special discharge control equipment as described below.
-
Tankers above 150 gross tons and all other commercial vessels over 400 gross tons are required to have installed oil/water separators (OWS) and oil discharge monitoring systems (ODMS), which continuously record the oil content of all overboard discharges from the bilges and, in the case of tankers, from any cargo slop tanks. For vessels above 10,000 gross tons, if oil content in the discharge stream is 15 parts per million (ppm) or greater, an alarm is supposed to sound and the discharge is terminated.
-
No tanker is permitted to discharge cargo oil effluent, even when using an ODMS, unless the vessel is underway between ports and more than 50 nautical miles from the nearest land. Therefore, for the purposes of this report all operational discharges of cargo oil are
TABLE E-1 Summary of the World’s Merchant Fleet
-
presumed to occur outside the waters of the United States or any other nation.
-
MARPOL has been adopted by nations with authority over 95 percent of the world’s merchant vessels. In the United States, MARPOL has been adopted through the Act to Prevent Pollution from Ships (33 U.S. Code 1901 et seq.)
-
Discharges of bilge water and certain cargo tank washings from tankers are the only permitted discharges under MARPOL.
-
Discharge of fuel oil sludge is prohibited.
-
In order to assist vessels in complying with these prohibitions against discharge of excess quantities of oil and oil sludge into the water, waterfront facilities (where commercial vessels are received) are required to establish and maintain oil waste reception facilities. These oil waste reception facilities are suppose to have sufficient capacity to receive and process all oily wastes generated by all vessels calling at the facility.
Failure to have reception facility capability is supposed to result in vessels being denied entry to the facility. For example, International Maritime Organization’s (IMO) 1998 list of waste reception facilities includes 1047 such facilities in various ports in the United States.
Operational Discharges from Cargo Tanks of Oil Tankers
Regulatory Background
During normal operations, certain tankers may discharge into the sea an amount of oil contained in the ballast and tank washings.
Under regulation 13 of MARPOL 73/78, tankers of 20,000 tonnes deadweight and above are required to have segregated ballast tanks (SBT), dedicated clean tanks (CBT), and/or crude oil washing systems (COW), depending on the vessel type, when they were built and their size. Regulation 13F adopted in 1992 restricts routing of ballast piping through cargo tanks and vice versa. These measures are designed to reduce operational and accidental pollution from tankers due to ballasting and tank washing.
Generally, crude oil carriers of 20,000 deadweight and above and product tankers of 30,000 tonnes deadweight and above delivered since 1983 must have SBT. Segregated ballast tanks are ballast tanks that are completely separated from the cargo oil and fuel oil systems, and which are permanently allocated to the carriage of water ballast. SBT greatly reduces the likelihood of oily ballast discharge, as there are sufficient segregated ballast tanks for normal operation in ballast. For these vessels, ballast may be allocated to cargo tanks only when needed to insure the safety of the vessel in particularly severe weather.
Unlike SBT, the piping systems for clean ballast tanks (CBT) may be common or connected with the cargo oil pump and piping systems. There are only a few CBT tankers operating today.
Crude oil washing is a system of cleaning cargo tanks using the dissolving action of crude oil to reduce clingage and sludge. Crude oil washing eliminates or reduces water washing, and thereby reduces operational oil pollution.
Regulation 9 of MARPOL limits the amount of oil that may be discharged into the sea to 1/15,000 of the total cargo oil volume for tankers built prior to the implementation of MARPOL73 (commonly referred to as Pre-MARPOL tankers), and 1/30,000 of the total cargo oil volume for MARPOL tankers. The requirement that the oil content of discharged effluent cannot exceed 15 ppm has the practical effect of limiting operational discharge to amounts much less than these maximum values.
Table E-2 gives the number and average deadweight for tankers in year 1999, and Table E-3 presents the age profile. More than two-thirds of the current fleet has SBT or double hull (DH) arrangements. MARPOL Regulation 13G requires mandatory retirement for single hull tankers at 30 years of age. A revision to regulation 13G currently under review will phase out all Pre-MARPOL tankers by 1 January 2007, at which time all MARPOL compliant tankers will have either SBT or DH arrangements.
SBT and Double Hull Crude Oil Carriers
According to industry sources (INTERTANKO, unpublished), SBT and double hull crude oil carriers will water wash 3-4 cargo tanks twice a year for inspection purposes. INTERTANKO estimates an average of 6,000 m3 of wash water per tanker per year is discharged. Assuming an oil content of 15 ppm of oil, operational oil discharge is approximately 90 liters (0.08 tonnes) per year per tanker. Assuming 2/3 of the 1,782 crude oil carriers have SBT or DH arrangements, the total estimated discharge per year is as follows:
SBT and DH Crude Oil Carriers: 1,782•(2/3)•0.08 = 95 tonnes
For non-compliance vessels, where the ODMS is not working properly or intentionally bypassed, the estimated average discharge is 38 tonnes per year per tanker.
TABLE E-2 Summary of Number and Deadweight of Tankers for Year 1999 (Lloyd’s Register, 1999)
|
|
No. of Tankers |
Deadweight (millions of tonnes) |
Average Deadweight (tonnes) |
|
Crude Oil Tanker |
1,782 |
238.5 |
133,838 |
|
Product Tanker |
5,269 |
43.5 |
8,256 |
|
Bulk dry/Oil Tanker |
219 |
16.7 |
76,256 |
|
|
7,270 |
298.7 |
41,087 |
TABLE E-3 Age Profile of Tankers as a Function of Tonnes Deadweight (World Fleet Statistics, 1999)
|
|
Crude Oil Carriers |
Product Tankers |
Dry Bulk / Oil Carriers |
Total All Tankers |
|
0−4 Years |
22 percent |
13 percent |
7 percent |
20 percent |
|
5−9 Years |
25 percent |
11 percent |
19 percent |
22 percent |
|
10−14 Years |
11 percent |
10 percent |
21 percent |
11 percent |
|
15−19 Years |
8 percent |
21 percent |
25 percent |
11 percent |
|
20−24 Years |
28 percent |
25 percent |
24 percent |
27 percent |
|
25+ Years |
6 percent |
20 percent |
14 percent |
9 percent |
|
Total |
100 percent |
100 percent |
100 percent |
100 percent |
Pre-MARPOL Crude Oil Carriers
As discussed previously, these tankers carry ballast in their cargo tanks. Based on the Lloyd’s Register (1999) statistics, the average deadweight of crude oil carriers is 133,844 tonnes. Assuming 30 percent of the deadweight is discharged as arrival ballast with an oil content of 15 ppm, the average quantity of water ballast per voyage is 40,153 tonnes and the average oil discharge is 588 liters or 0.528 tonnes. An industry survey undertaken by INTERTANKO indicates that 70 percent of all tankers carry a full load of cargo and 30 percent are partially loaded to an average of 60 percent of capacity. Consumables equaling about 5 percent of deadweight are also carried. Therefore, it is assumed that on the typical voyage a tanker carries cargo oil equal to approximately 80 percent of its deadweight. The average cargo oil moved on a crude oil carrier is 80 percent of 133,844 tonnes or about 107,075 tonnes, and the outflow factor, expressed as a fraction of the cargo oil moved, equals 0.0528 / 107,075 = 1 / 202,797. A rounded value of 1/200,000 is assumed for these calculations. This is a conservative estimate, as it assumes ballast is discharged at the maximum permissible oil content of 15 ppm, and also neglects the fact that many Pre-MARPOL tankers carry a portion of their ballast in segregated ballast tanks.
As reported by Concordia Maritime AB, an operator of a large fleet of Pre-MARPOL VLCCs (Very Large Crude Carriers), the average oil discharge from their Pre-MARPOL VLCCs is 300 liters per voyage. The average cargo volume for their VLCCs is approximately 300,000 m3. Thus, the outflow factor attained by the Concordia fleet is (300/1,000) / 300,000 = 1 / 1,000,000. This is significantly better than the assumed factor of 1 / 200,000, but the performance level achieved by Concordia Maritime is believed to exceed standard practice.
For a crude oil washing system to be MARPOL certified, the oil found floating on top of the departure ballast after crude oil washing cannot exceed 0.00085 times the volume of the tanks containing ballast. On this basis, the oil content in the ballast tanks for this average size tanker is 33.3 tonnes. Assuming non-compliance where the ODMS is not working properly or intentionally bypassed, the oil outflow factor becomes 33.3 / 107,075 = 1 / 3,216. A rounded value of 1/ 3,000 is assumed for these calculations.
As summarized in Table E-4, the total outflow from non-SBT crude oil carriers is calculated as follows:
The crude oil carriers are divided into the following size ranges:
Less than 20,000 DWT
20,000 to 125,000 DWT (includes Panamax and Aframax tankers)
125,000 to 175,000 DWT (includes Suezmax tankers) Greater than 175,000 DWT (includes VLCCs and ULCCs)
Within each size range, the number of crude oil carriers and the average deadweight are derived from 1999 statistics (Lloyd’s Register, 1999). The number of voyages per annum for each size is estimated from industry sources (INTERTANKO, unpublished).
One-third of the crude oil carriers are assumed to regularly carry ballast in cargo oil tanks. Multiplying the number of tankers in each size range by 1/3 provides the estimated number of non-SBT tankers in 1999. Multiplying the average deadweight for each size by 80 percent provides the average quantity of cargo oil carried per voyage. The product of the number of non-SBT tankers, the quantity of cargo oil carried per voyage, and the number of voyages per annum provides the total cargo oil movement for each size range. Summing these figures gives the estimated cargo oil movements on non-SBT tankers of 1,000.8 million tonnes per year. Assuming an outflow factor of 1/200,000 as described above, the projected operational discharge in tonnes per year is as follows.
Non-SBT Crude Oil Carriers: 1,000,800,000/ 200,000 = 5,004 tonnes
Product Tankers
For 1999, the Lloyd’s Register data show a total of 5,269 product tankers with an average deadweight of 8,256 tonnes. Their average cargo cubic is approximately 10,000 m3. Assuming the volume of the slop tanks equals 3 percent of the
TABLE E-4 Calculation of Operational Cargo Oil Discharge from pre-MARPOL (non-SBT) Crude Oil Carriers— Worldwide
|
|
less than 20,000 DWT |
20,000 to 125,000 DWT |
125,000 to 175,000 DWT |
greater than 175,000 DWT |
all non-SBT Crude Tkrs |
|
Total No. of Crude Oil Carriers |
154 |
923 |
256 |
449 |
1,782 |
|
Assumed percent non-SBT |
33.3 percent |
33.3 percent |
33.3 percent |
33.3 percent |
33.3 percent |
|
No. of non-SBT Crude Oil Carriers |
51 |
308 |
85 |
150 |
594 |
|
Average Deadweight (tonnes) |
5,811 |
76,561 |
144,857 |
289,235 |
133,844 |
|
Cargo Oil as percent of Deadweight |
80 percent |
80 percent |
80 percent |
80 percent |
— |
|
Cargo Oil per Voyage (tonnes) |
4,649 |
61,249 |
115,885 |
231,388 |
72,732 |
|
Voyages (per year) |
40 |
30 |
15 |
8 |
23.2 |
|
Total Cargo Oil Moved (millions tonnes) |
9.5 |
565.9 |
147.8 |
277.7 |
1,000.8 |
|
Discharge as percent of Cargo Oil Moved |
1/200,000 |
1/200,000 |
1/200,000 |
1/200,000 |
1/200,000 |
|
Estimated Discharge (tonnes/year) |
47 |
2,830 |
739 |
1,388 |
5,004 |
oil carrying capacity of the ship, the average slop tank capacity is 300 m3. Assuming the slop tanks when charged with water have sufficient water for tank washing without introduction of additional water into the system, and that the full contents of the slop tanks are discharged at 15 ppm oil content, the projected operational oil discharge per voyage is about 4.5 liters. This corresponds to an outflow factor less than 1/2,000,000. Applying this factor for product tankers with SBT is a conservative assumption, as tank cleaning is not required in all circumstances, and cleaning is often carried out alongside a refinery where the slops can be transported ashore.
In the case of non-SBT product tankers where ballast is carried in cargo tanks, the outflow factor of 1/200,000 as applied for non-SBT crude oil carriers is appropriate. Annual discharges for non-SBT product tankers are developed similar to the crude carriers, and are summarized in Table E-5. The projected operational discharge in tonnes per year is as follows.
Non-SBT Product Tankers: 382,700,000 / 200,000 = 1,914 tonnes
Assuming 0.02 percent of the cargo oil remains onboard after offloading cargo, the average amount of oil remaining
TABLE E-5 Calculation of Operational Cargo Oil Discharge from pre-MARPOL (non-SBT) Product Tankers—Worldwide
|
|
less than 20,000 DWT |
20,000 to 125,000 DWT |
all non-SBT Product Tkrs |
|
Total No. of Product Tankers |
4,545 |
724 |
5,269 |
|
Assumed percent non-SBT |
33.3 percent |
33.3 percent |
33.3 percent |
|
No. of non-SBT Product Tankers |
1515 |
241 |
1756 |
|
Average Deadweight (tonnes) |
2,894 |
41,911 |
8,255 |
|
Cargo Oil as percent of Deadweight |
80 percent |
80 percent |
— |
|
Cargo Oil per Voyage (tonnes) |
2,315 |
33,529 |
5,643 |
|
Voyages (per annum) |
40 |
30 |
38.6 |
|
Total Cargo Oil Moved (millions tonnes) |
140.3 |
242.4 |
382.7 |
|
Discharge as percent of Cargo Oil Moved |
1/200,000 |
1/200,000 |
1/200,000 |
|
Estimated Discharge (tonnes/year) |
702 |
1,212 |
1,914 |
onboard the product tankers is 2 m3 or about 1.8 tonnes. For non-compliance where the ODMS is not working properly or intentionally bypassed, the oil outflow factor becomes 2 / 10,000 = 1 / 5,000.
This 1 / 5,000 factor is applied for both SBT and non-SBT product tankers. This is a conservative estimate, as it assumes that all oil remaining onboard the non-compliant tankers is discharged at sea. The oil discharge monitoring systems (ODMS) on clean product tankers have a higher degree of reliability as compared to vessels carrying persistent oils, and the discharge due to equipment failure should be less.
Summary of Operational Discharges of Cargo Oil from Tankers
Table E-6 summarizes total operational discharges assuming all tankers operate in compliance with MARPOL73/ 78. The estimated discharge per year is 7,396 tonnes.
In the 1990 study on inputs of petroleum into the marine environment (IMO 1990), the following estimates were made with regard to tankers complying with MARPOL maximum discharge quantities:
|
Greater than 150,000 DWT |
99 percent compliance |
|
75,000 to 150,000 DWT |
95 percent compliance |
|
40,000 to 75,000 DWT |
85 percent compliance |
|
20,000 to 40,000 DWT |
85 percent compliance |
|
Less than 20,000 DWT |
80 percent compliance |
The rationale for this degree of non-compliance is that 1) not all tankers fly the flag of a state that is party to MARPOL 73/78, 2) not all tankers that fly the flag of a state party to MARPOL 73/78 operate in compliance with the discharge criteria; 3) there will be equipment failures onboard ships, and, 4) there are not adequate reception facilities worldwide. The higher degree of compliance allocated to the larger tankers was justified on the basis that the large majority of the larger tankers fly the flag of a state party to MARPOL 73/78, and the majority of larger tankers are on longer voyages which facilitates compliance with MARPOL 73/78.
Since 1990, tanker operations have come under much closer scrutiny. Port state oversight has increased, and regulations such as the International Ship Management Code (ISM) and the Standards for Training and Certification of Watchkeepers (STCW) have encouraged more diligent operations. In view of the above, the assumed compliance rates have been increased to the following values.
|
Greater than 125,000 DWT |
99 percent compliance |
|
20,000 to 125,000 DWT |
95 percent compliance |
|
Less than 20,000 DWT |
90 percent compliance |
Table E-7 summarizes total operational discharges assuming these levels of compliance with MARPOL73/78. The estimated discharge per year is 36,437 tonnes (10,712,461 gallons). These discharges are applicable to international waters. Discharge of oily water within 50 nautical miles from shore is prohibited. Intentional discharges within U.S. and Canadian waters are believed to be small due to rigorous enforcement programs.
Bilge Oil and Fuel Oil Inputs
Machinery Space Bilge Discharges from Tankers
The large majority of commercial vessels above 100 GT in size are motor ships. The 1990 International Maritime Organization report estimated the average production of bilge oil at 12 gallons per day for a 20,000 HP plant. Advancements in the design and manufacture of engines and pumps, fitting of coamings around pumps and other sources of oil on new vessels, locating of the purifiers into separate spaces, and other design improvements have brought about a
TABLE E-6 Calculation of Operational Cargo Oil Discharge from Tankers Assuming Full Compliance with MARPOL 73/78
|
|
Crude Oil Carriers DH or SBT |
Crude Oil Carriers without SBT |
Product Tankers DH or SBT |
Product Tankers without SBT |
|
No. of Tankers |
1,188 |
594 |
3,513 |
1,756 |
|
Discharge per Tanker (tonnes per year) |
0.08 |
— |
— |
— |
|
Oil Movements (millions of tonnes/year) |
— |
1,000.8 |
765.5 |
382.7 |
|
Outflow Factor |
— |
1/200,000 |
1/2,000,000 |
1/200,000 |
|
Operational Discharge (tonnes/year) |
95 |
5,004 |
383 |
1,914 |
|
Total Discharge (tonnes/year) |
7,396 |
|
|
|
TABLE E-7 Calculation of Operational Cargo Oil Discharge from Tankers Assuming Partial Non-Compliance with MARPOL 73/78—Worldwide
|
|
Crude Oil Carriers DH or SBT |
Crude Oil Carriers without SBT |
Product Tankers DH or SBT |
Product Tankers without SBT |
|
MARPOL Compliant |
||||
|
No. of Tankers |
1,140 |
570 |
3,187 |
1,593 |
|
Discharge per Tanker (tonnes per year) |
0.08 |
— |
— |
—- |
|
Oil Movements (millions tonnes/year) |
— |
965.1 |
713.3 |
356.7 |
|
Outflow Factor |
— |
1/200,000 |
1/2,000,000 |
1/200,000 |
|
Operational Discharge (tonnes/year) |
91 |
4,825 |
357 |
1,783 |
|
Total discharge from compliant tkrs |
7,056 |
|
|
|
|
Non-compliant |
||||
|
No. of Tankers |
48 |
24 |
326 |
163 |
|
Discharge per Tanker (tonnes per year) |
38 |
— |
— |
—- |
|
Oil Movements (millions of tonnes/year) |
— |
35.8 |
52.1 |
26.1 |
|
Outflow Factor |
— |
1/3,000 |
1/5,000 |
1/5,000 |
|
Operational Discharge (tonnes/year) |
1824 |
11,923 |
10,422 |
5,211 |
|
Total discharge from non-compliant tankers |
29,381 |
|
|
|
|
Total Discharge (tonnes/year) |
36,437 |
|
|
|
|
Total Discharge (gallons/year) |
10,257,685 |
|
|
|
reduction in bilge oil generation for modern ships. For these calculations, a rate of 5 gallons per day for a 20,000 HP plant, or 0.25 gallons per 1,000 HP per day is assumed.
An estimation of bilge oil generation for tankers is provided in Table E-8. The number of tankers is taken from the Lloyd’s Register data for 1999, and the horsepower is estimated based on the distribution of tanker sizes. Assuming 0.25 gallons of bilge oil is generated per 1,000 HP per day, and that the tankers operate 350 days per year, it is estimated that a total of 19,119 tonnes (5.3 million gallons) of bilge oil is generated per year.
On crude oil tankers, oily bilge water is routinely transferred to the cargo slops system, which includes an oily water separator system where most of the oil is settled out and returned for use on the tanker. Periodically the water collected through this system must be discharged overboard through an oil discharge monitoring system set to alarm and shut down at 15 ppm. Product tankers are not able to recycle as much oil but, in any case, oil content of all overboard discharge is restricted to 15 ppm.
Assuming a 15 ppm oil content for bilge discharges, it is estimated that less than 0.2 percent of bilge oil is discharged overboard. Table E-9 summarizes the expected bilge oil discharge for tankers. The rate of MARPOL compliance is assumed as described in the previous section on operation discharges, and non-compliant vessels are assumed to discharge all of their bilge oil overboard. The discharge from MARPOL compliant tankers is very small—a total of only 34 tonnes per year. Total discharge from both compliant and non-compliant tankers is estimated at 1,129 tonnes (313,621 gallons) per year.
This is considered to provide a conservative estimate of legally permitted discharges. Steam tankers generate less oil to the bilges. Because steam tankers make up less than 5 percent of the world fleet, the above calculations assumed that all tankers are motorships.
Machinery Space Bilge Discharges from Non-Tankers
According to Lloyd’s Register data there were 79,547 non-tankers above 100 GT in size operating commercially around the world in 1999. These consisted of 38,732 commercial vessels with an average main propulsion power of about 7,500 HP, and 40,815 other vessels with an average power of about 500 HP.
Bilge oil discharges for non-tankers are summarized in Table E-10. A bilge oil generation rate of 0.25 gallons/1000 HP per day was applied. Vessels between 100 GT and 400 GT, which comprise some 54 percent of the non-tanker fleet, are not required to have oily water discharge equipment installed. Although these vessels are not permitted to discharge bilge effluent, it is believed that there is a significant level of non-compliance. To account for this, 15 percent of the commercial vessels and 30 percent of the other vessels were assumed to not comply with MARPOL regulations.
Total bilge oil discharge from both compliant and non-compliant vessels other than tankers is estimated at 15,607 tonnes (4.0 million gallons) per year.
Fuel Oil Sludge from All Vessels
Based on 1998 data collected by INTERTANKO (unpublished), the world annual use of fuel oil from marine application is estimated to be 130 million tonnes of heavy residual fuel oil and 40 million tonnes of distillate fuel. Based on
TABLE E-8 Generation of Bilge Oil for Tankers—Worldwide
|
|
Crude Oil Carriers |
Product Tankers |
Dry Bulk/ Oil Carriers |
|
No. of Tankers |
1,782 |
5,269 |
219 |
|
Average Size of Propulsion Machinery (HP) |
21,000 |
3,700 |
15,000 |
|
Assumed Bilge Oil Generation (gal/1000 HP/day) |
0.250 |
0.250 |
0.250 |
|
Average Bilge Oil Generation (gal/day/ship) |
5.3 |
0.9 |
3.8 |
|
Assumed Time in Service (Days/Year) |
350 |
350 |
350 |
|
Bilge Oil Generation (gallons/year) |
3,274,425 |
1,705,839 |
287,438 |
|
Bilge Oil Generation (tonnes/year) |
12,038 |
6,059 |
1,021 |
|
Total Tankers Bilge Oil Generation (tonnes/year) |
19,119 |
|
|
|
Total Tankers Bilge Oil Generation (gallons/year) |
5,267,701 |
|
|
databases on marine bunker supply maintained by the Energy Information Administration (EIA) and the International Energy Agency (IEA), IMO estimated consumption during 1996 as 100 million tonnes of heavy residual fuel oil and 38 million tonnes of distillate fuel (IMO 2000). An unpublished study by INTERTANKO, which assessed consumption based on the world fleet makeup in year 2000 and the estimated consumption per vessel, estimated overall consumption at 224 million tonnes. For this report, the 1998 estimate of 170 million tonnes per year of fuel oil consumption is applied when calculating sludge generation.
Heavy fuel oils contain between 1 percent and 5 percent sludge or waste oil, which cannot be burned as fuel and therefore must be disposed of by other means. A value of 1.5 percent is applied for these calculations.
MARPOL prohibits the discharge of any of this sludge to the sea. Diesel fuel oil does not produce any appreciable quantity of sludge and therefore is discounted from further consideration here. The total production of sludge from ships is estimated as 130 million • 0.015 = 1.95 million tonnes (499 million gallons) of sludge per year.
As noted above, MARPOL requires that all sludge must either be retained on board for discharge to a reception facility ashore or for other legal treatment on board the vessel. On-board treatment includes mixing and homogenizing sludge with the fuel oil, use of on-board incinerators, and on crude oil tankers, transferring the sludge to the cargo or slop tanks.
Not all vessels are equipped with incinerators or slop tanks or have the capability to otherwise treat all produced sludge on board. Waste reception facilities exist throughout the world. There are over 1,000 such facilities in the United States alone. It is widely acknowledged that such facilities are not used to the fullest extent due to a variety of reasons
TABLE E-9 Bilge Oil Discharge from Tankers Greater Than 100 GT—Worldwide
|
|
Crude Oil Carriers |
Product Tankers |
Dry Bulk/ Oil Carriers |
|
MARPOL Compliant |
|||
|
No. of Tankers |
1,782 |
5,269 |
219 |
|
Total Bilge Oil Generation (tonnes/year) |
12,038 |
6,059 |
1,021 |
|
Percent of Tankers Assumed MARPOL Compliant |
96 percent |
91 percent |
93 percent |
|
Discharge as a percent of Bilge Oil Generated |
0.2 percent |
0.2 percent |
0.2 percent |
|
Bilge Oil Discharge (tonnes/year) |
23.2 |
11.0 |
1.9 |
|
Total discharge from compliant tankers (tonnes/year) |
36 |
|
|
|
Non-compliant |
|||
|
Percent of Tankers Assumed Non-MARPOL Compliant |
4 percent |
9 percent |
7 percent |
|
Discharge as a percent of Bilge Oil Generated |
100 percent |
100 percent |
100 percent |
|
Bilge Oil Discharge (tonnes/year) |
457.5 |
563.5 |
71.5 |
|
Total discharge from non-compliant tankers (tonnes/year) |
1,092 |
|
|
|
Total Discharge (tonnes/year) |
1,129 |
|
|
|
Total Discharge (gallons/year) |
313,121 |
|
|
TABLE E-10 Bilge Oil Discharge from Non-Tankers Greater Than 100 GT—Worldwide
|
|
Commercial Vessels |
Other Vessels |
|
Bilge Oil Generation |
||
|
No. of Ships |
38,732 |
40,815 |
|
Average Size of Propulsion Machinery (HP) |
7,500 |
500 |
|
Assumed Bilge Oil Generation (gal/1000 HP/day) |
0.250 |
0.250 |
|
Average Bilge Oil Generation (gal/day/ship) |
1.9 |
0.1 |
|
Assumed Time in Service (Days/Year) |
350 |
100 |
|
Bilge Oil Generation (gallons/year) |
25,417,875 |
510,188 |
|
Bilge Oil Generation (tonnes/year) |
99,289 |
1,809 |
|
Marpol Compliant |
||
|
Percent of Vessels Assumed MARPOL Compliant |
85 percent |
70 percent |
|
Discharge as a percent of Bilge Oil Generated |
0.2 percent |
0.2 percent |
|
Bilge Oil Discharge (tonnes/year) |
168.8 |
2.5 |
|
Total discharge from compliant ships (tonnes/year) |
171 |
|
|
Non-compliant |
||
|
Percent of Tankers Assumed Non-MARPOL Compliant |
15 percent |
30 percent |
|
Discharge as a percent of Bilge Oil Generated |
100 percent |
100 percent |
|
Bilge Oil Discharge (tonnes/year) |
14,893 |
543 |
|
Total discharge from non-compliant tankers (tonnes/year) |
15,436 |
|
|
Total Discharge (tonnes/year) |
15,607 |
|
|
Total Discharge (gallons/year) |
4,009,662 |
|
including cost and timeliness. Therefore, it is generally assumed that some quantity of oily sludge is discharged to the sea in contravention of MARPOL. The previous study (IMO, 1990) estimated that quantity to be 10 percent for tankers and 25 percent for non-tankers. Recognizing improvements in vessel operations and enforcement regimes since then, for these calculations non-compliance is taken as 5 percent for tankers and 15 percent for non-tankers.
As shown in Table E-11, total sludge discharge to the sea from both compliant and non-compliant vessels is estimated at 255,700 tonnes (65 million gallons) per year.
Oily Ballast from Fuel Tanks
Discharges of oily ballast from fuel tanks are considered to be negligible. Placing seawater in fuel tanks as ballast water introduces contaminants into those tanks, increasing engine maintenance and the risk of malfunction. Thus, the practice is avoided whenever possible.
Summary of Bilge Oil and Fuel Oil Inputs
Bilge oil and fuel oil inputs are summarized in Table E-12. The total amount of oil entering the sea from these
TABLE E-11 Fuel Oil Sludge Discharge—Worldwide
|
|
Tankers |
Non-Tankers |
|
No. of Ships |
7,270 |
79,547 |
|
Average Size of Propulsion Machinery (HP) |
8,281 |
3,908 |
|
Fuel Oil Consumption—Residual Fuel (million tonnes) |
24.5 |
105.5 |
|
Fuel Oil Consumption—Distillate Fuel (million tonnes) |
0.0 |
40.0 |
|
Sludge Content of Residual Fuel |
1.5 percent |
1.5 percent |
|
Sludge Content of Distillate Fuel |
0.0 percent |
0.0 percent |
|
Sludge Generation (tonnes/year) |
368,004 |
1,581,996 |
|
Percent of Ships Assumed Non-MARPOL Compliant |
5 percent |
15 percent |
|
Sludge Discharge (tonnes/year) |
18,400 |
237,299 |
|
Total Sludge Discharge (tonnes/year) |
255,700 |
|
|
Total Sludge Discharge (gallons/year) |
65,459,110 |
|
TABLE E-12 Total Amount of Oil Entering the Sea from Bilge and Fuel (1989 Figures from IMO, 1990)— Worldwide
|
|
IMO 1989 (tonnes) |
Year 1999 (tonnes) |
Best Estimate (gallons) |
|
Machinery Space Bilges |
64,400 |
16,736 |
4,322,783 |
|
Fuel Oil Sludge |
186,800 |
255,700 |
65,459,110 |
|
Oily Ballast From Fuel Tanks |
1,400 |
0 |
0 |
|
Total |
252,600 |
272,435 |
69,781,893 |
sources is estimated as 272,435 tonnes (70 million gallons). The discharge of sludge accounts for about 94 percent of the total bilge oil and fuel oil input.
Fuel Oil and Bilge Oil Inputs in North American Waters
Bilge oil discharges into U.S. marine waters for vessels greater than 100 GT in size are summarized in Table E-13. Intentional discharges of cargo oil washings and sludge within U.S. and Canadian waters are believed to be small due to rigorous regulatory enforcement programs, and are assumed to be included in the spill data.
Transit miles for tankers and cargo ships operating in U.S. waters are obtained from ACOE transit data (U.S. Army Corps of Engineers Navigation Data Center, 1997b). The number and average horsepower of commercial vessels other than tankers and cargo ships is obtained from the U.S. Coast Guard Marine Safety Management System (MSMS) database. These data are used to estimate operating days in U.S. coastal waters for these other vessels. Recreational vessels and government vessels were not considered in this estimate.
The quantity of bilge oil generated is calculated assuming 0.25 gallons of bilge oil is produced per 1,000 HP per day. For MARPOL compliant vessel, it is estimated that less than 0.2 percent of bilge oil is discharged overboard. For non-compliant vessels, 100% discharge of bilge oil is assumed.
Recognizing the strong port state control measures in effect in both the U.S. and Canada, for these calculations 98% compliance with MARPOL regulations is assumed for vessels greater than 400 GT. For smaller vessels, which are not required to have oil/water separators and therefore must transfer contaminated bilge water ashore, 90% compliance is assumed. Assuming these levels of compliance, the total estimated operational discharges of bilge oil into marine U.S. waters per year is 81 tonnes (22 thousand gallons)
Table E-14 summarizes total operation discharges in North American waters. The figures for Canada and Mexico were derived by multiplying the estimated operational discharge in U.S. waters by the ratio of cargo movements in U.S. waters to the cargo movements in Canadian and Mexican waters respectively. The best estimate of total discharge in North American waters is 99 tonnes (26 thousand gallons). Approximately 38 tonnes (11 thousand gallons) are diesel oil, with the remaining 61 tonnes (16 thousand gallons) comprised primarily of heavy fuel oil and lube oil.
The tonnes of cargo moved through each region were used as a basis for distributing the total operational discharge of
TABLE E-13 Bilge Oil Discharge—U.S. Marine Waters (for vessels greater than or equal to 100 GT)
|
|
Tankers |
Vessels > 400 GT in size Cargo Ships |
Other |
100 GT to 400 GT |
|
Days operating in U.S. coastal waters (days/year) |
67,000 |
209,000 |
110,000 |
235,000 |
|
Average Size of Propulsion Machinery (HP) |
7,500 |
8,300 |
3,900 |
1,200 |
|
Assumed Bilge Oil Generation (gal/1000 HP/day) |
0.250 |
0.250 |
0.250 |
0.250 |
|
Average Bilge Oil Generation (gal/day/ship) |
1.9 |
2.1 |
1.0 |
0.3 |
|
Bilge Oil Generation (gallons/year) |
125,625 |
433,675 |
107,250 |
70,500 |
|
Bilge Oil Generation (tonnes/year) |
491 |
1,694 |
380 |
250 |
|
MARPOL COMPLIANT |
||||
|
Total Bilge Oil Generation (tonnes/year) |
491 |
1,694 |
380 |
250 |
|
Percent assumed MARPOL Compliant |
98.0 |
98.0 |
98.0 |
90.0 |
|
Discharge as a Percent of Bilge Oil Generated |
0.2 |
0.2 |
0.2 |
0.0 |
|
Bilge Oil Discharge (tonnes/year) |
1.0 |
3.3 |
0.7 |
0.0 |
|
NON-COMPLIANT |
||||
|
Percent of Tankers Assumed Non-MARPOL Compliant |
2 |
2 |
2 |
10 |
|
Discharge as a Percent of Bilge Oil Generated |
100 |
100 |
100 |
100 |
|
Bilge Oil Discharge (tonnes/year) |
9.8 |
33.9 |
7.6 |
25.0 |
|
Total Bilge Oil Discharge (tonnes/year) |
81 |
|
|
|
|
Total Bilge Oil Discharge (gallons/year) |
21,687 |
|
|
|
TABLE E-14 Total Bilge Oil Discharge—North American Waters (for vessels greater than or equal to 100 GT)
|
|
(tonnes) |
(gallons) |
|
United States |
81 |
|
|
Canada |
11 |
|
|
Mexico |
7 |
|
|
Best estimate |
99 |
26,465 |
bilge oil amongst the various zones. These results are summarized in Table E-15.
Summary of Fuel Oil and Bilge Oil Inputs (for Vessels greater than or equal to 100 GT)
Estimated operational discharges for both North American waters and international waters are summarized in Tables 2-2 through 2-6. Considering the high level of uncertainty in the assumptions on the extent of MARPOL compliance, the minimum estimate is taken as 50% of the best estimate, and the maximum estimate at twice the best estimate.
Fuel Oil and Bilge Oil Inputs in North American Waters (for Vessels less than 100 GT)
Bilge oil discharges into U.S. marine waters for vessels less than 100 GT in size are summarized in Table E-16. According to U.S. Coast Guard Marine Safety Management System (MSMS) database, in year 2000 there were 41,313 registered vessels in the U.S. under 100 GT, other than tankers, cargo ships, and recreational vessels. This average size for propulsion machinery was 350 HP. It was assumed that these vessels generated 0.09 gallons of bilge oil per day, operated 50 days per year, and that 60% of the vessels operated in marine (non inland) waters. These estimates were the best judgment of the committee, as data were not available. Based on the above, the total bilge oil generation in the vessels less than 100 GT was calculated to be 385 tonnes per year (108 thousand gallons per year).
A 70% compliance level was assumed for these smaller vessels. For MARPOL compliant vessels, it is assumed that all bilge oil is retained onboard and disposed at suitable reception facilities. For non-compliant vessels, 100% discharge of bilge oil is assumed. The calculated value, also considered the best estimated, was therefore 30% of 385 tonnes per year, or 115 tonnes per year (33 thousand gallons per year). All of these discharges are assumed to be diesel oil and other light distillates. The distributions by zone are summarized in Table E-18. Due to the very high level of uncertainty in these calculations, a range from 23 tonnes per year (20% of the best estimate) to 575 tonnes per year (five times the best estimate) was selected. Worldwide estimates for vessels under 100 GT were not developed due to the lack of data. Also, estimates were not developed for Canadian and Mexican waters.
Accidental Spills from Vessels in North American Waters
Spill Trends in U.S. Waters
Figure E-1 shows the oil spillage in U.S. waters from tank vessels during the period from 1973 to 1999. The oil spill data are from the Environmental Research Consulting Spill
TABLE E-15 Operational Discharge Summary (for vessels greater than or equal to 100 GT)
TABLE E-16 Total Bilge Oil Discharge—North American Waters (for vessels less than 100 GT)
|
Number of Registered Vessels < 100 GT in size |
41,313 |
|
Estimated percentage operating in marine waters |
60 |
|
Estimated operating days per year |
50 |
|
Days operating in U.S. coastal waters (days/year) |
1,240,000 |
|
Days operating in U.S. coastal waters (days/year) |
1,240,000 |
|
Average Size of Propulsion Machinery (HP) |
350 |
|
Assumed Bilge Oil Generation (gal/1000 HP/day) |
0.250 |
|
Average Bilge Oil Generation (gal/day/ship) |
0.088 |
|
Bilge Oil Generation (gallons/year) |
108,500 |
|
Bilge Oil Generation (tonnes/year) |
385 |
|
MARPOL Compliant |
|
|
Total Bilge Oil Generation (tonnes/year) |
385 |
|
Percent assumed MARPOL Compliant |
70 |
|
Discharge as a Percent of Bilge Oil Generated |
0.0 |
|
Bilge Oil Discharge (tonnes/year) |
0.0 |
|
Non-compliant |
|
|
Percent of Tankers Assumed Non-MARPOL Compliant |
30 |
|
Discharge as a Percent of Bilge Oil Generated |
100 |
|
Bilge Oil Discharge (tonnes/year) |
115.4 |
|
Total Bilge Oil Discharge (tonnes/year) |
115 |
|
Total Bilge Oil Discharge (gallons/year) |
32,885 |
Databases, which collate data from a number of sources, including the U.S. Coast Guard, U.S. National Response Center, the U.S. Minerals Management Service, and the Oil Spill Intelligence Report.
As illustrated in Figure E-1, oil spillage dropped off significantly after 1991. This improvement followed the grounding of the Exxon Valdez in 1989, and the subsequent passage of the Oil Pollution Act of 1990 (OPA 90).
Estimated Spill Rates for North American Waters
In recognition of the fundamental changes to the maritime industry that took place after the Exxon Valdez accident, spill data from 1990 onward were used as the basis for estimating the amount of oil entering U.S. waters from marine vessel accidents. Because complete spill data for Canadian and Mexican waters are not available, the estimated input from these waters was based on U.S. spill data adjusted for the relative tonnage moved through Canadian and Mexican waters as compared to U.S. waters.
Although effort is required to carefully evaluate data from the U.S. Coast Guard spill database to avoid double counting, the data were consistently collected during the 1990s and are considered reliable, particularly with regard to the larger spills. The database, which contains generally conservative estimates of outflow from all reported incidents, is assumed to establish the minimum estimate.
Table E-17 lists the amount of petroleum hydrocarbons spilled in the sea in U.S. marine waters from 1990 through 1999. A total of 1,745 spills of 0.34 tonnes (100 gallons) or more occurred during this ten year period, discharging some 9,111 tonnes (2,520,134 gallons) into marine waters. 175 of these spills were greater than 34 tonnes (10,000 gallons) in size, and these large spills accounted for about 87% of the total spillage.
Table E-18 shows the breakdown of the spillage by types of vessels and types of oil. Tankers and tank barges were responsible for 82% of the total spillage. Oil types were separated into four categories. Spillage by oil type was as follows: crude Oil (36%), heavy distillate (36%), light distillate (25%), and gasoline (3%).
Estimation of Spills in Canadian and Mexican Waters
Because a comprehensive spill database for Canadian and Mexican waters were not available, the spill volumes were estimated by adjusted U.S. figures by the relative movements of cargo. In 1997, approximately 715 million tonnes of crude oil and products were moved in U.S. international and coastwise trade (USACE, 1997b). In comparison, about 68 million tonnes were moved through Canadian ports (Statistics Canada, 1997), or 9.5 percent of the U.S. movements. Similarly, about 112 million tonnes of crude and products were moved through Mexican ports (BP World Statistics, 1997), or 15.7 percent of the U.S. movements. Inputs from accidental spills from tank vessels in Canada and Mexico were taken as 9.5 percent and 15.7 percent of the U.S. values respectively.
Canadian and Mexican dry cargo movements are approximately one-third and one-twentieth of the U.S. international and coastwise movements respectively. However, freighters are responsible for only 18 percent of the spillage from other vessels in U.S. waters. It was assumed that spills in Canadian water from other vessels equals 15 percent of the U.S. totals, and that spills in Mexican waters from other vessels equals 6 percent of the U.S. totals.
Summary of Spills in North American Waters
The U.S. Coast Guard database, which contains generally conservative estimates of outflow from all reported incidents, is assumed to establish the minimum estimate. Recognizing the completeness of the data, the spill quantities were increased by just 5 percent to obtain the best estimate, and further increased by 20 percent to obtain the maximum estimate. Results are summarized in Table E-19.
The recording of the location of spills was not as consistently maintained within the U.S. Coast Guard spill database. This data has been reviewed and summarized in Tables 2-2 through 2-6, in order to provide a sense of the distribution of spills within U.S. waters.
Accidental Spills from Vessels in International Waters
For this study, spill data from the Environmental Research Consulting database is applied. This database includes information gleaned from the International Maritime Organization, ITOPF, and other national and regional agencies. The international data excludes spills in North American waters. As shown in Table E-20, a total of 745,292 tonnes of oil spillage was recorded during the years 1990 through 1999,
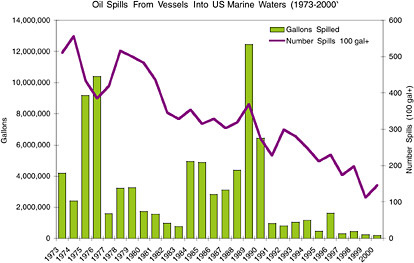
FIGURE E-1 Historical trend (1973-1999) in oil spills from vessels into U.S. marine waters (data from U.S. Coast Guard and MMS databases by Environmental Research Consulting.)
averaging 74,529 tonnes (22 million gallons) per year during this ten year period. Not included in these totals is the spillage associated with the Gulf War, which is estimated to be in excess of 600,000 tonnes.
The international data are not consistently collected and are therefore regarded as underestimates. Smaller spills are frequently not included, and reporting is sometimes compromised for political and logistical reasons. Recognizing the
TABLE E-17 Summary of Oil Input from Accidental Spills (for Vessels in U.S. Waters)
|
|
Tanker |
Tank Barge |
Other Vessels |
||||||
|
Year |
# Spills >100 gal |
Amount Spilled (gallons) |
Amount Spilled (tonnes) |
# Spills >100 gal |
Amount Spilled (gallons) |
Amount Spilled (tonnes) |
# Spills >100 gal |
Amount Spilled (gallons) |
Amount Spilled (tonnes) |
|
1990 |
24 |
4,605,092 |
16,963 |
58 |
1,389,000 |
5,061 |
193 |
437,584 |
1,589 |
|
1991 |
13 |
43,348 |
154 |
39 |
631,934 |
2,431 |
176 |
279,274 |
1,020 |
|
1992 |
22 |
114,431 |
422 |
41 |
342,823 |
1,319 |
236 |
319,337 |
1,131 |
|
1993 |
26 |
78,729 |
300 |
42 |
661,848 |
2,562 |
213 |
301,703 |
1,111 |
|
1994 |
17 |
62,502 |
237 |
46 |
900,841 |
3,442 |
186 |
191,300 |
679 |
|
1995 |
10 |
84,369 |
304 |
33 |
70,492 |
251 |
169 |
304,268 |
1,110 |
|
1996 |
11 |
275,223 |
1,032 |
40 |
1,116,606 |
3,983 |
179 |
226,322 |
819 |
|
1997 |
5 |
3,952 |
15 |
27 |
139,447 |
482 |
142 |
145,493 |
531 |
|
1998 |
9 |
39,330 |
153 |
27 |
169,490 |
622 |
162 |
247,736 |
875 |
|
1999 |
4 |
4,590 |
17 |
19 |
157,680 |
511 |
89 |
67,117 |
246 |
|
Totals |
141 |
5,311,566 |
19,597 |
372 |
5,580,161 |
20,665 |
1745 |
2,520,134 |
9,111 |
|
Ave./yr |
14 |
531,157 |
1,960 |
37 |
558,016 |
2,067 |
175 |
252,013 |
911 |
|
Total—All Vessels—U.S. Waters (average over period from 1990-1999) |
|||||||||
|
Number of Spills |
226 |
spills > 100 gallons in size per year |
|||||||
|
Amount of Spillage |
1,341,186 |
gallons spilled per year (average) |
|||||||
|
|
4,937 |
tonnes spilled per year (average) |
|||||||
TABLE E-18 Summary of Average Total Load from Accidental Spills during Years 1990-1999, for Vessels in U.S. Waters by Type of Vessel and by Type of Oil (tonnes)
|
|
Tankers |
Tank Barges |
Other Vessels |
Totals |
% of Total |
|
Crude oil |
16,525 |
1,184 |
162 |
17,872 |
36% |
|
Gasoline |
187 |
1,459 |
50 |
1,697 |
3% |
|
Light distillate |
545 |
5,466 |
6,247 |
12,259 |
25% |
|
Heavy distillate |
2,340 |
12,556 |
2,651 |
17,546 |
36% |
|
TOTALS |
19,597 |
20,665 |
9,110 |
49,373 |
|
|
(Percent of total) |
40 |
42 |
18 |
|
|
incompleteness of the data and the fact that the smaller spills, under 10,000 gallons (34 tonnes), comprised about 13 percent of the U.S. totals, the international spill quantities were increased by 25 percent to obtain the minimum estimate, by an additional 10 percent to obtain the best estimate, and further increased by 25 percent to obtain the maximum estimate. Results are summarized in Table E-21.
Accidental Spills from Vessels Worldwide
The North American and international spill estimates are combined to provide worldwide estimates (Tables 2-2 through 2-6). The best estimate for total spillage worldwide is 110,000 tonnes (30 million gallons) per year. The 1985 report (National Research Council, 1985) and the 1990 study (IMO, 1990) both used data from the International Tanker Owners Pollution Federation Ltd. (ITOPF) to estimate the quantity of oil entering the marine environment from tanker accidents. In the 1990 study, the spillage was averaged for the 10-year period from 1981 to 1989, establishing an annual average of 114,000 tonnes per year. In the 1990 report no adjustments were made for the deficiencies in the database, so care should taken when comparing these figures.
Inputs To The Sea From The Aircraft Industry
There are inputs to the sea from deliberate and continual releases of fuel from aircraft. There are two sources: deliberate discharge due to emergency conditions aboard the aircraft, and normal operation releases including the release of partially burned fuel in inefficient engines or inefficient operating modes and emptying of fuel injection bypass canisters. Modern aircraft have take-off weights exceeding their landing weights, sometimes by as much as 150 tonnes. For example, a 747 can carry as much as 220,000 L of fuel weighing about 175,000 kg or 175 tonnes. If a fully laden 747 jettisoned its fuel because it was required to return to an airport, it could dump as much as 150 tonnes of the fuel to enable it to land safely. Fuel dumping is infrequent but not rare. One airport reported on 16 fuel dumps in one year out of 7,000 flights conducted [Canadian Environmental Assess
TABLE E-19 Summary of Average Annual Loads from Accidental Spills (for Vessels in North American Waters)
TABLE E-20 Summary of Oil Input from Accidental Spills for Vessels (International Waters—Spills in North American Waters Excluded)
|
Year |
Tank Vessels Amount Spilled (tonnes) |
Other Vessels Amount Spilled (tonnes) |
All Vessels Amount Spilled (tonnes) |
|
1990 |
39,687 |
4,757 |
44,444 |
|
1991 |
169,077 |
4,315 |
173,393 |
|
1992 |
113,171 |
2,454 |
115,624 |
|
1993 |
107,895 |
3,269 |
111,164 |
|
1994 |
96,652 |
6,220 |
102,872 |
|
1995 |
12,439 |
4,358 |
16,797 |
|
1996 |
62,507 |
7,358 |
69,864 |
|
1997 |
62,846 |
3,344 |
66,190 |
|
1998 |
20,516 |
3,839 |
24,355 |
|
1999 |
17,613 |
2,976 |
20,589 |
|
Totals |
702,402 |
42,890 |
745,292 |
|
Ave./yr |
70,240 |
4,289 |
74,529 |
|
Total—All Vessels—International Waters |
|||
|
(average over period from 1990-1999) |
|||
|
Amount of Spillage |
21,911,596 |
gallons spilled per year (average) |
|
|
|
74,529 |
tonnes spilled per year (average) |
|
ment Agency (CEAA), 1995]. The U.S. military reports on 938 dumps, for 7,300 tonnes per year, worldwide (Clewell, 1980). Reporting on dumping is required but is not enforced or monitored. Because of fears of dumping over residential areas, most dumping is conducted over preassigned areas of little habitation. Airports near lakes or oceans designate areas over these waters. Evaporation reduces the amount that directly deposits to between 5 and 70 percent of dump volume, depending on fuel type and weather conditions.
Older engines can emit relatively large amounts of unburned fuel. In older jet and turbine engines, jet fuel is cycled through engine parts as a coolant and is then passed into the injection system. Because this flow must be maintained at certain levels, about 5 to 15 percent of fuel consumption can be emitted through the engines without fuel combustion. This loss occurs primarily during idle and take-off conditions and is least during cruise conditions. Little documentation on this has been found, and it may not contribute much oil to the sea. Some older engines also have an injection bypass tank that is emptied automatically after take-off. This is believed to be restricted to very few aircraft at this time.
The preliminary estimate of oil reaching the sea is based on the probability of a dump occurring. From literature, the rate of military jettisoning varies between 0.001 and 0.002 dumps per flight (Clewell, 1980a,b; CEAA, 1995); this averages 0.0015. If civilian rates were one-third of this, then the rate for civilian aircraft would be about 0.0005, or 5 flights out of 10,000. The flights over the oceans are relatively well known (European Commission, 1996). Flights over the North Atlantic average about 700 daily, over the North Pacific about 100 (not counting those over land on polar routes), and those over the southern hemisphere, are estimated at about 200 per day. This is 1,000 flights per day, with most flights consisting of large, wide-bodied aircraft such as the 757, 767, MD-11, and similar aircraft. The dumping of fuel typically releases 50 tonnes (50,000 L), of which about 50 percent would reach the sea surface, based on experimental deposition studies (Clewell, 1980a; Cross and Picknett, 1973). This would yield 4,500 tonnes per year. The U.S. military averaged 7,262 tonnes per year in 1975 to 1978, with a steady decrease. If we place this value at 4,000 tonnes currently and presume that only one-quarter of this was over water and would hit the water, then about 1,000 tonnes per year is the U.S. military
TABLE E-21 Summary of Oil Input from Accidental Spills for Vessels Worldwide
input. If the world input from military aircraft is triple this amount, then the world input is 3,000 tonnes. The sum total of aircraft dumping input is then estimated at 7,500 tonnes. It is estimated that 1/5 of these releases would take place over North American territorial waters on the basis of air traffic loading to and from North America, compared to the rest of the world. This again is subdivided by the approximate numbers of trans-ocean flights arriving/departing from airports in the designated regions (Tables 2-2 through 2-6).


