
Appendix C
WORKFORCE PROJECTION METHODS
This appendix provides additional details about the computations and data sources used in developing the projections of radiologists and radiologic technologists (RTs) performing mammography presented in the body of this report.
Supply Projections
Generally speaking, reliable projections of the supply of a particular health profession require an accurate, up-to-date dataset containing information about the profession. Projections based on a comprehensive age-cohort flow model require at a minimum:
-
A baseline supply profile of the profession that includes the age distribution of active professionals for a recent year. Typically, the age profile is provided in 10-year (or preferably 5-year) age groups. Additional information about full-time/part-time/inactive status, hours of work, productivity, and other work-related characteristics by age group can improve the realism and accuracy of the projections.
-
A profile of the entrants to the profession tabulated by the same age groups as the baseline age profile. Ideally, this entrant profile will include any additional work-related characteristics for the new entrants by age group (e.g., full-time or part-time status). To the extent that the counts of new entrants are linked to factors such as graduations from professional education programs, license exam passers, new licensee counts, etc., the possibilities for exploring alternative “what if scenarios are increased.
-
A profile of practitioners leaving the profession due to death, retirement, or other reasons, tabulated by the same age groups as the baseline supply profile. To the extent that the counts of those leaving a profession are linked to factors such as transitions to part-time work, the state of the economy, etc., the possibilities for exploring alternative “what if” scenarios are increased.
If projections are required for alternative scenarios of the future, such as increasing educational program production, then estimates of future changes in the factors represented in the scenarios must also be provided.
If an alternate model is used, then different datasets may be required. For example, the American Society of Radiologic Technologists (ASRT) produces short-term supply projections of RTs performing mammography based on time-in-profession statistics, rather than age. This type of model requires estimates of the percentages of different groups of new entrants/licensees that remain active in the profession for different lengths of time. By aggregating new entrants into (say) 5-year cohorts, it is possible to develop estimates of the numbers of practitioners that will remain active at different points in time in the future. This method appears to be especially useful for short-term projections for professions that typically do not retain practitioners for a full lifetime of service (e.g., RTs in other specialties practicing mammography).
Unfortunately, even though considerable data are available for both radiologists and RTs performing mammography, all the data needed for comprehensive projection models are not available. Estimates of the age distributions of practitioners are available, but because formal certification is not a requirement for the practice of mammography in all states, complete data on all new entrants to mammography practice are not available. In addition, reliable data on departures from practice are vague at best. However, it is clear from the basic age distribution data that the proportion of RTs performing mammography past the age of 65 is much lower than comparable proportions for most health professions.
The Supply Projection Models
Both the radiologist and technologist projections provided in this study are based on an age-cohort flow model. Typical calculations are described in the diagram in Figure C-1, which represents a segment from the complete model shown in Tables 4–4 and 4–5 in Chapter 4 of this report.
The Radiologist Model
Because there are no special certificates that all radiologists performing mammography must earn in order to read mammograms, there is no independent data source that identifies or counts new entrants into mammography practice. Nor is there an independent source of data about the numbers of practitioners who leave mammography practice, whether by death, retirement, or other departure. These data shortcomings preclude the development of a full-blown age-cohort flow model. It is necessary to make a number of assumptions to fill in the missing data.
The Radiologic Technologist Model
The status quo estimates of new RTs performing mammography are based on data from ASRT on the number of people completing the mammography certification exam in recent years. Data from ASRT show that approximately 1,150 people take this exam. We have assumed that all of those who take the exam will practice mammography. Although some of those taking the exam may not enter practice, others not taking the exam will enter practice in some states and settings.
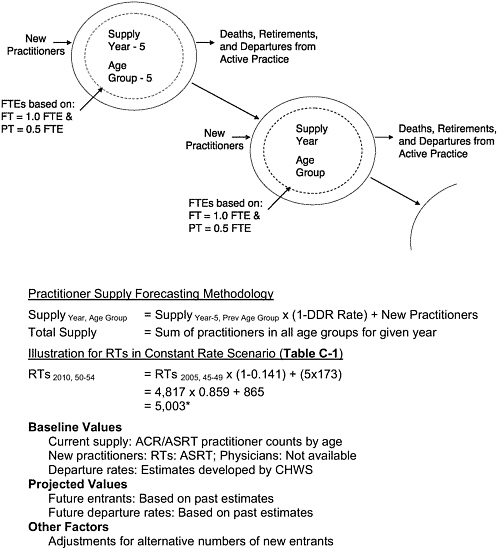
FIGURE C-1 Schematic diagram of age-cohort flow projection method.
NOTE: Number marked with asterix does not match Table C-1 exactly due to rounding.
TABLE C-1 Details of Calculations for Constant Rate Scenario for FTEa RTs Performing Mammography
|
1 Year Additionsb |
Age Group |
Baseline |
Projection Year |
|||||||
|
2004j |
2005 |
2010 |
2015 |
2020 |
2025 |
|||||
|
3.5 |
78 |
57 |
0.0 |
<25 |
196 |
214 |
284 |
284 |
284 |
284 |
|
18.4 |
411 |
298 |
0.0 |
25–29 |
1,368 |
1,431 |
1,704 |
1,774 |
1,774 |
1,774 |
|
25.0 |
559 |
405 |
0.0 |
30–34 |
3,256 |
3,283 |
3,457 |
3,730 |
3,800 |
3,800 |
|
12.5 |
279 |
203 |
0.0 |
35–39 |
3,782 |
3,879 |
4,296 |
4,470 |
4,742 |
4,813 |
|
12.1 |
270 |
196 |
0.0 |
40–44 |
4,544 |
4,587 |
4,859 |
5,276 |
5,450 |
5,723 |
|
12.0 |
268 |
194 |
4.9 |
44–49 |
4,689 |
4,817 |
5,335 |
5,593 |
5,990 |
6,155 |
|
10.7 |
239 |
173 |
14.1 |
50–54 |
4,150 |
4,322 |
5,005k |
5,449 |
5,672 |
6,012 |
|
3.9 |
87 |
63 |
41.0 |
55–59 |
2,663 |
2,763 |
2,866 |
3,269 |
3,531 |
3,662 |
|
1.7 |
38 |
28 |
67.2 |
60–64 |
1,153 |
1,239 |
1,044 |
1,078 |
1,210 |
1,296 |
|
0.2 |
4 |
3 |
77.8 |
65+ |
364 |
389 |
378 |
332 |
329 |
358 |
|
100 |
— |
— |
— |
Totall |
26,132 |
26,925 |
29,227 |
31,254 |
32,781 |
33,876 |
|
|
Women 40+ (000s)m |
68,357 |
70,197 |
75,265 |
79,633 |
83,888 |
88,583 |
|||
|
Number/100K Popn |
38.2 |
38.4 |
38.8 |
39.2 |
39.1 |
38.2 |
||||
|
Percent Change (%) |
— |
0.3 |
1.2 |
1.1 |
−0.4 |
−2.1 |
||||
|
Cumulative Percent Change (%) |
— |
0.3 |
1.6 |
2.7 |
2.2 |
0.0 |
||||
|
aFTE=(Mammography is first specialty)*1.0+(Mammography is second specialty)*0.5. bNew RTs added every year to maintain new entrant counts, estimated; percentages represent estimated allocation of new practitioners by age group. cColumn displays the age distribution of the new entrants into practice, used to estimate the number of new entrants in each age group in a year. dThe number 2,235 is the total number of new entrants in each age group in each year in the future. eColumn displays the estimated number of new entrants into each age group each year. This is computed by multiplying c times d. fEstimated first-year attrition of new mammography certificants=27.5%. This is the estimated percentage of new entrants into mammography practice who leave mammography within the first year of certification. These data are available only for RTs. |
||||||||||
|
g Column displays the estimated number of new entrants into each age group each year, adjusted for the estimated number of first-year dropouts (see f above). h DDR stands for the rate of deaths, departures, and retirements (for 5-year groups), estimated; percentages represent estimated percentages of an age cohort that will retire, die, or otherwise depart from practice in a five year interval. i Column displays the percentage of practitioners in each age group leaving practice for any reason. These percentages are generally not available in association data sets. j Column displays the group of RTs performing mammography in the baseline year of 2004. It is computed from estimates of full- and part-time practitioners provided by ASRT. k Sample number represents the number of FTE practitioners in a particular age group in a particular year. These numbers are computed by the projection model. l Row displays the estimated total FTE RTs performing mammography in the United States for each projection year, computed by the projection model. m Row displays the number of women 40 and older in the population, a reference point for demand. n Row displays the ratio of RTs performing mammography per 100,000 women 40 and older in the United States, computed by the projection model. NOTE: Constant rate scenario projections for the United States, 2004–2025, assumes constant induction of new RTs performing mammograms, constant rate of departure of RTs performing mammograms, and increasing numbers of women 40 and older, per U.S. Census Bureau projections. The models for radiologists and RTs are similar but not identical, a reflection of the differences in availability of data required for the models. SOURCES: Derived from ASRT (2004a), U.S. Census Bureau (2004). |
TABLE C-2 Involvement of RTs in Mammography by Age Group, 2004
|
Age Group |
Involvement in Mammography |
||||
|
Primary Specialty |
Secondary Specialty |
Neither Primary nor Secondary |
Total |
Percent Mammography |
|
|
15–24 |
83 |
226 |
11,097 |
11,406 |
2.7 |
|
25–29 |
846 |
1,043 |
22,947 |
24,836 |
7.6 |
|
30–34 |
2,236 |
2,039 |
29,415 |
33,690 |
12.7 |
|
35–39 |
2,725 |
2,113 |
30,103 |
34,941 |
13.8 |
|
40–44 |
3,319 |
2,449 |
32,896 |
38,664 |
14.9 |
|
45–49 |
3,428 |
2,522 |
31,609 |
37,559 |
15.8 |
|
50–54 |
3,115 |
2,070 |
26,320 |
31,505 |
16.5 |
|
55–59 |
2,022 |
1,221 |
16,231 |
19,474 |
16.7 |
|
60–64 |
886 |
533 |
7,509 |
8,928 |
15.9 |
|
65+ |
280 |
167 |
3,999 |
4,446 |
10.1 |
|
Total |
18,940 |
14,383 |
212,126 |
245,449 |
13.6 |
|
SOURCE: ASRT (2004b). |
|||||
Other Tables of Interest
Tables C-2 through C-5 present a variety of basic data about RTs and radiologists performing mammography services. Some of the figures in each of the tables have been used in preparing the supply projections.
TABLE C-3 Estimated RTs Working in Mammography by Age Group, 2004
TABLE C-4 Estimates of Radiologists Performing Mammography by Age Group, 2003
TABLE C-5 Mammography Certification Rates for a Sample of RTs Practicing Mammography in New York State, 2004
|
Age Group |
Certified |
Not Certified |
Percent Certified |
Percent Not Certified |
|
20–24 |
4 |
8 |
33.3 |
66.7 |
|
25–29 |
23 |
18 |
56.1 |
43.9 |
|
30–34 |
73 |
10 |
88.0 |
12.0 |
|
35–39 |
79 |
4 |
95.2 |
4.8 |
|
40–44 |
85 |
8 |
91.4 |
8.6 |
|
44–49 |
90 |
7 |
92.8 |
7.2 |
|
50–54 |
88 |
9 |
90.7 |
9.3 |
|
55–59 |
49 |
7 |
87.5 |
12.5 |
|
60–64 |
15 |
3 |
83.3 |
16.7 |
|
65+ |
3 |
0 |
100.0 |
0.0 |
|
Total |
509 |
74 |
87.3 |
12.7 |
|
SOURCE: Preliminary Results, New York State Mammography Survey (2004). |
||||
Demand Projections
Economists refer to demand as the volume of product or service that an informed buyer will purchase for a particular price. In the context of the health workforce, this approach to defining demand is not particularly useful because the consumer does not purchase a professional, only some of the services offered by a professional. The demand can be partitioned into demand by a patient for services offered by a professional and demand for a professional by a health service provider organization, with both often modified by a fiscal intermediary (e.g., Medicaid or an insurance company).
The economic concept of demand is further blurred because the price paid for a professional’s services are often only a fraction of the true price, due to insurance coverage of one sort or another. This difficulty is compounded by the fact that often consumers have incomplete and even inaccurate information about the services offered by the professionals and their ultimate outcomes.
In this complex environment, the demand for a health profession is typically linked to shortages or surpluses in the labor market that reflect the relative ease that an employer has in hiring the professionals needed to provide services demanded by patients. A profession is said to be in shortage if employers collectively cannot hire enough professionals to support a full complement of services to patients and prospective patients.
A variety of indirect measures have been shown to be related to the demand for a health profession, including wage levels, change in wage levels, vacancy rates, turnover rates, delays in scheduling services, etc. None of these measure demand directly, but most are related to demand in some way.
The estimates of demand referred to in this document are couched in relative terms. For example, if the population of patients or prospective patients increases by 10 percent, then it is assumed that the demand for professional services will increase by 10 percent, and that the demand for professionals will increase by 10 percent. Or, if a new service that has a positive impact on patients is introduced by a health profession, then
the demand for the profession will increase. It is generally not an easy task to titrate the impact on demand of different levels or types of changes in professional services or costs.
In this study, only the most basic types of changes are examined, specifically projected increases in the numbers of patients to be served. It would be possible to examine other demand scenarios (e.g., an increase in productivity due to the introduction of new technology), if one is willing and able to develop justifiable estimates of the impact of the scenario on demand.
REFERENCES
ASRT (American Society of Radiologic Technologists). 2004a. Radiologic Technologist Wage and Salary Survey. Albuquerque, NM: ASRT.
ASRT. 2004b. Mammography Data for MQSA Reauthorization Effort. Albuquerque, NM: ASRT.
Sunshine J, Bhargavan M, Lewis R. 2004 (September 3). Information on Radiologists Who Interpret Mammograms. Presentation at the meeting of the Institute of Medicine Committee on Improving Mammography Quality Standards, Washington, DC.
U.S. Census Bureau. 2004. U.S. Interim Projections by Age, Sex, Race, and Hispanic Origin. [Online]. Available: http://www.census.gov/ipc/www/usinterimproj/ [accessed August 26, 2004].


