
6
Barriers to Educational Opportunities for Hispanics in the United States
Barbara Schneider, Sylvia Martinez, and Ann Owens
For Hispanics in the United States, the educational experience is one of accumulated disadvantage. Many Hispanic students begin formalized schooling without the economic and social resources that many other students receive, and schools are often ill equipped to compensate for these initial disparities. For Hispanics, initial disadvantages often stem from parents’ immigrant and socioeconomic status and their lack of knowledge about the U.S. education system. As Hispanic students proceed through the schooling system, inadequate school resources and their weak relationships with their teachers continue to undermine their academic success. Initial disadvantages continue to accumulate, resulting in Hispanics having the lowest rates of high school and college degree attainment, which hinders their chances for stable employment. The situation of Hispanic educational attainment is cause for national concern.
Today, most parents and their children believe that a college degree is necessary for obtaining stable and meaningful work (Schneider and Stevenson, 1999). This attitude is reflected in the educational expectations parents hold for their children and in the expectations that young people have for themselves (U.S. Department of Education, 1995b, p. 88). High educational expectations can be found among all racial and ethnic groups regardless of their economic and social resources (p. 73). Although parents and children share high educational aims, their aspirations do not necessarily translate into postsecondary matriculation. This is especially the case for Hispanic high school students, particularly those whose parents have not attended college (Nuñez, Cuccaro-Alamin, and Carroll, 1998).
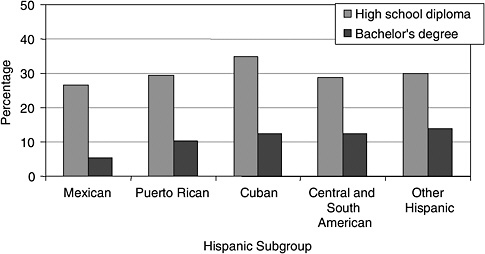
FIGURE 6-1 Educational attainment of the population 25 years and over by country of origin (percentage), 2002.
SOURCE: U.S. Census Bureau (2002a).
Despite high educational expectations, Hispanics are among the least educated group in the United States: 11 percent of those over age 25 have earned a bachelor’s degree or higher compared with 17 percent of blacks, 30 percent of whites, and 49 percent of Asian Americans in the same age group (U.S. Census Bureau, 2003).1 Even more troubling, more than one-fourth of Hispanic adults have less than a ninth-grade education (U.S. Census Bureau, 2002b). These numbers represent all Hispanic groups and include recent immigrants. When examined by country of origin, educational attainment for Hispanics varies. As shown in Figure 6-1, Mexican Americans, who are the largest and fastest growing Hispanic subgroup in the United States, have the lowest rates of educational attainment compared with other groups. Cuban Americans report the highest levels of high school completion, and “other Hispanics” report the highest levels of bachelor’s degree attainment. Most data sets do not distinguish among Hispanic subgroups, disregarding important cultural and economic differ-
ences among them. Whenever possible, analyses in this chapter attend to such differences.
Given the growth of the Hispanic population in the United States, most notably in the past decade (U.S. Census Bureau, 2001a), and the increasing importance of a college degree even for entry-level jobs (Carnoy, 2000), the barriers Hispanics face in realizing their educational ambitions is a major policy concern (see Chapter 4). This chapter presents the current state of educational opportunities available to the majority of Hispanic students in elementary, secondary, and postsecondary schools. Similar to other chapters in this volume, this chapter moves beyond the descriptive and explores some of the institutional and student-level factors that appear to be hindering Hispanic educational success. The goal is to identify some of the barriers to educational advancement experienced by Hispanic students in the United States, including entering school at a disadvantage because of a lack of exposure to literacy activities at home and in early formalized school settings, teacher assessments of students’ language proficiency unduly influencing instructional practices, how the relationship between Hispanic students and their predominantly non-Hispanic teachers encourages disengagement from academic work, and how the lack of academic guidance pertaining to course selections and college choice impedes Hispanics from attending four-year colleges.
TAKING THE FIRST STEPS: ACTIVITIES AT HOME
One of the most important factors in school success is the extent to which parents actively participate in their children’s education prior to their entry into formal preschool or kindergarten programs (U.S. Department of Education, 2003d). Specific activities, such as reading to children, have been shown to enhance children’s language acquisition, early reading performance, social development, and later success in school (Loeb, Fuller, Kagan, and Carrol, 2004; National Research Council, 1998). National trend data from the National Household and Education Survey (NHES) from 1993 to 1999 indicate that Hispanic children age 3 to 5 are less likely to be read to compared with non-Hispanic children. Families in which parents’ primary language at home is Spanish have especially low rates of participation in literacy activities. With respect to reading to children three or more times per week, Hispanic families in which both parents speak only Spanish at home had participation rates that were nearly 50 percentage points lower than white families in 1999. By contrast, for Hispanic families in which both parents speak English at home, participation rates were only 15 percentage points lower than white families. Hispanic households are also less likely than white households to participate in other prekindergarten literacy activities, such as telling their child a story or visiting a library,
again with a pronounced difference between Hispanic families who speak English in the home and those who do not.
Families with limited economic, educational, and social resources are often less likely to participate in literacy activities than those with greater resources. Using data from the NHES, families were categorized by income level to determine whether literacy activities still differ by race/ethnicity when resources are taken into account.2Figure 6-2 suggests a statistically significant association between literacy activities and family resources across racial/ethnic groups.3 However, at all income levels except the highest, Hispanic families are less likely than other groups to participate in literacy activities (see Figure 6-2), indicating that lower participation in literacy activities can be partially explained by lack of financial resources. An additional mechanism explaining different rates of participation is language: within each income bracket except the highest, Hispanic families in which neither parent speaks English were less likely to read to their children, tell a story, or visit a library than Hispanic families in which both parents speak English in the home.4 The rates of literacy participation for Hispanic families who speak English at home more closely resemble those of white and black families, suggesting that bilingual families may be more assimilated into American culture, and specifically into practices that increase school performance.
It is difficult to draw causal conclusions regarding the effects of language spoken at home across racial/ethnic groups and within the Hispanic population due to methodological shortcomings of existing data sets: the small numbers of non-English speakers in the existing samples, some surveys not being administered bilingually, and questions regarding literacy activities not differentiating between reading to a child in Spanish and doing so in English. However, multivariate analyses based on these NHES data show that, regardless of mother’s educational attainment and household income, Hispanic parents who speak only Spanish at home are less likely to read to their children than other Hispanic parents (both bilingual parents and those who speak only English).5 However, NHES data indicate
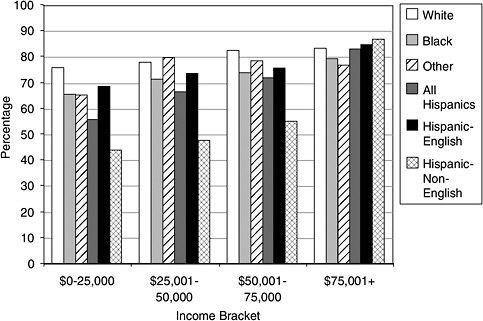
FIGURE 6-2 Average rates of participation for 3- to 5-year-olds not yet enrolled in kindergarten in being read to by a family member, by race/ethnicity according to income.
NOTES: Differences between racial groups and language status are statistically significant (p < .001). The difference between racial groups was not significant within the highest income bracket for this measure. “Read to” refers to being read to at least three times in the past week.
SOURCE: U.S. Department of Education (1999).
that parents who are bilingual are more likely to engage their child in literacy activities than parents who speak only Spanish, but their children are still at a disadvantage in reading compared with children whose parents speak only English. While participating in literacy activities in English is the optimal preparation for schooling, being read to in Spanish also exposes children to literacy strategies that will be beneficial as they start school. Students who are successful readers in their native language employ the same strategies to help them read in English (Jiminez, Garcia, and Pearson, 1996; Saville-Troike, 1984). However, parents who speak only Spanish in the home are more likely to be recent immigrants, live in disadvantaged communities, be unfamiliar with American cultural and educational practices, and have lower levels of education and less income. Taken together, this confluence of language, nativity, and environment creates obstacles for young children as they prepare to enter school.
Preschool Attendance
Most young children will attend some type of preschool program before entering kindergarten. Increasingly, scholars have pointed to the importance of having children attend preschool, arguing that it produces persistent gains on achievement tests and reduces the likelihood of grade retention and placement in remedial programs, especially for low-income children (Barnett and Camilli, 2002). Quality preschool and kindergarten experiences provide the basic foundation for children’s later cognitive and social development (Elkind, 1981; Wadsworth, 1989). Specifically, for Hispanic children, preschool can serve as a mediator between home and school. By exposing children to English and by socializing them into academic and cultural norms, even early schooling can reinforce the importance of education for future job success (Currie and Thomas, 1996). Despite evidence showing the benefits of preschool attendance, Hispanic children are the least likely to be enrolled in preschool. In 1999, 60 percent of white children who were 3 years old attended preschool, whereas only 26 percent of Hispanic children had started their education at this age (U.S. Department of Education, 2003d, p. 23). Among Hispanic 4- and 5-year-olds, enrollment rates were slightly higher and more closely resemble those of white and black children: 64 percent of Hispanic 4-year-olds attended preschool, compared with 69 percent of white and 81 percent of black 4-year-olds; among 5-year-olds, 89 percent of Hispanic, 93 percent of white, and 99 percent of black children attended preschool. Black children, however, are significantly more likely to attend preschool than Hispanic children in all age groups.
Some positive changes in Hispanic attendance in preschool programs can be seen by looking at participation in Head Start, which is specifically designed to serve disadvantaged children and uses federal poverty guidelines as a key factor for assessing eligibility. In 1998, black children age 5 and under had an attendance rate that was almost 10 percent higher than eligible Hispanics. By 2003, however, black children had an attendance rate that was only about 1 percent higher than Hispanic children (see Table 6-1). The higher attendance rates of Hispanic children may be the result of more parents taking advantage of Head Start, or it may merely reflect increases in the numbers of Hispanic children eligible for the program.
Attending Head Start appears to be a positive experience for most Hispanic children. Currie and Thomas (1996) have shown that Hispanic children who are enrolled in Head Start perform slightly better on a series of cognitive tests than those who do not attend any preschool program. However, the effects of participating in Head Start differ across Hispanic subgroups. The advantages of attending Head Start are the greatest among children of Mexican origin; Puerto Rican children appear to reap fewer benefits, although they do perform better than those who attend other types
TABLE 6-1 Head Start Enrollment Trends for Children Age 5 and Under by Race/Ethnicity, 1998–2003
|
Race/Ethnicity |
Year |
||||||
|
1998 (%) |
1999 (%) |
2000 (%) |
2001 (%) |
2002 (%) |
2003 (%) |
||
|
Black |
35.8 |
35.1 |
34.5 |
33.8 |
32.6 |
31.5 |
|
|
White |
31.5 |
30.5 |
30.4 |
29.9 |
28.4 |
27.6 |
|
|
Hispanic |
26.4 |
27.8 |
28.7 |
29.7 |
29.8 |
30.6 |
|
|
Asian |
2.9 |
2.1 |
2.0 |
2.0 |
2.0 |
1.8 |
|
|
American Indian |
3.4 |
3.4 |
3.3 |
3.6 |
2.9 |
3.2 |
|
|
Hawaiian/Pacific Islander |
1.0 |
1.0 |
1.0 |
1.0 |
1.1 |
|
|
|
SOURCE: Head Start Bureau Fact Sheets (2004). |
|||||||
of preschool programs. One explanation for this difference may be the poor quality of other available preschool programs (Currie and Thomas, 1996).6 While attending Head Start programs appears to provide some benefits, lack of available quality preschool programs remains an obstacle for some Hispanic children. Currently, programs such as universal preschool are being implemented in several states, including California. However, critics of such programs argue that while state-funded preschool allows access to preschool to more children, it detracts from creating quality preschools (Olsen, 1999).
Risk Factors for Kindergartners
Limited success in early schooling can be traced to several family background characteristics. Specific factors, such as having a mother who did not complete high school (Bianchi and McArthur, 1993), living in a single-parent home (McLanahan and Sandefur, 1994), living in a low-income or welfare-dependent household (U.S. Department of Education, 1995a), and having parents who speak a language other than English in the home (Kao, 1999; Rumberger and Larson, 1998) place children at risk of not succeeding academically (Pallas, Natriello, and McDill, 1989). These broad indicators, several of which are interrelated, do not necessarily predict that a student is destined for school failure. However, students whose families have combinations of these factors are more likely to have diffi-
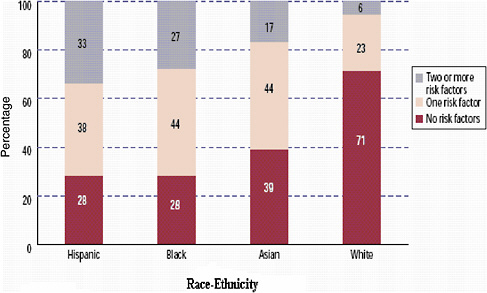
FIGURE 6-3 Percentage distribution of kindergartners by number of risk factors and race/ethnicity: Fall 1998.
NOTE: Percentage may not add to 100 due to rounding.
SOURCE: U.S. Department of Education (1998).
culty in school. Hispanic and black children entering kindergarten are disproportionately from families with one or more of these risk factors (see Figure 6-3). The proportion of children with two or more risk factors is five times larger among Hispanics (33 percent) and four times larger among blacks (27 percent) than among whites (6 percent) (U.S. Department of Education, 2001a).
To examine the risk factors for first-time kindergartners of different racial/ethnic backgrounds, several analytic models were constructed distinguishing among whites, blacks, Asians, and Hispanics (categorized by the language parents report is primarily spoken at home).7 The three models, in Appendix Table A6-1, show that race/ethnicity is differentially associated with each risk factor, and that Hispanics who speak English at home face different risks than those who speak Spanish at home. Hispanics, especially those who speak Spanish at home, are much less likely than blacks to be in a single-parent family relative to whites. There is a strong sense of family among Hispanics that is reinforced by religion, perhaps making single parenthood less likely to occur. For example, only 47 percent of Hispanics who
|
7 |
Appendix Table A6-1 presents three logistic regression models in which each of three risk factors serves as the dependent variable. |
primarily speak Spanish find divorce acceptable, compared with 72 percent of the U.S. population as a whole (Pew Hispanic Center Survey Brief, 2004). However, as shown in Chapter 5, single parenting is now rising among Hispanic families; if this trend continues, it may place more Hispanic students at risk.
The picture changes, however, when examining the likelihood of having a mother who does not have a high school diploma or being raised in a low-income family. Hispanics are between two (those who speak English at home) and three times (those who speak Spanish at home) more likely to have a mother with low educational attainment compared with whites, even when other risk factors and socioeconomic status have been taken into account. In addition, Hispanic families in which the parents speak Spanish at home are more than twice as likely to be below the poverty threshold as non-Hispanic whites.8 The risk factors seem to interact or be predictive of one another as well. Parents in Spanish-dominant families tend to be both less well educated and more likely to be poor. In general, these findings suggest that, although there are large numbers of Hispanics with two or more risk factors, the pattern of risk differs considerably for Hispanics who speak English at home and those who speak Spanish at home.9
As with literacy activities that occur prior to formal schooling, parental education and limited English proficiency play an important role in academic success when examining risk factors contributing to school performance. A parent’s primary language has implications for how involved he or she can be in their child’s education. Even a bilingual parent may have trouble with reading comprehension if he or she has not completed high school (Huerta-Macias, 2003; Zulmara and Necochea, 2003). Visiting the library or enrolling one’s child in a preschool program requires knowledge of what is available, where it is located, and how to get there. The most economically advantaged parent still needs logistical and organizational support to enroll and transport their young child to a preschool program. Furthermore, with respect to formal schooling, if kindergarten is not required, then parents may not even receive information about available programs.10
|
8 |
As expected, once other risk factors and socioeconomic status have been controlled, the coefficient for Hispanics drops significantly. |
|
9 |
Partial linear regressions (not shown) predicting the total number of risk factors were conducted for each racial/ethnic group to determine the additive effects of these risk factors. These regressions resulted in different patterns for these groups, confirming results presented in Appendix Table A6-1. |
|
10 |
Kindergarten is commonly regarded as the first step in the formal schooling process (Barnett, 1998), although in many states being enrolled in kindergarten is not mandatory (U.S. Department of Education, 2002d). Several states with a high proportion of Hispanic residents (California, New York, and Texas) do not have mandatory kindergarten enrollment (U.S. Department of Education, 1996a). |
Most existing data do not indicate whether Hispanic children in preschool or formal school are taught in English or Spanish. However, because of the monolinguistic nature of the U.S. school system, encouraging English proficiency in students and parents at the earliest possible stage is likely to lead to a stronger foundation for school learning and later academic success. Parents with young children, especially those who are first-generation immigrants, are likely to benefit if their schools and communities worked together to provide parent literacy programs, translators at school-related activities, advice on how to assist children in homework or engage them in academic activities, before- and after-school child care, and community outreach programs.
ACADEMIC PERFORMANCE IN THE PRIMARY GRADES, MIDDLE SCHOOL, AND HIGH SCHOOL
By the time they enter kindergarten, Hispanic students for the most part already trail their classmates in reading and mathematics achievement. Results from a recent national study of kindergartners, the Early Childhood Longitudinal Study Kindergarten Class of 1998–1999 (ECLS–K), point to a problematic academic future for Hispanic children. Non-Hispanic white children were more likely to score in the highest quartile in reading, mathematics, and general knowledge than black or Hispanic children (U.S. Department of Education, 2000a). Examining early literacy skills, Asian and non-Hispanic white children were more likely to recognize letters, beginning sounds, ending sounds, and sight words than blacks or Hispanics (see Table 6-2). With the exception of American Indians, Hispanic children whose parents do not speak English at home were the least likely to have passing reading proficiency scores across all tasks.
Results for mathematics proficiency were similar to those for language proficiency (see Table 6-3). Hispanic students whose parents primarily speak Spanish at home were the least likely to have passing scores for number and shape recognition, relative size, ordinal sequence, and addition and subtraction. In this instance, passing rates were lower than those for American Indians in all categories. The academic achievement gap between Hispanics and other groups at the onset of schooling continues through the primary grades, suggesting that the effects of family background characteristics, including language, create an initial barrier that is difficult to overcome.
Primary Grades
Using ECLS data from kindergarten and first grade, Reardon and Galindo (2003) conducted a series of multivariate analyses that show substantial variation in mathematics achievement scores among Hispanic sub-
TABLE 6-2 Percentage of First-Time Kindergartners Passing Each Reading Proficiency Level, by Child’s Race/Ethnicity, Fall 1998
|
Characteristic |
Letter Recognition |
Beginning Sounds |
Ending Sounds |
Sight Words |
|
Child’s race/ethnicity |
||||
|
White, non-Hispanic |
70.2 |
34.3 |
20.7 |
4.2 |
|
Black, non-Hispanic |
61.7 |
20.4 |
11.8 |
2.3a |
|
Asian |
82.8 |
44.2 |
29.5 |
12.1 |
|
Hispanic, speak English at home |
51.2 |
24.4 |
13.1 |
2.9a |
|
Hispanic, speak Spanish at home |
38.3a |
15.3a |
6.6a |
1.4a |
|
Hawaiian native/Pacific Islander |
62.1 |
29.5 |
13.1 |
7.0a |
|
American Indian/Alaska native |
37.1 |
14.4 |
6.4 |
1.3a |
|
More than one race, non-Hispanic |
61.0 |
26.6 |
15.5 |
5.2 |
|
NOTES: Only students with complete assessments were included. Sixty percent of the Hispanic students who speak Spanish at home were assessed in Spanish. aThese numbers include students who scored below the cutoff on the Oral Language Development Scale. SOURCE: U.S. Department of Education (1998). |
||||
TABLE 6-3 Percentage of First-Time Kindergartners Passing Each Mathematics Proficiency Level, by Child’s Race/Ethnicity, Fall 1998
|
Characteristic |
Number and Shape |
Relative Size |
Ordinal Sequence |
Add/Subtract |
|
Child’s race/ethnicity |
||||
|
White, non-Hispanic |
94.1 |
66.2 |
27.7 |
5.9 |
|
Black, non-Hispanic |
88.1 |
45.7 |
9.8 |
1.2 |
|
Asian |
95.6a |
71.1 |
30.3 |
7.6 |
|
Hispanic, speak English at home |
88.2 |
41.1 |
12.0 |
2.3 |
|
Hispanic, speak Spanish at home |
74.8 |
22.6 |
4.0 |
0.7 |
|
Hawaiian native/Pacific Islander |
92.4 |
52.3 |
14.2 |
1.7 |
|
American Indian/Alaska native |
80.3 |
37.0 |
7.3 |
1.0 |
|
More than one race, non-Hispanic |
90.5 |
55.5 |
18.6 |
4.0 |
|
NOTES: Only students with complete assessments were included. Sixty percent of the Hispanic students who speak Spanish at home were assessed in Spanish. aThis number represents variables with high percentages of missing or not-applicable data. SOURCE: U.S. Department of Education (1998). |
||||
groups (see Figure 6-4). Cuban Americans are the most similar to non-Hispanic whites, with Mexican Americans and Central Americans scoring nearly one standard deviation below their white classmates. This trend persists over time: by the end of first grade, Cuban Americans catch up to whites while Puerto Ricans, Mexican Americans, and Central Americans fall further behind. The achievement gap in mathematics is especially troubling because both instruction and performance in mathematics tend not to be dependent on language, in contrast to reading. One might expect that academic performance would improve as English language proficiency increases. However, this does not appear to be the case.
In the next set of analyses, Reardon and Galindo (2003) examined mathematics performance from kindergarten to first grade among first-, second-, and third-generation Mexican Americans and non-Hispanic whites. First- and third-generation Mexican immigrant students started kindergarten with lower levels of math skills than second-generation students, and that pattern did not change over time (see Figure 6-5).
The language barrier seems to place first-generation immigrant students at a decided disadvantage compared with second-generation Mexican Americans and whites. What is surprising is that this performance gain by second-generation immigrants does not hold for those who are third gen-
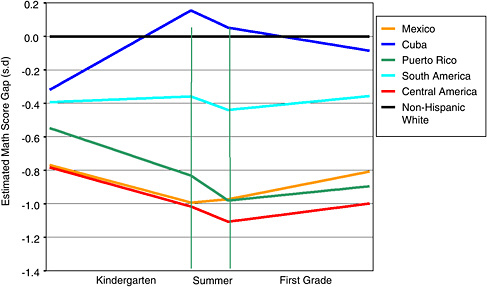
FIGURE 6-4 Hispanic mathematics achievement gap by country of origin, kindergarten and first grade.
SOURCE: U.S. Department of Education (1998).
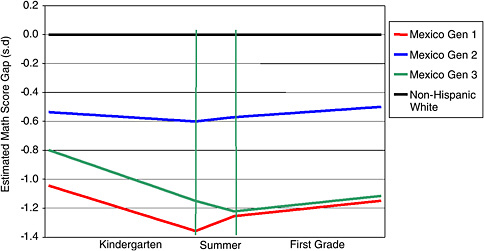
FIGURE 6-5 Hispanic mathematics achievement gap by generational status, kindergarten and first grade.
SOURCE: U.S. Department of Education (1998).
eration. One explanation may be that parents of second-generation students are motivated to succeed and instill those values in their children. The parents of third-generation students, particularly those who continue to speak only Spanish and who live in barrio communities with limited economic resources and poor schools, may become disillusioned with education as a path to social mobility and transmit these attitudes to their children.
Another problem may be teachers’ perceptions of their students’ abilities. Reardon and Galindo (2003) found that Hispanic students entering kindergarten were rated lower than white students by their teachers, regardless of their academic ability. In the ECLS kindergarten survey, teachers were asked to rate the math and literacy readiness and proficiency of each of the students in the sample in math and literacy skills. Each student was also tested in mathematics and reading by a trained ECLS assessor. Reardon and Galindo (2003) conducted a series of multivariate analyses to look for evidence of teacher bias. Given students of equal ability from the same classroom, they estimated the extent to which the teachers rated Hispanic students lower than non-Hispanic whites. Table 6-4 shows, that, in the fall of the kindergarten year, the Hispanic students were rated, on average, more than one-eighth of a standard deviation below the non-Hispanic white students. This rating gap was reduced by one-half to two-thirds by the spring of the kindergarten year and completely disappeared by the spring of first grade.
TABLE 6-4 Average Difference in Standardized Teachers’ Ratings of Hispanic and Non-Hispanic White Students in the Same Classroom, by Subject and Grade
|
Classroom |
Subject |
|
|
Math |
Reading |
|
|
Fall kindergarten |
−0.129*** |
−0.146*** |
|
Spring kindergarten |
−0.084*** |
−0.074* |
|
Spring first grade |
−0.049ns |
−0.006ns |
|
NOTE: ns = not significant. Sample includes all Hispanic and non-Hispanic white students who had both teacher ratings and test scores at each wave. Reading sample includes only students who passed the English Oral Language Development Scale Assessment in the fall of kindergarten. Models include controls for test scores, age, kindergarten repeat status, classroom Hispanic composition, average classroom test scores, and teacher’s ethnicity. *p < .05 ***p < .001 |
||
It appears that some teachers base their initial ratings of students, in part, on the student’s ethnicity. This teacher bias is reduced as teachers come to know students better over time, explaining the substantial initial rating gap and its decline over kindergarten and first grade. Furthermore, it is possible that this bias acts as a self-fulfilling prophecy, so that students’ test scores come to more closely match their teachers’ ratings over time. This could be the result of subtle or overt differences in instructional practices directed toward Hispanic students who are rated lower than their white classmates. Another possible explanation is that the teacher ratings are unbiased measures of some aspect of mathematics and reading skills that is not measured by the tests, but on which non-Hispanic white students rate higher than Hispanic students.11 Whatever the explanation for the closer match between student performance and teacher ratings over time, the initial gap in teacher assessment between white and Hispanic students does point to teacher bias. Such bias at the onset of formal schooling sets the stage for lower expectations and underperformance by Hispanic students.
Persisting Problem
The initial achievement gap between Hispanic and white students persists throughout middle school and high school. Tracing the academic performance of Hispanic students over the past 20 years using trend data from the National Assessment of Educational Progress (NAEP) shows that Hispanic students continue to lag behind non-Hispanic whites (U.S. Department of Education, 2003d). Figure 6-6 indicates that for fourth, eighth, and twelfth graders, differences in average reading scores between Hispanic and non-Hispanic white students are evident, and this pattern is consistent across Hispanic subgroups.
In 2002, Hispanic fourth graders scored close to 30 points lower than their white classmates in reading (see Figure 6-6). Although there have been some fluctuations in the scores of Hispanics and non-Hispanic whites, a 30-point differential after several decades of school reform is clearly problematic. The situation for eighth-grade students closely resembles that for fourth graders. By twelfth grade, Hispanic students have closed the gap somewhat, with Hispanics scoring an average of 18 points lower than whites. However, since Hispanics have a higher dropout rate, these averages are probably inflated because they reflect only the scores of more promising students who have stayed in school through twelfth grade. Compared with black students, Hispanic students are doing slightly better at all three grade levels, although the differences are small. The lower test scores of blacks and Hispanics suggest that low socioeconomic status may play a role in creating this achievement gap.12
When Hispanic reading scores are examined by subgroup, Mexican Americans and Puerto Ricans tend to score the lowest. This is cause for concern, because Mexican American immigrants are the largest and fastest growing minority group among young elementary school students. Assuming there is no immediate and effective intervention strategy to improve their reading skills, it is reasonable to expect that by eighth grade, these students’ levels of achievement will continue to be low, which may contribute to their higher dropout rates.13
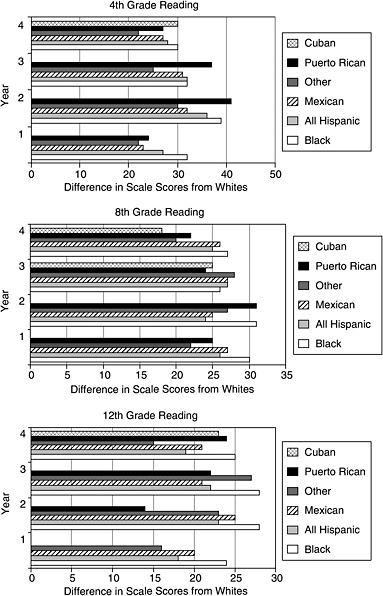
FIGURE 6-6 Differences between white, non-Hispanic, and minority students’ average NAEP reading scale scores, by age: Selected years, 1992–2002.
NOTES: Year 1 = 1992, Year 2 = 1994, Year 3 = 1998, Year 4 = 2002. The scale scores reported are plausible value scores, imputed by random draws from respondents’ scores. Data for fourth- and twelfth-grade Cuban respondents were not available until 2002; data for eighth-grade Cuban respondents were not available until 1998. Data for Puerto Rican twelfth-grade respondents were not available until 1994.
SOURCE: U.S. Department of Education (2003e).
The mathematics achievement gap between Hispanics and non-Hispanic whites is similar to that for reading scores (see Figure 6-7). Across all grades, Hispanic students scored higher than blacks, but lower than whites, in mathematics. For twelfth graders, the gap between Hispanic and non-Hispanic white students is smaller than in earlier grades, most likely because Hispanic students with poor academic records and low test scores tend to leave school before twelfth grade.
In looking at NAEP data over time, it appears that Hispanic children have been making achievement gains, but so have other groups, including whites; thus the achievement gap is not narrowing (Pew Hispanic Center Fact Sheet, 2004b). In the 1990s, even though Hispanic scores in reading and mathematics increased overall, the achievement gap actually increased, suggesting that this gap will widen by the time this cohort of students reaches twelfth grade. Overall, achievement results from kindergarten through twelfth grade show differences in test scores among Hispanic subgroups and across generations. However, not all data sets include sufficient information on generational status or Hispanic subgroups to identify interventions that would be most effective for different groups. Better national longitudinal data must be collected that distinguishes between Hispanic subgroups, English as a second language (ESL) versus non-ESL curricula, and immigrant status. Data should also be collected on the types of students who drop out between eighth and twelfth grade. Nonetheless, even these broad indicators point to the need for immediate academic interventions at the primary and middle school levels.
Elementary and Middle School Contexts
As illustrated by growing gaps in achievement from fourth to eighth grade, school characteristics can play a role in student achievement, especially during middle school, when students form attachments to their teachers and schools.14 Fostering attachment and a sense of belonging is particularly problematic in large school environments. Hispanics are the most likely to be enrolled in large schools with large class sizes, and these schools are also more likely to be underfunded and deficient in resources.15 The
|
|
tifying Hispanics by country of origin is a more recent practice, trend data are unavailable for comparison before 1990. |
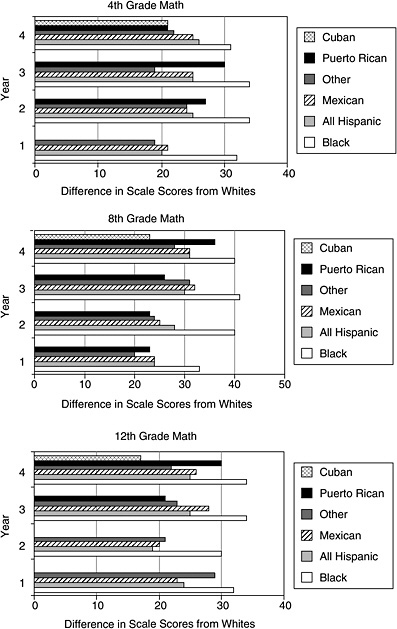
FIGURE 6-7 Differences between white, non-Hispanic, and minority students’ average NAEP mathematics scale scores by age: selected years 1990 to 2000.
NOTES: Year 1=1990, Year 2=1992, Year 3=1996, Year 4=2000. Data for Cuban respondents were not available until 2000. Data for Puerto Rican fourth-grade respondents were not available until 1992; Puerto Rican twelfth-grade respondents were not available until 1996.
SOURCE: U.S. Department of Education (2003e).
majority of Hispanic students at both the elementary and secondary levels attend urban schools that are above average in size (U.S. Department of Education, 1996b). Hispanics comprise one-quarter of the student population in central-city schools (ERIC Clearinghouse on Urban Education, 2001).16 Compared with other groups, Hispanic students disproportionately attend schools with the highest levels of poverty, as measured by the proportion of students who qualify for a free or reduced price lunch, and are enrolled in the most highly segregated schools (Orfield and Yun, 1999). Approximately 75 percent of Hispanic students attend schools with over 50 percent minority student populations, and a little over 35 percent of Hispanic students attend schools with over 90 percent minority student populations (Orfield and Yun, 1999).
Hispanics are also more likely to be in schools with inexperienced or noncertified teachers (U.S. Department of Education, 2003a; Valencia, 2002). Public and private schools with the highest percentages of minority and limited-English proficient students are more likely to employ beginning teachers than schools with lower percentages of minority limited-English proficient students, thus virtually ensuring that a high proportion of Hispanic youth, who most need experienced teachers, are taught by less-qualified instructors. Furthermore, these schools often have too few bilingual teachers certified in ESL (Hacsi, 2002; U.S. Department of Education, 1996b). The quality of bilingual programs also varies across schools and districts and may in some instances interfere with, rather than enhance, students’ ability to master both Spanish and English.
Finally, many urban schools have very few Hispanic teachers compared with the number of Hispanic students they instruct: only 4 percent of public school teachers are Hispanic, whereas Hispanic students at the elementary school level constitute about 15 percent of the student body nationally (U.S. Department of Education, 1997). This sometimes makes it difficult for Hispanic students to identify with teachers and view them as role models. By sharing a cultural identity with their teachers, Hispanic students might benefit by seeing someone from their own cultural background succeed. Having a teacher who is sensitive to cultural differences may also help
|
|
school: 68 percent of Hispanics report using a computer at school compared with 70 percent of blacks and 84 percent of whites. In addition, only 18 percent of Hispanics and 19 percent of blacks report using a computer at home compared with 52 percent of whites (ERIC Clearinghouse on Urban Education, 2001). One of the reasons that the computer disadvantage is so important is that the most recent advanced placement tests are being given on the computer. It is expected that most college admission tests will also be administered by computer. |
students feel more engaged and less alienated (Graham, 1987; Valencia and Aburto, 1991). Therefore, it is important for schools serving Hispanic students to recruit more Hispanic principals and teachers to act as role models. Some strategies for recruiting minority students into the teaching profession have been recommended, for example, a forgiveness loan program in which minority students who pursue teaching need not repay student loans, credentialing of experienced minority teacher aides, and early identification and recruitment of minority students (Valencia and Aburto, 1991).
Teacher–Student Interactions
One of the most important findings of the 1980s was the recognition of the significance of the middle school experience and its lasting effects on students’ schooling careers (Carnegie Council on Adolescent Development, 1989). The experiences Hispanics have in middle school often follow them through high school, creating obstacles for future schooling success. Specifically, it appears that teacher interactions and the less than optimal school contexts that Hispanic students encounter in middle school contribute to their academic and social difficulties in later years.
Finn (1989) claims that school success depends on students’ sense of a close connection with their schools. Students who identify with their schools have an internalized sense of belonging; that is, they feel they are a part of the school community and that school constitutes an important aspect of their own experience. Students who feel this way are more likely to value and pursue academic or school-relevant goals and thus are more likely to participate in the classroom (Finn, 1989). In studying student–teacher relationships, Payne (1994) and Valenzuela (1999) have found that negative attitudes or teacher stereotypes of minority students may weaken bonds necessary for learning. These findings indicate that success in the classroom depends on students’ ability to accept their teacher as a credible source of information. Students have to believe that the teacher respects and cares about their well-being. When this bond is not established or fully developed, students resist teachers both personally and academically, become detached from school, and consequently are less likely to succeed in school. The ability to form these types of bonds with minority students is particularly difficult for white middle-class teachers working in urban schools (Buriel, 1983; Katz, 1999; Rosenbloom and Way, 2004). Payne (1994) found that when these teachers avoid or reject negative attitudes and stereotypes, they are able to offer minority students the respect and high expectations that facilitate academic success. Prior research indicates that when minority students are aware of negative stereotypes regarding their academic ability, “stereotype threat” is activated. This heightened awareness of negative stereotypes may cause Hispanics to underperform, particularly
on aptitude or cognitive ability tests, and score lower than white students (McKown and Weinstein, 2003; Steele and Aronson, 1995).
Teachers and administrators who lack an understanding of cultural differences can also hinder the academic success of Hispanics by misassigning bilingual students to remedial programs. This inaccurate assessment of student abilities has more recently been found even among kindergarten students, whose teachers tend to underestimate the literacy skills among Hispanic kindergarteners (Reardon and Galindo, 2003). When teachers or administrators use lack of English proficiency to signal special needs, language-minority students are overrepresented in special education classes, in which academic performance is underemphasized in favor of social adjustment (Schmid, 2001).
Bryk and Schneider (2002) found that many teachers, particularly those working in urban schools, do not know their students well and lack an empathetic understanding of their situations or the interpersonal skills to engage them—conditions that are necessary for a trusting relationship to evolve and be sustained. Martinez (2003) found that Mexican Americans more than other students feel better when they are not with their teachers. Data from 625 students who participated in the Alfred P. Sloan Study of Youth and Social Development, a longitudinal study of how young people form ideas about postsecondary school and work, show that when Mexican American students are not with their teachers, they are happier and more excited, feel better about themselves, and believe that they are living up to their own expectations (Csikszentmihalyi and Schneider, 2000). In addition, when in the company of a teacher, Mexican American students also are more likely to believe that teachers have more unfavorable thoughts about them than about other racial/ethnic groups. In contrast, when white students are with their teachers, they report feeling that they are meeting their own expectations, are relaxed and challenged, and indicate that what they are doing is important to their future goals. Like Mexican American students, black students feel happier and more relaxed when not with their teachers. Black students, however, experience higher levels of challenge when they are with teachers, much like white students.
Weak relational ties between Hispanic students and their teachers may diminish motivation or engagement in academic work, which in turn can undermine academic achievement. When weak relational ties exist between students and teachers, students may feel that teachers have low expectations of them or do not care about them, which can be highly discouraging and cause Hispanic students to disengage from classroom activities or ultimately withdraw. When disengaged in the classroom, Hispanic students are less likely to see the relevance of what is being taught to their future schooling or careers. It seems particularly important for Hispanic students to have teachers who have high expectations for their academic performance,
strengthen personal ties between themselves and their students, and point out the relevance of schoolwork to future opportunities in both school and the labor market.
Transitioning into High School
Moving from middle school to high school is a challenging and uncertain process for many students, even under optimal circumstances (Schiller, 1995). This transition is especially problematic for Hispanics and blacks living in urban areas. These students are more likely than Asians and whites to be uncertain about what high school they will attend and seem to have the most difficulty adjusting to a new school. Based on these findings, Schiller (1995) concludes that Hispanics and blacks require assistance in making the transition from middle school to high school. Not only do they require social and psychological support, but they especially need early guidance about the consequences of taking specific courses for postsecondary school options.
One school organizational factor that is strongly related to academic performance is curricular differentiation, that is, how students are sorted into different ability groups and courses (Hallinan, 1994; Smith, 1995; Stevenson, Schiller, and Schneider, 1994). The course selection process, especially in the eighth grade, affects standardized test scores and college attendance and completion (Schneider and Stevenson, 1999; Stevenson et al., 1994). For example, unlike English and social studies, the mathematics curriculum becomes sharply differentiated beginning in middle school (Usiskin, 1987). Students given instruction in algebra rather than general mathematics in eighth grade are at an advantage as they can take more advanced courses in high school and move through the high school mathematics curriculum more quickly. Smith (1995) also finds that students who took algebra in eighth grade had higher mathematics achievement scores and expressed higher educational aspirations in the tenth grade. That Hispanic students are less likely than Asians, whites, and blacks to take algebra in the eighth grade greatly limits their future curricular options (U.S. Department of Education, 1990).
Before eighth graders enter high school, they are given the opportunity to select a specific curricular program from several different options, commonly labeled college preparatory, general or comprehensive, and vocational. These programmatic choices are not benign with respect to students’ schooling careers and academic achievement. Data from High School and Beyond and the National Education Longitudinal Study of 1988–2000 (NELS: 88-2000) have linked high school curricular placement to achievement, educational expectations, and occupational aspirations (Gamoran and Mare, 1989; Oakes, Gamoran, and Page, 1992; Schneider and
Stevenson, 1999). By spring of eighth grade, only 23 percent of Hispanic students plan to enroll in a college preparatory curriculum, compared with 25 percent of blacks, 31 percent of whites, and 37 percent of Asian Americans (U.S. Department of Education, 1990). However, Hispanics also comprise 29 percent of eighth graders who are unsure about their high school curriculum program.
Part of the uncertainty Hispanic students and their parents feel about educational practices can be traced to parents’ limited experiences with the U.S. education system and the trust they place in the authority and knowledge of teachers. Mexican American immigrant parents are particularly vulnerable and more likely to defer to teachers and administrators, rarely questioning their decisions (Bryk and Schneider, 2002). Curricular counseling for college, especially for recent immigrants who may be unfamiliar with the complexities of the U.S. education system, must begin before high school. For this reason, providing Hispanic eighth graders early and more detailed information about which curricular programs lead to college admission would greatly assist many students in making choices that promote higher levels of educational attainment.
High School Course Selection
Schools play a critical role in influencing what courses students will take by deciding what courses will be offered, establishing procedures for admission to particular courses, and creating a climate whereby teachers and counselors are encouraged to adopt a selective or universal approach to student counseling and academic planning. Taking specific course sequences has certain educational advantages. For example, students who successfully complete courses in algebra, geometry, and trigonometry are much more likely to take the next advanced level of mathematics than their classmates who take other course sequences. In certain subjects, such as mathematics, students are typically not allowed to take advanced courses out of sequence. This makes it difficult for students to take a high-level course if they lack the necessary prerequisites. Courses taken in high school better predict who attends college than family background, school characteristics, or educational expectations. Course selection decisions are in turn more influenced by student academic ability and prior achievement than by family background characteristics, such as parents’ educational attainment (Stevenson et al., 1994).
Hispanic students are less likely than white students to complete advanced mathematics; they are also less likely than both white and black students to take certain advanced science courses. Table 6-5 shows that Hispanics are about 20 percent less likely than whites to take advanced course work in mathematics. The low numbers of Hispanics taking ad-
TABLE 6-5 Percentage Distribution of High School Graduates, by Highest Levels of Mathematics Courses Completed and Race/Ethnicity, 1998
|
Race/Ethnicity |
No Mathematicsa |
Nonacademicb |
Low Academicc |
Middle Academicd |
Advanced Academice |
|
Total |
0.8 |
3.6 |
5.3 |
48.9 |
41.4 |
|
White, non-Hispanic |
0.8 |
3.2 |
4.6 |
46.3 |
45.1 |
|
Black, non-Hispanic |
0.9 |
3.6 |
8.3 |
56.8 |
30.4 |
|
Hispanic |
0.9 |
6.3 |
7.5 |
59.1 |
26.2 |
|
Asian/Pacific Islander |
0.2 |
2.8 |
2.6 |
38.8 |
55.5 |
|
American Indian/Alaska native |
0.7 |
8.6 |
6.3 |
57.4 |
26.9 |
|
NOTE: Students classified at any particular level need not have taken courses at a lower level and may have taken more than one course at that level. For more detailed descriptions of these categories, please see supplement note 5 in the Condition of Educ ation (2002). Detail may not add to 100.0 due to rounding. aStudents in this category may have taken some mathematics courses, but these courses are not defined as mathematics courses according to the classification used in this analysis. bStudents who took general mathematics or basic skills mathematics courses. cStudents who took algebra taught over the course of 2 years, prealgebra, or informal geometry. dStudents who took algebra I or unified mathematics I and took 3 full-year courses of mathematics (e.g., algebra I, algebra II, and geometry). eStudents who took precalculus, calculus, or other courses labeled as “advanced” such as trigonometry. SOURCE: U.S. Department of Education (2002c). |
|||||
vanced mathematics courses are of serious concern because advanced mathematics course-taking, more than any other subject, appears to have the strongest relationship to whether a student matriculates to a two-year or a four-year college (Riegle-Crumb, 2003).
Several subjects, including mathematics, are often offered as advanced placement (AP) courses. Students who enroll in AP classes may elect to take an examination in that subject, and if they score above a designated threshold, can earn college credit for that course. Minority students, with the exception of Asian Americans, are less likely than white students to take AP examinations (see Table 6-6). While the proportion of Hispanic test takers increased after 1997, only 9 percent of AP test takers in 2002 were Hispanic, half of whom were Mexican American (see Table 6-6). The increase among Hispanic twelfth graders taking AP exams appears to be driven mainly by the population growth of Hispanics, especially Mexican Americans, in the United States who are now staying in high school through twelfth grade. In 1997, 10 percent of all twelfth graders were Hispanic; by 2001, 12 percent of the twelfth-grade population was Hispanic (Common Core of Data, the Department of Education’s database on public elementary and secondary U.S. schools, which contains basic information and descriptive statistics on schools, school districts, students, staff, and fiscal data).
Perhaps one of the most significant indicators of preparedness for college is one’s score on college entrance examinations such as the ACT and
TABLE 6-6 Proportion of Twelfth-Grade Students Who Took Advanced Placement Examinations by Race/Ethnicity, 1997, 2001, 2002
|
Ethnic Group |
1997 (%) |
2001 (%) |
2002 (%) |
|
Not stated |
6.4 |
2.2 |
2.3 |
|
American Indian/Alaskan native |
0.5 |
0.4 |
0.4 |
|
Asian/Asian American |
10.6 |
10.9 |
10.9 |
|
Black/African American |
4.6 |
5.2 |
5.2 |
|
Hispanic/Latino |
7.6 |
9.2 |
9.4 |
|
Chicano/Mexican American |
3.6 |
4.7 |
4.8 |
|
Puerto Rican |
0.7 |
0.7 |
0.7 |
|
Other Hispanic/Latino |
3.2 |
3.8 |
3.9 |
|
White |
67.7 |
68.7 |
68.6 |
|
Other |
2.6 |
3.3 |
3.1 |
|
Total students |
301,047 |
407,572 |
440,916 |
|
SOURCE: College Board (2004). |
|||
SAT, which measure students’ verbal, mathematical, and analytic skills. Over the past decade the number of minority students taking the SAT has risen dramatically. Hispanics accounted for 9 percent of the SAT-taking population in 2001 (U.S. Department of Education, 2003d, p. 62; see Table 6-7); however, they constituted 14 percent of the U.S. high school population enrolled as juniors or seniors (U.S. Census Bureau, 2001b).
With respect to SAT performance, Hispanics, although scoring higher than blacks, continue to lag behind whites and Asians on the SAT in both the math and verbal components of the exam (see Figure 6-8). Low test scores coupled with fewer college preparatory courses decrease the chance that Hispanics will be accepted into highly selective colleges.
Hispanic students are the least likely group to take college entrance examinations and to apply to college (Fry, 2004). To further explore the relationship between race/ethnicity and academic preparation, particularly among Hispanics, a series of analyses predicting the likelihood of taking advanced course sequences and college admission tests was conducted with data from the second follow-up of NELS: 88-2000. Figure 6-9 shows the probabilities that a student will take an advanced math course (e.g., trigonometry or above), an advanced science course (e.g., physics, advanced biology, or chemistry), or the SAT by the end of high school. These prob-
TABLE 6-7 Percentage Distribution of Students Who Took the Scholastic Assessment Test (SAT), by Race/Ethnicity, 1991 and 2001
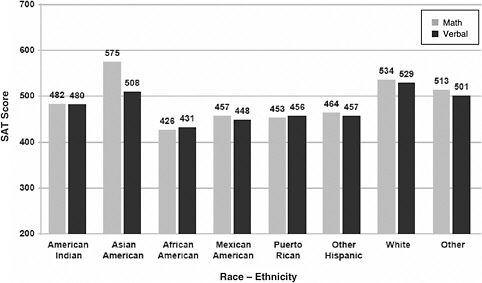
FIGURE 6-8 Average scholastic assessment test (SAT) scores (verbal and math) for college-bound seniors, by race/ethnicity, 2003.
SOURCE: College Board (2003).
abilities are estimated taking into account racial/ethnic background and language spoken in the home. When background characteristics are not accounted for, there are pronounced differences between groups with respect to academic preparation, with Hispanics among the least likely to be engaged in college preparatory activities.17 Once background characteristics are taken into account, Hispanics who are bilingual are more likely than whites to take advanced courses and the SAT (see Figure 6-9). Bilingual students have the advantage of having parents who are proficient in both English and Spanish and who are thus able to bridge cultural and language barriers to secure educational opportunities for their children (see Kim and Schneider, 2004).
The next set of analyses shows the probability of attending a four-year
|
17 |
Appendix Figure A6-1 shows the individual effects of family and student characteristics on the likelihood of taking advanced math and science courses and taking the SAT. The gap between whites and Hispanics for whom English is not spoken in the home is largest in Model 3, in which having a traditional mother–father family is taken into account. The most equalizing variable is prior academic achievement, as measured by eighth-grade math and reading scores (see Model 8). This finding suggests that Hispanics who do well academically early in their schooling careers are more likely to succeed in high school and to prepare for college. |
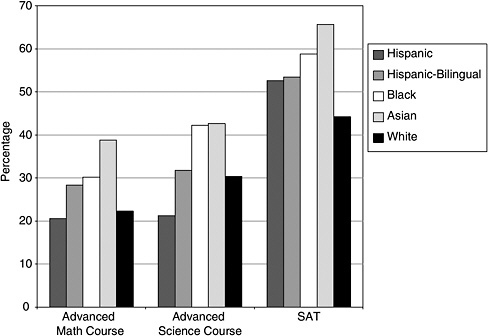
FIGURE 6-9 Probability of taking advanced math courses, advanced science courses, and the SAT by the end of high school by race/ethnicity, controlling for various family and student characteristics.
NOTES: Probabilities are based on equations from logistic regression models. The imputation program AMELIA was used for missing values. Figure is based on models in which all family and student characteristics are included as controlled (see Appendix Figure A6-1 for list of control variables).
SOURCE: U.S. Department of Education, National Center for Education Statistics, National Education Longitudinal Study of 1988–2000 (NELS: 88-2000), Second Follow-Up, 1992, restricted-use data (with imputed values).
college for all racial/ethnic groups, taking into account academic course preparation and having taken the SAT. Figure 6-10 shows that the probability of matriculating to a four-year college is higher among students who have taken the SAT and advanced coursework in mathematics and science compared with those who are not so prepared. The second panel predicts the probability of attending a four-year versus a two-year college by academic preparation and race/ethnicity. The likelihood that Hispanics and whites will attend a four-year college increases by about 30 percentage points when academic preparation is taken into account. Hispanics from Spanish-speaking families are nearly as likely as blacks to attend four-year colleges when they have high levels of academic preparation. Highly pre-
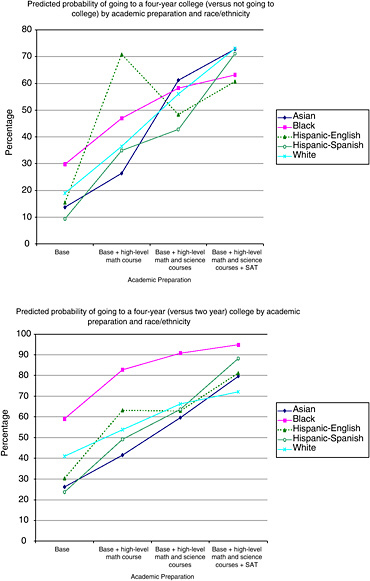
FIGURE 6-10 Predicted probabilities (in percentages) of going to a four-year college versus a two-year college or not going to college by academic preparation (advanced math course, advanced science course, and taking the SAT) and race/ethnicity.
NOTES: Probabilities are based on logistic regression models. The imputation program AMELIA was used for missing values. All models include control variables listed in Appendix Figure A6-1. Additionally, the interactions of each race/ethnic group and course sequences have been included as controls.
SOURCE: U.S. Department of Education, National Center for Education Statistics, National Education Longitudinal Study of 1988–2000 (NELS: 88-2000), Second Follow-up 1992, restricted-use data (with imputed data).
pared Hispanics are even more likely than comparable whites to attend a four-year versus a two-year college. These analyses suggest that one reason why Hispanics are more likely to matriculate to two-year rather than four-year colleges is poor academic preparation. Therefore, for Hispanics, especially those who are first-generation college-goers, it is imperative that schools offer programs explaining the importance of college preparatory curricula, SAT preparation, and advanced course-taking.
High School Noncompleters
Despite high educational expectations, Hispanics have the highest high school dropout rate (28 percent in 2000) compared with blacks and whites (U.S. Department of Education, 2000b). While the percentage of 16- to 24-year-old Hispanics without a high school diploma has decreased over the past 30 years, the status dropout rate of Hispanics is still more than double the rate of both whites and blacks (see Figure 6-11).18
However, this status dropout rate is inflated by recent increases in teenage Hispanic immigrants who never enroll in U.S. schools (Fry, 2003). Hirschman (2001) estimates that almost half of Mexican 15- to 17-year-olds who arrived in the United States between 1987 and 1990 did not enroll in school. These numbers are considerable, especially when compared with the dropout rates of Mexican Americans born in the United States. In 2001, 43.1 percent of foreign-born Hispanics did not complete high school compared with only 15 percent of U.S.-born Hispanic students (U.S. Department of Education, 2004a).
Figure 6-12 displays the differences between the dropout rates of foreign- and U.S.-born Hispanics. Rates for foreign-born Hispanics are double those of their U.S.-born counterparts, with the exception of South Americans. The dropout rate among U.S.-born Hispanics decreased from 1990 to 2000; however, the dropout rate among this group (14 percent) is still higher than that of blacks or whites (12 and 8 percent, respectively; Fry, 2003). One positive finding is that immigrant children who do enroll in high school are not more likely to drop out than U.S.-born students (Pew Hispanic Center Fact Sheet, 2004a).
Some students may temporarily “stop out” of high school and later return to receive their degree through alternative programs or by earning
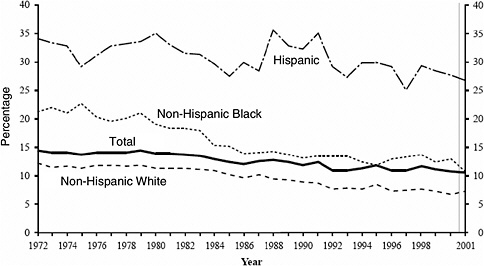
FIGURE 6-11 Status dropout rates of 16- through 24-year-olds, by race/ethnicity: October 1972 through October 2001.
NOTES: Due to small sample size, American Indians/Alaska natives and Asians/Pacific Islanders are included in the totals but are not shown separately. In addition, the erratic nature of the Hispanic status rates reflects, in part, the small sample size of Hispanics in the Current Population Survey. Numbers for years 1987 through 2001 reflect new editing procedures instituted by the U.S. Census Bureau for cases with missing data on school enrollment items. Numbers for years 1992 through 2001 reflect new wording of the educational attainment item in the Current Population Survey beginning in 1992. Numbers for years 1994 through 2001 reflect changes in the Current Population Survey due to newly instituted computer-assisted interviewing and the change in population controls used in the 1990 Census-based estimates, with adjustment for understanding in the 1990 Census. See Appendix C of the source document for a fuller description of the impact of these changes on reported rates.
SOURCE: U.S. Department of Commerce, Census Bureau, Current Population Survey, October 1972–2001.
general educational development (GED) certification. In 2001, the national high school completion rate for Hispanics was 64 percent, compared with 92 percent for whites. Such low completion rates are typical of urban schools that serve large numbers of minority students, many of whom come from low-income families (U.S. Department of Education, 2004b).19 His-
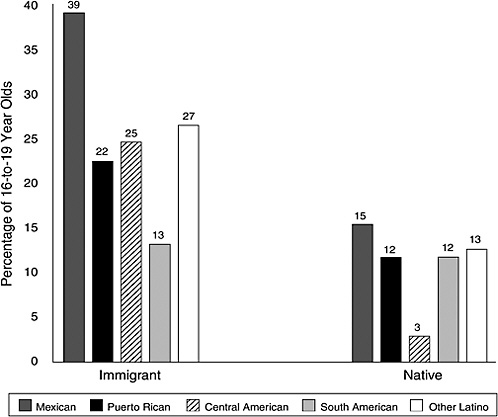
FIGURE 6-12 Dropout rates according to Hispanic subgroups by immigrant and U.S.-born status.
SOURCE: Census 2000 Supplementary Survey.
panic students remain concentrated in large urban school systems, such as Los Angeles, Chicago, and New York, where overall graduation rates are less than 60 percent. Overall, almost 40 percent of Hispanic students attend high schools in which the graduation rate is less than 60 percent (Balfanz and Letgers, 2004). Educators and policy makers remain acutely aware of the difficulties facing Hispanic students, and a variety of retention programs have been instituted in high schools with large numbers of non-completers. The most effective intervention programs for high school completion are those that link graduation to college matriculation by including college-based or college-level courses or programs, after-school academic preparation, SAT test preparation, and tutoring. While there is a documented relationship between these programs and academic success,
most have not been thoroughly evaluated and have been criticized for not accounting for selection bias—that is, the most talented students are those most likely to seek out these programs. Evidence suggests a causal relationship between program participation and college matriculation; however, systematic evaluations including clinical randomized trials pertaining to these interventions are limited (U.S. Department of Education, 2001b). These types of scientifically rigorous evaluations need to be designed and conducted.20
Pathways After High School
Although the high school completion rates of Hispanic students have risen over the past decade, their job prospects remain weak because the standard requirement for stable employment in many fields is a baccalaureate degree.21 Many Hispanic students will enter the labor force immediately after high school, a pathway that economists have estimated will eventually lead to unstable employment and low wages (Levy, 1995). Some Hispanics will also enter the military, a pathway that few high school graduates are taking. It appears that Hispanic entry into the military has increased significantly; Hispanics constituted just 4 percent of military personnel in 1985, but that number rose to 11 percent in 1999 (U.S. Department of Defense, 2000). However, data are not available as to whether Hispanics are taking advantage of the educational benefits offered to military personnel.
Even though a large percentage of Hispanics choose to work after high school, over half of Hispanic high school seniors plan to attend a four-year college. College expectations of Hispanic students doubled from 24 percent in 1972 to 50 percent in 1992; actual college enrollment for Hispanics has increased, as it has for other racial/ethnic groups (U.S. Department of Education, 1995b). In 1972, over 14 percent of Hispanic high school graduates matriculated to four-year colleges (Olivas, 1979); by 2000, 36 percent of Hispanic graduates were enrolled in four-year colleges (U.S. Department of Education, 2003d). Although the number of high school graduates attending college has risen, Hispanics constitute a disproportionately small portion of those attending four-year colleges: 12.5 percent of the U.S. population in 2000 identified themselves as Hispanic, and only 7 percent of
four-year college students were Hispanic (U.S. Census Bureau, 2002b; U.S. Department of Education, 2003b). The burgeoning number of first-generation Mexican Americans may account in part for the low rates of college attendance among Hispanics. First-generation immigrant parents may be unfamiliar with the complex policies and practices of the U.S. education system, which require a high level of parent knowledge and involvement, particularly with respect to academic preparation for college.
However, the enrollment rates for Hispanics are misleading, since they are more likely to enroll in two-year rather than four-year institutions, especially first-generation college-goers. In 2000, Hispanics accounted for 14 percent of students enrolled in two-year colleges and only 7 percent of those enrolled in four-year institutions (see Table 6-8).
One of the primary missions of the two-year community college is to provide low-cost local access to postsecondary education. Many students choose to attend two-year colleges because of financial limitations or inadequate preparation and with the intention of transferring to a four-year college. However, the majority of high school graduates who begin their postsecondary education at a two-year institution do not transfer to a four-year institution (Rendon and Garza, 1996; Schneider and Stevenson, 1999). This problem is not unique to Hispanics; for example, only 36 percent of white students who attend community college transfer to four-year colleges or complete a bachelor’s degree. However, the transfer or completion rates for Hispanic students at two-year colleges are even lower; only 25 percent
TABLE 6-8 Percentage Distribution of Enrollment in Two-Year Versus Four-Year Colleges, by Race
will go on to a four-year institution or eventually complete a bachelors degree (Fry, 2004). Schneider and Stevenson (1999) refer to this discrepancy as an ambition paradox—students with high ambitions choosing an educational route with low odds of success. Given the low transfer rates and length of time young adults spend in community college without receiving a degree, transition programs are needed to assist Hispanic students considering transferring to four-year institutions. These types of programs may also be subject to selection bias, in that students who seek out assistance may be more motivated to transfer regardless of the presence of extra help. Key features of these programs, including academic counseling and guidance about the transfer process and requirements, have been shown to help students who are unsure about the college process and may be one strategy for increasing Hispanic students’ access to information (Schneider and Stevenson, 1999).
Compared with white students with similar abilities and levels of preparation, fewer Hispanic students enter highly selective colleges, attending less rigorous postsecondary institutions instead (Fry, 2004). Even more problematic, Hispanics have the lowest degree completion rate of any racial group four years after high school (U.S. Department of Education, 2003c). In the 1999–2000 academic year, Hispanics earned only 9 percent of all associate degrees, 6 percent of bachelor’s degrees, 4 percent of master’s degrees, 3 percent of doctoral degrees, and 5 percent of professional degrees (see Table 6-9). Overall, Hispanics tend to earn relatively more associate degrees and fewer advanced degrees than Asians, blacks, or whites.
As Hispanic enrollment in postsecondary institutions increases, Hispanic-serving institutions (HSIs) play an important role in providing Hispanics with access to college education. HSIs are public or private degree-granting institutions in which Hispanics comprise 25 percent or more of the undergraduate full-time-equivalent enrollment. According to the U.S. Department of Education (2004), at least 50 percent of Hispanic students who are enrolled in these institutions have low family income. There are approximately 242 HSIs located in 14 different states and Puerto Rico (U.S. Department of Education, 2004b). Nearly 46 percent of all HSIs are located in Texas and California. About half of the HSIs are four-year institutions. In 1999, nearly one-half of the total Hispanic undergraduate enrollment in colleges and universities was in HSIs (U.S. Department of Education 2003d, p. 96). Much like historically black colleges and universities, HSIs also enroll a considerable population of first-generation college-goers. There are limited evaluations of the effectiveness of HSIs in terms of their matriculation rates, graduation rates, and job placement. Further research should be conducted to understand how successful these institutions are in serving Hispanic college students.
TABLE 6-9 Percentage Distribution of Degrees Conferred by Colleges and Universities, by Race/Ethnicity and Degree Level, 1999–2000
TAKING THE NEXT STEPS
Factors that are most predictive of educational success among Hispanic students vary across stages in the schooling process. Before Hispanic students begin formalized schooling, family resources are critically important. The confluence of limited English proficiency, low educational attainment, and other economic resources hinder many Hispanic parents from engaging their children in early literacy activities that have been shown to be important for later academic success. Once enrolled in schools, the academic performance of Hispanic students compared with whites is alarmingly low. Moreover, low achievement scores are found as early as kindergarten and continue through middle school. The lowest scores are found among Mexican Americans who are recent immigrants or who live in segregated and disadvantaged communities. Teacher stereotyping and low expectations for Hispanic students are also associated with the achievement gap between Hispanic students and other groups. This teacher bias contributes to Hispanic students’ disengagement in academic classes and their failure to form strong attachments to schools and teachers. This particular pattern of disengagement appears to be unique to Hispanic students, resulting in a failure to see the importance of schoolwork to their futures.
Many Hispanic students preparing to enter high school are uncertain about what programs or courses to take and are less likely to have taken courses, such as algebra, that would prepare them for advanced high school
|
Hispanic |
Asian/Pacific Islander |
American Indian/Alaska Native |
Nonresident Alien |
|
9.1 |
4.9 |
1.1 |
1.8 |
|
6.1 |
6.3 |
0.7 |
3.3 |
|
4.2 |
5.0 |
0.5 |
13.0 |
|
2.9 |
5.3 |
0.4 |
25.1 |
|
4.8 |
10.7 |
0.7 |
2.4 |
course sequences. The importance of high school academic preparation—in the form of high-level course sequences and college entrance exams—is crucial in predicting postsecondary enrollment in four-year versus two-year colleges. Hispanic students are among the least likely to take high-level math and science course sequences or to enroll in four-year colleges. However, Hispanic students who are academically prepared when they enter high school are more likely to stay in school, to succeed academically, and to matriculate to four-year colleges. Among those attending college, however, Hispanic students tend to enroll in two-year versus four-year institutions. Research has shown that students who enroll in a two-year college with the expectation of transferring to a four-year college are unlikely to do so. Perhaps most troubling is the fact that Hispanic students have the lowest college completion rates of any other racial/ethnic group—even after surmounting the obstacles on the path to college, further barriers, such as low financial resources and inadequate career guidance, remain.
It is critical that academic interventions for Hispanic youth become a national priority. Implementation and evaluation of these interventions must be sensitive to generational status and differences among Hispanic subgroups. Because of the inconsistencies across data sets and the frequent omission of such important factors as generational status, ethnic subgroup, and language proficiency, causal conclusions and specific policy recommendations are not possible at this time or in the scope of this chapter. How-
ever, the current data indicate that at every level of education, Hispanic families would benefit from and are especially in need of strategies for helping their children achieve academic success. These strategies are not hidden; many socially and economically advantaged families and schools effectively help children make successful transitions into postsecondary school and the labor force. The problem, then, is not one of what is unknown, but rather how to take what is known and make it accessible to Hispanic families and their communities.
REFERENCES
Balfanz, R., and Letgers, N. (2004). Locating the dropout crisis. Baltimore, MD: Johns Hopkins University.
Barnett, W.S. (1998). Long-term effects on cognitive development and school success. In W.S. Barnett and S.S. Boocock (Eds.), Early care and education for children in poverty: Promises, programs, and long-term results (pp. 11–44). Albany: State University of New York Press.
Barnett, W.S., and Camilli, G. (2002). Compensatory preschool education, cognitive development, and race. In J.M. Fish (Ed.), Race and intelligence: Separating science from myth (pp. 369–406). Mahwah, NJ: Erlbaum.
Bianchi, S., and McArthur, E. (1993). Characteristics of children who are “behind” in school. Paper presented at the Annual Meeting of the American Statistical Association, San Francisco, CA.
Bryk, A.S., and Schneider, B. (2002). Trust in schools: A core resource for improvement. New York: Russell Sage Foundation.
Buriel, R. (1983). Teacher student interactions and their relationship to student achievement: A comparison of Mexican American and Anglo-American children. Journal of Educational Psychology, 75, 889–897.
Carnegie Council on Adolescent Development. (1989). Turning points: Preparing American youth for the 21st century. New York: Carnegie Corporation of New York.
Carnoy, M. (2000). Sustaining the new economy: Work, family, and community in the information age. Cambridge, MA: Harvard University Press.
College Board. (2002). How have college-bound students changed in 10 years (News 2000–2001, Table 1). New York: College Entrance Examination Board.
College Board. (2003). College-bound seniors 2003: A Profile or SAT Program Test Takers. New York: Author. Available: http://www.collegeboard.com/about/news_info/cbsenior/yr2003/html/2003reports.html [accessed May 6, 2005].
College Board. (2004). Advanced Placement Program national summary reports, 1997, 2001, 2002. New York: Author.
Csikszentmihalyi, M., and Schneider, B. (2000). Becoming adult: How teenagers prepare for the world of work. New York: Basic Books.
Currie, J., and Thomas, D. (1996). Does Head Start help Hispanic children? (Working Paper.) Cambridge, MA: National Bureau of Economic Research.
Elkind, D. (1981). The hurried child: Growing up too fast too soon. Reading, MA: Addison-Wesley.
ERIC Clearinghouse on Urban Education. (2001, February). Latinos in school: Some facts and findings. ERIC Online Digest, 162. Available : http://www.ericfacility.net/databases/ERIC_Digests/ed449288.html [accessed July 16, 2004].
Finn, D.J. (1989). Withdrawing from school. Review of Educational Research, 59(2), 117–142.
Fry, R. (2003). Hispanic youth dropping out of U.S. schools: Measuring the challenge. Washington, DC: Pew Hispanic Center.
Fry, R. (2004). Improving young Hispanic college graduation rates: Beyond preparation and affirmative action. Washington, DC: Pew Hispanic Center.
Gamoran, A., and Mare, R.D. (1989). Secondary school tracking and educational inequality: Compensation, reinforcement, or neutrality? American Journal of Sociology, 94, 1146–1183.
Graham, P.A. (1987). Black teachers: A drastically scarce resource. Phi Delta Kappan, 68, 598–605.
Hacsi, T. (2002). Children as pawns: The politics of educational reform. Cambridge, MA: Harvard University Press.
Hallinan, M. (1994). Tracking: From theory to practice. Sociology of Education, 67, 79–84.
Head Start Bureau Fact Sheets. (2004). Available: http://www.acf.hhs.gov/programs/hsb/research/factsheets [accessed July 21, 2004].
Hirschman, C. (2001). The educational enrollment of immigrant youth: A test of the segmented-assimilation hypothesis. Demography, 3, 317–336.
Hispanic Dropout Project Databook. (1998). Available: http://bingaman.senate.gov/databook. pdf [accessed March 15, 2004].
Huerta-Macias, A. (2003). Meeting the challenge of adult education: A bilingual approach to literacy and career development. Journal of Adolescent and Adult Literacy, 47(3), 218–226.
Jimenez, R., Garcia, G., and Pearson, P. (1996). The reading strategies of bilingual Latina/o students who are successful English readers: Opportunities and obstacles. Reading Research Quarterly, 31(1), 90–112.
Kao, G. (1999). Psychological well-being and educational achievement among immigrant youth. In National Research Council, Children of immigrants: Health, adjustment, and public assistance (pp. 410–477). Committee on the Health and Adjustment of Immigrant Children and Families, D.J. Hernandez (Ed.). Washington, DC: National Academy Press.
Katz, S.R. (1999). Teaching in tensions: Latino immigrant youth, their teachers, and the structures of schooling. Teachers College Record, 100, 809–840.
Kim, D., and Schneider, B. (Forthcoming). Social capital in action: Alignment of parental support in adolescents’ transition to postsecondary education. Social Forces.
Levy, P. (1995). Puerto Rico. New York: M. Cavendish.
Loeb, S., Fuller, B., Kagan, S., and Carrol, B. (2004). Child care in poor communities: Early learning effects of type, quality, and stability. Child Development, 75(1), 47–65.
Martinez, S. (2003). Explaining patterns of disengagement of Mexican Americans in high school. Unpublished Ph.D. dissertation, University of Chicago.
McDonald, D. (2003). Annual report on Catholic elementary and secondary schools: United States Catholic elementary and secondary school statistics 2002–2003. Washington, DC: The National Catholic Educational Association.
McKown, C., and Weinstein, R. (2003). The development and consequences of stereotype consciousness in middle childhood. Child Development, 74(2), 498–515.
McLanahan, S.S., and Sandefur, G. (1994). Growing up with a single parent: What hurts, what helps? Cambridge, MA: Harvard University Press.
National Research Council. (1998). Preventing reading difficulties in young children. Committee on the Prevention of Reading Difficulties of Young Children, C.E. Snow, M.S. Burns, and P. Griffin (Eds.). Washington, DC: National Academy Press.
Nuñez, A., Cuccaro-Alamin, S., and Carroll, C.D. (1998). First-generation students: Undergraduates whose parents never enrolled in postsecondary education. Washington, DC: U.S. Department of Education, Office of Education Research and Improvement.
Oakes, J., Gamoran, A., and Page, R.N. (1992). Curriculum differentiation: Opportunities, outcomes, and meanings. In P.W. Jackson (Ed.), Handbook of research on curriculum: A project of the American educational research association (pp. 570–608). New York: Macmillan.
Olivas, M.A. (1979). The dilemma of access: Minorities in two year colleges. Washington, DC: Howard University Press.
Olsen, D.A. (1999). Universal preschool is no golden ticket. (Policy Analysis Brief No. 333.) Washington, DC: Cato Institute. Available: http://www.cato.org/pubs/pas/pa-333es.html [accessed September 2, 2004].
Orfield, G., and Yun, J.T. (1999). Resegregation in American schools. Cambridge, MA: Harvard University, the Civil Rights Project. Available: http://www.civilrightsproject.harvard.edu/research/deseg/ResegregationAmerican_Schools99.pdf [accessed January 25, 2004].
Pallas, A., Natriello, G., and McDill, E. (1989). The changing nature of the disadvantaged population: Current dimensions and future trends. Educational Researcher, 18, 16–22.
Payne, K. (1994). Influences on parental choice of children’s early educational experiences. Ph.D. dissertation, Michigan State University.
Pew Hispanic Center Fact Sheet. (2004a). Latino teens staying in high school: A challenge for all generations. Available: http://pewhispanic.org/site/docs/pdf/persistence%20Jan%2026%202004.pdf [accessed April 17, 2004].
Pew Hispanic Center Fact Sheet. (2004b). Hispanic school achievement: Catching up requires running faster than white youth. Available: http://pewhispanic.org/site/docs/pdf/achievement%20Jan%2026%202004.pdf [accessed April 17, 2004].
Pew Hispanic Center Survey Brief. (2004). Assimilation and language. (Publication No. 7052.) Available: http://www.pewhispanic.org/site/docs/pdf/ASSIMILATION%20AND%20LANGUAGE-031904.pdf [accessed May 2, 2004].
Reardon, S., and Galindo, C. (2003). Hispanic children and the initial transition to schooling: Evidence from the Early Childhood Longitudinal Study. Presentation to the National Academies/National Research Council, Panel on Hispanics in the United States.
Rendon, L.I., and Garza, H. (1996). Closing the gap between two- and four-year institutions. In L.I. Rendon and R.O. Hope (Eds.), Educating a new majority: Transforming America’s educational system for diversity (pp. 289–308). San Francisco, CA: Jossey-Bass.
Riegle-Crumb, C. (2003). International gender inequity in math and science education: The importance of gender stratification. Ph.D. dissertation, University of Chicago.
Rosenbloom, S.R., and Way, N. (2004). Experiences of discrimination among African American, Asian American, and Latino adolescents in an urban high school. Youth and Society, 35(4), 420–451.
Rumberger, R.W., and Larson, K.A. (1998). Toward explaining differences in educational achievement among Mexican American language-minority students. Sociology of Education, 71, 69–93.
Saville-Troike, M. (1984). What really matters in second language learning for academic achievement. TESOL Quarterly, 18, 199–219.
Schiller, K. (1995). Organizations, individuals, and uncertainty: The transition to high school. Ph.D. dissertation, University of Chicago.
Schmid, C.L. (2001). Educational achievement, language-minority students, and the new second generation. Sociology of Education, 74, 71–87.
Schneider, B., and Stevenson, D. (1999). The ambitious generation: America’s teenagers, motivated but directionless. New Haven, CT: Yale University Press.
Smith, J.B. (1995). Does an extra year make any difference? The impact of early access to algebra on long-term gains in mathematics attainment. Educational Policy and Policy Analysis, 18(2), 141–153.
Steele, C., and Aronson, J. (1995). Stereotype threat and the intellectual test performance of African Americans. Journal of Personality and Social Psychology, 69(5), 797–811.
Stevenson, D.L., Schiller, K., and Schneider, B. (1994). Sequences of opportunities for learning. Sociology of Education, 67, 184–198.
U.S. Census Bureau. (2001a). Population by race and Hispanic or Latino origin for the United States: 1990 and 2000 (PHC-T-1). Washington, DC: Author, Population Division.
U.S. Census Bureau. (2001b, October). Current Population Survey. School enrollment: Social and economic characteristics of students. Detailed Tables, Table 7. Available: http://www.census.gov/population/www/socdemo/school/cps2001.html [accessed June 5, 2004].
U.S. Census Bureau. (2002a, March). Current Population Survey. Washington, DC: Author, Ethnic and Hispanic Statistics Branch, Population Division. Available: http://www.census.gov/population/socdemo/hispanic/ppl-165/tab07-2.txt [accessed March 24, 2004].
U.S. Census Bureau. (2002b). The Hispanic population in the United States: March 2000 (Current Population Reports, P20-535). Washington, DC: Author.
U.S. Census Bureau. (2003). Current Population Survey. Annual Social and Economic Supplement. Washington, DC: Author.
U.S. Department of Defense. (2000). Population representation in the military services, Fiscal year 1999. Washington, DC: Author.
U.S. Department of Education. (2004). Title V: Developing Hispanic-serving institutions program. Washington, DC: Author.
U.S. Department of Education, National Center for Education Statistics. (1988). National Education Longitudinal Study. Washington, DC: Author.
U.S. Department of Education, National Center for Education Statistics. (1990). A profile of the American eighth grader: NELS: 88 student descriptive summary (NCES 90-458). Washington, DC: Author.
U.S. Department of Education, National Center for Education Statistics. (1995a). Approaching kindergarten: A look at preschoolers in the United States (NCES 95-280). Washington, DC: Author.
U.S. Department of Education, National Center for Education Statistics. (1995b). A profile of the American high school senior in 1992 (NCES 95-384). Washington, DC: Author.
U.S. Department of Education, National Center for Education Statistics. (1996a). Digest of education statistics, 1996 (Table 149). Ages for compulsory school attendance, special education services for students, policies for kindergarten programs, and year-round schools, by state: 1995 and 1996 (NCES 96-133). Washington, DC: Author.
U.S. Department of Education, National Center for Education Statistics. (1996b). School and staffing in the U.S.: A statistical profile, 1993–94 (NCES 96-124). Washington, DC: Author.
U.S. Department of Education, National Center for Education Statistics. (1997). America’s teachers: Profile of a profession, 1993–94 (NCES 97-460). Washington, DC: Author.
U.S. Department of Education, National Center for Education Statistics. (1998, Fall). Early childhood longitudinal study: Kindergarten class of 1998–99. Washington, DC: Author.
U.S. Department of Education, National Center for Education Statistics. (1999). National Household Education Survey (Parent Interview Component), public-use data (weighted). Washington, DC: Author.
U.S. Department of Education, National Center for Education Statistics. (2000a). America’s kindergartners (NCES 2000-070). Washington, DC: Author.
U.S. Department of Education, National Center for Education Statistics. (2000b). Dropout rates in the United States, 2000 (NCES 2002-114). Washington, DC: Author.
U.S. Department of Education, National Center for Education Statistics. (2001a). Findings from the condition of education 2000: Entering kindergarten (NCES 2001-035). Washington, DC: Author.
U.S. Department of Education, National Center for Education Statistics. (2001b). Paving the way to postsecondary education: K–12 intervention programs for underrepresented youth (NCES 2001-205). Washington, DC: Author.
U.S. Department of Education, National Center for Education Statistics. (2001c). Digest of education statistics. Based on Integrated Postsecondary Education Data System (IPEDS), “Completion” Survey, 1999–2000. Washington, DC: Author.
U.S. Department of Education, National Center for Education Statistics. (2002a). New directions for program evaluation at the U.S. Department of Education. Washington, DC: Author. Available: http://www.ed.gov/print/news/pressreleases/2002/04/evaluation.html [accessed June 16, 2004].
U.S. Department of Education, National Center for Education Statistics. (2002b). Digest of education statistics, 2001 (NCES 2002-130). Washington, DC: Author.
U.S. Department of Education, National Center for Education Statistics. (2002c). The condition of education. Based on 1998 High School Transcripts Study. Washington, DC: Author.
U.S. Department of Education, National Center for Education Statistics. (2002d). Digest of education statistics. Based on Higher Education General Information Survey (HEGIS), Fall Enrollment in Colleges and Universities Survey, 1980–81, and Integrated Postsecondary Education Data System (IPEDS), Fall Enrollment Survey, 2000–01. Washington, DC: Author.
U.S. Department of Education, National Center for Education Statistics. (2003a). The condition of education 2003 (NCES 2003-067). Washington, DC: Author.
U.S. Department of Education, National Center for Education Statistics. (2003b). Digest of education statistics, 2002 (NCES 2003-060). Washington, DC: Author.
U.S. Department of Education, National Center for Education Statistics. (2003c). Racial/ ethnic differences in the path to a postsecondary credential (NCES 2003-005). Washington, DC: Author.
U.S. Department of Education, National Center for Education Statistics. (2003d). Status and trends in the education of Hispanics (NCES 2003-008). Washington, DC: Author.
U.S. Department of Education, National Center for Education Statistics. (2003e). National Assessment of Educational Progress (NAEP). Washington, DC: Author.
U.S. Department of Education, National Center for Education Statistics. (2004a). Dropout rates in the United States: 2001 (NCES 2005-045). Washington, DC: Author.
U.S. Department of Education, National Center for Education Statistics. (2004b). Public high school dropouts and completers from the Common Core of Data: School year 2000–01 (NCES 2004-310). Washington, DC: Author.
Usiskin, Z. (1987). Why elementary algebra can, should, and must be an eighth grade course for average students. Mathematics Teacher, 80, 428–438.
Valencia, R. (2002). Chicano school failure and success: Past, present, and future. New York: Routledge/Falmer Press.
Valencia, R., and Aburto, S. (1991). Contemporary testing and Latino student access to the teaching profession: An overview of issues. In G. Keller, J. Deneen, and R. Magallan (Eds.), Assessment and access: Hispanics in higher education (pp. 195–232). Albany: State University of New York Press.
Valenzuela, A. (1999). Subtractive schooling: U.S. Mexican youth and the politics of caring. Albany: State University of the New York Press.
Wadsworth, B.J. (1989). Piaget’s theory of cognitive and affective development (fourth edition). New York: Longman.
Zulmara, C., and Necochea, J. (2003). My mother never read to me. Journal of Adolescent and Adult Literacy, 47, 122–126.
APPENDIX TABLE A6-1 Logistic Regression Predicting the Likelihood of Having a Risk Factor (One of Three) by Race/Ethnicity and the Other Risk Factors
|
Single Parent Family Risk Factor |
||||||
|
Predictor |
Model 1 |
Model 2 |
Model 3 |
|||
|
Beta |
Odds Ratio |
Beta |
Odds Ratio |
Beta |
Odds Ratio |
|
|
Constant |
−1.871*** |
|
−2.063*** |
|
−1.077*** |
|
|
Black |
1.946*** |
6.998 |
1.611*** |
5.007 |
1.518*** |
4.561 |
|
Hispanic, speaks English at home |
.864*** |
2.372 |
.621*** |
1.861 |
.559*** |
1.749 |
|
Hispanic, speaks Spanish at home |
.326*** |
1.386 |
−.275 |
.760 |
−.401*** |
.670 |
|
Asian |
−.338** |
.713 |
−.440** |
.644 |
−.349** |
.706 |
|
Other |
.942*** |
2.566 |
.671*** |
1.956 |
.608*** |
1.837 |
|
Below poverty level (risk) |
|
|
1.368*** |
3.929 |
1.017*** |
2.766 |
|
Low educational attainment for mother (risk) |
|
|
.064 |
1.066 |
−.300*** |
.741 |
|
Socioeconomic status (quintiles) |
|
|
|
|
–.282*** |
.754 |
|
Chi-square |
3234.50*** |
4689.61*** |
5049.38*** |
|||
|
–2 Log-likelihood |
27874.65 |
26419.55 |
26059.78 |
|||
|
Family Income Below the Poverty Threshold Risk Factor |
||||||
|
Predictor |
Model 1 |
Model 2 |
Model 3 |
|||
|
Beta |
Odds Ratio |
Beta |
Odds Ratio |
Beta |
Odds Ratio |
|
|
Constant |
−2.301*** |
|
−2.769*** |
|
.964*** |
|
|
Black |
1.860*** |
6.423 |
1.287*** |
3.620 |
.955*** |
2.599 |
|
Hispanic, speaks English at home |
1.219*** |
3.384 |
.840*** |
2.316 |
.658*** |
1.932 |
|
Hispanic, speaks Spanish at home |
2.079*** |
8.000 |
1.523*** |
4.585 |
.857*** |
2.356 |
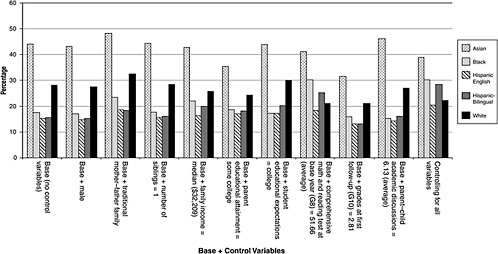
FIGURE A6-1a Probability (in percent) of taking high math courses (trigonometry or above) for each race/ethnicity by different control variables.
SOURCE: U.S. Department of Education, National Center for Education Statistics, NELS 88-2000, Second Follow-Up, 1992, restricted-use data (with imputed values).
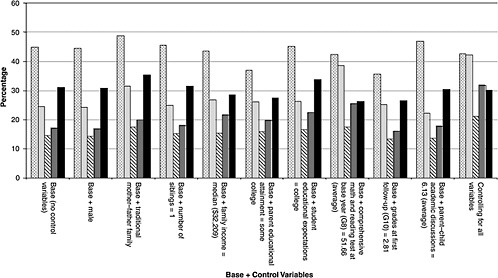
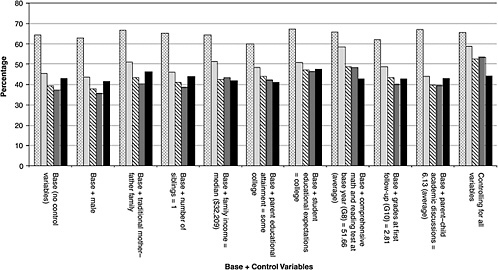
NOTES:
Model 1: Base (no control variables)
Model 2: Base + male
Model 3: Base + traditional mother–father family
Model 4: Base + number of siblings = 1
Model 5: Base + family income = median ($32,209)
Model 6: Base + parent educational attainment = some college
Model 7: Base + student educational expectations = college
Model 8: Base + comprehensive math and reading test at base year (G8) = 51.66 (average)
Model 9: Base + grades at first follow-up (G10) = 2.81
Model 10: Base + parent–child academic discussions = 6.13 (average)
Model 11: Controlling for all variables


