
3
Assessment as a Design Challenge
The purpose of this study, as set out in the original proposal to the National Science Foundation, was “to determine the most viable approach or approaches for assessing technological literacy in three distinct populations in the United States: K–16 students, K–16 teachers, and out-of-school adults.” The committee was not asked to develop assessment tools, for which it had neither the time nor the resources, but to point the way toward that ultimate goal. To fulfill this charge, the committee decided to create a “road map” for the design of assessments of technological literacy and to provide general and specific explanations and examples of how the design process can be used to develop tools for assessing technological literacy.
The Design Process
The committee’s task was similar to the tasks engineers face every day—the development of an instrument or tool to perform a particular job within given requirements and constraints. In fact, people from all walks of life face these kinds of challenges every day. Consider, for example, a restaurant manager who wants to revise her menu to reduce the fat content and maintain customer satisfaction or a group of surgeons devising a procedure to separate conjoined twins or a business executive figuring out a new corporate organizational scheme or a legislator crafting a new law. All of them are trying to solve problems by devising new entities, things that did not exist before. In short, they are engaging in design processes.
Webster’s dictionary defines design as “a mental project or scheme
in which means to an end are laid down.” The design process is a method of creating an effective design, a way of providing a structure for a creative endeavor (de Vries, 2005). By its very nature, design is a messy, complex process that varies depending on what is being designed and who is designing it. However, whether the designer is an engineer, an architect, or a professional working in the technological realm, design processes have some common elements, such as clarification of the nature of the problem, the setting of goals and limits for the project, and the delineation of the parameters of potential solutions. These elements have been formalized and are taught in engineering schools and elsewhere (Cross, 2000). In fact, the design process is a sufficiently important aspect of engineering and technology that, according to Technically Speaking (NAE and NRC, 2002), Standards for Technological Literacy (ITEA, 2002), and both sets of national science standards (AAAS, 1993; NRC, 1996), every technologically and scientifically literate person must have an understanding of it. According to ITEA, a technologically literate person must have the ability to apply the design process.
By its very nature, design is a messy, complex process that varies depending on what is being designed and who is designing it.
Because many members of the study committee for this report have backgrounds in engineering and technology, the committee decided to use the engineering design process to help address its charge. In fact, the engineering design process is also well suited to solving any problem that is poorly or imperfectly defined, such as the problem facing the committee.
The challenge of assessing technological literacy is difficult for several reasons. First, neither technology nor technological literacy can be easily defined. Second, although several sets of educational standards include descriptions of what a technologically literate person should know and be able to do, these standards and their associated curricula are relatively new and are largely untested. Third, the subject-matter connections among technology, mathematics, science, engineering, and history, just to name the most obvious subjects, are not well defined. Finally, assessments of technological literacy will necessarily be influenced by the large, and very complex, system of education in the United States.
The committee used a representative model of the engineering design process to organize its deliberations and, to some extent, the report as a whole. This approach had a number of benefits. First, the committee was able to approach its task in a structured, thoughtful way and to incorporate a unifying theme throughout the report. Second, the committee was able to provide a road map for others to follow in developing tools
|
BOX 3-1 Linear Steps in the Technological Design Process
|
for assessing technological literacy. And third, although not part of the committee’s formal task, the committee was able to promote technological literacy by demonstrating how the engineering design process can be used to address non-engineering problems.
The remainder of this chapter provides a description of how the design process was used to further the work of the committee and how it could be used to facilitate the development of assessment instruments. The chapter is organized according to the steps in a technological design process. Box 3-1 describes a simple, linear progression through a design process. Figure 3-1 provides a more realistic view of the iterative steps in a
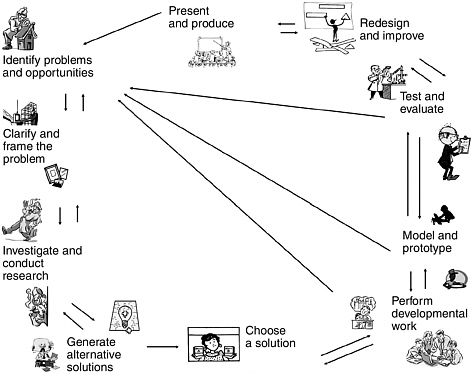
FIGURE 3-1 Design as an iterative process.
Note: Typically, design begins with the identification of a problem to be solved, represented here by the detective in the upper left corner of the figure.
TABLE 3-1 Selected Design Attributes of the Committee’s Study Process
|
Design Attribute |
Committee’s Study Process |
|
Define the problem. |
The problem—providing guidance on the development of assessment tools for technological literacy—which was spelled out in the committee’s charge, was reviewed and refined during the first few committee meetings. |
|
Identify constraints and criteria. |
The committee planned its work to meet the constraints of time and money available for the project. During a fact-finding workshop, other constraints were identified—the report had to make a strong case for assessing technological literacy and for the feasibility of developing and implementing assessments. |
|
Conduct relevant research. |
The committee (1) collected and analyzed existing assessment instruments to provide data for brainstorming sessions; (2) commissioned reviews of the literature related to how people learn technological and engineering concepts and skills; and (3) held a workshop to gather information from stakeholders in the assessment, education, and policy communities. |
|
Brainstorm ideas. |
During seven face-to-face meetings, e-mail exchanges, and telephone conferences, the committee discussed a variety of approaches to assessment. |
|
Identify potential solutions. |
The committee developed five sample cases of assessments for different populations and different purposes, as well as a conceptual framework for organizing content for the study of technology in a way that would be useful for assessment designers. |
|
Reiterate if necessary. |
The committee revised many of its recommendations and changed other sections of the report based on input from the workshop and from external reviewers of the document. |
design process. Table 3-1 illustrates how the committee’s study process can be fitted to a design model.
Define the Problem
As obvious as it may seem, defining the problem, the crucial first step in the design process is often overlooked. Design problems are by nature often open-ended questions, such as “Which graphic designs will best illustrate this report?” or “What sort of emergency-response plan should the state of Louisiana put into place to deal with hurricanes more effectively?” To be certain that the design problem is thoroughly understood, the first step is to restate the problem and identify outstanding issues.
In the case of this report, the initial problem, as presented in the committee’s statement of task, was “to determine the most viable approach
or approaches for assessing technological literacy in three distinct populations in the United States: K–16 students, K–16 teachers, and out-of-school adults.” After reflecting on the statement of task, the committee concluded that there were many reasons it would not be not feasible to treat the K–16 student and teacher populations as monolithic groups.
First, content standards have been developed for most K–12 subjects spelling out what children should know and be able to do at different grade levels, and assessments are already being used to track their achievement. By contrast, content standards and large-scale testing are not widely used in post-secondary education. Second, the high-stakes testing encouraged by the No Child Left Behind Act puts considerable pressure on K–12 teachers to follow state-developed curricula. Teachers in post-secondary institutions, although they also face many pressures, are not typically required to teach a specified curriculum. For these and other reasons, it was difficult for the committee to identify incentives for college students, college teachers, and institutions of higher education to participate in assessments of technological literacy. Thus, the committee opted to treat post-secondary students and teachers as part of the general adult population, where assessments are most likely to be done via survey methods.
Once the problem had been restated in this way, the committee attempted to clarify the context in which the problem had been posed. This process included defining technology and technological literacy (de- scribed in Chapter 2) and determining the current state of assessments of technological literacy (Chapter 5).
Because the statement of a problem is always made in a particular context, it may reflect bias and even imply a particular solution.
Finally, because the statement of a problem is always made in a particular context, it may reflect bias and even imply a particular solution. To eliminate as much bias as possible and ensure that many possible solutions were considered, the committee stressed the importance of clarifying the purpose of the design activity. The committee determined that the goal of this project was to provide a design-based road map for the development of assessments of technological literacy. Designers of specific assessment instruments can follow the road map, keeping the particular purpose or goal of that assessment in mind.
Identify Constraints
Once a problem has been clearly defined, the next step is to identify the circumstances that limit the number of practical, or even
possible, solutions. These “constraints,” as engineers call them, are present in every type of design process. For example, a congressman crafting a new law is constrained by the U.S. Constitution, as well as by what is politically feasible. An architect designing a building is constrained by the budget, by local building codes, and by the materials that are available. When iron and steel beams were first developed, for example, the constraint on how tall a building could be was eliminated, and the era of skyscrapers began. Thus, constraints are not necessarily permanent or absolute. They are a function of time and place.
Constraints can be either general or specific. General constraints, as the name implies, are issues common to many different types of problems. Specific constraints are particular to the problem at hand. Two general constraints for the development of assessments of technological literacy are time and money, limits to the amount of human and financial resources that can be devoted to the problem. For example, even though computer simulations might be an excellent way of meeting certain goals of assessment, the time and money required to develop reliable, valid simulations may be beyond the reach of many prospective users. (This constraint is discussed more fully in Chapter 7.)
Constraints can be either general or specific.
There are also a variety of theoretical, practical, and policy-related constraints on the development of technological literacy assessments. First, the concept of technological literacy is not well understood or widely appreciated. The public, by and large, is not aware of or concerned about the need for a better understanding of the technological aspects of the world. Although a significant literature is available on the history, nature, and study of technology, it is not widely read outside specialized academic communities. And even though a number of federal, state, and nongovernmental groups have begun to formulate standards, curricula, instructional materials, and methods of teacher preparation, these efforts are all relatively immature. Thus, the relative newness of technological literacy in the educational landscape constrains the size and nature of the audience that might be receptive to the idea of assessment. This concern was borne out during the committee’s fact-finding workshop held in September 2004 (Box 3-2).
A second constraint is the limited amount of research on, and experience with, assessments of technological literacy. The committee was able to identify only a handful of technology-related assessment instruments (see Chapter 5 for descriptions), and none of these mapped very well to the idea of technological literacy presented in Technically Speaking.
|
BOX 3-2 Input from Stakeholders To solicit input on the idea of assessing technological literacy from the audiences the committee hoped to reach with its final report, a stakeholder workshop was convened in September 2004. About two dozen individuals representing federal and state government agencies; teachers and schools; businesses and industry; national, international, and comparative assessment programs; assessment development firms; and informal-education institutions took part. Prior to the event, all participants were provided with copies of Technically Speaking and a brief summary of the project goals and objectives, and nearly all of them prepared short written statements expressing their views on the opportunities and obstacles to assessing technological literacy. An independent evaluation company, The Study Group, conducted pre- and post-workshop interviews with participants to elicit more in-depth views on the issues. The workshop confirmed a number of the committee’s assumptions about the challenges of making the case for assessment of technological literacy and yielded valuable insights that influenced the content of the report:
|
Thus, there is no obvious model to follow and no body of research to fall back on for assessments in this area.
This constraint is compounded because no single instrument can be effective for the many purposes for which assessments are used—to assist learning, to measure individual achievement, to evaluate programs, and so forth. Furthermore, because there are three different dimensions of technological literacy, assessment developers must decide how much of an assessment to devote to each dimension and how, or whether, to report assessment results according to performance on the three dimensions.
The most difficult dimension to assess is the capability (or doing) dimension, which includes design activities. This dimension simply cannot be fairly assessed via a paper-and-pencil test. Thus, measuring the capability dimension poses special challenges, such as the feasibility and validity of measurement methods. Measuring technological capability in out-of-school adults presents an additional challenge of engaging people who, unlike students in a classroom, are not likely to be co-located and so cannot easily participate in actual or simulated design and problem-solving tasks. Finally, the education policy environment in the United
States constrains the way the committee was able to envision assessment. With the current focus of U.S. education on high-stakes testing in mathematics, reading, and, soon, in science, few resources are available for developing assessments in other content areas, especially areas like technology that are not currently considered mainstream components of the curriculum. In addition, the amount of time in the school day that can be devoted to assessment activities is limited. Thus, the receptivity of teachers, parents, and policy makers to assessments related to technology is another serious constraint.
All of these general constraints are likely to affect the design of an assessment tool. As we will show in Chapter 6, when the design process is applied to the development of a specific type of assessment instrument, the constraints also become more specific.
Identify Design Criteria
Once the constraints have been determined, the specific criteria, or goals, for the design can be identified. The more clearly criteria are defined, the more successful the next steps in the design process will be. The criteria should be quantifiable whenever possible, but quantifiable or not, they should be stated in a way that clearly shows if they will be met by a given design. Anyone following the design process should be able to understand the reasons behind particular choices. In this project, the process of determining criteria was informed by pertinent research (described in Chapters 4 and 5), by an evaluation of the state of the art in assessments of technological literacy (Chapter 5), and by committee members’ expertise.
General Criteria
Like constraints, design criteria may be general or case specific. The committee believes the following general criteria should be used to guide the development of assessments for technological literacy (specific criteria for assessments for specific purposes are spelled out in Chapter 6).
An assessment instrument must be designed to meet a specific purpose (ITEA, 2003). The purpose influences both the interpretation of the results and the design of the instrument, including the type of items included and their distribution among the dimensions of technological
|
BOX 3-3 Possible Purposes for Assessments
|
literacy. Some of the purposes for which an assessment might be developed are listed in Box 3-3.
Assessment data should be useful for making decisions related to the purpose of the assessment. Different assessments are necessary to address the unique characteristics of different target groups. No single assessment instrument is likely to be effective for more than one target audience.
Assessments for technological literacy should produce valid and reliable data on as many of the three dimensions of technological literacy as possible. However, it may be impractical or logistically difficult to address all three dimensions in one instrument.
Assessments of technological literacy should be informed by what has been learned from the cognitive sciences about how people learn.
Although the research base related to learning in the technological realm is relatively thin, insights into how people think about technological issues should be taken into account.
Assessments of technological literacy should reflect appropriate content standards. This criterion is especially relevant for assessments of student populations. Assessments of attitudes toward technology in out-of-school adult populations should also be designed with an eye to the important elements of knowledge and capability related to technology suggested by established standards.
Assessments for technological literacy should encourage higher order thinking (Box 3-4). An assessment provides an opportunity for students and teachers, as well as members of the general public, to demonstrate their knowledge of facts, display their conceptual understanding, and show their ability to apply that understanding to solving problems and making informed decisions.
Assessments that include items referring to specific technologies should be periodically reviewed to ensure that those references are current. Because technology is constantly changing, it is important that assessments not include out-of-date references (e.g., to long-playing records, typewriters, rotary-dial phones) that are not recognizable by the target population.
Assessments should avoid gender, race, or cultural bias, and, when appropriate, they should take into account the special needs of people with disabilities.
|
BOX 3-4 Characteristics of Higher-Order Thinking Higher order thinking
SOURCE: Adapted from Resnick, 1987. |
|
BOX 3-5 A Conceptual Framework for Assessment of Technological Literacy In spring 2005, the National Assessment Governing Board (NAGB) agreed to sponsor a “probe” study of technological literacy assessment. NAGB uses probe studies to explore the feasibility of developing new, large-scale national assessments. This study will proceed in several stages, the first of which will end in 2008 with the public release of a detailed assessment framework based on existing publications or research. Field testing of sample items will begin in 2010, and an actual student assessment will be administered in 2012. |
Conceptual Framework
Because of the broad extent of the world of technology and the numerous practical limitations on test design, boundaries around the material being assessed must be clearly delineated. One basis for setting the criteria for assessment design is to specify what the assessment will measure. Decisions must also be made about the level of detail and complexity of test items, the proportion of items devoted to particular areas of knowledge and capabilities, and the testing methods to be used.
Boundaries can be set through the development of a conceptual framework that provides a basis for test construction. Many states and the National Assessment Governing Board (NAGB), which is responsible for overseeing the development of the National Assessment of Educational Progress (NAEP), use conceptual frameworks with some common elements for developing student assessments. Most of these frameworks are closely linked to subject-specific content standards, and the most useful frameworks provide concise statements of testable material at each grade level. Frameworks for state assessments are typically based on nationally developed content standards.
NAGB has agreed to develop a framework for an assessment of technological literacy by 2008 as part of a feasibility study (Box 3-5). The committee believes that a reasonable basis for a framework for assessments of technological literacy would be the ITEA Standards for Technological Literacy (ITEA, 2002).
NAGB has agreed to develop a framework for an assessment of technological literacy by 2008.
Assessment frameworks also suggest how much emphasis will be put on different areas of content, depending on the learning goals, the age of the test population, and other factors. For example, the Illinois Science Assessment Framework suggests that 20 percent of questions focus on student understanding of science inquiry and technological design; 60 percent on major scientific themes, such as living things, matter and
energy, and force and motion; and the remaining 20 percent on laboratory safety practices and connections among science, technology, and society (ISBE, 2005). Because content standards differ from state to state, the emphasis on different concepts and skills may vary. However, in all cases, there is a strong connection between the framework and relevant standards.
Assessment frameworks often provide test developers with detailed suggestions on the nitty-gritty of test construction, such as the number of test items; the number of multiple choice, short answer, and other types of questions; the relative “weight” of the parts of the assessment; the amount of time allotted for each section; and the best type of scoring (e.g., CSAP, 2004).
Finally, assessment frameworks usually suggest criteria for determining performance levels. NAEP, for instance, groups student test outcomes into three achievement levels, “basic,” “proficient,” and “advanced.” Criteria for each level have been developed with input from subject-matter experts, parents, and others.
Frequently, the conceptual underpinnings of an assessment framework are represented as a matrix, which serves as a blueprint for the development of test specifications and, ultimately, of actual test items. Most frameworks (and matrices) are based on published documents, such as national and state content standards, that suggest desired learning outcomes. As more data become available and reveal strengths and weaknesses in the original assessment design, the framework and matrix can be revised, as needed (Wilson and Bertenthal, 2005).
Frequently, the conceptual underpinnings of an assessment framework are represented as a matrix.
Because frameworks are usually designed to fulfill the purpose of a particular assessment, the committee decided that a detailed framework might not be particularly helpful at this time. However, the committee developed a version of an assessment matrix for technological literacy that can be useful in many settings (Figure 3-2).
The committee’s design of the matrix was influenced by a review of conceptual frameworks developed for subjects closely related to technological literacy. For example, in the framework for the 2005 NAEP science assessment, the content areas in the matrix are: Earth/space, physical sciences, and life sciences. The cognitive domains are three aspects of knowing and doing: conceptual understanding, scientific investigation, and practical reasoning (NAGB, 2004a).
The framework for the 2009 science assessment retains the three content categories from 2005 and creates four rather than three categories that are equivalent to the “knowing and doing” categories of the 2005
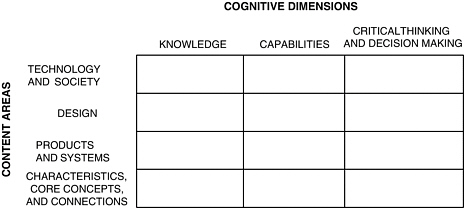
FIGURE 3-2 Assessment matrix for technological literacy.
framework. These four categories are called “science practices” and are focused on the ways scientific knowledge is used. They are: identifying scientific principles, using scientific principles, scientific inquiry, and technological design (NAGB, 2005). Underlying the science practices are four cognitive skills—“knowing that,” “knowing how,” “knowing why,” and “knowing when and where to apply knowledge”—intended to facilitate the development of assessment items and analysis of student responses. According to the framework, technological design will be the focus of 10 percent of the 2009 NAEP items.
The 1996, 2000, and 2003 NAEP mathematics frameworks included five primary content “strands”—number sense, properties, and operations; measurement; geometry and spatial sense; data analysis, statistics, and probability; and algebra and functions—and three cognitive domains, called “math abilities”—conceptual understanding, procedural knowledge, and problem solving (NAGB, 2002). The frameworks group math abilities with “reasoning,” “connections,” and “communication” in a cross-cutting area of context called “mathematical power.”1
Even from these very brief descriptions, it is apparent that the separations between the content and cognitive elements in the NAEP matrices are artificial. Indeed, many test items necessarily draw on two or more content areas and require a mix of cognitive skills. The same kind of overlap will occur in an assessment matrix for technological literacy.
After looking closely at Standards for Technological Literacy (ITEA, 2002), Technically Speaking: Why All Americans Need to Know More About Technology (NAE and NRC, 2002), and the science education standards developed by AAAS (1993) and NRC (1996), both of which address the nature of technology and the relationship between technology and science, the committee adapted the three dimensions of technological literacy proposed in Technically Speaking—knowledge, capabilities, and critical thinking and decision making2—as the cognitive elements in the matrix. With the exception of the 2009 science assessment, these dimensions are conceptually consistent with the elements in NAEP’s math and science frameworks (Table 3-2).
However, there are also some important differences between the committee’s matrix and NAEP’s matrices. First, NAEP’s cognitive domains are progressive—moving from understanding to application of that understanding to what might be called critical thinking. Although the authors of Technically Speaking did not suggest a progression from one dimension to another, the committee believes a case can be made for an increasing cognitive complexity from knowledge to capability to critical thinking and decision making.
The committee’s method of determining the content of the matrix also differs significantly from the model developed by NAEP. NAEP divides subjects into subdomains (e.g., for science, into Earth/space, physical sciences, and life sciences). By contrast, for technology, subdomains are better represented by different conceptualizations, each of which covers the whole of technology—the artifacts, or “stuff,” of technology; processes (especially design) used to create technology; and the relationship between technology and society.
For technology, subdomains are better represented by different conceptualizations, each of which covers the whole of technology.
These conceptualizations are derived from (1) the literature on the philosophy of technology, especially Thinking Through Technology: The Path Between Engineering and Philosophy by Carl Mitcham (1994), where technology is described as knowledge, and (2) the ITEA standards, which are based on the same general principle. The committee defines the content in this way (rather than, for example, using categories of technologies or disciplines of engineering). The rationale for the committee’s
|
2 |
The third dimension was called “Ways of Thinking and Acting” in Technically Speaking, but the committee has substituted “Critical Thinking and Decision Making,” which seems a more appropriate descriptor. (See Chapter 2, pp. 33–35, for further explanation.) |
TABLE 3-2 Cognitive Dimensions of the NAEP Science, NAEP Mathematics, and Committee’s Technology Assessment Frameworks
approach is that technological literacy is based on a broad understanding and conceptualization of technology, rather than on a narrow understanding of specific components of the technological world.
The committee’s approach differs in three important respects from the ITEA approach. First, the ITEA standards treat the “understanding” of design and the “doing” of design separately. In the committee’s matrix, one content strand encompasses both. Second, the committee uses “characteristics, core concepts, and connections” to capture the ideas ITEA lumps under “nature of technology.” Third, the committee includes a content area, “products and systems,” related to the “stuff” of technology. Products are the myriad individual devices and processes, from bicycles and dishwashers to automation and assembly lines, that we call technology. Systems are agglomerations of technologies that operate in complex arrangements to accomplish things that could not be accomplished by the individual components. Examples of systems include electricity generation and distribution, national and international transportation, and global communication systems. The “products and systems” category corresponds to “the designed world” in the ITEA standards, with
one important difference. The committee believes this category should not be limited to the seven technologies suggested by ITEA. The groupings in the ITEA standards—medical, agricultural, and related biotechnologies; energy and power; information and communication; transportation; manufacturing; and construction—leave out some important elements (e.g., sanitation technology, nanotechnology).
Of course, no list can be complete. For one thing, new technologies are always being created while others become obsolete. But even if a comprehensive list could be compiled, it would be unmanageable. And, practically speaking, for the purposes of assessment, familiarity with some technologies will be more important than familiarity with others, depending on the purpose of the assessment and the test population. For these reasons, the committee encourages designers to be flexible in deciding which “products and systems” to include.
Table 5-2 in Chapter 5 presents a set of sample questions that illustrate how the content and cognitive elements of technological literacy might play out in each cell of the committee’s matrix.
Conduct Relevant Research
Research, including reviews of the published literature and interviews with experts, can be helpful when approaching a very complex or poorly defined problem. Scientists and authorities in other fields often analyze new problems by referring to previous problems. Once they have determined the important factors in earlier cases, they may be able to apply the lessons learned to the new design problem (NRC, 1999). Following this pattern, the committee reviewed existing assessment instruments to determine the issues most important to the present task, such as identifying design criteria and constraints and possible solutions. Research was also useful for investigating whether ideas that arose during brainstorming sessions met the criteria and constraints of the problem at hand.
The committee found that research was helpful in every phase of the design process.
In fact, the committee found that research was helpful in every phase of the design process, from defining the problem to generating possible solutions. Individuals and organizations attempting to develop assessments of technological literacy based on the road map provided in this report will have to conduct even more research—pilot testing, for example—to determine how well their designs meet the criteria in real-world environments.
Identify Potential Solutions
The heart of the design process is generating a number of possible solutions and deciding which of them is likely to be useful for solving the problem. During brainstorming sessions, the usual method of generating possible solutions, members of a design team discuss a wide range of ideas, initially with little concern for their feasibility. After listing all of the suggestions, the team begins to pare down alternatives based on constraints and to eliminate ideas that are unworkable for one reason or another.
The committee used a similar process. For example, although it was unlikely, the committee considered the possibility that one or more existing assessment instruments might adequately measure technological literacy as spelled out in Technically Speaking. If such an instrument had been discovered, the entire course of the project would have been different. The committee spent considerable time reading, critiquing, and discussing the collected documents, but, in the end, none was deemed adequate. Thus, this potential solution had to be abandoned. The committee was then left with the challenging task of providing guidance without the benefit of an existing model.
In most design processes, no single proposed solution meets all of the criteria, but several possible solutions fit some of the criteria. This was the case in the committee’s effort to define the content and cognitive elements for assessing technological literacy, represented graphically as a two-dimensional matrix (Figure 3-2). The committee had also considered a three-dimensional alternative comprising content (materials, processes, and products of technology), context (the personal, professional, and social environment in which technology exists), and capabilities (knowledge of technology and the ability to use it). Assessment items with this alternative would be drawn from all three dimensions. Faced with these two alternatives, the committee determined which came closest to fitting all of the criteria.
In most design processes, no single proposed solution meets all of the criteria.
This part of the design process, called “trading off” by engineers, is crucial to any design process. A so-called trade-off matrix provides a format for judging how well each potential solution satisfies each design criterion. Constructing a trade-off matrix requires gathering as much information about each alternative as possible, including the state of the art in that area, the costs and time line for implementing the alternative, and evidence demonstrating the validity and reliability of the technique.
Because there are likely to be a number of alternatives and a number of criteria, it is generally not possible within the constraints of time and money to conduct an in-depth study of each alternative and each criterion. However, once enough information has been gathered to make some qualitative comparisons, a formal trade-off analysis can be done. In the end, it is probably more important that assessment developers carefully assess how their design choices relate to the criteria and which criteria are most important for achieving the purpose of the assessment than that they use a formal matrix analysis.
The committee analyzed the two alternative conceptualizations in light of relevant content standards. The three-dimensional model had some intellectual appeal, but it differed in some dramatic ways from the organizational scheme presented in the ITEA standards. For example, ITEA considers capability to be primarily concerned with doing—using technology, problem solving, and designing, for example. Knowledge, in contrast, is mostly concerned with understanding facts and the broader concepts of technology. The two sets of science standards take a similar view of technological knowledge.
The committee’s trade-off discussion focused on the question of feasibility, that is, which of the two approaches was more likely to be acceptable to educators, assessment experts, and the public at large. Even though any assessment of technological literacy is likely to face challenges, the committee decided that the three-dimensional model, despite its many interesting features, was less likely to be acceptable to key stakeholders.
Refine Possible Solutions
Although the trade-off matrix is a useful aid to decision making, it does not provide a final answer. Once the highest ranking solution or solutions have been selected, they typically require further study before the design can move to the prototype stage. Careful analysis at this stage should reveal if a particular solution holds up against the specified criteria. Because the original research is usually qualitative and is conducted rapidly, some information may be missing. At this point, all information relating to the trial solution must be entered into the analysis and a detailed design of the trial solution constructed.
This detailed design, referred to as a prototype, or pilot project, represents the first concrete step toward the creation of a real-world
assessment instrument and must include at least some of the items that will be included in the final design. The prototype must be tested against specified criteria to ensure that the instrument accomplishes its purpose. If the prototype fails to meet any of the specified criteria, the design process must be repeated, after being modified to accommodate the results of the first iteration. As soon as a prototype meets the specified criteria, the design should be reconsidered with an eye toward simplifying it as much as possible.
The product of the committee’s design process is this report rather than an actual assessment instrument. The principle impetus for refinements to the report was comments from the 11 outside reviewers of the document. Responses to those comments led to a host of content and organizational changes. For example, several reviewers felt that the draft report presented a potentially confusing definition of technological literacy. In response, the committee rewrote sections of the report to clarify the concept, including renaming one of the dimensions (“Ways of Thinking and Acting” was changed to “Critical Thinking and Decision Making”). Reviewers also encouraged the committee to provide a stronger connection between the recommendations in Chapter 8 and the body of the report. This, too, required significant rewriting.
Imperfect Design
The design process is an exercise in compromise.
Because of design constraints and the need for trade-offs among conflicting criteria, no design will be perfect. The design process is an exercise in compromise. Even if a design were theoretically perfect, the process is conducted by humans whose inherent biases and imperfections necessarily influence the process. Thus, all design products are inherently imperfect and can be improved. In the case of an assessment of technological literacy, not only is the assessment subject to refinement, but the subject being assessed is also evolving.
Feedback is a crucial part of the improvement process. Engineers understand that continual improvement means feeding back the results of tests of trial solutions. In the case of assessments of technological literacy, assessment results must be tested for validity, reliability, and other stated criteria, and these results must be disseminated to test developers, researchers, and the general public. The best assessments will be designs that have been modeled, tested, evaluated, and modified over time.
Inherent Uncertainties
All technologies are human-designed products. Thus, they have both intended and unintended consequences. This is also true of assessments. For example, the recent introduction of federally mandated high-stakes testing in mathematics and reading—and science, beginning in 2007—has forced some school districts to reduce, or even cut entirely, funding for other parts of the curriculum. This result was certainly not what the drafters of the No Child Left Behind law intended.
The environment for educational assessments, or for assessments of technological literacy, or both, may change as the result of any number of factors, such as changes in leadership at the national, state, or local level. Policy makers, who must respond to political and social priorities and budget constraints, have considerable influence on the direction of educational reform.
Whether the study of technology will be a stand-alone subject or a component of science, mathematics, history, and other subjects, or both, is still an open question. Therefore, it is impossible to predict whether assessments of technological literacy will be stand-alone efforts, incorporated into assessments of other subjects, or some combination. In addition, over time research into the underlying knowledge structure of technology may lead to changes in the standards for technological literacy.
Because of these uncertainties, and because all designs are imperfect, the committee chose to provide general guidance for designing assessments of technological literacy rather than developing one or more specific assessment designs. (In Chapter 6, the committee considers how the design-based approach might play out for a variety of assessment purposes.) The road map is intended to provide a workable approach for many years, even if the environment for assessing technological literacy changes significantly.
References
AAAS (American Association for the Advancement of Science). 1993. Benchmarks for Science Literacy. Project 2061. New York: Oxford University Press.
Cross, N.G. 2000. Engineering Design Methods: Strategies for Product Design. New York: John Wiley and Sons.
CSAP (Colorado State Assessment Program). 2004. Fact Sheet for Reading. Available online at: http://www.cde.state.co.us/cdeassess/csap/2004/Rdg_Fact_Sheet.pdf (March 28, 2005).
de Vries, M.J. 2005. Teaching About Technology: An Introduction to the Philosophy of Technology for Non-Philosophers. Dordrecht, The Netherlands: Springer Verlag.
ISBE (Illinois State Board of Education). 2005. Illinois Science Assessment Framework. Grades 4 and 7. State Assessments Beginning Spring 2006. Available online at: http://www.isbe.state.il.us/assessment/IAFScience.rtf (March 28, 2005).
ITEA (International Technology Education Association). 2002. Standards for Technological Literacy: Content for the Study of Technology. Reston, Va.: ITEA.
ITEA. 2003. Advancing Excellence in Technological Literacy: Student Assessment, Professional Development, and Program Standards. Reston, Va.: ITEA.
Mitcham, C. 1994. Thinking Through Technology: The Path Between Engineering and Philosophy. Chicago: University of Chicago Press.
NAE (National Academy of Engineering) and NRC (National Research Council). 2002. Technically Speaking: Why All Americans Need to Know More About Technology. Washington, D.C.: National Academies Press.
NAGB (National Assessment Governing Board). 2002. Mathematics Framework for the 2003 National Assessment of Educational Progress. Available online at: http://www.nagb.org/pubs/math_framework/toc.html (December 9, 2004).
NAGB. 2004a. Science Framework for the 2005 National Assessment of Educational Progress. Available online at: http://www.nagb.org/pubs/s_framework_05/toc.html (October 21, 2005).
NAGB. 2004b. Mathematics Framework for the 2005 National Assessment of Educational Progress. Available online at: http://www.nagb.org/pubs/m_framework_05/toc.html (October 21, 2005).
NAGB. 2005. Science NAEP 2009: Science Framework for the 2009 National Assessment of Educational Progress—Prepublication Edition. Developed by WestEd and the Council of Chief State School Officers under contract to the National Assessment Governing Board (contract # ED04CO0148). Available online at: http://www.nagb.org/pubs/naep_fw_pre_pub_edition_for_web.doc (February 15, 2006).
NRC (National Research Council). 1996. National Science Education Standards. Washington, D.C.: National Academy Press.
NRC. 1999. How People Learn: Brain, Mind, Experience, and School. Edited by J.D. Bransford, A.L. Brown, and R.R. Cocking. Washington, D.C.: National Academy Press.
Resnick, L. 1987. Education and Learning to Think. Washington, D.C.: National Academy Press.
Wilson, M.R., and M.W. Bertenthal, eds. 2005. Systems for State Science Assessment. Washington, D.C.: The National Academies Press.


