
3
Emission Sources Subject to New Source Review and Technology Options
INTRODUCTION
The purpose of this chapter is to address the following key questions:
-
What source categories account for a substantial portion of permitting activity pertaining to modifications under New Source Review (NSR)?
-
Are modifications an important part of all NSR permitting?
-
What is the current status of state permitting programs and availability of permit data?
-
What is the correct status of state permitting programs and availability of permit data?
-
What are the most common kinds of repairs and replacements in selected industries?
-
What are the typical technology options or considerations regarding those source categories?
The answers to those questions provide insight into the emissions, energy use, and other implications of technological choices regarding preventive measures, repairs, and replacements. In this chapter, we use language that implies the colloquial meanings, as opposed to the “legal” terminology of maintenance and modification as these terms are used in NSR permitting. It is common in many industries to refer to repair and replacement activities as maintenance (in a nonlegal sense) and for maintenance costs to be considered a routine part of the annual operating cost of a facility. To avoid
confusion with legal terminology, in this chapter we use the terms repair and replacement instead of maintenance and modification.
The main focus here in terms of pollutants is on selected criteria pollutants, especially sulfur dioxide (SO2) and oxides of nitrogen (NOx) but also including carbon monoxide (CO), particulate matter (PM) with an aerodynamic diameter smaller than about 10 µm (PM10), and PM with an aerodynamic diameter smaller than about 2.5 µm (PM2.5). Volatile organic compounds (VOCs), which are ozone precursors, are also included.
With respect to identifying technology options, the focus here is on the current status of emission-source technologies and current options for repair and replacement. However, because technology changes, explicit consideration is given to the process of technology change and the implications for technology change in the future. Furthermore, we consider both pollution control and pollution prevention. Typically, pollution control refers to “end-of-pipe” techniques for removing pollutants from an exhaust gas after they have been formed in an upstream process. For example, in a coal-fired power plant, NOx, SO2, and PM are formed during combustion. Postcombustion control technologies—such as selective catalytic reduction, flue-gas desulfurization, and electrostatic precipitation, respectively—can be used to reduce or capture those pollutants. In contrast, pollution prevention is aimed at reducing or eliminating sources of pollution, typically through feedstock substitutions or process alterations. For example, in the case of a coal-fired power plant, methods that control and stage mixing of fuel and air more carefully can prevent the formation of a portion of NOx that otherwise would have been created, and evaporative VOC emissions can be prevented by substituting water-based solvents for VOC-based solvents in a manufacturing facility. In addition, cost is always a consideration in evaluating and choosing options for repair and replacement. Therefore, cost implications of alternatives for repair and replacement are summarized.
OVERVIEW OF NEW SOURCE REVIEW PERMITS
The purpose of this section is to identify and evaluate the frequency of NSR permitting activity with respect to industrial categories for the purpose of determining which emission sources represent the highest priority for assessment. However, a substantial challenge is that there is not a readily available database that summarizes NSR permitting activity. For example, an Environmental Protection Agency (EPA) database1 (EPA 2004d) containing case-specific information on best available control technology (BACT) and lowest achievable emission rate (LAER) does not readily distinguish
between permits for new sources and permits for modifications. In principle, such data could be obtained individually from each state, but the availability of such data varies among states.
An overview of permitting activity was gleaned from information provided by EPA during preparation of the committee’s interim report (NRC 2005), supplemented with information obtained in the intervening period. We provide here a summary based on the interim report followed by a summary of the additional information.
In its interim report, the committee obtained data provided by EPA as the basis of a summary of permitting activity. That information is included in Appendix D. The data provided by EPA are unpublished, were not subjected to review, and have not been distributed outside EPA. The data were based on information collected internally by EPA from its regional offices that were obtained from state and local permitting authorities. They were summarized by EPA for the committee in terms of the NSR permitted emissions (in tons) by two-digit Standard Industrial Classification (SIC) code and by number of permits. Permits were categorized as “greenfield,”2 new at existing sources, and modifications. The main focus here is on modifications. The data do not include information on facilities that made modifications but did not obtain permits via the NSR program. Although the information presented in the table is sorted by pollutant, it is possible for a modification to involve more than one pollutant.
For NOx, the largest share of modification permits—in both number of permits (46%) and NSR permitted emissions (35%)—was for SIC type 49 (electric, gas, and sanitary services).3 SIC type 49 includes electricity-generating plants of all types, and most of the permits and permitted emissions were for SIC code 4911, electric services. SIC types 32 (stone, clay, and glass products) and 26 (paper and allied products) also had a large share of the reported NSR permitted emissions for modifications (27% and 10%, respectively) but substantially fewer than for SIC type 49. For SIC type 32, the most important source category was SIC code 3241, hydraulic cement. Pulp mills (SIC code 2611) were the most commonly permitted source for modifications under SIC type 26. NOx emission sources at these types of facilities are typically industrial or electricity-generating-plant furnaces but can include a variety of other combustion-based sources, such as heaters, kilns, and ovens.
For SO2, the key emission-source category in number of modification
permits (31%) and NSR permitted emissions for modifications (27%) was SIC type 49 (electric, gas, and sanitary services), for which SIC code 4911 (electric services) was the most important subcategory. Other source categories with large totals for NSR-permitted emissions for modifications included SIC types 28 (chemicals and allied products, particularly industrial inorganic chemicals and phosphatic fertilizers) (24%), 32 (stone, clay, and products, particularly hydraulic cement) (22%), and 26 (paper and allied products, particularly pulp, paper, and paperboard mills) (14%). SO2 emissions typically are associated either with combustion of sulfur-bearing fuels or with processing of sulfur-bearing feedstocks or ores (such as crude oil and metal ores).
For CO, the largest number of permits for modifications was issued to SIC types 49 (which includes electric, gas, and sanitary services) and 33 (which includes primary metal industries). With respect to NSR permitted emissions for modifications, the largest categories (in descending order) were SIC types 26 (paper and allied products, primarily paperboard mills), 32 (stone, clay, and glass products, primarily hydraulic cement and concrete block and brick), 33 (primary metal industries), 20 (food and kindred products, primarily cane sugar), and 49 (electric, gas, and sanitary services, primarily electricity-generating facilities).
For PM, the highest frequency of NSR permits for modifications was for SIC types 49 (electric, gas, and sanitary services) and 33 (primary metal industries). Although both those types also contributed to the NSR permitted emissions for modifications, these emissions are widely distributed among six categories, including SIC types 28 (chemical and allied products, primarily carbon black, phosphatic fertilizers, and industrial organic chemicals), 26 (paper and allied products, primarily paperboard mills, pulp mills, and coated and laminated paper), and 20 (food and kindred products, primarily cane sugar).
For VOCs, the highest frequency of permits for modifications was for SIC types 49 (electric, gas, and sanitary services), 33 (primary metal industries), and 24 (lumber and wood products). The largest share of NSR permitted emissions for modifications was for SIC types 26 (paper and allied products, with a large contribution from coated and laminated paper), 20 (food and kindred products, with a large contribution from soybean oil mills), and 24 (lumber and wood products).
The summary above is subject to several key limitations. Complete permit data were not available for every permit issued. The survey was for a specific period (1997-1999); more-recent data were not available. Some sources accept limits on their emissions by state permits when modifications are made and so are not included in the EPA database. There is some uncertainty in estimated NSR permitted emissions because emission rates are often reported on a short-term basis and had to be converted to an
estimate of annual emissions. Actual emissions are typically less than what is allowable. During the survey period, there was a noticeable increase in the number of new natural-gas-fired turbines permitted, which would affect totals for greenfield sites and new facilities at existing locations. However, that probably does not substantially affect the frequency of permits issued for modifications. The data do not include situations in which NSR permits for major modifications were not issued, such as for facilities that considered but decided against making a modification or facilities that made modifications but did not get an NSR permit for a major modification, whether because of noncompliance or because the source agreed to reduce emissions and obtained a state permit. Despite the limitations of the data, they are among the most comprehensive available.
The summary of permitting activity from the interim report is updated here on the basis of data from EPA that include the period 1997-2002. These data are similar to those provided in summary form by EPA for the interim report, with the same caveats and limitations except that the update includes additional years (2000-2002) and the committee had access to the underlying data and so could generate its own summary tables. The information presented also includes Census data on the number of facilities in each state and EPA data on the number of emitting facilities and their total emission amounts. The information is summarized here with respect to the following two objectives: (1) determine the overall permitting activity when comparing electricity-generating and other sectors, and (2) for the SIC codes of sectors other than electricity generating that have the most permitting activity, identify the states with the largest share of this activity occurring. Table 3-1 compares NSR permitting activity by pollutant, selected states, and manufacturing vs electricity-generating sectors; and Table 3-2 compares permitting activity by pollutant, selected states, and selected manufacturing industries.
Although the general conclusions are the same, the updated summary enables more specific insights regarding permitting activity on a state level and regarding the relative importance of electricity generation versus manufacturing sectors.
On the basis of Table 3-1, in general, the emissions associated with permits for modifications are about 1.5-2.3% of the total emissions for a given pollutant for the manufacturing sector (including facilities not granted a permit in that period). For the electricity-generating sector, the emissions associated with permits for modifications are 0.1-1.1% of total emissions except for CO, for which they are 3.6% of total emissions. Overall, therefore, the amount of emissions associated with permits for modifications are about 1-2% of total emissions for most pollutants and types of industrial facilities.
In general, 33.1-41.2% of all NSR permits issued in the manufactur-
TABLE 3-1 NSR Permit Activity Pollutant, 1997-2002, Manufacturing versus Electricity Generationa
|
Manufacturing Sector |
||||||||||
|
Number of Permits |
Permitted Emissions (tpy) |
Census |
Emissions |
|||||||
|
State |
Tot |
Grn |
New |
Mod |
Grn |
New |
Mod |
Plants |
Plants |
tpy |
|
Carbon monoxide |
||||||||||
|
AL |
24 |
2 |
12 |
7 |
385 |
6,729 |
5,353 |
5,444 |
386 |
190,106 |
|
WI |
13 |
2 |
6 |
5 |
240 |
1,831 |
2,875 |
9,936 |
907 |
56,427 |
|
AR |
12 |
1 |
5 |
6 |
3,694 |
3,054 |
12,206 |
3,316 |
96 |
93,876 |
|
LA |
11 |
0 |
7 |
5 |
- |
8,360 |
3,315 |
3,545 |
198 |
592,306 |
|
NC |
10 |
0 |
4 |
5 |
- |
14,067 |
4,470 |
11,306 |
886 |
63,506 |
|
FL |
9 |
1 |
4 |
2 |
490 |
2,894 |
15,697 |
15,992 |
234 |
48,569 |
|
IL |
8 |
0 |
4 |
4 |
- |
5,701 |
515 |
17,953 |
1,644 |
114,147 |
|
TX |
6 |
0 |
4 |
2 |
- |
1,059 |
6,422 |
21,808 |
466 |
386,465 |
|
OH |
5 |
0 |
2 |
5 |
- |
7 |
5,589 |
17,974 |
342 |
701,527 |
|
TN |
5 |
0 |
2 |
2 |
- |
2,271 |
338 |
7,407 |
211 |
91,929 |
|
IN |
5 |
1 |
3 |
1 |
135 |
1,180 |
272 |
9,303 |
341 |
237,363 |
|
Total |
148 |
10 |
71 |
59 |
5,813 |
72,785 |
73,750 |
363,753 |
12,949 |
4,351,945 |
|
Nitrogen oxides |
||||||||||
|
AL |
25 |
3 |
13 |
6 |
287 |
5,206 |
2,258 |
5,444 |
382 |
66,693 |
|
LA |
18 |
1 |
11 |
5 |
186 |
3,442 |
2,504 |
3,545 |
214 |
146,447 |
|
FL |
16 |
1 |
7 |
5 |
394 |
3,428 |
622 |
15,992 |
270 |
44,255 |
|
AR |
10 |
1 |
3 |
4 |
406 |
86,700 |
2,936 |
3,316 |
102 |
31,170 |
|
IL |
10 |
0 |
5 |
4 |
- |
5,875 |
1,486 |
17,953 |
2041 |
102,435 |
|
WI |
10 |
2 |
6 |
2 |
1,842 |
916 |
360 |
9,936 |
951 |
43,953 |
|
NC |
8 |
1 |
3 |
3 |
767 |
1,127 |
4,175 |
11,306 |
912 |
43,718 |
|
TX |
6 |
0 |
4 |
2 |
- |
2,093 |
8,329 |
21,808 |
470 |
280,741 |
|
PA |
6 |
0 |
2 |
1 |
- |
4,889 |
916 |
17,128 |
476 |
110,514 |
|
TN |
6 |
0 |
3 |
3 |
- |
4,013 |
487 |
7,407 |
232 |
60,711 |
|
IN |
6 |
1 |
3 |
2 |
75 |
1,022 |
2,102 |
9,303 |
358 |
43,912 |
|
OH |
6 |
0 |
3 |
5 |
- |
138 |
1,637 |
17,974 |
345 |
69,263 |
|
MN |
6 |
0 |
3 |
1 |
- |
1,194 |
106 |
8,091 |
278 |
20,808 |
|
CA |
5 |
0 |
0 |
2 |
- |
- |
1,577 |
49,418 |
1,804 |
73,855 |
|
Total |
181 |
13 |
85 |
60 |
6,463 |
133,659 |
36,343 |
363,753 |
14,515 |
1,803,675 |
|
Particulate matter (PM10) |
||||||||||
|
AL |
27 |
2 |
12 |
11 |
86 |
913 |
1,605 |
5,444 |
535 |
35,287 |
|
FL |
26 |
2 |
12 |
10 |
24 |
1,401 |
2,561 |
15,992 |
351 |
13,846 |
|
WI |
19 |
2 |
11 |
8 |
126 |
466 |
243 |
9,936 |
812 |
9,748 |
|
LA |
18 |
1 |
9 |
7 |
14 |
1,223 |
447 |
3,545 |
202 |
30,334 |
|
NC |
12 |
1 |
4 |
4 |
177 |
474 |
877 |
11,306 |
1,222 |
19,405 |
|
IL |
9 |
0 |
4 |
4 |
- |
736 |
132 |
17,953 |
2,615 |
45,727 |
|
AR |
8 |
1 |
4 |
3 |
247 |
568 |
477 |
3,316 |
101 |
13,485 |
|
KY |
8 |
0 |
4 |
2 |
- |
172 |
734 |
4,218 |
511 |
10,773 |
|
OH |
7 |
0 |
4 |
5 |
- |
30 |
3,375 |
17,974 |
516 |
34,887 |
|
TN |
7 |
0 |
3 |
3 |
- |
658 |
169 |
7,407 |
164 |
2 |
|
Electricity-Generating Sector |
|||||||
|
Number of Permits |
Permitted Emissions (tpy) |
Emissions (tpy) |
|||||
|
Tot |
Grn |
New |
Mod |
Grn |
New |
Mod |
|
|
31 |
10 |
12 |
1 |
7,970 |
14,664 |
4,545 |
12,005 |
|
18 |
0 |
9 |
3 |
- |
3,729 |
444 |
7,856 |
|
16 |
6 |
3 |
0 |
5,687 |
1,705 |
- |
12,413 |
|
19 |
4 |
3 |
3 |
3,151 |
674 |
1,780 |
35,071 |
|
13 |
5 |
2 |
2 |
2,285 |
625 |
235 |
13,848 |
|
61 |
29 |
11 |
8 |
8,119 |
2,636 |
5,563 |
23,297 |
|
36 |
4 |
3 |
0 |
5,688 |
9,153 |
- |
16,536 |
|
62 |
5 |
2 |
0 |
3,850 |
887 |
- |
101,286 |
|
12 |
0 |
3 |
0 |
- |
2,563 |
- |
15,868 |
|
3 |
1 |
2 |
0 |
1,284 |
433 |
- |
10,935 |
|
17 |
8 |
1 |
0 |
5,444 |
221 |
- |
16,930 |
|
557 |
166 |
104 |
39 |
119,977 |
63,637 |
24,090 |
677,206 |
|
33 |
15 |
11 |
1 |
5,349 |
5,236 |
892 |
235,480 |
|
18 |
4 |
1 |
3 |
1,962 |
559 |
929 |
178,812 |
|
66 |
29 |
12 |
13 |
22,507 |
3,214 |
20,826 |
310,279 |
|
16 |
6 |
3 |
0 |
4,431 |
1,418 |
- |
65,935 |
|
37 |
4 |
2 |
0 |
1,666 |
4,379 |
- |
330,587 |
|
19 |
0 |
13 |
4 |
- |
5,231 |
886 |
120,543 |
|
13 |
5 |
2 |
0 |
5,389 |
2,040 |
- |
274,309 |
|
62 |
5 |
2 |
0 |
4,149 |
346 |
- |
502,201 |
|
27 |
3 |
3 |
0 |
650 |
142 |
- |
275,072 |
|
3 |
1 |
2 |
0 |
2,032 |
643 |
- |
311,678 |
|
17 |
9 |
1 |
0 |
4,287 |
132 |
- |
402,124 |
|
13 |
0 |
3 |
0 |
- |
3,462 |
- |
557,700 |
|
4 |
1 |
2 |
0 |
782 |
737 |
- |
127,232 |
|
14 |
8 |
0 |
1 |
1,498 |
- |
247 |
34,541 |
|
572 |
180 |
108 |
46 |
120,370 |
45,036 |
31,234 |
7,193,141 |
|
28 |
14 |
11 |
1 |
2,407 |
2,237 |
259 |
9,080 |
|
55 |
30 |
9 |
7 |
2,706 |
672 |
1,125 |
11,419 |
|
14 |
0 |
8 |
2 |
- |
1,250 |
164 |
5,968 |
|
10 |
5 |
4 |
2 |
1,230 |
252 |
352 |
3,850 |
|
11 |
6 |
4 |
2 |
882 |
281 |
87 |
14,357 |
|
10 |
6 |
3 |
0 |
1,700 |
1,389 |
- |
12,090 |
|
8 |
5 |
3 |
0 |
1,966 |
676 |
- |
1,930 |
|
8 |
4 |
2 |
0 |
2,017 |
511 |
- |
19,393 |
|
3 |
0 |
3 |
0 |
- |
458 |
- |
16,562 |
|
1 |
1 |
1 |
0 |
214 |
54 |
- |
33,764 |
|
Manufacturing Sector |
||||||||||
|
Number of Permits |
Permitted Emissions (tpy) |
Census |
Emissions |
|||||||
|
State |
Tot |
Grn |
New |
Mod |
Grn |
New |
Mod |
Plants |
Plants |
tpy |
|
Particulate matter (PM10) continued |
||||||||||
|
VA |
7 |
0 |
3 |
4 |
- |
161 |
90 |
5,986 |
854 |
13,514 |
|
IN |
6 |
0 |
4 |
2 |
- |
472 |
253 |
9,303 |
456 |
14,689 |
|
MS |
6 |
2 |
1 |
3 |
111 |
13 |
116 |
3,008 |
103 |
7,712 |
|
TX |
5 |
0 |
3 |
2 |
- |
219 |
1,497 |
21,808 |
419 |
34,010 |
|
IA |
5 |
0 |
1 |
3 |
- |
197 |
628 |
3,749 |
32 |
7,379 |
|
SC |
5 |
3 |
3 |
0 |
282 |
86 |
- |
4,450 |
172 |
8,137 |
|
GA |
5 |
0 |
2 |
2 |
- |
55 |
236 |
9,083 |
145 |
29,335 |
|
CA |
5 |
0 |
0 |
2 |
- |
- |
222 |
49,418 |
1,520 |
15,891 |
|
Total |
207 |
14 |
99 |
80 |
1,067 |
11,656 |
13,936 |
363,753 |
15,397 |
606,681 |
|
Sulfur dioxide |
||||||||||
|
FL |
20 |
1 |
7 |
11 |
37 |
3,161 |
21,247 |
15,992 |
237 |
7,3497 |
|
AL |
14 |
0 |
7 |
6 |
- |
2,137 |
3,319 |
5,444 |
327 |
84,797 |
|
IL |
8 |
0 |
3 |
4 |
- |
16,392 |
2,747 |
17,953 |
1,130 |
240,356 |
|
WI |
8 |
2 |
4 |
2 |
82 |
685 |
104 |
9,936 |
637 |
80,598 |
|
LA |
7 |
0 |
5 |
2 |
- |
10,763 |
1,995 |
3,545 |
132 |
151,246 |
|
NC |
7 |
1 |
2 |
3 |
244 |
5,661 |
5,837 |
11,306 |
755 |
72,180 |
|
AR |
7 |
1 |
2 |
3 |
791 |
232 |
10,401 |
3,316 |
86 |
54,095 |
|
OH |
6 |
0 |
2 |
5 |
- |
1,590 |
2,719 |
17,974 |
334 |
330,991 |
|
IN |
6 |
1 |
3 |
2 |
39 |
384 |
2,400 |
9,303 |
330 |
125,434 |
|
TX |
5 |
0 |
3 |
2 |
- |
93 |
12,600 |
21,808 |
369 |
233,257 |
|
IA |
5 |
0 |
1 |
3 |
- |
5,913 |
2,132 |
3,749 |
30 |
67,285 |
|
TN |
5 |
0 |
2 |
3 |
- |
902 |
585 |
7,407 |
107 |
122,658 |
|
VA |
5 |
0 |
2 |
2 |
- |
612 |
117 |
5,986 |
664 |
97,063 |
|
Total |
131 |
8 |
58 |
54 |
1,206 |
53,725 |
68,349 |
363,753 |
9,776 |
2,914,441 |
|
Volatile organic compounds |
||||||||||
|
WI |
36 |
2 |
23 |
10 |
93 |
2,934 |
743 |
9,936 |
1,233 |
56,490 |
|
AL |
27 |
3 |
8 |
10 |
2,023 |
1,308 |
1,843 |
5,444 |
566 |
88,546 |
|
LA |
13 |
1 |
8 |
5 |
12 |
2,702 |
3,188 |
3,545 |
235 |
90,490 |
|
AR |
12 |
0 |
7 |
3 |
- |
1,696 |
837 |
3,316 |
117 |
33,988 |
|
FL |
12 |
1 |
5 |
3 |
16 |
420 |
1,990 |
15,992 |
507 |
18,622 |
|
NC |
11 |
0 |
7 |
3 |
- |
2,372 |
1,148 |
11,306 |
1,156 |
78,718 |
|
GA |
11 |
0 |
3 |
5 |
- |
448 |
1,316 |
9,083 |
227 |
32,111 |
|
IL |
10 |
0 |
4 |
7 |
- |
6,645 |
2,443 |
17,953 |
1,741 |
136,081 |
|
SC |
10 |
3 |
5 |
0 |
844 |
1,504 |
- |
4,450 |
187 |
46,631 |
|
KY |
9 |
1 |
2 |
4 |
107 |
609 |
4,116 |
4,218 |
559 |
57,951 |
|
MI |
8 |
0 |
5 |
2 |
- |
2,935 |
103 |
1,6045 |
765 |
71,594 |
|
MS |
8 |
1 |
4 |
3 |
678 |
501 |
1,148 |
3,008 |
188 |
39,079 |
|
OH |
8 |
0 |
2 |
5 |
- |
3 |
2,251 |
17,974 |
820 |
77,781 |
|
TX |
8 |
0 |
5 |
3 |
- |
405 |
1,451 |
21,808 |
568 |
192,080 |
|
VA |
8 |
0 |
3 |
4 |
- |
991 |
301 |
5,986 |
822 |
55,460 |
|
Electricity-Generating Sector |
|||||||
|
Number of Permits |
Permitted Emissions (tpy) |
Emissions (tpy) |
|||||
|
Tot |
Grn |
New |
Mod |
Grn |
New |
Mod |
|
|
17 |
8 |
5 |
1 |
1,547 |
417 |
115 |
4,825 |
|
8 |
7 |
1 |
0 |
1,436 |
22 |
- |
13,307 |
|
11 |
8 |
3 |
0 |
1,497 |
848 |
- |
1,964 |
|
5 |
3 |
2 |
0 |
702 |
139 |
- |
23,372 |
|
3 |
1 |
2 |
0 |
213 |
93 |
- |
3,020 |
|
2 |
2 |
0 |
0 |
266 |
- |
- |
7,208 |
|
10 |
8 |
2 |
1 |
1,296 |
353 |
438 |
8,519 |
|
4 |
3 |
1 |
0 |
452 |
38 |
- |
3,283 |
|
303 |
156 |
85 |
34 |
30,119 |
11,358 |
3,822 |
35,1410 |
|
53 |
27 |
11 |
7 |
5,991 |
616 |
20457 |
698,288 |
|
15 |
8 |
5 |
1 |
945 |
9,365 |
324 |
568,542 |
|
7 |
4 |
2 |
0 |
383 |
5,632 |
- |
833,311 |
|
14 |
0 |
9 |
2 |
- |
1,588 |
148 |
238,313 |
|
3 |
1 |
1 |
1 |
215 |
3 |
21 |
131,565 |
|
9 |
4 |
3 |
0 |
1,125 |
576 |
- |
478,640 |
|
7 |
3 |
2 |
0 |
198 |
137 |
- |
85,554 |
|
3 |
0 |
2 |
0 |
- |
10,503 |
- |
1,491,039 |
|
7 |
7 |
0 |
0 |
771 |
- |
- |
986,065 |
|
5 |
3 |
2 |
0 |
312 |
122 |
- |
684,100 |
|
1 |
0 |
1 |
0 |
- |
0 |
- |
173,424 |
|
2 |
1 |
1 |
0 |
428 |
95 |
- |
546,745 |
|
14 |
7 |
5 |
1 |
657 |
357 |
14 |
215,026 |
|
244 |
126 |
68 |
22 |
43,919 |
37,075 |
25,334 |
13,421,975 |
|
16 |
0 |
10 |
3 |
- |
344 |
185 |
942 |
|
22 |
11 |
7 |
1 |
1,983 |
853 |
598 |
2,991 |
|
7 |
3 |
3 |
1 |
94 |
97 |
97 |
14,964 |
|
8 |
5 |
3 |
0 |
733 |
857 |
- |
1,390 |
|
51 |
27 |
8 |
5 |
1,224 |
211 |
313 |
4,279 |
|
11 |
5 |
3 |
2 |
177 |
73 |
23 |
3,504 |
|
9 |
4 |
3 |
0 |
303 |
114 |
- |
1,236 |
|
7 |
4 |
3 |
0 |
792 |
252 |
- |
6,198 |
|
2 |
2 |
0 |
0 |
607 |
- |
- |
524 |
|
5 |
4 |
1 |
0 |
1,245 |
24 |
- |
1,541 |
|
15 |
6 |
7 |
3 |
873 |
454 |
65 |
3,819 |
|
10 |
7 |
3 |
0 |
731 |
797 |
- |
3,355 |
|
2 |
0 |
1 |
0 |
- |
39 |
- |
2,089 |
|
6 |
3 |
2 |
0 |
441 |
55 |
- |
22,749 |
|
15 |
8 |
5 |
1 |
956 |
98 |
83 |
1,519 |
ing sector and 9.0-25.6% in the electricity-generating sector were issued for modifications, depending on the pollutant. Thus, in both sectors, the number of permits issued for modifications is less than the number issued for either new facilities at existing locations or new and greenfield facilities combined.
Typically, only a few states contribute substantially to the national total emissions associated with permits for modifications for a given pollutant and sector. For example, for NOx, five states (Florida, Arkansas, Texas, Ohio, and Alabama) contribute 61.4% of the total emissions associated with such permits in the manufacturing sector, whereas a different set of five states (Alabama, Illinois, Wisconsin, Florida, and Ohio) contribute 47.8% of the total permitted emissions associated with modifications in the electricity-generating sector. For SO2, only three states (Florida, Texas, and Arkansas) contribute 64.7% to emissions associated with modification permits in the manufacturing sector, and Florida alone contributes 80.7% to the total emissions for modification permits in the electricity-generating sector. In general, in the manufacturing sector, the top five states shown in Table 3-1 contribute 55.4-78.1% of the national emissions associated with permits for modifications. Similarly, the top five states contribute 47.8-82.8% of the emissions associated with modification permits in the electricity-generating sector. Therefore, in general, a substantial portion of the total emissions associated with permits for modifications can be attributed to a relatively small number of states.
|
Electricity-Generating Sector |
|||||||
|
Number of Permits |
Permitted Emissions (tpy) |
Emissions (tpy) |
|||||
|
Tot |
Grn |
New |
Mod |
Grn |
New |
Mod |
|
|
7 |
7 |
0 |
0 |
573 |
- |
- |
2,712 |
|
4 |
1 |
1 |
0 |
42 |
20 |
- |
2,788 |
|
2 |
1 |
1 |
0 |
99 |
58 |
- |
7,393 |
|
1 |
1 |
0 |
0 |
59 |
- |
- |
613 |
|
279 |
133 |
79 |
29 |
17,087 |
5,187 |
1,667 |
160,666 |
|
ABBREVIATIONS: Census plants = number of establishments in manufacturing industries in state, taken from 1997 Economic Census; emissions = 1997 EPA point-source emission data (unpublished, not 1996 National Emissions Inventory [NEI] data), includes number of plants with any emissions of this pollutant and total emissions; Grn = Greenfield; Mod = modification; New = new unit at existing plant; Tot = total; tpy = tons per year. |
|||||||
Alabama, Arkansas, Florida, Ohio, North Carolina, and Texas have substantial permitting activity in the manufacturing sector for modifications for three or more of the five pollutants listed in Table 3-1. Alabama, Florida, Louisiana, and Wisconsin have substantial permitting activity for modifications in the electricity-generating sector for three or more pollutants.
Table 3-2 provides examples of the distribution of NSR permits among selected industries and states for five pollutants in the manufacturing sector. For example, for NOx, the paper and allied products industry contributed about 21.7% to the emissions associated with permits for modifications, and the largest share of the activity for this industry was in North Carolina. For SO2, the chemical and allied products industry and the paper and allied products industry combined for 57.5% of the total emissions associated with permits for modifications in the manufacturing sector. Most of that activity was in Florida, Arkansas, and North Carolina. For PM10, the two industries combined account for about half the total emissions associated with permits for modifications in the manufacturing sectors, with only a handful of states (e.g., Alabama, North Carolina, Kentucky, and Florida) contributing substantial shares. The primary metal industries and the paper and chemical industries had substantial permitting activity for CO, including permits for modifications totaling 1,000 tons/year or more in six states. VOC emissions tend to be dispersed among many industries. The paper and allied products industry contributed 28.3% of the total emissions associated with permits for modifications; a large share of the industry total was in
TABLE 3-2 NSR Permit Activity by Pollutant, 1997-2002, Selected Manufacturing Industriesa
|
State |
Number of Permits |
Permitted Emissions (tpy) |
Census |
Emissions |
Emissions |
|||||
|
Tot |
Grn |
New |
Mod |
Grn |
New |
Mod |
Plants |
Plants |
||
|
Carbon monoxide |
||||||||||
|
|
SIC 26: Paper and Allied Products |
|||||||||
|
AL |
5 |
1 |
2 |
2 |
215 |
2,811 |
1,555 |
19 |
21 |
5,3208 |
|
AR |
3 |
0 |
1 |
2 |
- |
917 |
3,920 |
8 |
7 |
3,2977 |
|
NC |
3 |
0 |
1 |
2 |
- |
8,678 |
3,920 |
14 |
29 |
1,7926 |
|
WI |
3 |
0 |
3 |
0 |
- |
1,305 |
- |
51 |
89 |
24,496 |
|
GA |
2 |
0 |
2 |
1 |
- |
707 |
185 |
25 |
21 |
142,217 |
|
Total |
20 |
1 |
12 |
8 |
215 |
25,626 |
9,148 |
543 |
722 |
552,075 |
|
|
SIC 28: Chemicals and Allied Products |
|||||||||
|
LA |
5 |
0 |
4 |
1 |
- |
464 |
263 |
16 |
90 |
448,938 |
|
AL |
3 |
0 |
2 |
1 |
- |
239 |
578 |
12 |
27 |
46465 |
|
KY |
2 |
0 |
1 |
0 |
- |
473 |
- |
11 |
45 |
1,125 |
|
MI |
2 |
0 |
1 |
1 |
- |
865 |
863 |
48 |
47 |
1,289 |
|
TX |
2 |
0 |
2 |
0 |
- |
334 |
- |
94 |
184 |
265,755 |
|
Total |
20 |
0 |
13 |
7 |
0 |
2,761 |
7,719 |
1,733 |
1,518 |
1,255,846 |
|
|
SIC 20: Petroleum and Coal Products |
|||||||||
|
LA |
3 |
0 |
1 |
2 |
- |
297 |
1,828 |
54 |
25 |
78,071 |
|
IL |
2 |
0 |
0 |
2 |
- |
- |
38 |
93 |
152 |
2,945 |
|
TX |
2 |
0 |
2 |
0 |
- |
725 |
- |
194 |
38 |
41,077 |
|
Total |
9 |
0 |
4 |
4 |
0 |
1,070 |
1,866 |
2,074 |
1,500 |
460,508 |
|
|
SIC 33: Primary Metal Industries |
|||||||||
|
WI |
8 |
0 |
3 |
5 |
- |
526 |
2875 |
6 |
77 |
14,067 |
|
AL |
3 |
0 |
2 |
1 |
- |
2,239 |
37 |
11 |
45 |
38,900 |
|
AR |
3 |
1 |
1 |
1 |
3,694 |
753 |
3,942 |
7 |
10 |
6,055 |
|
IN |
2 |
0 |
1 |
1 |
- |
585 |
272 |
18 |
54 |
193,361 |
|
NC |
2 |
0 |
1 |
1 |
- |
4,380 |
436 |
1 |
20 |
6,568 |
|
OH |
2 |
0 |
1 |
2 |
- |
5 |
4,201 |
29 |
52 |
572,213 |
|
OR |
2 |
0 |
0 |
2 |
- |
- |
2,521 |
5 |
15 |
5,947 |
|
TN |
2 |
0 |
0 |
1 |
- |
- |
192 |
9 |
14 |
12,386 |
|
VA |
2 |
0 |
1 |
1 |
- |
3,473 |
341 |
4 |
21 |
2,340 |
|
Total |
35 |
2 |
13 |
19 |
3,880 |
15,843 |
16,820 |
287 |
893 |
1,658,200 |
|
|
SIC 37: Transportation Equipment |
|||||||||
|
AL |
3 |
1 |
2 |
0 |
171 |
482 |
- |
6 |
8 |
409 |
|
Total |
3 |
1 |
2 |
0 |
171 |
482 |
0 |
355 |
593 |
1,7434 |
|
Nitrogen oxides |
||||||||||
|
|
SIC 26: Paper and Allied Products |
|||||||||
|
AL |
5 |
1 |
2 |
2 |
129 |
1,715 |
1,723 |
19 |
19 |
31,516 |
|
WI |
3 |
0 |
3 |
0 |
- |
324 |
- |
51 |
90 |
28,858 |
|
State |
Number of Permits |
Permitted Emissions (tpy) |
Census |
Emissions |
Emissions |
|||||
|
Tot |
Grn |
New |
Mod |
Grn |
New |
Mod |
Plants |
Plants |
||
|
Nitrogen oxides |
||||||||||
|
|
SIC 26: Paper and Allied Products |
|||||||||
|
AR |
2 |
0 |
1 |
1 |
- |
86,264 |
711 |
8 |
7 |
18,523 |
|
GA |
2 |
0 |
2 |
1 |
- |
386 |
125 |
25 |
21 |
34,011 |
|
NC |
2 |
0 |
0 |
2 |
- |
- |
4,071 |
14 |
30 |
13,897 |
|
Total |
21 |
1 |
11 |
9 |
129 |
92,724 |
7,903 |
543 |
786 |
318,804 |
|
|
SIC 28: Chemicals and Allied Products |
|||||||||
|
LA |
8 |
1 |
6 |
0 |
186 |
1,813 |
- |
16 |
93 |
73,815 |
|
FL |
7 |
0 |
3 |
3 |
- |
226 |
180 |
69 |
36 |
8,974 |
|
AL |
5 |
0 |
3 |
1 |
- |
405 |
251 |
12 |
35 |
8,022 |
|
AR |
2 |
0 |
0 |
1 |
- |
- |
1,091 |
8 |
14 |
4,688 |
|
KY |
2 |
0 |
1 |
0 |
- |
229 |
- |
11 |
48 |
5,564 |
|
TX |
2 |
0 |
2 |
0 |
- |
236 |
- |
94 |
182 |
109,926 |
|
Total |
34 |
1 |
20 |
8 |
186 |
4,038 |
2,023 |
1,739 |
1,638 |
416,235 |
|
|
SIC 29: Petroleum and Coal Products |
|||||||||
|
LA |
8 |
0 |
3 |
4 |
- |
201 |
2,499 |
54 |
29 |
47,242 |
|
CA |
2 |
0 |
0 |
0 |
- |
- |
- |
205 |
171 |
29,212 |
|
IL |
2 |
0 |
0 |
2 |
- |
- |
151 |
93 |
163 |
29,361 |
|
MN |
2 |
0 |
1 |
1 |
- |
109 |
106 |
29 |
59 |
5,540 |
|
TX |
2 |
0 |
2 |
0 |
- |
1,857 |
- |
194 |
38 |
102,101 |
|
Total |
18 |
0 |
7 |
7 |
0 |
2,258 |
2,756 |
2,074 |
1,600 |
321,098 |
|
|
SIC 33: Primary Metals Industries |
|||||||||
|
WI |
5 |
0 |
3 |
2 |
- |
592 |
360 |
6 |
85 |
3,577 |
|
AL |
3 |
0 |
2 |
1 |
- |
1,019 |
37 |
11 |
40 |
5,984 |
|
OH |
3 |
0 |
2 |
2 |
- |
37 |
384 |
29 |
54 |
13,659 |
|
TN |
3 |
0 |
1 |
2 |
- |
197 |
338 |
9 |
13 |
3,239 |
|
AR |
2 |
1 |
0 |
1 |
406 |
- |
749 |
7 |
11 |
1,728 |
|
IN |
2 |
0 |
1 |
1 |
- |
54 |
36 |
18 |
58 |
16,871 |
|
OR |
2 |
0 |
0 |
2 |
- |
- |
571 |
5 |
16 |
1,367 |
|
SC |
2 |
1 |
1 |
0 |
2 |
347 |
- |
11 |
8 |
757 |
|
VA |
2 |
0 |
1 |
1 |
- |
798 |
296 |
4 |
24 |
1,001 |
|
Total |
31 |
2 |
14 |
15 |
409 |
4,154 |
3,063 |
287 |
1033 |
150,948 |
|
|
SIC 37: Transportation Equipment |
|||||||||
|
AL |
4 |
2 |
2 |
0 |
158 |
342 |
- |
6 |
6 |
168 |
|
Total |
7 |
2 |
3 |
0 |
158 |
1,422 |
0 |
355 |
669 |
2,6754 |
|
Particulate matter (PM10) |
||||||||||
|
|
SIC 26: Paper and Allied Products |
|||||||||
|
AL |
6 |
1 |
2 |
3 |
46 |
284 |
1,078 |
19 |
22 |
10,367 |
|
WI |
5 |
0 |
5 |
0 |
- |
211 |
- |
51 |
75 |
1,307 |
|
State |
Number of Permits |
Permitted Emissions (tpy) |
Census |
Emissions |
Emissions |
|||||
|
Tot |
Grn |
New |
Mod |
Grn |
New |
Mod |
Plants |
Plants |
||
|
Particulate matter (PM10) |
||||||||||
|
|
SIC 26: Paper and Allied Products |
|||||||||
|
GA |
3 |
0 |
2 |
1 |
- |
55 |
17 |
25 |
17 |
12,643 |
|
LA |
3 |
0 |
2 |
1 |
- |
994 |
4 |
12 |
14 |
8,631 |
|
KY |
2 |
0 |
0 |
1 |
- |
- |
603 |
9 |
17 |
716 |
|
NC |
2 |
0 |
0 |
2 |
- |
- |
801 |
14 |
34 |
4,608 |
|
Total |
28 |
1 |
15 |
11 |
46 |
2,399 |
3,027 |
543 |
728 |
85,440 |
|
|
SIC 28: Chemicals and Allied Products |
|||||||||
|
FL |
15 |
0 |
7 |
7 |
- |
651 |
587 |
69 |
42 |
1,306 |
|
LA |
6 |
1 |
4 |
0 |
14 |
184 |
- |
16 |
82 |
6,882 |
|
AL |
4 |
0 |
1 |
2 |
- |
13 |
262 |
12 |
50 |
1,762 |
|
KY |
4 |
0 |
2 |
1 |
- |
111 |
131 |
11 |
59 |
1,563 |
|
Total |
36 |
1 |
18 |
13 |
14 |
1,044 |
3,524 |
1,733 |
1,769 |
80,166 |
|
|
SIC 29: Petroleum and Coal Products |
|||||||||
|
LA |
8 |
0 |
3 |
5 |
- |
46 |
419 |
54 |
26 |
5,337 |
|
IL |
2 |
0 |
0 |
2 |
- |
- |
18 |
93 |
196 |
5,999 |
|
TX |
2 |
0 |
2 |
0 |
- |
207 |
- |
194 |
38 |
8,954 |
|
Total |
14 |
0 |
6 |
7 |
0 |
280 |
437 |
2,074 |
1,709 |
53,767 |
|
|
SIC 33: Primary Metal Industries |
|||||||||
|
WI |
11 |
0 |
6 |
7 |
- |
255 |
230 |
6 |
90 |
3,185 |
|
TN |
4 |
0 |
1 |
2 |
- |
475 |
160 |
9 |
16 |
3,096 |
|
AL |
3 |
0 |
2 |
1 |
- |
132 |
6 |
11 |
72 |
8,513 |
|
AR |
|
1 |
1 |
1 |
247 |
4 |
108 |
7 |
10 |
424 |
|
OH |
3 |
0 |
2 |
2 |
- |
21 |
389 |
29 |
92 |
13,296 |
|
VA |
3 |
0 |
1 |
2 |
- |
135 |
64 |
4 |
23 |
1,426 |
|
IN |
2 |
0 |
1 |
1 |
- |
24 |
22 |
18 |
69 |
9,363 |
|
NC |
2 |
0 |
2 |
0 |
- |
238 |
- |
1 |
24 |
391 |
|
SC |
2 |
1 |
2 |
0 |
2 |
84 |
- |
11 |
7 |
368 |
|
Total |
43 |
3 |
20 |
21 |
354 |
1,429 |
1,391 |
290 |
1,134 |
114,932 |
|
|
SIC 37: Transportation Equipment |
|||||||||
|
AL |
2 |
1 |
1 |
0 |
41 |
37 |
- |
6 |
10 |
225 |
|
Total |
4 |
2 |
1 |
1 |
47 |
37 |
13 |
342 |
695 |
7,424 |
|
Sulfur dioxide |
||||||||||
|
|
SIC 26: Paper and Allied Products |
|||||||||
|
AL |
6 |
0 |
1 |
4 |
- |
799 |
2,660 |
19 |
18 |
33,294 |
|
NC |
3 |
0 |
1 |
2 |
- |
5,277 |
5,729 |
14 |
26 |
20,766 |
|
FL |
2 |
0 |
1 |
1 |
- |
241 |
40 |
10 |
11 |
26,260 |
|
GA |
2 |
0 |
2 |
1 |
- |
203 |
5 |
25 |
17 |
55,075 |
|
State |
Number of Permits |
Permitted Emissions (tpy) |
Census |
Emissions |
Emissions |
|||||
|
Tot |
Grn |
New |
Mod |
Grn |
New |
Mod |
Plants |
Plants |
||
|
Sulfur dioxide |
||||||||||
|
|
SIC 26: Paper and Allied Products |
|||||||||
|
WI |
2 |
0 |
2 |
0 |
- |
435 |
- |
51 |
76 |
66,055 |
|
Total |
22 |
0 |
9 |
10 |
0 |
8,346 |
9,107 |
543 |
592 |
496,155 |
|
|
SIC 28: Chemicals and Allied Products |
|||||||||
|
FL |
13 |
0 |
4 |
8 |
- |
2,787 |
18,219 |
69 |
30 |
35,453 |
|
AR |
2 |
0 |
0 |
1 |
- |
- |
10,085 |
8 |
11 |
11,525 |
|
LA |
2 |
0 |
2 |
0 |
- |
8,516 |
- |
16 |
60 |
56,819 |
|
Total |
22 |
0 |
10 |
11 |
0 |
12,299 |
30,207 |
1,715 |
1,174 |
532,117 |
|
|
SIC 29: Petroleum and Coal Products |
|||||||||
|
LA |
4 |
0 |
2 |
2 |
|
874 |
1,995 |
54 |
22 |
76,080 |
|
CA |
2 |
0 |
0 |
0 |
|
- |
- |
205 |
95 |
29,875 |
|
IL |
2 |
0 |
0 |
2 |
|
- |
305 |
93 |
125 |
125,222 |
|
TX |
2 |
0 |
2 |
0 |
|
91 |
- |
194 |
37 |
90,754 |
|
Total |
11 |
0 |
5 |
4 |
|
1,005 |
2,300 |
2,074 |
1,444 |
569,478 |
|
|
SIC 33: Primary Metal Industries |
|||||||||
|
WI |
4 |
0 |
2 |
2 |
- |
251 |
104 |
6 |
77 |
1,360 |
|
AL |
3 |
0 |
2 |
1 |
- |
734 |
0 |
11 |
48 |
19,169 |
|
OH |
3 |
0 |
1 |
2 |
- |
685 |
77 |
29 |
51 |
190,521 |
|
TN |
3 |
0 |
1 |
2 |
- |
122 |
560 |
9 |
9 |
6,419 |
|
AR |
2 |
1 |
0 |
1 |
791 |
- |
296 |
7 |
9 |
31,981 |
|
IN |
2 |
0 |
1 |
1 |
- |
39 |
20 |
18 |
68 |
33,368 |
|
SC |
2 |
1 |
1 |
0 |
0 |
193 |
- |
11 |
8 |
3,597 |
|
VA |
2 |
0 |
1 |
1 |
- |
596 |
100 |
4 |
22 |
5,590 |
|
Total |
27 |
2 |
11 |
13 |
792 |
3,486 |
1,224 |
287 |
767 |
610,893 |
|
|
SIC 37: Transportation Equipment |
|||||||||
|
AL |
1 |
0 |
1 |
0 |
- |
3 |
- |
6 |
3 |
354 |
|
Total |
1 |
0 |
1 |
0 |
0 |
3 |
0 |
342 |
427 |
40,094 |
|
Volative organic compounds |
||||||||||
|
|
SIC 26: Paper and Allied Products |
|||||||||
|
WI |
11 |
0 |
6 |
4 |
- |
537 |
299 |
51 |
108 |
14,534 |
|
AL |
5 |
1 |
1 |
3 |
637 |
140 |
327 |
19 |
26 |
25,541 |
|
AR |
3 |
0 |
2 |
0 |
- |
593 |
- |
8 |
7 |
9,333 |
|
GA |
3 |
0 |
0 |
0 |
- |
- |
- |
25 |
23 |
10,913 |
|
LA |
3 |
0 |
2 |
1 |
- |
957 |
2,624 |
12 |
15 |
14,325 |
|
MN |
3 |
0 |
2 |
0 |
- |
543 |
- |
11 |
19 |
5,530 |
|
NC |
3 |
0 |
1 |
2 |
- |
24 |
817 |
14 |
38 |
10,001 |
|
FL |
2 |
0 |
1 |
0 |
- |
64 |
- |
10 |
13 |
4,203 |
Louisiana and Kentucky. In general, permitting activity for modifications is distributed among a number of industries and states. The key inferences from the available data suggest that the following industries have substantial NSR permitting activity for modifications, whether measured in terms of the number of permits or permitted emissions: electricity generation; paper and allied product; and chemicals and allied products. Other industries that appear to be of secondary importance with respect to permitting activity include stone, clay, and glass products; primary metal industries; and food and kindred products.
Although the mix of industries appears to be widely different, the emission processes are often qualitatively similar across industries. For example, many industries use common unit operations, such as industrial furnaces, to generate steam for process use. Some industries—such as stone, clay, and glass products—use tunnel or rotary kilns, which are specialized combustion-based equipment for heating specific types of materials (EPA 1995a). Thus, although the specific design and duty cycle may differ, there are similarities in combustion principles and factors that govern pollutant formation and control. For example, the NOx formation mechanisms and control strategies are similar for cement kilns, glass melting, and industrial boilers and include thermal and fuel NOx formation (if a nitrogen-bearing fuel is used), combustion-based controls, and postcombustion controls (EPA 1994a,b,c). Of course, not all the emission sources are combustion based. To provide a more-thorough assessment of specific emission technologies, later sections of this chapter review specific types of process facilities and their unit operations.
Several states provided summary information to the committee regarding NSR, but the summaries typically did not distinguish among permits for new sources and permits for modifications of existing sources, so permitting activity for modifications cannot be readily inferred from the information. For example, in Louisiana, the largest share of all permits was issued for chemical manufacturing, power generation, refining, paper and allied products, and inorganic-chemical industries. The industrial mix in Louisiana is somewhat unusual because of the large industrial presence in such areas as those around the lower Mississippi River and Lake Charles. In New Jersey, permits have been issued for power generation, chemical and allied industries, petroleum refining, and others. The sources permitted in New Jersey have included combustion turbines, boilers, engines, and fluidized catalytic cracker units. However, the industries identified in the Louisiana and New Jersey surveys as being of greatest importance with respect to permitting activity are qualitatively consistent with those identified in the EPA summary.
The use of data such as in Appendix D is one approach to identifying priorities among industries subject to NSR for modifications. However,
another approach is to select industries that illustrate the complexity of the technology choices that are associated with decisions regarding common repairs and replacements. Furthermore, some industries are regionally important. For example, the petroleum-refining and pulp and paper industries provide useful case studies regarding the myriad of unit operations that are subject to repairs and replacement. Such industries also illustrate that many unit operations or processes are common to multiple industries. For example, industrial boilers are commonly used to boil water to produce steam in many industries. In addition to industrial boilers, industrial process heaters are used to heat raw materials, such as crude oil or intermediate products for processing or distillation. Industrial heaters often exhibit emissions that are similar to those from industrial boilers. The fuel used for industrial heaters and boilers differs among industries. Natural gas is predominant in the chemical industry, fuel gas and natural gas in petroleum refining, and coal, tire chips, “bark” (waste wood, such as stumps), and “black liquor” (lignin that has been separated from cellulose) in the pulp industry. On the basis of review of available summaries of data on permits and the evaluation of other factors, such as representativeness of the complexity of technology characteristics and options, several industries and emission sources were identified as having high priority for characterization and evaluation, including electricity generation, petroleum refining, and paper and allied products. Furthermore, because industrial boilers are common to many industries, they are also characterized.
Systematic data are not available from which to assess the claim of foregone opportunities for facilities that are claimed to have refrained from making modifications for fear of triggering a requirement to obtain an NSR permit. Anecdotal examples were presented to the committee, but there are often inadequate details on the examples. Furthermore, the committee cannot use anecdotes as the basis of generally valid inferences.
The committee also considered use of the generating availability data system (GADS) produced by the North American Electric Reliability Council (NERC). The GADS includes design data, and performance and event data. The former are publicly available, and the latter are available only with special permission. The publicly available design data provide information regarding overall average rates of the forced and scheduled outages, as well as deratings, for power plants. Also, summary data regarding the top 25 individual “cause codes,” which briefly indicate the reason or purpose of the outage, are available. That information provides insight regarding failures or replacement activities at power plants (for example, the largest sources of average megawatt (MW) hours lost per outage for fossil-fuel-fired power plants of 300-399 MW capacity included major turbine overhaul, major boiler overhaul, and various forms of generator overhaul) but does not
directly provide insight regarding choices to forego opportunities that might have prevented or reduced the frequency of some of these occurrences.
There are several key conclusions from the review of permitting activity. Most permits are for greenfield facilities or new facilities at existing locations. Permits for modifications involve only 1-2% of total emissions for most pollutants in either the manufacturing or electricity-generating sector (including facilities that did not receive a permit in that period). There is somewhat more permitting activity for modifications, as measured by emissions and number of permits, in the manufacturing sector, but the activity in the two sectors is often of a similar order of magnitude. Although there are systematic data available from which to make assessments of permitting activity, no systematic data available from which to assess the opportunity costs of facility decisions not to make modifications.
STATE PERMITTING PROGRAMS—STATUS OF NEW SOURCE REVIEW IMPLEMENTATION
The purpose of this section is to provide an overview of the current status of NSR implementation. Because there is no national clearinghouse on NSR permitting activity or the status of the NSR permitting programs in each state, the committee asked the State and Territorial Air Pollution Program Administrators and the Association of Local Air Pollution Control Officials (STAPPA/ALAPCO—referred to in this report as STAPPA) about the current state of NSR implementation. STAPPA provided the following types of information from state and local agencies:4
-
Format in which data are archived for major and minor air permits, including NSR. Formats include paper files, electronic databases, and others.
-
Key industries in the state in terms of emissions and permitting activity.
-
Descriptions of electronic databases of emission and permit data, such as data categories and the period over which records are kept.
-
Status of NSR implementation, including whether the state is implementing the NSR reforms, implementing the prerevision NSR, or implementing a hybrid that includes combinations of both. Furthermore, comment was requested as to the state’s future plans.
There are several key findings from the information provided by STAPPA. There is no consistency in how permits are archived or how such information can be retrieved. For example, some states, such as Alabama
and Iowa, have primarily a paper-based system, and other states, such as Alaska, Mississippi, and Maryland, have various types of electronic approaches. Some of the latter involve converting permit files to electronic format and posting them on the internet, and others involve the use of electronic databases to store permit tracking data or emission data. It would be difficult and time consuming to do a systematic survey of the permits themselves given the lack of uniformity of the archival method and the format in which information is stored.
The states that reported the status of their NSR programs essentially confirmed information provided in Chapter 2 regarding how the “unapproved” versus “approved” states handle their NSR programs. Unapproved here refers to states that are either “not approved but delegated” (often referred to simply as delegated) or “not approved and not delegated.” For an approved state, the NSR program is approved as part of the state implementation plan (SIP), so the state fully administers the NSR program. For a “not approved but delegated” state, EPA allows the state to do the day-by-day work of running the program, but the state is ultimately subject to EPA supervision.
For example, Alaska has adopted the new federal NSR rules by reference, whereas Alabama continues to use the prerevision NSR rules. Many states reported that they are awaiting finality on the federal rules given the uncertainty caused by litigation pertaining to the NSR reforms. In short, there is wide variation in the current status of NSR among the states. Because many states have not fully implemented the NSR reforms and because the reforms are relatively recent, there is little or no track record of permitting under the reforms. In turn, there is little empirical basis on which to assess the effect of the reforms. The available information is anecdotal and incomplete. A key logistical aspect of permitting under the reform is to require companies to provide data to support their claims regarding use rates under the baseline part of the rule.
As a followup, several members of the committee obtained additional information from permitting officials in several states, including Illinois, Kentucky, Michigan, New Jersey, New Hampshire, Ohio, and Washington.5 It appears from the comments of those officials that the NSR rule changes have not yet had a substantial effect. In many cases, the same or similar outcome is reported under the prerevision and revised NSR rules. In some cases, state regulators have advised industries to apply under the prerevision rules or the industry has preferred to do so because of the greater familiarity and certainty associated with the prerevision process. Some companies voluntarily retrofit emission controls to make them similar to what would
be required under NSR or agree to restrictions to avoid emission increases associated with a modification that would trigger NSR. The uncertainty about the legal status of the new rules may also be inhibiting their use and causing a preference for the prerevision rules where possible. One state commented that the equipment replacement provision (ERP) would be difficult to implement because it would require financial accounting capabilities that the state environmental agencies typically do not have.
In many states, facilities need to get a minor state permit for construction even if they do not need an NSR permit. The minor permits often include requirements for control technology similar to that required under NSR, such as BACT. Thus, it is possible in some states that facility changes that might not trigger NSR could trigger the need for a minor permit, which in some cases might be of equivalent stringency. Getting a minor permit instead of an NSR permit appears to be generally more desirable to facilities because of the greater delays and expense associated with the NSR permit process, which can involve long public comment and greater documentation than a minor permit.
Some states are using a common electronic database system that assists in processing permit applications, tracking permits, and filing documents. Seven states are using it or considering using it: Kentucky, Mississippi, New Mexico, Louisiana, New Jersey, Indiana, and Maryland.
In summary, there is substantial variation among states regarding the implementation status of NSR reforms, the existence of a minor permitting program that might cover modifications that are not covered under the NSR reforms, experience with reforms where they have been implemented, and the recording and archiving of information. There is some promise that several states are adopting a common framework for electronic management of permits. There appears to be some reluctance by some states and even some facilities to conduct permitting under the new rules until the uncertainty associated with litigation over the reforms subsides. Thus, a complicated context surrounding the state of evidence regarding the effects of NSR revisions makes it difficult to conduct a systematic empirically based assessment.
PROCESS TECHNOLOGIES OF EMISSION SOURCES: PROCESS DESCRIPTION, REPAIRS AND REPLACEMENT, AND POLLUTION-PREVENTION AND -CONTROL APPROACHES
The purpose of this section is to describe the major components of emission sources that are most relevant to NSR permitting decisions pertaining to repair and replacement. An understanding of the typical facilities in several key industries is needed to assess the effect of changes in NSR on emissions and energy use from these sectors. Thus, the focus is on
components that are most commonly subject to common repair and the potential for more substantial replacements. Typical pollution-prevention and -control strategies are also identified. Because the number of industries affected by NSR is potentially large, it was deemed infeasible to provide a comprehensive survey of all industries. However, selected industries that either represent a high frequency of permitting activity or contain emission processes typical of many industries are reviewed here. For example, electricity-generating power plants are among the source categories for which there is a relatively high frequency of NSR permits associated with modifications. Other industries, such as petroleum refining and paper, are important in selected regions of the country. However, those types of industries include emission processes, such as industrial furnaces, that are common to many industries. Thus, the review provided here is intended to furnish a technical foundation for identifying issues pertaining to typical repair and replacement and their implications for cost, emissions, and other effects.
There are no standard ways among industries of reporting process design, repair, and replacement practices, and performance and cost information. Classification schemes may differ among industries because of differences in feedstocks, process configurations, and constituent unit operations and because of industry-specific practices and metrics. Thus, in presenting information regarding specific industries in later sections of this chapter, we tend to adhere to terminology, flowsheets, repair and replacement practices, and technology options that are tailored to these industries. For each of the industries described here, there is a representative flowsheet of the process technologies and a narrative that highlights key NSR-relevant technological characteristics.
Electricity-Generating Facilities
According to 2002 national emission estimates, electricity-generating facilities each year emit about 4.7 million tons of NOx, 10.3 million tons of SO2, 52,000 tons of VOCs, 499,000 tons of CO, and 582,000 tons of PM2.5 (EPA 2004e). Most electricity-generating facilities’ NOx emissions are from coal-fired power plants, including bituminous- and subbituminous-coal plants, and natural-gas-fired plants. SO2 emissions are primarily from bituminous-coal-fired plants, with smaller contributions from other ranks of coal and from other fuels. VOC emissions from power plants tend to be lower than from other sources because of the high combustion efficiency relative to other types of energy-conversion systems (such as internal-combustion engines) and because evaporative emissions at other sources contribute to national totals. Similarly, CO emissions from electricity-generating facilities are a small fraction (<1%) of national emissions and are associated mostly with coal and natural gas. Coal accounts for most of the estimated PM2.5
emissions from electricity-generating facilities, which in turn represent less than 10% of the estimated national PM2.5 emissions. However, these data are for primary emissions and do not include formation of secondary PM2.5 in the atmosphere. Key pollutants of concern for electricity-generating facilities from a health perspective tend to be NOx and SO2 because they are important contributors to concentrations of airborne PM2.5 and ozone (see Chapter 7). Coal and natural gas are the fuels of greatest interest with respect to this mix of key pollutants. Therefore, this section focuses on identifying the characteristics of typical coal-fired and natural-gas-fired electricity-generating facilities for purposes of identifying the typical repair and replacement issues for such facilities.
Typical Electricity-Generating Power-Plant Designs
There are many varieties of power-plant design for both coal- and natural-gas-fueled systems. For example, for coal-fired power plants, the choice of an appropriate furnace design and the design of other plant components often depends at least to some extent on the rank of the coal and its properties. The choice of furnace design can influence baseline emission rates. For example, tangentially fired furnaces promote the formation of a rotating fireball in a furnace, so their NOx emissions are different from those from a wall-fired boiler. Operational practices, such as optimization of fuel and air ratios, also influence emissions; a well-tuned furnace can have substantially lower NOx emissions than one that is not well tuned.
Figure 3-1 illustrates a generic power plant burning pulverized coal that is equipped with postcombustion controls for NOx, PM, and SO2. The
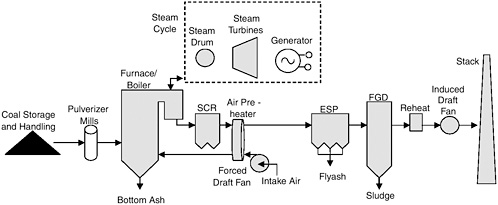
FIGURE 3-1 Simplified flowsheet for generic pulverized coal-fired electricity-generating power plant with postcombustion controls for NOx, PM, and SO2.
plant includes coal storage and handling facilities and pulverizer mills that typically deliver finely pulverized coal to the burners via a pneumatic transport system. The furnace, also often referred to as a boiler, is the structure where combustion of the coal takes place. The burner design and methods for staging combustion affect the formation of NOx.
The walls of the furnace structure typically are composed of steam tubes, so most of the surfaces in the furnace are actually heat exchangers. Therefore, the flue-gas temperatures decrease as the fuel gas leaves the flame zone and travels past the heat-exchanger tubes. The topmost portion of the boiler is referred to as the “convective pass” and includes the heat exchangers for producing superheated steam. The temperature window in portions of the convective pass can be appropriate for selective noncatalytic reduction (SNCR), which is an NOx-control technique involving injection of ammonia or urea to promote conversion of NOx in the flue gas to molecular nitrogen (e.g., EPA 2002d). After the convective pass, at which point the flue-gas temperature has been reduced because of heat exchange, the flue gas reaches the economizer, which is also a heat exchanger.
The flue gas leaving the economizer is typically about 367ºC, which is compatible with the desired temperature window for selective catalytic reduction (SCR) for postcombustion NOx control (e.g., EPA 2002d). Flue gas leaving the SCR, if present, or the economizer, if SCR is not present, flows through the air preheater, which is a heat exchanger. A typical air-preheater design is a slowly rotating basket, portions of which are exposed to the hot flue gas and then the cooler inlet air. An intake-air fan is typically used to force air into the furnace. In some power-plant designs, an induced-draft fan downstream pulls gas through the system.
The flue gas leaving the air preheater is typically at about 147ºC, which is appropriate for a “cold-side” electrostatic precipitator (ESP) or a fabric filter, either of which is used to capture a high percentage (typically 99% or more) of the fly ash entrained in the flue gas. If a power plant is equipped with a flue-gas desulfurization (FGD) system, also commonly referred to as a scrubber, the FGD system is typically downstream of the fly ash collection device. A common design for FGD systems is a spray tower in which a slurry of limestone is sprayed into the flue gas, promoting contact of the gas with liquid droplets containing dissociated limestone (Cooper and Alley 1994; DeNevers 2000). There are numerous other FGD system designs, such as dry systems. FGD systems are also classified as throwaway (if there is a substantial waste stream) or regenerative (if the sorbent is regenerated and reused in a continuous cycle). For illustrative purposes, we focus on wet limestone FGD because it is one of the more common designs. SO2 is soluble in water; however, the effect of a calcium-based additive is to promote dissociation in the aqueous phase, which has the effect of “pulling” more SO2 in solution than would otherwise occur. The spray tower thus
promotes the absorption of SO2 to facilitate aqueous-phase chemistry that produces calcium sulfite or calcium sulfate. A forced-oxidation variation of the limestone-based FGD promotes a larger conversion toward calcium sulfate, which is a more desirable product for handling. If sufficiently purified and dewatered, the calcium sulfate from an FGD system can be used to make gypsum wallboard, although in many applications the sludge that includes calcium sulfate is ultimately disposed of in a settling pond or landfill. Because the spray tower also promotes some evaporation of water from the slurry when contacted with the warm flue gas, the temperature of the flue gas typically drops to about 47ºC. To promote sufficient buoyancy of the flue gas for flow through the stack and some amount of plume rise, the relatively cool flue gas leaving the spray tower is generally reheated to about 77ºC or higher. Reheating can be adjusted as needed by the plant operator in response to visual observation of plume buoyancy.
The other major components are part of the steam cycle. Some of the critical elements of the steam cycle are steam drums, steam turbines, generators, and associated pumps and piping. The plant includes a transmission system to deliver power to high-voltage power lines. The balance of the plant typically includes many items of auxiliary and support equipment and facilities, such as the control room, administrative and storage buildings, shops, roads, rail, and others.
The thermal efficiency of pulverized coal-fired power plants are typically about 35% for subcritical steam cycles, with variations that depend on details of the design, age, operating strategies, maintenance practices, major overhauls, repowering, ambient conditions, fuel quality, and other factors. The thermal efficiency of such plants has not changed dramatically over time. The prospect of increased use of supercritical steam cycles may lead to a marginal increase in efficiency for a new plant. Alternative technologies, such as integrated gasification combined cycle (IGCC) systems, may also be capable of providing some efficiency improvement compared with existing subcritical steam cycle plants (Frey and Zhu 2006). However, without a dramatic increase in thermal efficiency, it appears to be the case that many producers of electric power do not have a major economic incentive to replace existing plants with newer ones, as long as the existing plants can be operated with adequate reliability and competitive marginal costs. A typical natural-gas-fired gas turbine combined-cycle system is illustrated in Figure 3-2. The configuration shown is for a system with SCR for postcombustion NOx control. A gas turbine has three main components: compressor, combustor, and turbine (also referred to as an expander). The compressor increases the pressure of ambient air for delivery into the combustor, where pressurized gaseous fuel (typically natural gas) or liquid fuel is introduced. The high-pressure, high-temperature combustion products enter the turbine via an inlet nozzle, and as the gases are expanded and cooled,
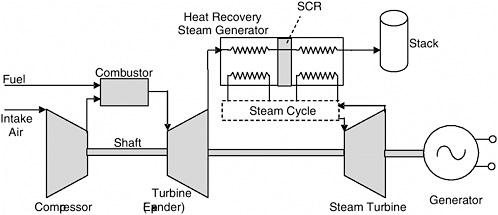
FIGURE 3-2 Simplified schematic of typical natural-gas-fired gas turbine combined-cycle system.
energy is transferred to rotate a shaft. Much of the shaft work is used to turn the compressor, and the balance is available for turning a generator. In some designs, a steam turbine is on the same shaft, and the gas and steam turbines turn the same generator.
The gases leaving the expander of a typical heavy-duty gas turbine have a typical temperature of 597ºC. Thus, additional thermal energy can be recovered from the exhaust gas via a heat-recovery steam generator (HRSG). The HRSG is composed of multiple heat exchangers that serve tasks ranging from heating boiler feedwater to superheating steam. Steam typically is produced at two or three pressures to feed multiple stages of the steam turbine. Because SCR requires a specific temperature window, it is typically located in the HRSG so that the exhaust gas that passes through it is at an appropriate temperature during normal operations.
Repair and Replacement Considerations at Electric Power Plants
This section reviews the typical repair and replacement considerations for electricity-power plants, with a primary focus on coal-based power plants and secondary consideration of natural-gas-fired combined-cycle systems. The types of activities reviewed here are related to typical industry practice but are not evaluated here with respect to implications for NSR. A given repair or replacement activity may or may not trigger a requirement for an NSR permit, depending on the specifics of each case.
Key elements of repair and replacement at a typical fossil-fuel-fired steam power plant are the following (Babcock and Wilcox 1978):
-
Safety considerations: These often involve proper operation of various monitoring, observation, and detection systems, such as burner observation, flame failure, unburned combustibles, fuel:air ratios, water levels, feedwater and boiler conditions, pressures, and temperatures.
-
Outages: These are scheduled outages for preventive maintenance (in the colloquial sense).
-
Internal cleanliness and inspection (for example, measuring internal boiler-tube deposits and chemical or acid cleaning of tube internals).
-
External cleanliness and inspection (for example, for external fouling not removable by normal sootblowing; external signs of pending tube failure, such as blistering or warping, signs of erosion or corrosion, misalignments, and deposits of ash or slag; condition of equipment; and condition of exposed refractory).
-
External cleaning (e.g., water washing of sulfur-bearing ash deposits).
-
Identification of needed corrective actions (for example, preventing recurrence of problems identified during inspection, such as startup procedures that are too rapid and lead to overheating of superheater tubes).
-
-
Cleaning of internal heating surfaces (for example, with chemical cleaning techniques).
-
Repairs.
-
Care of idle equipment.
Specific areas of a typical coal-fired power plant that require repair and replacement include the following (ERCC 2002):
-
Boiler-tube assemblies
-
Air heaters
-
Fans
-
Mills and feeders
-
Turbines and generators
-
Condensers
-
Control systems
-
Coal and ash handling
-
Feedwater heaters
-
Sootblowers and water lances
-
Burners
-
Motors
-
Electric equipment
-
Pumps
-
Piping, ducts, and expansion joints
-
Air compressors
A summary of common repair and replacement activities for each of those areas is given in Appendix E in Table E-1.
Many of the common repair and replacement requirements at coal-fired power plants are attributable to exposure of key components to the erosive effects of ash or other solids during fuel handling or in the flue-gas stream; the corrosive effects of acid gases in the flue-gas stream; and impurities, such as in steam. Wear and tear on turbine blades, heat-transfer surfaces, and other components can lead to a loss of system efficiency, reliability, capacity, or some combination of the three. Thus, common repair and replacement activities are often aimed at attempting to maintain the original efficiency, reliability, or capacity of the plant. Over time, new designs or materials may become available for replacement parts, such as turbine blades, and potentially offer improved efficiency, reliability, or capacity compared with the original equipment used in the plant. It may be easier, more economical, or more energy-efficient to use the more recently available replacement parts than to attempt to create the original parts. Many repair or replacement projects also can prevent more catastrophic failure of a plant. For example, replacing worn heat-exchanger tubes potentially could prevent a catastrophic failure that could substantially damage a plant or injure personnel. Similarly, replacing worn turbine blades before they break and are “ingested” by other parts of the turbine can avoid a more massive failure of the turbine. Thus, there is clearly a role for preventive repair and replacement to maintain the safety of a plant and for prudent timing of replacement of worn or damaged parts or components of the plant to maintain efficiency, reliability, and capacity.
The costs of repair and replacement projects typically are higher on a per-unit-capacity basis for smaller units than for larger units. Thus, the percentage of the total plant cost represented by a particular type of repair project typically may be larger for smaller units than for larger units.
Many of the common repair and replacement activities summarized in Appendix E occur at a large proportion of coal-fired furnace units and represent costs that are a relatively small fraction of total initial plant cost, considering the latter is on the order of $1,000/kW or more. Appendix E does not attempt to summarize less frequent major replacements at a plant, such as repowering with a new furnace using an existing steam cycle or replacing major components (such as a turbine-generator) with an entirely new system.
Typical Air-Pollution-Prevention and -Control Approaches for Electric Power Plants
Air-pollution-prevention and -control options for coal-fired power plants typically focus on emissions of PM, NOx, SO2, and mercury (Hg).
Control of Hg emissions is a recent development, necessitated by the 2005 Clean Air Mercury Rule (CAMR); there is no standard Hg emissions-control technology, although Hg-adsorption and -oxidation technologies have been extensively tested. For natural-gas-fired gas turbine-based systems, NOx emissions are usually of primary concern, and emissions of other pollutants, such as CO and VOCs, are of secondary concern. There is often a tradeoff between NOx prevention with combustion-based approaches (for example, wet injection and low-NOx burners) and emissions of products of incomplete combustion, such as CO and VOCs. Changes into the combustion process, such as lower flame temperatures, that prevent a portion of NOx emissions can lead to reduced combustion efficiency. However, most of this section focuses on coal-based systems.
Typical control options for PM include cold-side ESPs and fabric filters. For NOx, control options are typically classified as combustion based or postcombustion. Combustion-based approaches typically include low-NOx burners, overfire air, and other methods aimed at staging combustion to prevent at least some conversion of fuel-bound nitrogen to NOx while preventing at least some creation of thermal NOx from nitrogen in the combustion air. Postcombustion approaches typically involve injecting a reactant, such as ammonia, to react with NOx in the flue gas, either without a catalyst (SNCR) or with a catalyst (SCR). To be effective, SNCR requires a specific temperature window, typically found in the convective pass of the boiler, and excellent mixing of ammonia (or other reagents, such as urea) with the flue gas. SCR operates at a lower temperature window, typically in a dedicated reactor downstream of the economizer heat exchanger. Detailed reviews of NOx control-technology options are available elsewhere (EPA 1994a,b,c).
For SO2, the typical control options are to switch to a low-sulfur fuel or to use postcombustion control in the form of FGD. Switching to a low-sulfur fuel often requires changes elsewhere in the plant. For example, when switching from a bituminous to a low-sulfur subbituminous coal, it is often necessary to modify the pulverizer mills. Furthermore, because the electric resistivity of fly ash from subbituminous coal can differ from that of bituminous coal, retrofits to an ESP (if present) are often required. Thus, a fuel switch can entail some capital cost associated with changes within a plant.
For background information, a budgetary cost analysis of typical NOx and SO2 control technologies applied to generic types of new coal-fired power plants was conducted. The analysis of NOx control-technology costs is predicated on generic types of coal-fired electricity-generating furnaces as summarized by EPA (1994d). Examples of generic types of furnaces are wall-fired, tangentially fired, wet-bottom wall-fired, cell, and cyclone types. For each type of furnace, a typical uncontrolled-emission range and best estimate were reported by EPA, depending on whether the furnace was built before New Source Performance Standards (NSPS), under the Subpart D NSPS
TABLE 3-3 Typical Uncontrolled NOx Emissions by Furnace Type for Coal-Fired Electricity-Generating Plants in the United States
|
Type of Furnace |
Typical Uncontrolled NOx Emissions (lb of NOx/106 Btu, reported as NO2) |
|||||
|
Pre-NSPS |
Subpart D |
Subpart Da |
||||
|
Typical Range |
Best Estimate |
Typical Range |
Best Estimate |
Typical Range |
Best Estimate |
|
|
Tangentially fired |
0.4-1.0 |
0.7 |
0.3-0.7 |
0.6 |
0.3-0.5 |
0.5 |
|
Dry-bottom wall-fired |
0.6-1.2 |
0.9 |
0.3-0.7 |
0.6 |
0.3-0.6 |
0.5 |
|
Wet-bottom wall-fired |
0.8-1.6 |
1.2 |
|
|
|
|
|
Cell |
0.8-1.8 |
1.0 |
|
|
|
|
|
Cyclone |
0.8-2.5 |
2.0 |
|
|
|
|
|
SOURCE: EPA 1994d. |
||||||
or under the Subpart Da NSPS. The estimates are summarized in Table 3-3. According to EPA (1994d), no boilers of the wet-bottom wall-fired, cell, or cyclone designs have been built since promulgation of applicable NSPS. Table 3-3 is useful in providing a baseline for uncontrolled emission rates that can be used to assess the overall effectiveness of pollution-prevention and pollution-control strategies that reduce emissions. In practice, a typical power plant has one or more methods for source reduction or control of NOx emissions and therefore has emissions lower than the uncontrolled rates shown in Table 3-3.
To illustrate the cost effectiveness of NOx control, which is typically reported in dollars of levelized cost per ton of NOx emissions avoided, a sensitivity analysis was conducted with the EPA Acid Rain Division NOx Control Technology Cost Tool,6 which is a spreadsheet-based model (EPA 2002e). Levelized cost includes annualized cost recovery for capital cost plus annual fixed and operating costs and is expressed in dollars per year. The annual emission reduction is in tons per year. Therefore, cost effectiveness has units of dollars per ton of emission reduction. To run the model, the user must specify the type of boiler (tangentially fired, wall fired, and so on), the capacity of the boiler in megawatts of electricity generated, the capacity factor (ratio of actual kilowatt hour [kWh] generated to the total possible kWh that could be generated if the plant ran at 100% load all year), and the uncontrolled NOx emission rate. The software provides results like those summarized in Table 3-4 for two case studies based on a tangentially fired
TABLE 3-4 Example of Average Cost-Effectiveness Estimates for Electricity-Generating Boiler NOx Control for Generic Tangentially Fired Furnace: Comparison of Average Cost Effectiveness for Different Sizes and Capacity Factors
|
Control Optiona |
Emissions Rate, lb of NOx/106 Btu, Reported as NO2 |
Cost Effectiveness, $/ton |
|
|
100-MW Boiler at 30% Capacity Factorb |
600-MW Boiler at 75% Capacity Factor |
||
|
Uncontrolled |
0.70 |
— |
— |
|
LNC1 |
0.40 |
4,600 |
260 |
|
LNC2 |
0.37 |
3,100 |
240 |
|
LNC3 |
0.33 |
3,700 |
280 |
|
SCR |
0.14 |
16,800 |
780 |
|
LNC1 + SNCR |
0.24 |
9,500 |
620 |
|
LNC2 + SNCR |
0.22 |
8,400 |
590 |
|
LNC3 + SNCR |
0.20 |
8,700 |
610 |
|
LNC1 + SCR |
0.12 |
17,200 |
810 |
|
LNC2 + SCR |
0.11 |
16,300 |
790 |
|
LNC3 + SCR |
0.10 |
16,560 |
820 |
|
aLNC1, LNC2, and LNC3 are various types of low-NOx burner designs. bCapacity factor is the ratio of actual kWh generated to the total possible kWh that could be generated if the plant ran at 100% load all year. |
|||
boiler with an uncontrolled emission rate of 0.7 lb of NOx per 106 British thermal units (Btu), reported as NO2.
The two case studies were chosen to represent scenarios that would lead to high values of cost effectiveness, such as for a smaller boiler used for peaking service, versus scenarios that lead to lower values of cost effectiveness, such as for a larger boiler used for baseload service. The purpose of the comparison is to demonstrate the wide range in cost, depending on boiler size and capacity factor. The choice of control options can include combinations of combustion-based and postcombustion options (for example, LNC1 [low-NOx concentric burners, level 1] with SCR), as shown in the table. The cost effectiveness varies by a factor of 3-5, depending on the case study, with emission reductions of 43-86%.
The cost effectiveness is sensitive to both the uncontrolled emission rate and the capacity factor. For example, the estimated cost effectiveness of NOx control for a 600-MW boiler with a 75% capacity factor is $200-700 per ton (with corresponding control efficiencies of 43-86%) if uncontrolled emissions are 1.0 lb/106 Btu to $700-1,800 per ton if uncontrolled emissions are 0.4 lb/106 Btu. At an uncontrolled emission rate of 0.7 lb/106 Btu, but with a capacity factor of 0.5, the cost effectiveness, corresponding to the
range of control options shown in Table 3-4, is $600 to more than $1,500 per ton.
For a wall-fired boiler, a similar set of case studies was conducted, assuming an uncontrolled emission rate of 0.9 lb of NOx per 106 Btu, reported as NO2. For a 600-MW plant with a capacity factor of 75%, the estimated cost effectiveness of NOx control ranged from $110 to $600 per ton over a range of control efficiencies of 51-89%. For a 100-MW plant with a capacity factor of 30%, the corresponding range of estimated cost effectiveness was $1,400-13,000 per ton. Control options ranged from low-NOx burners (LNB) only to combinations of LNB, overfire air, and postcombustion methods of either SCR or SNCR.
Typical capital costs for selected pollution-control equipment for coal-fired power plants are reported by EPA (2002d). For example, the capital cost of SCR is reported to be about $80 per kilowatt, whereas the capital cost of FGD systems for a typical 500- to 600-MW plant varies from about $160 to $210 per kilowatt depending on the FGD system selected. A separate cost analysis performed with the integrated environmental control model (IECM) (Rubin et al. 1997) for a typical 600-MW wall-fired power plant burning bituminous coal produced capital estimates of about $25 per kilowatt for combustion-based NOx control, $40 per kilowatt for SCR, $120 per kilowatt for FGD, and $45 per kilowatt for PM control, compared with a total plant cost (including all emission controls) of $1,280 per kilowatt versus a capital cost of $1,020 per kilowatt for the base plant excluding controls. The difference in the cost between the base plant and the total plant includes the cost of controls plus additional costs associated with increased auxiliaries, such as ash handling. Thus, the capital cost of installing all the air-pollution controls collectively increases costs by 25% compared with the base plant. However, the costs for any of the controls individually vary from 2.5% to 12%. As an aside, the cost for SCR estimated with the IECM is at the low end of a typical range of reported SCR values for actual installations. However, the installed cost of SCR depends on site-specific factors and the cost of the catalyst, which can fluctuate, thereby leading to interplant variability in SCR cost.
All the cost analyses reported in the preceding paragraphs pertain to a new plant. The costs to retrofit emission controls to existing plants can be considerably higher, depending on site accessibility and whether the retrofit can be accomplished during a scheduled outage without increasing outage time. For example, a common problem encountered in retrofitting an SCR system at an existing plant is to identify a location for the SCR reactor. If there is substantial congestion at the site, the SCR system might have to be placed on top of existing ductwork or other flue-gas handling equipment, requiring a substantially more complex foundation and structure, which is compounded by the difficulty of bringing construction equipment into the
congested area to perform the installation. As a rule of thumb, the capital cost of a retrofit can typically be 30-50% more than that of a new plant, but there is considerable variability in the percentage, depending on site-specific factors.
Furthermore, the total effect of control technologies can include changes in overall plant efficiency and changes in fixed and variable operating costs. Thus, the cost analyses here typically represent a lower bound but do illustrate the sensitivity of cost to plant-specific conditions (such as uncontrolled emission rate, plant size, and capacity factor).
Costing algorithms for the capital, annual, and levelized costs of a variety of pollution-control systems are available in EPA’s Air Pollution Control Cost Manual (EPA 2002d) and other references, such as documentation of the IECM (Berkenpas et al. 1999). Those algorithms and reported costs for various actual facilities can be used as a basis to evaluate the cost implications of air-pollution-prevention and -control options.
Industrial Boilers and Other Industrial Combustors
Industrial boilers and combustors contribute a diverse collection of processes or devices that supply heat to a larger process or system or that act as thermal oxidizers of waste products. In addition to industrial boilers, there are combustion-based industrial process heaters exhibiting similar emissions. Boilers typically boil water to produce steam. Heaters are used to heat raw materials, such as crude oil, or intermediate products for processing or distillation. The fuel source to industrial heaters and boilers differs among industries with natural gas predominant in the chemicals industry, fuel gas and natural gas in petroleum refining, coal, tire chips, “bark” (waste wood such as stumps) and “black liquor” (lignin that has been separated from cellulose) in the pulp industry.
As is common when addressing emission sources for airborne pollutants, electricity-generating-facility boilers are deliberately excluded from this category. Excluding electric-utility generation, industrial boilers and combustors vary widely in size and purpose. They play a role in many processes and systems that are geographically dispersed. As a result, the potential effect of airborne emissions from industrial boilers and combustors is substantial because they are widely dispersed geographically and equally present in urban and rural airsheds that may or may not be classified as nonattainment areas.
The diverse applications that use nonutility industrial boilers and combustors involve a variety of fuel types, which result in substantial variation in emission profiles. Industrial boilers and combustors constitute substantial sources of four of the six criteria pollutants: NOx, PM, SO2, and CO. The process that a particular unit serves determines or strongly influences the
boiler or combustor fuel choice, which in turn greatly influences the emission profile. In a petroleum-refining process, flares used to oxidize sulfur in tail-gas streams or combustion-driven process heaters fueled by crude oil with a high sulfur content will produce high sulfur emissions. Pulp and paper processing can use biomass as a combustor fuel, which results in high PM emissions. Because industrial boiler and combustor use is widespread and tailored to specific applications, the potential to emit a particular criteria pollutant or its precursors varies widely, depending on the fuel mix and installed emission controls. In addition, unlike the catalytic converters used to oxidize CO to CO2 on mobile combustion sources, such controls are rare in large stationary combustion sources. As a result, nonutility industrial boilers and combustors are an important source of CO. Of the more than 1 million tons of CO emitted in 1999 (EPA 1999), the largest source categories by far were biomass-fired boilers and combustors (228,812 tons/ year), natural-gas-fueled reciprocating engines (206,647 tons/year), turbines (26,776 tons/year), and boilers (85,665 tons/year).
The diversity of applications in which industrial boilers and combustors are used makes them important sources of four of the six criteria pollutants. After the phased elimination of leaded gasoline from 1975 to 1986, the primary source of lead emission shifted from automobiles to metal-working (smelters) and battery-manufacturing processes, neither of which is considered in this section. Ozone is not directly produced by fossil-fuel combustion, although NOx emissions and fugitive hydrocarbon emissions from fuel storage and supply components, among other sources, contribute to ozone formation (see Chapter 7). The remaining four criteria pollutants are emitted as a result of the combustion process; different fuels and types of combustion result in different emissions. Various abatement techniques are used to control emissions of these pollutants:
-
SO2 abatement: low-sulfur fuels (coal and oil).
-
NOx abatement: NOx reduction (primarily SNCR, but also SCR), combustion best practices (such as lean combustion, air staging, flue-gas recirculation, and steam injection), and low-NOx burners.
-
CO abatement: none.
-
PM abatement: electrostatic precipitators, fabric filters, cyclones, and wet gas scrubbers.
Repair and replacement activities that are typical for industrial boilers and combustors are likely to be similar in many ways to those for utility boilers:
-
Burner inspection and repair: For solid fuels and liquid fuels containing substantial impurities, the fuel-injection process can erode fuel-injector
-
parts over time, degrading burner performance. Periodic inspection and repair are required to monitor and address degraded burner operation.
-
Repair or replacement of heat-exchanger tubes: Heat is transferred from the hot-side combustion gases to the cold-side fluid (typically water) in large arrays of heat-exchanger tubes. When fuels high in mineral impurities are burned, deposits condense on the outside of the tubes, reducing the rate of heat transfer and eventually requiring replacement or repair. The thermal and mechanical stresses imposed on the tubes can cause rupture. Periodic inspections are required and can lead to repair of degraded or damaged heat-exchanger tubes.
Petroleum Refining
The domestic petroleum-refining industry consists of 152 facilities (down from 324 in 1981), geographically dispersed across 32 states. Facilities are located in both urban and rural areas; multiple facilities located on the coast of the Gulf of Mexico, along the Delaware River valley border of Pennsylvania and New Jersey, along the Pacific coast of California, northcentral Utah, and northwestern Washington State. Other refineries are along the western Great Lakes and along the East Coast from New York to Virginia. Some average-size inland refineries are in Kansas, Oklahoma, Illinois, Tennessee, Kentucky, and Indiana. Petroleum refineries have a substantial impact on environmental quality of all sorts, not just air quality. For example, of all industries operating in California, petroleum refining is the largest source of hazardous wastes (CalEPA 2004). Of the petroleum refineries designated as major sources, 57% are in nonattainment areas (Abt Associates Inc. 2003). The geographic distribution of refineries means that controlling air emissions from these facilities potentially affects tens of millions of people, both those living and working nearby in nonattainment areas and those downwind in regions that may or may not be classified as nonattainment areas. Table 3-5 presents an inventory of emissions from typical petroleum-refining processes.
Petroleum refining is the process by which crude oil is converted into hydrocarbon products. Refineries range in processing capacity from 1,000 to 545,000 barrels/day (EIA 2003a). Fuels make up about 90% of the output of refineries; the remainder is composed of lubricants and other hydrocarbon-based petrochemical products. Because each refinery constitutes a very large capital investment and because the product lines of refineries vary, refinery configurations vary from one facility to another.
It is illustrative to consider petroleum refining as consisting of a series of chemical reactors, each operating at a different temperature and pressure and handling different hydrocarbon feeds. Supporting the reactors is an array of devices that transport, blend, separate, pressurize, and heat the
TABLE 3-5 National Emissions Inventory of Typical Petroleum-Refining Processes, tons per year
|
Process (no. facilities with process) |
NOx |
PM10 |
PM2.5 |
CO |
SO2 |
VOCs |
NH3 |
|
Vacuum distillation (34) |
24 |
8 |
7 |
45 |
135 |
1,763 |
1 |
|
Catalytic cracking (78) |
22,946 |
12,002 |
9,267 |
80,008 |
105,499 |
6,800 |
1,286 |
|
Fluid coking (13) |
43 |
153 |
111 |
4 |
3,712 |
484 |
1 |
|
Oil and gas production (25) |
226 |
138 |
124 |
194 |
727 |
529 |
78 |
|
Miscellaneous petroleum production (34) |
2,036 |
489 |
398 |
1,926 |
7,534 |
3,588 |
64 |
|
Chemical production (48) |
3,960 |
274 |
251 |
2,750 |
17,748 |
2,531 |
35 |
|
Mineral production (6) |
18 |
17 |
10 |
27 |
103 |
146 |
3 |
|
Miscellaneous production (16) |
297 |
1,001 |
909 |
171 |
473 |
38 |
12 |
|
Miscellaneous petroleum processes (50) |
1,012 |
186 |
130 |
1,074 |
7,251 |
1,045 |
148 |
|
Internal combustion (64) |
15,884 |
1,267 |
1,261 |
6,261 |
416 |
3,801 |
320 |
|
External combustion (277) |
146,714 |
16,471 |
15,586 |
45,073 |
134,072 |
9,250 |
5,779 |
|
Storage and transportation (178) |
1,752 |
108 |
— |
190 |
2,635 |
33,585 |
196 |
|
Water and waste treatment (194) |
1,253 |
2,449 |
2,243 |
979 |
6,336 |
11,239 |
344 |
|
Fugitives (97) |
1,224 |
518 |
380 |
1,696 |
14,804 |
40,756 |
49 |
|
SOURCE: Abt Associates 2003. |
|||||||
hydrocarbon feeds and catalysts to the needed conditions. References to a specific refining process necessarily encompass ancillary devices, such as pumps and heaters, which contribute substantially to the total emissions attributed to the process. Typical refining processes, in order of decreasing processing volume, are distillation (atmospheric and vacuum), cracking (catalytic and thermal), catalytic hydrotreating, catalytic reforming, and catalytic hydrocracking (see Figure 3-3). However, for any given facility and its instantaneous product mix, any combination of processes may be active, and this results in a variable “emissions fingerprint” for the facility as a

FIGURE 3-3 Simplified process flow diagram for typical petroleum-refinery operation. Overall refining process proceeds from upper left (introduction of raw crude) to final dispensed products along right edge (fuel gases, gasoline, solvents, and so on). Not shown are ancillary devices (such as heaters and pumps) used to alter temperature and pressure of each feed (lines and arrows) as necessary before it enters individual process units (boxes). SOURCE: EPA 1995b, based on Gary and Handwerk 1994.
whole. The national emissions inventory for petroleum refineries presented in Table 3-5 notably aggregates a number of the smaller-volume refining processes under several “miscellaneous” categories.
Also notable in Table 3-5 is the predominance of combustion sources to overall emissions. Many of these combustion sources are associated with the operation of one of the refining processes listed.
To understand the air emissions attributed to each process, a basic understanding of each process is necessary:
Distillation
Distillation is the process of coarsely separating the components of the petroleum feed by boiling-temperature differences. It is achieved by
heating the liquid feed to progressively higher temperatures. The different components in the feed volatilize (change from liquid to gas) at different temperatures that are based on molecular weight and mixture composition. Components that volatilize in the same temperature range are then collected, condensed, and sent for further purification. Distillation can take place under atmospheric or reduced-pressure (vacuum) conditions. The latter is used to separate higher-molecular-weight components of the petroleum feed.
Conditioning and Other Miscellaneous Processes
Conditioning and other miscellaneous processes involve manipulating the fluid and chemical characteristics of the petroleum feed to optimize the operation of downstream processes. Hydrotreating removes such impurities as sulfur and nitrogen from hydrocarbon feeds that would poison catalysts used in downstream processes. Hydrotreating also converts olefins (alkenes) to paraffins (alkanes) to prevent the formation of gums in fuels. Hydrotreating involves making the petroleum feed react with hydrogen under high pressure in the presence of a catalyst. Isomerization involves rearranging molecules (typically alkanes) without altering their molecular weight or composition to obtain higher-value isomer species. The process takes place in the presence of a catalyst. In contrast, catalytic reforming converts low-value species (such as naphthas) into high-value species of similar but not necessarily identical molecular weight (such as benzene). Catalytic reforming also takes place in the presence of a catalyst. Dewaxing is a process that removes waxy contaminants (paraffins) from lubricating oils produced in a refining process. The dewaxing process can be either catalytic (paraffins in the lubricant are broken down in reactions over a catalyst) or filtration (paraffins are condensed and removed from the lubricant).
Catalytic Cracking
Catalytic cracking involves breaking down larger hydrocarbon molecules and reforming the fragments into smaller hydrocarbon molecules. It occurs at high temperatures and involves vaporizing the hydrocarbon feed and introducing a granulated or powdered catalyst. In addition to the ancillary processes associated with catalytic cracking that are needed to pressurize and heat the reactants and collect the lower-molecular-weight products, there are supporting processes to recover, regenerate, and reheat the granulated or powdered catalyst material. Regeneration of the catalyst under reducing conditions is a primary source of CO.
Sulfur Recovery
The sulfur-recovery process, also referred to as gas “sweetening,” involves removing primarily hydrogen sulfide (H2S) from process gases for conversion to elemental sulfur and eventual resale. The predominant sulfur-recovery method is a modified Claus process in which the gaseous H2S stream is partially oxidized to SO2. The mixture of SO2 and H2S then reacts over a catalyst to produce elemental sulfur. Because the modified Claus process is 94-97% efficient, additional steps are usually required to extract the remaining sulfur compounds in the “tail gas.” If the remaining sulfur in the tail gas is predominantly H2S, the tail-gas stream can be directed to a thermal oxidizer to convert H2S to SO2 and then be subjected to wet or caustic scrubbing. Alternatively, the Beaven process adsorbs H2S in a quinone solution, producing hydroquinone and elemental sulfur. This mixture is then centrifuged to remove the sulfur and oxidized to convert the hydroquinone back to quinone, which is then recycled in the process. If a variety of sulfur compounds exist in the modified Claus tail gas (such as SO2, carbonyl sulfide, and carbon disulfide), a Shell Claus off-gas treating (SCOT) process is used to catalytically reduce these compounds to H2S (with cobalt-molybdenum as a catalyst), which is then adsorbed in a regenerable diisopropanolamine solution.
Combustion
Boilers, incinerators, furnaces, and steam generators supply steam and electric power to drive machinery and provide heat for various refining processes. Fuels fed into these devices include coal, fuel oil, and natural gas. Flares and incinerators oxidize compounds within a waste or off-gas stream. Air emissions from the devices are typical of those of hydrocarbon-fueled combustion devices.
Fugitive Emissions
Fugitive emissions originate throughout the refining process as a result of leaks from seals associated with fittings connecting pipes, tanks, and process devices. Fugitive emissions also originate from the loading and unloading of materials (such as PM generated and released during coke handling and VOCs released during charging of tanks and loading of barges), as well as from wastewater-treatment processes (such as aeration and holding ponds).
Air Emissions from Petroleum Refining and Their Control
Air emissions from petroleum refining largely consist of SO2, NOx, PM, VOCs, and CO. The abatement technologies cited for each pollutant reflect the technologies catalogued in a review of EPA’s RACT-BACT-LAER clearinghouse (more than 100 facilities and more than 350 processes reviewed, listed under “petroleum-refining processes”).
SO2 is generated as a consequence of sulfur removal during refining. Other processes, such catalyst regeneration, as well as burning or flaring of selected hydrocarbon streams, are also potential sources of SO2. Typical control approaches include reduction of sulfur in the fuel stream or scrubbing of SO2 from the combustion product gases (e.g., wet gas, caustic, Beaven, SCOT, Welman-Lord processes), as well as leak detection and prevention.
NOx emissions overwhelmingly originate from combustion processes used for heating and therefore are subject to the same NOx-formation mechanisms described previously for coal-fired electricity-generating facilities. As a result, nearly all of the same NOx abatement and control technologies used for coal-fired electricity-generating facilities are also used for petroleum refining: SCR, SNCR, and combustion modifications (e.g., lean combustion, air staging, flue-gas recirculation, steam injection, low-NOx burners) as well as daily or annual restrictions on operation.
Fugitive releases of VOCs occur from a variety of refining processes, including distillation, catalytic cracking and re-forming, isomerization, waste treatment, and materials loading. VOC abatement involves flares and incineration, leak detection and prevention, and vapor recovery.
The principal source of CO is the catalyst regeneration process and the principle abatement approach is a CO boiler or oxidizer.
Sources of PM include the catalytic cracker, catalyst regeneration processes, various combustion processes, and materials handling. Conventional PM control devices are used for abatement and control, including electrostatic precipitators, cyclones, baghouses, and wet gas scrubbers for PM-laden process streams. To reduce fugitive PM emissions, covered conveyors and telescoping chutes can be used as well as implementing water misting during solids loading and unloading.
The equipment replacement provision (ERP) would have exempted changes from triggering NSR activities that are considered “routine maintenance and repair” (see Chapter 2). If some type of ERP were to be included as part of NSR revision, any assessment of the effects of such revision would have to consider the types of repair and replacement activities typical of petroleum refineries. Table E-2 in Appendix E presents the aggregated responses to a National Petrochemical and Refiners Association member survey initiated in response to an information request from the committee.
Pulp and Paper
The pulp and paper industry is a multifaceted industry, encompassing various facilities that manufacture paper and paperboard products, including linerboard, office paper, paper bags, paper towels, tissue, newsprint, and napkins. Because of the variety of final products, the mills that exist in the United States can be very different, and the process flow diagrams can vary. Typically, the manufacture of paper and paperboard products involves chemical pulping, mechanical pulping, or combined chemical and mechanical pulping. However, about 80% of the facilities that exist in the United States are mills that manufacture paper products with the Kraft process (Springer 2000). This section on the pulp and paper industry focuses specifically on Kraft mills because of their prevalence in the United States and the numerous air-pollution concerns associated with the chemical-recovery processes of Kraft mills.
A basic flow diagram of a mill operating with the Kraft process is depicted in Figure 3-4. In addition to the major components in Figure 3-4, each mill also has a separate boiler for producing steam and power. All the subprocesses depicted in Figure 3-4 and the power boiler are critical to the overall production rate, and each has components that require repair or replacement to ensure proper operation. Thus, each section of a typical Kraft mill is potentially affected by the NSR changes.
The process of generating paper in a Kraft mill involves four primary processes: preparing and digesting the raw materials, processing the pulp, drying and preparing the product, and chemical recovery.
Preparing and Digesting Raw Materials
Hardwoods and softwoods are used in paper mills. The final product of the mill dictates the type of material used. However, regardless of the nature of the wood, the primary step in a Kraft process involves debarking the wood logs (with a mechanical procedure) and reducing the raw materials to chips. The chips are size segregated, and those deemed “too small” are transferred to the power boilers for use as fuel. Larger chips are mechanically processed further to achieve optimal size and then fed into the digesters.
Digesters in a Kraft mill are either batch or continuous-flow reactors that are used to convert raw wood chips to pulp. As noted in Figure 3-4, wood chips of optimal size are mixed with a white liquor that consists of sodium sulfide (Na2S), sodium hydroxide (NaOH), and water. At high temperatures and pressures, the white liquor helps to convert the wood chips to a soluble phase containing the lignin and an insoluble phase (the brown
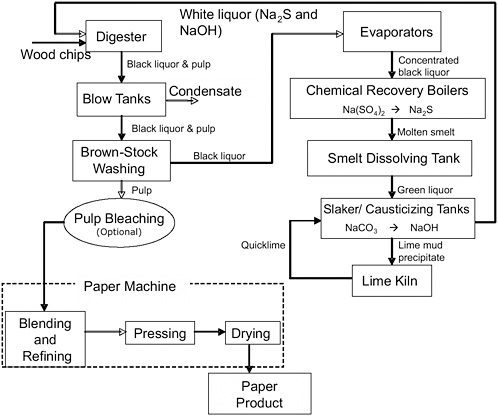
FIGURE 3-4 Schematic of major processes in Kraft mill. Note that the “Paper Machine” consists of several steps, which may vary depending on the final desired product. The items shown are examples of steps that may be included.
pulp) that is further processed into paper. The soluble and insoluble phases are separated in the blow tanks.
Paper products may also contain recycled paper that is brought into the mill. Once received at the mill, wastepaper bales are conveyed to a pulper where the secondary fiber is dispersed into a wet-pulp slurry. In the pulper, inks and coating materials are separated from the fiber. Strings, wires, plastics, and other impurities that may exist in the wastepaper are removed.
Processing the Pulp
The pulp that emanates from the blow tanks is subjected to additional processing to remove spent digesting liquids (black liquor), improve the
quality of the pulp, and depending on the final product, bleach the pulp. The brownstock washers are used to separate the digestion liquids from the pulp material. The diluted black liquor that leaves the brownstock washers is collected for processing and recovery. Washed pulp (brownstock) is also passed through screens to remove excessively large (partially undigested) or small pieces of the pulp. A proper pulp size is needed to ensure the strength and quality of the final product.
Some Kraft mills also use a bleaching process to convert the brown pulp to a white (bleached) pulp. That bleaching process involves the use of chemicals such as chlorine dioxide, hydrogen peroxide, and ozone to remove residual lignin from the pulp and results in a brightening or bleaching of the digested raw material. Pulp is introduced into a bleaching tower, bleached, and then washed to remove excess bleaching liquid.
Papermaking
The washed (and perhaps bleached) pulp is processed into a final product through a series of processes that vary based on the final product desired. The processes may involve blending hard and soft woods but always include discharge of a pulp slurry onto a forming fabric, dewatering, and drying. Blending of softwoods and hardwoods changes the ultimate strength and characteristics (such as softness) of the final product. Different wood types are processed in the digesters separately to ensure that proper digestion times and recovery techniques are used. (For example, softwoods contain high concentrations of terpenes; after the digestion process, gases emanating from the digester and blow tanks used for softwood processing may be condensed and recovered to form turpentine.) To achieve the desired final-product characteristics, softwood pulp and hardwood pulp may be blended. Not all papermaking processes employ a blending technique. Once the appropriate pulp characteristics are achieved, the pulp is sprayed onto large pressing and drying rollers where the paper product is formed, as indicated previously. The paper products that are formed and dried are ultimately converted to customer-usable products such as boxes, bags, tissue, etc.
Chemical Recovery
A critical component of a Kraft mill is the chemical recovery process. The black liquor generated in the digester is captured in the blow tanks and washer sections of a typical mill and then concentrated in evaporators and burned in a recovery boiler to recover Na2S. The molten smelt that is generated reacts further with lime to ultimately recover NaOH. The recovered Na2S and NaOH form the basis of the white liquor that is fed into the digesters as wood chips are processed.
Typical Emissions and Control Equipment
The primary emissions from a Kraft mill are VOCs, SO2, NOx, CO, total reduced sulfur (TRS), and PM. The emission rates of the pollutants depends on the wood products used (softwood versus hardwood) and on the final product of the mill (Davis 2000; Someshwar 2003). The National Council for Air and Stream Improvement and EPA have conducted studies to determine the typical emissions from specific mill processes (Someshwar 2003; NCASI 2004). Table 3-6 provides data on the types of compounds emanating from the major sections of a typical Kraft mill and the typical air-pollution-control devices that are used to reduce emissions (Davis 2000; Springer 2000; Someshwar 2003; NCASI 2004; Witkowski and Wyles 2004). The composition of emissions from the power boilers depends on the type of fuel used. Typical fuels and the percentage of mills using the specified fuel in steam-generating power boilers are as follows: natural gas, about 33%; wood, about 33%; coal, about 26%; and oil and miscellaneous fuels, about 8% (NCASI 2004). Although the use of waste bark may be an efficient use of resources, the combustion of bark typically generates excessively high levels of CO compared with the combustion of other fuels in a typical steam-generating power boiler (NCASI 2004). However, the use of
TABLE 3-6 Typical Air-Pollutant Compositions and Emission-Control Equipment Used in Each Subprocess in Kraft Mills
|
Subprocess |
Pollutants |
Typical Emission Controla |
|
Digester |
VOCs, sulfur compounds |
Combustion |
|
Blow tanks |
VOCs, sulfur compounds |
Combustion |
|
Brownstock washing |
VOCs, sulfur compounds |
Combustion |
|
Bleaching |
Halogenated compounds (particularly chlorine dioxide and chloroform), CO, methanol |
Scrubber |
|
Chemical-recovery boilers |
PM, NOx, sulfur compounds, CO, VOCs |
ESP, SNCR |
|
Smelt-dissolving tanks |
PM, sulfur compounds, VOCs, ammonia |
Scrubbers |
|
Slaker and causticizing tanks |
PM |
Scrubbers |
|
Lime kiln |
PM, sulfur compounds, NOx, CO, VOCs |
Scrubbers or ESP |
|
Drying |
VOCs, sulfur compounds |
Combustion |
|
aThe control equipment listed in not necessarily for the control of all the pollutants that are listed for each subprocess. For example, an ESP will control only PM emissions. SOURCE: Adapted from Witkowski and Wyles 2004. |
||
waste bark as a fuel may also be beneficial to air quality, because NOx and SO2 concentrations are reduced.
Mill Repair and Replacement Activities
Numerous repair and replacement activities are periodically undertaken to ensure safe and optimal mill performance. For existing Kraft mills, these types of activities have the potential to trigger NSR, and any effort to assess the effect of operational changes in the NSR program on Kraft mills depends on the nature of the activities. Table E-3 in Appendix E lists repair and replacement and other activities peculiar to Kraft mills that are periodically undertaken. The quality and variety of the fuel types used in the pulp and paper industry may result in repair or replacement activities for facility components that are different from those in industrial sectors that rely on one fuel type.
Time Frames for Industrial Production and Process Change
The previous sections have highlighted some key industries and the process technologies that are used to create products. This section briefly addresses the notion that there is a temporal aspect of industrial production. The temporal aspect has several specific considerations. One is that a given product mix must be produced to meet demand, typically involving a characteristic load profile. Another is that the product mix may change to meet market needs. The ability to store an output allows for scheduling the operation of the plant so as not to be closely coupled to the demand cycle. This, in turn, may have implications for steady-state operations, which is an important consideration for control of emissions.
For electric-power generation, electricity is produced at the same time that it is consumed. It is impractical to store electricity for later use, so the total power-generation level must change as the demand for electricity changes. Some power plants, particularly the larger coal-fired and nuclear plants, are often run in a “baseload” mode, which means roughly constant output. Other plants, which typically have higher marginal fuel costs, such as natural-gas-fired systems, may operate in “intermediate” or “peaking” modes. An intermediate-load plant may ramp up and down once a day to capture substantial increases in the daytime electricity demand over overnight demand. A peaking plant may operate for only a few hours per day to accommodate specific periods of highest electricity demand. The overall average capacity factor of a baseload plant can be about 80%, versus 50% or less for an intermediate-load plant and perhaps only 15% for a peaking-load plant.
In petroleum refining, where it is possible to store the product (in tanks),
it is more economical to size the plants and operate them to achieve roughly steady-state production at high-use factors. Thus, in contrast with electric-power generation, refineries typically operate at roughly constant load factors. However, the product mix changes over the course of the year. For example, gasoline formulations typically change to a less volatile mix in the summer to reduce evaporative emissions of photochemically active ozone precursors. The specifics of the operations at the refineries may change over the course of a year because of changes in product mix. Similarly, in other industries, such as automotive and pharmaceutical, there may be periodic “retooling” or transitioning to other products or product mixes. Those changes potentially can require modifications to existing facilities or other changes that might affect energy use or efficiency.
TECHNOLOGICAL CHANGE
The stringency and form of environmental regulation can influence the nature and speed of technological change for pollution-control equipment and have important implications for the cost and performance characteristics of that equipment. Technological advances can lead to lower costs of installing pollution-control devices, lower costs of operating the devices, improved emission-reduction performance, or some combination of those. Understanding the relationship between regulation and technological change is important for accurate assessment of the costs and, in some cases, the benefits of environmental regulation, including the changes in NSR rules being considered in this report.
Regulatory stringency and applicability have a direct relationship to the size of the potential market for a particular control technology and the incentive of a developer to improve it. Greater certainty about future regulatory requirements also provides for a more accurate assessment of the potential market for a particular technology and may increase incentives for improving it. The potential for being designated NSPS, BACT, or LAER, in theory, could provide an incentive for technology developers to devise a better technology for reducing or even preventing emissions, but there are few empirical studies of the effects of regulations on new-technology development. NESCAUM (2000) provides some information regarding the adoption of technologies for control of NOx and SO2 emissions along with regulatory context. The form of environmental regulations—whether technology standards, emission-rate standards, or cap-and-trade programs—will also affect incentives for different forms of innovation. In particular, emission cap-and-trade regulations impose an opportunity cost in the form of the price of an emission allowance on every ton of pollutant emitted and thereby potentially create a stronger incentive to improve emission-control efficiencies of particular technologies than would exist with either tech-
nology standards or emission-rate standards (Keohane 2002). Emission cap-and-trade programs also lower costs by reducing the need for control-equipment redundancy to meet a national or regional emissions target. If a facility is required to control emissions whenever the facility is running, redundant pollution controls would be necessary. However, with a cap-and-trade program, the facility operator can continue to operate even when the pollution-control equipment is not operating and cover the additional emissions by purchasing or retiring more allowances.
To illustrate the relationship between environmental regulation and the development of emission-control technologies, we consider two examples of such technologies: FGD technology used to reduce emissions of SO2 and SCR technology used to reduce NOx emissions from fossil-fuel-fired boilers used to generate electricity. Both FGD and SCR are technology options that are included in the modeling analysis of the electricity sector as reported in Chapter 6.
Flue-Gas Desulfurization
FGD technology is of particular interest because it must be installed for compliance with NSPS for SO2-emission reduction at new pulverized-coal electricity-generating units. The recent settlements of EPA NSR enforcement cases against several electricity-generating facilities (see Chapter 2) included agreements to install FGD scrubbers at one or more coal-fired units. FGD units were also an important part of electricity-generating-facility compliance strategies with the SO2 cap-and-trade provisions of Title IV of the 1990 CAA amendments. Sixteen electricity-generating facilities installed retrofit FGD units in at least one of their existing coal-fired generators to comply with Phase I of Title IV (Swift 2001). About eight scrubbers were installed after stricter caps were put into place under Phase II of the program, which took effect in 2000 (Burtraw and Palmer 2004).
Studies of the effect of NSPS and Title IV on innovation in scrubber technology suggest that both forms of regulation helped to spur technological advances, but of different types. Taylor et al. (2003) found that patents relevant to SO2-control technology grew dramatically in the early 1970s and remained high through the middle 1990s relative to earlier periods. Popp (2003) found that SO2-removal patent counts peaked in the early 1980s at substantially above post-1990 levels. He suggested that that pattern indicates that stricter NSPS rules issued in the late 1970s contributed to increased patenting in the early 1980s. The later decline in patenting activity could be due to a combination of factors, including lower-than-expected SO2-allowance prices, the drop in construction of new coal-fired generators, the maturity of the FGD technology, and a declining propensity to patent in general.
Several authors find that the move toward a more flexible cap-and-trade approach to SO2 regulation contributed to innovation. Burtraw (1996, 2000) found that the flexibility associated with permit trading allowed generators to make changes in institutional behavior that helped to lower costs and, by creating a form of competition with scrubbing, helped to provide incentives to reduce scrubbing costs. Popp (2003) found that although capital and operating costs of scrubbers declined during the period since first implementation of NSPS, the move to cap-and-trade regulation for SO2 in the late 1990s was accompanied by an improvement in the SO2-removal efficiency of FGD units. That improvement is seen as a direct result of the stronger incentive to continually reduce emissions associated with a need to hold SO2 allowances to cover all emissions. Keohane (2002) also found that FGD equipment costs did not decline during Phase I of Title IV but that the operating efficiency of scrubbers did increase and brought about large declines in operating costs per ton of SO2 removed. Recent vintages of FGD units reduce potential stack emissions of SO2 by 95% or more, whereas the median emission reduction before the revised NSPS for SO2 in the late 1970s was closer to 80% (Popp 2003; Taylor et al. 2003). Today’s systems are also much more reliable than were the FGD systems installed in the 1980s, and the increased reliability contributes to higher total SO2 removal (Taylor et al. 2003).
Improvements in reliability and in the removal efficiency of FGDs are linked to some extent. As noted by de Nevers (2000), the electricity-generating industry endured problems associated with the early adoption of systems, such as limestone scrubbers, in the 1970s and early 1980s. Examples of problems encountered included higher-than-anticipated corrosion of metals; deposits of solids, and scaling and plugging in the FGD system itself; entrainment of slurry droplets and downstream deposition of solids; underuse of reagent; and problems with the separation of water from the waste products. Solutions to those problems have included better control of pH in the slurry, better control of the composition of the slurry to avoid scaling and plugging problems, improved design of such key components as entrainment separators, and increased slurry holding times and oxidation.
Learning by doing also has helped to bring down the costs of operating FGD units. Taylor (2001) showed that the operating costs of FGD units have fallen by 17% for every doubling of installed capacity. Capital costs of a wet limestone scrubber designed to reduce emissions of 3.5% sulfur coal by 90% at a 500-MW unit have fallen by roughly 50% over 20 years, and the bulk of the decline occurred before the beginning of the cap-and-trade program (Taylor et al. 2003, Figure 6).
Selective Catalytic Reduction
SCR technology is of interest because it is an effective means of reducing NOx emissions from boilers at electricity-generating facilities; it has the potential to reduce emissions by 70-90%. SCR generally is assumed to be necessary to meet NSPS requirements for NOx reductions at new pulverized-coal facilities. It is also the technology typically selected to control NOx in settlements of NSR-enforcement cases brought against large electricity producers by EPA in recent years.
SCR is one of many ways to control NOx emissions, and it is a relatively capital-intensive and expensive method compared with other approaches (Swift 2001) that have proved sufficient to achieve compliance with recent NOx regulations. Before the 1990 CAA amendments, many existing coal-fired generators faced no restrictions on emissions of NOx. Title IV of the 1990 CAA amendments imposed an annual average emission-rate cap on NOx emissions for coal-fired generators in the United States. The emission-rate limit was based on the use of low-NOx burners, and the standard varied by boiler type (Swift 2001). Most units complied with the regulation by installing low-NOx burners, although flexibility provisions in the law, such as emission-rate averaging across units at a plant, encouraged firms to reduce emissions through other means, such as changing air-fuel mixtures and adjusting boiler temperatures to reduce NOx emissions, before investing in control technology (Swift 2001). The linking of the standards to the degree of reduction achievable with low-NOx burner technology provided limited incentive for U.S. coal-fired generators to adopt the more expensive SCR technology. However, in several states, such as California, SCR was applied starting in the 1980s on gas-turbine combined-cycle facilities.
Demand for SCR to reduce NOx emissions was expected to grow somewhat when the Ozone Transport Commission (OTC) program for capping summertime NOx emissions from electricity generators in nine northeastern states took effect in 1999. The cap began in Phase II of the OTC program, which ran from 1999 through 2002, mandating a 55% reduction below 1990 levels in summertime NOx emissions from affected sources. Despite the large reductions sought, most of the regulated units were able to achieve a large fraction of the required reductions in NOx emissions through operational changes, so the role for SCR was much smaller than expected (Swift 2001). Beginning in summer 2003, the cap was tightened to roughly 70% below the 1990 level (Burtraw and Evans 2004). The geographically more expansive multistate NOx caps under EPA’s NOx SIP call, which covers 19 states and the District of Columbia and took effect in summer 2004, greatly increased installations of SCR technology. Coal-fired power plants in a number of states also have retrofitted combustion and postcombustion NOx controls (for example, low-NOx burners and SCR) in response to SIP
requirements for attaining National Ambient Air Quality Standards. For example, the first retrofit of SCR to a coal-fired power plant occurred in 1995 (NESCAUM 2000).
The United States was a relatively late adopter of SCR. In Japan, it was used as early as the late 1970s but at much lower removal rates than are common today, typically at a rate of 60%. The lower removal rates meant that there was less of an issue with ammonia slip, because use of ammonia is more complete under these conditions. Ammonia slip refers to unreacted ammonia that leaves the SCR system and is vented to the atmosphere with the stack gases. German coal-fired boilers adopted SCR in the late 1980s and early 1990s in combination with environmental regulations. During the 1980s, improvements in catalyst formulation, as well as injection grids and control systems enabled achievement of 80-90% removal efficiencies with less ammonia slip for a wider variety of flue-gas compositions.
One barrier to adoption of SCR in the United States during the 1980s, in addition to high costs and relatively low regulatory stringency, was the perception that SCR could not be used in U.S. coal plants because the alkali content of U.S. coal was higher than that of coal used in Japan (or Germany) and that the difference could be a potential cause of catalyst plugging or poisoning. However, experience has shown that, with appropriate catalyst formulation, different coal chemistry is not a problem. Other potential problems with the application of SCR, such as ammonium salt deposition on downstream equipment, are apparently reduced or eliminated by controlling ammonia slip and by selecting appropriate materials and surfaces for such equipment (for example, an air preheater).
Current work by Taylor (2004) finds that SCR emission-removal efficiencies have improved dramatically coincidentally with the spread of regulations requiring or spurring their use—from Japan in the late 1970s to early 1980s to Germany in the late 1980s to early 1990s and then to the United States more recently. Increased SCR use in the United States has come about only recently, largely in response to the regional summertime NOx-emission cap-and-trade programs in the northeastern states and to NSR requirements. Currently, removal efficiencies of 90% and higher are feasible, and typically 90% removal is guaranteed by vendors (Culligan and Krolewski 2001). Operating costs of SCR units have also declined by 50% in 10 years (Taylor 2004).
New Source Review Modifications and Incentives for Technological Change
Several economic researchers have asked whether NSR regulations inhibit technological change. Anecdotal evidence and a small amount of empirical evidence, discussed in Chapter 5, suggest that differentiated regula-
tion of new sources slows capital turnover and that differentiated regulation of modified sources reduces investment in modifications and upgrades at existing plants. To the extent that the technological modifications would have promoted new technologies, the evidence of reduced investment at existing plants could be consistent with dampened diffusion of new technology and reduced technological change more broadly. However, no empirical studies have explored the relationship directly (Jaffe et al. 2003). Not addressed here is the issue of the implications of tighter controls on new sources versus keeping older sources on line longer.
The dearth of literature on NSR and technological change and the lack of direct evidence make it difficult to offer much in the way of informed judgment about how the recent NSR rule changes are likely to affect innovation. To the extent that regulation reduces the applicability of BACT and LAER to existing sources, it could reduce demand for pollution-control retrofits and thereby reduce innovation by technology developers. However, if the fact that NSR applies only when major modifications actually take place limited investment activity in the first place, then this effect is likely to be small.
Most of the NSR revisions—such as changes in methods of estimating emission effects and baseline emissions, and plantwide applicability limitations—limit the possibility that a particular investment or expenditure at an existing facility will trigger NSR. Those favoring the NSR rule changes have asserted that concerns over triggering NSR reduced investments at existing plants and reduced markets for new technologies (see Box 3-1). They also have asserted that limiting its applicability could increase the adoption of new technologies, which in turn could spur technological innovation. Whether that hypothesized effect would occur remains an open question.
SUMMARY
The key conclusions of this chapter are as follows:
-
Permits for modifications involve only 1-2% of total emissions for most pollutants in either the manufacturing or electricity-generating sector (including facilities that did not receive an NSR permit in the period 1997-2002). However, NSR permitting activity pertaining to modifications was substantial when considering only those facilities that received an NSR permit during the period considered. On the basis of preliminary data, which are subject to various limitations, permits for modifications account for 25-48% of the reported total amount of permitted emissions, depending on the pollutant, among all facilities that are reported to have received an NSR permit.
|
BOX 3-1 Example of an Emerging Technology: IGCC Integrated gasification combined cycle (IGCC) is an example of an emerging technology. The IGCC features the gasification, rather than combustion, of fuels. For example, coal (or a wide variety of other fuels, including waste fuels) is partially combusted by using an oxidant (typically 95% pure oxygen from a dedicated air-separation plant), and steam or water is added. The partial combustion of the fuel supplies thermal energy for endothermic gasification reactions that lead to the formation of a synthesis gas (“syngas”) containing CO, hydrogen, and other substances. The bulk of noncombustible material in the fuel is removed via the bottom of the gasifier as a vitrified “slag” that typically is less leachable than the bottom ash of a conventional furnace. The syngas goes through gas cooling, scrubbing, and acid-gas separation to remove particles, H2S, and carbonyl sulfide (COS). The sulfur is recovered in elemental, solid form and can be used as a byproduct. The syngas can be used as a fuel in a gas-turbine combined cycle to generate power. Alternatively, it can be used as a feedstock for the production of chemicals, such as hydrogen, ammonia, and methanol. Gasification can be the cornerstone of a “polygeneration” system or “coal refinery” that creates a mix of multiple products. For power-generation applications, NOx emission can be prevented or minimized via saturation of the syngas with moisture or injection of nitrogen from the air-separation plant. However, postcombustion SCR can be used for additional NOx control if needed. IGCC systems are generally more efficient than combustion-based systems, use less water, have lower air-pollutant emissions, and have greater fuel flexibility. Even if advanced supercritical combustion-based plants attain comparable efficiency, IGCC plants could still offer advantages of greater fuel flexibility, coproduction of multiple products, and the potential for less-expensive carbon sequestration. Although IGCC technology has been shown to be technically feasible in several large-scale demonstration plants, it has not yet been cost-competitive in the United States. However, American Electric Power has recently announced its intentions to construct the first commercial IGCC plant in the United States some time in the next 5-6 years. |
-
NSR permits for modifications have been issued for a wide variety of emission-source categories but primarily, following whether measured by number of permits or by amounts of permitted emissions, in electricity-generating facilities; stone, clay, and glass products; paper and allied products; chemicals and allied products; and food and kindred products.
-
Although the industries are diverse, their emission processes are often similar. For example, many industries use common unit operations, such as industrial furnaces to generate steam for process use, whereas others use combustion sources, such as tunnel or rotary kilns.
-
There is substantial variation among states regarding the implementation status of the NSR revisions and the existence of a minor-construction permitting program that might cover modifications that are not covered under NSR. There is limited experience with NSR revisions where the programs have been implemented. Furthermore, there appears to be reluctance by some states and firms to conduct permitting, given the current uncertainty about litigation over the revisions.
-
There is a lack of systematic and consistent reporting of NSR permits by states. However, some states appear to be adopting a common framework for electronic management of permits.
-
A review of common repair and replacement practices for selected types of process facilities showed that such activities can vary considerably in frequency and cost.7 Likewise, for a given emission source, such as a boiler at an electricity-generating plant, the wide array of pollution-prevention and -control options can vary in effectiveness and cost.
-
Emission sources, pollution-prevention techniques, and pollution-control technology are expected to change, and regulations like those considered here can be part of the motivating factors for such change. However, the effects of regulations can vary greatly, depending on the specifics of programs.


