
8
Nuclear Energy
Utilities in the United States have recently expressed renewed interest in adding new nuclear power plants to their mix of electricity generation sources. As of July 2009, the U.S. Nuclear Regulatory Commission (USNRC) had received 17 applications for combined construction and operating licenses1 for 26 units, and it expects to receive a total of 22 applications for 33 units by the end of 2010.2 The 104 currently operating nuclear plants (largely constructed in the 1970s and 1980s) contribute substantially to the U.S. electricity supply: nuclear power provides 19 percent of U.S. electricity as a whole and about 70 percent of electricity produced without greenhouse gas emissions from operations. These plants provide electricity safely and reliably, and they have operated with capacity factors greater than 90 percent over the last few years.3 Still, hurdles remain, and no new nuclear plants have been ordered in the United States in more than 30 years.
This chapter discusses the prospects for the future use of nuclear power in the United States, including an assessment of future technologies, deployment
|
1 |
Previously, the licensing process had two steps, construction and operation, each of which required a different license to be issued. The Combined Construction and Operating License is a part of the USNRC’s new “streamlined” application process. |
|
2 |
The USNRC’s lists of received and expected applications are available at www.nrc.gov/reactors/new-reactors/col.html and at www.nrc.gov/reactors/new-reactors/new-licensing-files/expected-new-rx-applications.pdf, respectively; accessed July 2009. |
|
3 |
The net capacity factor of a power plant is the ratio of the actual output of a power plant over a period of time and its projected output if it had operated at full nameplate capacity the entire time. |
costs, and the barriers to and impacts of increased nuclear power plant deployments by 2020, by 2035, and by 2050.
Interest in new nuclear construction has also been growing around the globe, and with a new element: interest among countries that do not currently have nuclear plants. According to the International Atomic Energy Agency (IAEA), in excess of 40 new entrant countries have expressed interest, of which 20 are actively considering construction (IAEA, 2008a).
In addition, the IAEA has recently estimated that 24 of the 30 countries with existing nuclear plants intend to build new reactors—a departure from policies of the past few decades in many countries (IAEA, 2008a). Following the Chernobyl accident in 1986, Italy banned construction of new nuclear reactors; the governments of Sweden and Germany pledged to phase out their own nuclear plants; resistance to new construction in the United Kingdom was strong; and Spain put in place a moratorium on new construction. These attitudes are now changing, likely as a result of subsequent uneventful nuclear operations and growing concerns about climate change and future energy needs.
Thus, Italy has announced plans to build nuclear plants; Sweden, after shutting down two plants, intends to reverse the planned phase-out and construct new nuclear plants; and the Labor government in the United Kingdom has recently announced plans to replace 18 nuclear plants retiring by 2023 with new ones.4 But this new outlook is not universal. The current head of the Spanish government remains opposed to nuclear power, and the current government in Germany still intends to shut down its 17 remaining nuclear plants. Meanwhile, new construction is planned or under way in Finland, France, and Japan, countries that never wavered in their support of nuclear power.
Overall, the IAEA projects that by 2030, world nuclear capacity could
|
4 |
Press articles discussing these developments in more detail include “Recalled to half-life,” The Economist, Feb. 12, 2009 (www.economist.com/world/europe/displaystory.cfm?story_id=13110000); “What Sweden’s nuclear about-face means for Berlin,” Der Spiegel, Feb. 6, 2009 (www.spiegel.de/international/world/0,1518,605957,00.html); “Italy seeks nuclear power revival with French help,” Reuters, Feb. 24, 2009 (uk.reuters.com/article/oilRpt/idUKLO72469220090224); “Spain must reconsider nuclear energy,”La Vanguardia, Feb. 25, 2009 (www.eurotopics.net/en/search/results/archiv_article/ARTICLE458-0); “Governments across Europe embrace nuclear energy,” ABC, Mar. 4, 2009 (www.abc.net.au/pm/content/2008/s2507565.htm); and “Europe looking set for a Nuclear Revival,” Your Industry News, Mar. 6, 2009 (www.yourindustrynews.com/europe+looking+set+for+a+nuclear+revival_26046.html). These articles were accessed in July 2009. |
increase by 27 percent under business-as–usual conditions, or in the agency’s “high case,”5 to nearly double, after accounting for retirements (IAEA, 2008b). Nonetheless, even in the high-case projections, nuclear power would rise only slightly as a percentage of total electricity generated worldwide—from 14.2 percent in 2007 to 14.4 percent in 2030—assuming business as usual for construction of fossil-fueled plants.
The handful of plants that could be built in the United States before 2020, given the long time needed for licensing and construction, would need to overcome several hurdles, including high construction costs, which have been rising rapidly across the energy sector in the last few years, and public concern about the long-term issues of storage and disposal of highly radioactive waste.6 If these hurdles are overcome, if the first new plants are constructed on budget and on schedule, and if the generated electricity is competitive in the marketplace, the committee judges that it is likely that many more plants could follow these first plants. Otherwise, few new plants are likely to follow.
Existing federal incentives7 for the first few nuclear plants may hasten initial construction. Even if this occurs, nuclear power’s share of U.S. electricity generation is likely to drop over the next few decades. In fact, for nuclear power to maintain its current share—19 percent of U.S. electricity—the equivalent of 21
|
5 |
The IAEA’s high estimates (IAEA, 2008b) “reflect a moderate revival of nuclear power development that could result in particular from a more comprehensive comparative assessment of the different options for electricity generation, integrating economic, social, health and environmental aspects. They are based upon a review of national nuclear power programmes, assessing their technical and economic feasibility. They assume that some policy measures would be taken to facilitate the implementation of these programmes, such as strengthening of international cooperation, enhanced technology adaptation and transfer, and establishment of innovative funding mechanisms. These estimates also take into account the global concern over climate change caused by the increasing concentration of greenhouse gases in the atmosphere, and the signing of the Kyoto Protocol.” |
|
6 |
Both nuclear plants and coal plants with carbon capture and storage (CCS) present intergenerational issues: nuclear plants because of the very long-lived radioactive waste, and coal with CCS because of the need for stored CO2 to remain underground for long periods. However, the timescales differ by orders of magnitude. For radioactive waste, this timescale is on the order of a million years; for CO2 it is likely significantly less because of the availability of natural mechanisms for removing CO2 from the atmosphere (see Ha-Duong and Keith, 2003; Hepple and Benson, 2005). |
|
7 |
In addition to federal incentives for construction, the first few nuclear plants benefit from incentives for operation, such as the production tax credit. This is discussed in more detail in Box 8.5 in this chapter. |
new 1.4 GW plants would need to be built by 2030 (not including new plants built to replace any that may be retired during this period), according to the reference-case projections of the U.S. Energy Information Administration (EIA, 2008).8
The amount of new U.S. nuclear generating capacity that could reasonably be added before 2020 is limited; however, if the first handful of new evolutionary plants (about 5 plants) are constructed and are successful, the potential for nuclear power after 2020 will have much increased. Thus, deployment of the first few nuclear plants would be an important first step toward ensuring a diversity of sources for future electric supply. It may prove to be important to keep the option of an expanded nuclear deployment open, particularly if carbon constraints are applied in the United States in the future.
TECHNOLOGIES
The existing nuclear plants in the United States were built with technology developed in the 1960s and 1970s. In the intervening decades, ways to make better use of the existing plants have been developed, as well as new technologies that are intended to improve safety and security, reduce cost, and decrease the amount of high-level nuclear waste generated, among other objectives. These technologies and their potential for deployment in the United States are explored in the following sections.
Improvements to Existing Nuclear Plants
Over the last few decades, there have been significant technical and operational improvements in existing nuclear power plants. These improvements have allowed nuclear power to maintain an approximately constant share of U.S. electrical capacity, even as demand has grown and no new plants have been constructed. This trend of increasing output from current plants is likely to continue over the coming decades and, before 2020, could result in additional nuclear capacity comparable to what could be produced by new plants. The potentials for improvements are focused in the following three areas:
|
8 |
According to the EIA, U.S. electricity demand could rise by as much as 29 percent between 2008 and 2030. The reader is referred to footnote 14 of Chapter 7 of this report (“Fossil-Fuel Energy”) for a discussion of uncertainty in EIA projections. |
-
Existing plants can be modified to increase their power output;
-
Existing plants’ operating lives can be extended; and
-
Downtimes (periods when the plant is not producing power) can be further reduced.
Such improvements, which are far less expensive than constructing new nuclear plants and can be implemented comparatively rapidly, are discussed below.
Power Uprates
A plant’s power output can be significantly increased (uprated) by replacing the fuel with higher-power-density/longer-lived fuel and by modifying major plant components. The latter includes, for example, replacing turbines and major heat exchangers with more efficient versions. Uprates are a cost-effective way to increase energy production: they typically cost hundreds of dollars per added kilowatt (kW) of capacity, compared to as much as $3000–6000 (overnight cost9) per kilowatt of electricity for new nuclear plants (see section on “Costs”). To date, 7.5 gigawatts-electric (GWe)10—amounting to about 7.5 percent of the current U.S. nuclear generating capacity—have been added through uprates.11
Many plants have already planned capacity additions. In 2008 alone, the USNRC approved 10 upgrades to existing plants, adding a total generating capacity equivalent to about half of one new nuclear plant. Eleven applications are pending, and the USNRC expects 40 more applications through 2013.12 If
|
9 |
Overnight cost is the cost of a construction project if no interest was incurred during construction, as if the project was completed “overnight.” All costs are expressed in 2007 dollars. |
|
10 |
The electric power output of a nuclear power plant is often described in gigawatts-electric (or simply gigawatts [GW]). Similarly, the thermal power output of a nuclear plant is stated in gigawatts-thermal (GWt). The thermal power output is typically about three times the electric power output. This is because the thermal efficiency of nuclear plants (the efficiency of converting heat to electricity via a steam turbine generator) is typically around 33 percent. |
|
11 |
The USNRC’s list of approved uprate applications is available at www.nrc.gov/reactors/operating/licensing/power-uprates/approved-applications.html; accessed July 2009. |
|
12 |
In 2008, applications were approved for capacity additions of about 2178 MWt. This would result in about 720 MWe of new electric generating capacity. New plants are assumed to have a capacity of 1.35 GWe. Pending applications represented a total of 973 MWe of capacity additions as of July 2009, and applications expected at that time represented 2075 MWe of capacity additions. The USNRC’s lists of pending and expected applications are available at www.nrc.gov/reactors/operating/licensing/power-uprates/pending-applications.html (pending) and www.nrc.gov/reactors/operating/licensing/power-uprates/expected-applications.html (expected); accessed July 2009. |
approved and undertaken, these uprates would add about 3 GWe—the equivalent of about 2 new nuclear plants—in the near term.
Operating License Extensions
More power can be also be generated over the lifetimes of existing plants by extending their operating licenses. In the United States, the initial license term for a nuclear power plant—40 years—is subject to extensions in increments of up to 20 years.13 In the 1990s, the USNRC established a regulatory system to assess applications for such extended licenses.
In the majority of cases, the owners of the currently operating U.S. plants will seek to extend plant licenses for an additional 20 years, to 60 years’ service in total. As of July 2009, 56 plants had received 20-year extensions, 16 plants were in the queue for approval, and 21 more had announced their intent to seek license extensions.14 The original 40-year limit was not technically based, but some technical challenges are involved in extending operating licenses because some structures and components may have been engineered assuming a 40-year operating life. This limitation will be avoided in new plants, which are being designed to ensure that components with expected lifetimes of less than a projected plant life of 60 years can be replaced readily.
The industry has begun to assess whether it would be technically feasible and economic to extend current plant operating licenses for an additional 20-year period beyond 60 years (to 80 years). The plant modifications that might be required for another 20-year extension are potentially more difficult and expensive than those for the first 20-year extension. Degradation phenomena that affect the performance of plants operating for as long as 80 years are not well understood at a fundamental level, and further research is needed prior to decisions about further license extensions. At this point, it is not clear whether the option will be practical, although there will be strong economic incentives to pursue it.
The USNRC, the U.S. Department of Energy (DOE), and industry are considering what research and development (R&D) will need to be done to prepare for the possibility of extending plant operating licenses beyond 60 years. Although participants in an USNRC/DOE workshop held in February of 2008 “did not
|
13 |
This was provided for in the Atomic Energy Act of 1954. |
|
14 |
The USNRC’s list of current and expected operating life extensions is available at www.nrc.gov/reactors/operating/licensing/renewal/applications.html; accessed July 2009. |
believe there is any compelling policy, regulatory, technical or industry issue precluding future extended plant operation” (USNRC/DOE, 2008), many areas were identified where R&D should begin soon. They included irradiation effects on primary structures and components (such as the reactor vessel, reactor coolant system piping, steam generators, pressurizer, and coolant pumps), aging effects on safety-related concrete structures, aging effects on safety-related cable insulation, and inspection capabilities for aging mechanisms.
Much of the equipment that is of concern is embedded in the structure of the plant and would be expensive and time-consuming to replace. Thus many of the issues imposed by plant lifetime extensions and materials aging require ways of nondestructively assessing the status of operating plants. New scanning systems are being developed, but further research is needed, particularly in light of the regulatory decisions that could rely on these inspections.
Decreasing Downtimes
Finally, more power can be generated over the course of a year by reducing the periods when the plants are not producing electricity. Existing plants have been operated with increasing efficiency over time, and average plant capacity factors (averaged across all operating nuclear plants) have increased markedly, from 66 percent in 1990 to 91.8 percent in 2007 (NEI, 2008). Nuclear plant operators in the United States have succeeded in reducing downtimes primarily through increased on-line maintenance as well as through efforts to plan outage times so as to ensure that necessary work is done quickly and efficiently.
As a result of such improvements, refueling outages—which are also used to perform necessary maintenance on the reactor—were reduced to an average of 40 days in 2007 (averaged across all currently operating U.S. plants) from 104 days in 1990. Based on the accomplishments of the best-performing plants to date, in the future these downtimes may be reducible to an average of 25–30 days while maintaining currently high levels of safety and reliability.
Nuclear Reactor Technologies15
A nuclear reactor generates heat by sustaining and controlling nuclear fission, and that heat is converted to electricity. The dominant use of nuclear reactor technol-
|
15 |
For a more thorough treatment of many of the issues reviewed briefly in this section, see Annex 8.A. |
ogy is in commercial nuclear power plants, which contribute baseload16 electric power generation.17 Nuclear plants can each include one or more nuclear reactors.
The waste heat18 from nuclear reactors can be utilized as well. For example, several countries, including Russia and the Ukraine, use nuclear reactors for cogeneration (or combined heat and power [CHP]). Particularly effective in cold regions, CHP uses waste heat from nuclear reactors to create steam, which is piped to heat surrounding areas. Such systems in nuclear plants have been discussed in the United States, but they are not currently deployed. In other countries (for example, Japan, India, and Pakistan), waste heat from nuclear plants is used for desalinization of seawater.
The majority of reactors used for electricity generation around the world are pressurized water reactors (PWRs) and boiling-water reactors (BWRs), reactors that are collectively referred to as light-water reactors (LWRs)—that is, they are thermal reactors (see Box 8.1) that use ordinary water both as the coolant and as the neutron moderator. These are the only reactor technologies currently used in the United States for commercial power production, where 69 PWRs and 35 BWRs are currently in service.
New nuclear reactor designs have been developed in the decades since these plants were deployed. In the sections that follow, the committee discusses these new designs, which are grouped into two categories:
-
Evolutionary reactor designs, which are modifications that have evolved from LWR designs currently operating in the United States
-
Alternative reactor designs, which range from more significant modifications of currently deployed designs to entirely different concepts
|
BOX 8.1 Fast Reactors and Thermal Reactors Nuclear reactors are often classified as “fast” or “thermal” reactors. This nomenclature refers to the energy of the neutrons that sustain the fission reaction. In fast nuclear reactors, the fission reaction is sustained by neutrons at higher energies (“fast” neutrons); in commonly deployed thermal reactors, such as light-water reactors, the fission reaction is sustained by lower-energy (“thermal” neutrons). Fast and thermal reactors are distinguished by the presence or absence of a material known as a “neutron moderator,” or simply “moderator.” This material is present in thermal reactors but not in fast reactors. Collisions with the moderator slow the neutrons emitted by fissioning nuclei to thermal energies. |
In the next few decades, the majority of the new nuclear plants constructed in the United States will be based on evolutionary reactor designs. In most cases, alternative reactor designs will require significant development efforts before they can be ready for deployment.
Evolutionary Reactor Designs
Any new nuclear plants constructed before 2020 will be evolutionary designs that are modifications (often significant) of existing U.S. reactors. These designs are intended to improve plant safety, security, reliability, efficiency, and cost-effectiveness. Some evolutionary designs include passive safety features that rely on natural forces, such as gravity and natural circulation, to provide cooling in the case of an accident. These features are intended to reduce capital cost while further enhancing safety margins.
Several evolutionary reactor designs will be ready for deployment in the United States after the USNRC completes design certification.19 In some cases, this could occur as soon as 2010 or 2011. Evolutionary reactors have already been built in Japan and South Korea, and they are under construction in India, France, and Finland. U.S. utilities have expressed potential interest in building plants with the following designs in the United States: the U.S. evolutionary power reactor (USEPR), the economic simplified boiling-water reactor (ESBWR), the advanced boiling-water reactor (ABWR), the AP-1000, and the advanced pressurized water
reactor (APWR). These designs are all modifications of current-generation LWR designs.20
Because construction of new nuclear plants is likely to require a long lead time, the first deployment of evolutionary nuclear reactors in the United States is unlikely to be until after 2015. Typical construction times for foreign plants have ranged from 4 to 7 years for plants that began construction in the last decade (IAEA, 2008c). Lead times for licensing and large component fabrication can also run to years. Current plans (as of July 2009) suggest that about 5–9 new nuclear plants could be on line in the United States by 2020, and a more substantial deployment of these plants may occur after 2020 if these first plants built in the United States meet cost, schedule, and performance targets. Moreover, actual construction will also depend on many other factors, including comparative economics and electrical demand.
Further R&D over the next decade could lead to efficiency improvements both in existing reactors and in evolutionary LWRs. Some of the key areas for continuing research include the following:
-
Improved heat transfer materials, such as high-temperature metal alloys, are being developed to improve efficiency by allowing for higher operating temperatures. Some of these materials may be available after 2025. Widespread application is likely between 2035 and 2050.
-
Coolant additives, such as very dilute additions of nanoparticles, can improve the heat transfer capabilities of the coolant in current and evolutionary LWRs. Twenty years or more are likely needed to develop the additives and redesign current reactors for their use.
-
Annular fuel rods could allow plants to produce significantly more power than traditional cylindrical fuel rods do. At least 10 years of work will be needed for regulatory approval and commercial-scale deployment in existing LWRs.
|
20 |
The ABWR and AP-1000 designs are currently certified by the USNRC, but applications for amendment have been received for the AP-1000 and are expected for the ABWR. The USNRC is currently reviewing design certification applications for the ESBWR, the USEPR, and the US-APWR designs. The review of the amended AP-1000 design and the ESBWR is targeted for completion in 2010, and for the USEPR and US-APWR in 2011. Available at www.nrc.gov/reactors/new-reactors/design-cert.html; accessed July 2009. |
-
Higher burn-up fuel would allow a larger percentage of the fissionable content of the fuel to be used. Thus operating cycles could be prolonged, and the heat load21 and total amount of used nuclear fuel22 to be stored or disposed of could be reduced.23 This is a program of continuous improvement, but for significant breakthroughs, basic research will be required, particularly on fuel-rod swelling due to buildup of fission products and the resulting risk of cladding breach.
-
Digital instrumentation and control (DI&C) research offers opportunities to improve control systems and to enhance control-room designs so as to facilitate appropriate operator action when needed. New LWRs will have fully integrated DI&C, and more research will be needed on the safety implications of an increased reliance on digital systems. Understanding the full implications of DI&C is likely to prove to be a long-term effort, despite the reliance on DI&C in the near term.
These types of R&D could improve both current and evolutionary reactors. However, evolutionary reactor technology is technically ready for deployment, and no major additional R&D is needed for an expansion of nuclear power through 2020, and likely through 2035.
Alternative Reactor Designs
In addition to the evolutionary reactor designs just discussed, alternative nuclear reactor designs are being developed (and, in some countries, have been used).24
These reactors range from more significant modifications of currently operating U.S. reactors to completely different concepts. Many new alternative reactor designs are intended to increase safety and efficiency and improve economic competitiveness, as well as to perform missions beyond electricity production.
The alternative reactor technologies that could be deployed in the United States include fast and thermal reactor designs. Both include modular designs as well as designs modified for high-temperature heat output (potentially for applications such as hydrogen production). Alternative fast reactor designs also include “burner” reactors—reactors intended to reduce the long-lived high-level radioactive waste burden by destroying transuranic25 elements—and “breeder” reactors—reactors intended to create more fissile material than is consumed.
Some alternative thermal reactor designs, including small modular LWRs, could be deployed in the United States shortly before or after 2020. For example, NuScale, Inc., has expressed interest in deploying a 45-MWe design before 2020. In addition, under the Next Generation Nuclear Plant (NGNP) program, the DOE is continuing to develop a commercial-scale prototype very-high-temperature reactor (VHTR)26 that would produce not only electricity but also process heat for industry. Hydrogen production is a possibility as well if materials—particularly for the heat exchangers and hydrogen process equipment—able to withstand the necessary high temperatures can be developed.27 The DOE requested expressions of interest in April 2008 for a demonstration high-temperature nuclear plant that could produce hydrogen and electricity;28 current plans are for start-up in 2018–2020.
|
25 |
“Transuranic elements” (also known as transuranics or TRU) are elements with an atomic number greater than uranium—that is, having nuclei containing more than 92 protons. Examples of transuranics are neptunium (atomic number 93), plutonium (94), and americium (95). |
|
26 |
The NGNP will have somewhat lower outlet temperatures than originally envisioned for a VHTR. |
|
27 |
At a briefing of the Nuclear Energy Advisory Committee (NEAC) in September 2008, DOE staff stated that they had reduced their high-temperature goal to 700–800°C because they did not have materials suitable for operation at higher temperatures. This situation makes hydrogen production problematic for the near term. |
|
28 |
The DOE’s request for expressions of interest for high-temperature nuclear plants is available at nuclear.gov/pdfFiles/NGNP_EOI.pdf; accessed July 2009. |
In contrast, many R&D issues must be successfully addressed before fast reactors—particularly fast burner reactors—can be expected to make a contribution to U.S. energy production. A great deal of engineering development work will be required to move these reactor designs from the drawing board through prototypes and pilot plants to full-scale facilities. In addition, further study will be needed to improve reliability and reduce costs (some experts have estimated fast reactors may cost between 10 and 30 percent more than LWRs, as discussed in the section titled “Cost of Alternative Plant Designs and Fuel Cycles” later in the chapter).
While other types of fast reactors are under investigation, fast burner reactor technology has been emphasized in the United States because of concerns about high-level radioactive waste management. In principle, by using alternative fuel-cycle technologies, transuranics from used fuel can be incorporated into burner reactor fuel and then fissioned, as discussed in more detail in the following section. This option has the potential to reduce the volume and heat load of residual high-level radioactive waste that needs to be managed for very long times.29 Fast reactor technologies are not new, and historically, those that have been deployed have experienced problems.30 But it is the committee’s judgment that, although deployment should not be pursued at present, the long-term potential provides justification for a continued R&D program on fast burner reactors and associated fuel-cycle technologies.31 If this R&D is undertaken, the committee judges that the first generation of fast burner reactors to transmute nuclear wastes has the technological potential to come on line after 2025, and they could be deployed commercially after 2035 if they prove economically competitive.
Alternative Fuel Cycles32
Nuclear fuel cycles are divided into two major categories: once-through, in which the fuel is removed from the reactor after use and disposed of, and closed, in which the used fuel is recycled to extract more energy or to destroy undesirable isotopes. Recycling used fuel requires several steps, including chemical or electrochemical processing to separate the fissionable parts of the used fuel and to enable the fabrication of new fuel,33 which can then be utilized in a reactor. To achieve high efficiency for burning or breeding, multiple repetitions of this process are required.
The United States currently uses a once-through fuel cycle, though U.S. policy on closing the nuclear fuel cycle has varied over time.34 As of the writing of this report, the Obama administration had announced plans to pursue “long-term, science-based R&D … focused on the technical challenges of the back end of the nuclear fuel cycle” but not to pursue near-term commercial demonstration projects for closed fuel cycle technologies at present.35
Closed fuel cycle technologies (for either burning or breeding) are not needed to enable the near-term expansion of nuclear power in the United States, at least until 2050. Uranium supplies are sufficient to support a worldwide expansion of nuclear power using a once-through fuel cycle for the next century. Moreover, used fuel from even a greatly expanded nuclear fleet can be safely stored for up to a century (APS, 2007; Bunn, 2001), with or without a licensed geologic repository. In addition, a closed fuel cycle raises proliferation issues that
|
32 |
The term “fuel cycle” describes the life cycle of a nuclear reactor’s fuel. For a more thorough treatment of many of the issues reviewed in this section, the reader is referred to Annex 8.B (“Alternative Fuel Cycle Technologies”). |
|
33 |
In addition to new fuel, it is also technically possible to form transuranic targets, which are specialized assemblies designed for burning transuranics in thermal reactors. This possibility is discussed in Annex 8.B. |
|
34 |
The Nixon administration supported closing the fuel cycle. The Ford and Carter administrations opposed it. Under the Reagan administration, reprocessing again became a possibility, but industry concluded that it was not economic. The first Bush administration followed the lead of the Reagan administration, but the Clinton administration opposed the use of reprocessing. The policy of the second Bush administration was to establish a geologic repository at Yucca Mountain, Nevada, for the disposal of used fuel, and it also wished to implement a program that would explore closing the fuel cycle in the longer term while pursuing a limited recycle option in the near term. As part of this program, a specific closed fuel cycle was selected for investigation by the DOE. There is no legal bar to reprocessing in the United States today. |
|
35 |
Available at www.neimagazine.com/story.asp?sectionCode=132&storyCode=2052719; accessed July 2009. |
have not been resolved.36 The benefits and drawbacks of deploying closed fuel cycles in the United States are currently being debated, as discussed in Box 8.2.
To implement closed fuel cycles, separations technologies are needed to process the used fuel so that it can be formed into new fuel. The current-generation technology for such recycling is plutonium and uranium extraction (known as PUREX), which is well understood and could be deployed in the United States after 2020,37 but it carries a significant proliferation risk.38 Alternatives to PUREX currently under investigation include both evolutionary modifications of PUREX and entirely different separations technologies. A modified PUREX technology currently under development that allows some amount of uranium to remain in the plutonium stream would be somewhat more proliferation resistant than is PUREX,39 but it would not likely be commercially deployable until well after 2020.40 Other separations technologies, intended to further improve proliferation resistance as well as to reduce the volume and long-term radioactivity of the waste, are even farther from the commercial deployment stage. These technologies include UREX+ (a suite of aqueous processes best suited for oxide fuels such as those used in LWRs) as well as electrochemical separations.41 Neither process is likely to be available for commercial-scale deployment before 2035.
|
BOX 8.2 Recycling of Used Nuclear Fuel Concerns about proliferation could discourage the United States from pursuing the commercialization of used fuel recycling at present.1 Current technology for separations, plutonium and uranium extraction (PUREX), poses a proliferation risk, and modifications of PUREX to increase proliferation resistance do not greatly improve the situation. Some suggest that if the United States were to deploy recycle technologies (or, some argue, even pursue further R&D on them), it would become more difficult to stop other countries from doing the same. But others argue that the United States could positively influence recycling elsewhere by developing and deploying technologies that are more proliferation resistant than PUREX. Although future R&D may develop more proliferation resistant options, these options are highly unlikely to be entirely proliferation resistant. True proliferation control will require strong international arrangements to supplement technical advances, and developing such arrangements will require considerable time and effort. It is the judgment of the committee that, at present, used fuel recycling does not appear to be a promising option for commercialization in the United States before 2035. However, the committee believes that a continuing R&D program on alternative fuel cycles is justified, as there may be a need for such technologies in the future. |
Further R&D will help to clarify the trade-offs between the risks and benefits involved in the use of recycle technology. For example, if proven technically successful and economic, burning fuel cycles (intended to reduce the volume of long-lived high-level radioactive waste) could, over the long term, substantially change the discussion on storage and disposal of radioactive waste. If a major fraction of the transuranics in high-level waste could be transmuted into shorter-lived fission products with half-lives of 1000 years or fewer, the waste-disposal challenge would involve managing the waste for thousands of years rather than hundreds of thousands of years. In addition, the number of geologic repositories needed to isolate long-lived high-level radioactive waste has the potential to be significantly reduced.42 However, significant technology challenges must be overcome before
burning fuel cycles could be ready for commercial deployment. Overall, it is the judgment of the committee that the potential benefits of burning fuel cycles are sufficient to justify continuing long-term R&D, but that the technologies are not yet ready for near-term deployment. Two major categories of burning fuel cycles—full recycle and limited recycle—as well as associated technology challenges are briefly discussed in the paragraphs that follow.43
A full recycle program (such as that envisioned by the second Bush administration) would involve processing used fuel, making new fuel using some of the recovered material, and using that fuel in fast burner reactors (discussed in the section titled “Nuclear Reactor Technologies”). This sequence would be repeated multiple times to destroy transuranics.44 A fully closed fuel cycle would be designed to significantly reduce the volume of long-lived waste produced per kilowatt-hour, but this transmutation would never burn 100 percent of the long-lived isotopes. Hence a repository, or repositories, capable of sequestering very long-lived high-level civilian waste might still be needed.45 In addition, a larger quantity of low-level waste46 would be produced, primarily during used fuel processing and new fuel fabrication. Further R&D is needed in order for any fully closed fuel cycle to be ready for deployment, with long-term goals of this effort being reduction of the cost and proliferation risk of fuel cycle processes and their associated facilities. If such R&D were initiated, the committee judges that a fully closed fuel cycle could be reasonably deployed sometime after 2035 if shown to be economically competitive.
|
43 |
Many of these technologies are discussed in more detail in Annex 8.B as well as in a previous National Research Council report on the DOE’s nuclear energy R&D program (NRC, 2008). |
|
44 |
A large number of burner reactors would be required to enable full recycle; however, such a system has not been planned in detail, and the exact ratio of fast reactors to LWRs required is not well known. |
|
45 |
A repository for managing waste over hundreds of thousands of years would almost certainly be required for high-level defense waste. |
|
46 |
Low-level waste is a general term for a wide range of wastes having generally lower levels of radioactivity. See www.nrc.gov/reading-rm/basic-ref/glossary; accessed in July 2009. |
Alternatively, options for burning transuranics using limited recycle in thermal reactors—such as inert matrix fuel and transuranic targets47—are also currently being investigated. Under these options, the used fuel from LWRs would be processed to separate plutonium and uranium from transuranics and other elements. In principle, new fuel or targets would then be formed (incorporating the transuranics to be destroyed), and some fraction of the transuranics would be burned in thermal reactors.48 If successfully demonstrated and shown to be cost-effective, limited recycle could reduce the long-lived high-level waste burden without introducing the complication of fast reactors. (However, with repeated passes, a state of diminishing returns would be reached, and ultimately, a fast neutron spectrum would be required to continue to destroy transuranics.) For these technologies, more R&D as well as subsequent regulatory approval will be required if they are to be deployable between 2020 and 2035. As is the case with many of the alternative concepts, the economic viability of the approach is very uncertain.
Based on the preceding discussion, it is clear that pursuing alternative fuel cycle options (including burning fuel cycles) will require a resource-intensive and time-consuming R&D program. This finding is consistent with the conclusions of a recent National Research Council study that examined the DOE’s nuclear energy R&D programs (NRC, 2008). Initially, further research would need to be done in comparing the various architectures for closing the fuel cycle; this effort would enable judicious selection of any specific architecture for eventual deployment. Moreover, the architecture for the fuel cycle would have to be coupled with a waste-disposal regime, and R&D would be needed before any of these fuel cycles would be ready for deployment, with the exception of mixed oxide (MOX)/PUREX. But that fuel cycle has significant proliferation risks. Indeed, any closed fuel cycle based on current designs is likely to be more expensive and to result in more proliferation risk than a once-through fuel cycle. Closed fuel cycle R&D should be directed toward solving these problems, and any alternative fuel cycle that is ultimately deployed should be designed to minimize stockpiles of separated weapons-usable materials.
|
47 |
These options are discussed in more detail in Annex 8.B. |
|
48 |
Limited recycle is currently being applied outside the United States, where mixed-oxide (MOX) fuel is formed from used LWR fuel and utilized in commercial reactors. However, MOX fuel as currently implemented is not effective for destroying long-lived transuranics such as americium and neptunium, which are included in the waste stream. Under the limited recycle option, used MOX fuel is disposed of as high-level waste. |
Fusion Energy
In principle, nuclear fusion49 could offer a virtually unlimited supply of energy with significantly reduced (and shorter-lived) quantities of radioactive waste. Over the last 50 years, many countries (the United States, Russia, Japan, the United Kingdom, and others) have investigated the concept of controlled fusion for electricity production (NRC, 2004). There is a multinational effort under way to develop a “burning plasma”50 machine, the International Thermonuclear Experimental Reactor (ITER), by 2025.51 ITER is intended to provide the information needed to assess the practicality and cost of a fusion reactor. If successful, fusion reactors would be unlikely to be ready for commercial deployment until after 2050, absent some major breakthrough.
COSTS
The cost of uprating an existing nuclear plant to increase its power output can be reasonably well estimated; however, the costs of new nuclear technologies are uncertain. There has been recent interest in building evolutionary nuclear plants, for example, but companies’ estimates of costs for construction vary widely. And the costs of alternative plants and fuel cycles are even less clear at this point. These cost issues are discussed in the following sections.
Costs of Improvements to Current Plants
Improving current nuclear plants for the purpose of increasing power output or extending operating lifetimes is significantly less expensive per kilowatt of capacity than constructing a new plant. Depending on the type of uprate, plant uprates can cost from hundreds of dollars to about $2000 per added kilowatt of capacity, while new plants could cost as much as $6000/kW (overnight cost), as noted in the section to follow. For a plant license extension to 60 years, there is the expense of developing the associated documentation (approximately $50–60 million), and
in many cases there also are costs associated with replacing or modifying structures or components for longer operating life. As in the case of uprates, these expenses are small in comparison to those of new plants.
Costs of Electricity from Evolutionary Plants52
While the costs of building a nuclear power plant are relatively high, the costs for fuel, operations, and maintenance are relatively low. Because most nuclear power plants in operation in the United States have been fully amortized, the average operating cost of electricity from the current fleet of plants is modest—1.76¢/kWh in 2007—less on average than all other sources, with the exception of hydropower.53 Although operating costs are likely to be low for new plants as well, the levelized cost of electricity (LCOE)54 is likely to be relatively high because of the substantial construction costs. (See Box 8.3 for a discussion of the distinction between electricity cost and price.)
Recent cost estimates55 for new nuclear plant construction differ by over a factor of two, in part because of the recent dramatic escalation in construction and materials costs that have affected construction costs for all types of energy facilities. Thus there is considerable uncertainty regarding any estimates now in the literature, as present conceptions of future costs are in flux. Another part of the uncertainty reflects the absence of recent U.S. experience.
The AEF Committee has developed estimates of the LCOE for new evolutionary nuclear plants using these recent cost estimates as a starting point and
|
52 |
For a more thorough discussion of the committee’s cost estimates, reviewed briefly in this section, the reader is referred to Annex 8.C (“Projected Costs for Evolutionary Nuclear Plants”). The estimates discussed in this section are limited to evolutionary reactor designs and assume a once-through fuel cycle. |
|
53 |
This information is available at www.nei.org/resourcesandstats/documentlibrary/reliableandaffordableenergy/graphicsandcharts/uselectricityproductioncosts/. |
|
54 |
The levelized cost of electricity at the busbar encompasses the total cost to the utility—including interest costs on outstanding capital investments, fuel costs, ongoing operation and maintenance (O&M) costs, and other expenses—of producing the power on a per-kilowatt-hour basis over the lifetime of the facility. This is not the same as the price of electricity to the consumer, particularly in states that have restructured their electricity markets. |
|
55 |
The range of estimates for the levelized cost of electricity is discussed in more detail in Annex 8.C. Multiple primary cost estimates were relied on by the committee (including Scroggs, 2008; Moody’s Investor’s Service, 2008; NEI, 2008b; Keystone Center, 2007; Harding, 2007). |
|
BOX 8.3 Levelized Cost of Electricity Versus Electricity Price In restructured markets, the price of electricity to the consumer is related to the cost of electricity to the distribution utility—as opposed to the cost to the merchant owner of the plant to produce that electricity. Utilities can either negotiate long-term contracts with independent power producers (IPPs) or buy electricity in the spot market from the IPPs.1 In that market, the electricity price the utility must pay reflects the price of the most expensive electricity in the dispatched mix (the clearing price), rather than the levelized cost of electricity (LCOE) for a given plant. Thus for lower-priced sources of electricity, the utility may have to pay significantly more than the LCOE to the IPP, if the IPP can provide the power from a low-cost source. In recent years, the use of nuclear power plants has generally been very profitable for merchant producers because the prices they have obtained have generally been the much higher prices for electricity produced by natural gas plants. |
assuming that the plants come on line in 2020.56 Estimates were obtained for two distinct cases: plants built by investor-owned utilities (IOUs) and those built by independent power producers (IPPs).57 The cost of nuclear power at the busbar58 is sensitive to the return on investment because of the high capital costs associ-
|
56 |
The committee gathered ranges for the key modeling parameters from a variety of sources, with the help of a workshop that was convened in March 2008. Stakeholders in attendance reflected diverse viewpoints, including those prevalent in industry, nonprofits, and academia. The committee used these parameter ranges (discussed in detail in Annex 8.C) in a spreadsheet calculation based on the economic model developed for the 2007 study by the Keystone Center (2007) and supplemented by a Monte Carlo analysis. Thus, these costs are not forecasts or predictions, but rather the result of an analytical exercise based on available but imperfect data. |
|
57 |
Vertically integrated (typically investor-owned, but also municipal and public) utilities own generating plants as well as the transmission and distribution system that delivers the power to their customers. In the past, this was the dominant model, but restructuring of the electricity market in some states has transformed the industry. In restructured markets, generation, transmission, and distribution may be handled by different entities. For example, independent power producers (IPPs) may sell power to distribution utilities or even directly to end users. |
|
58 |
The “cost at the busbar” refers to the cost to the electricity producer; it does not include transmission or distribution costs. |
ated with nuclear power.59 In addition, a risk premium is likely to be expected by investors in plants built by IPPs because of the absence of the financial protections afforded to a regulated entity. For baseload electricity, cost comparisons between different options can be helpful to decisionmakers. The committee used different but comparable methods to estimate the LCOE for future nuclear and fossil plants (see Box 8.4).
For new nuclear plants that may be constructed between 2008 and 2020 the committee estimates that the LCOE from plants built by IOUs will fall between 8¢/kWh and 13¢/kWh and that the LCOE for plants built by IPPs will also be 8¢/kWh to 13¢/kWh, in 2007 dollars.60 These ranges assume an overnight construction cost of between $3000 and $6000 per kilowatt, and a 4–7 year construction period.61 These cost estimates also rely on several financial parameter ranges listed in Annex 8.C of this report, including a central debt-to-equity ratio of 60:40 for IPPs and 50:50 for IOUs. These estimates do not account for any current or future federal incentives for new plant construction.
In some cases, companies interested in building nuclear power plants have stated that their financial assumptions include an 80:20 debt-to-equity ratio (Turnage, 2008). Such a financing structure is likely to require federal loan guarantees—for example, those included in the Energy Policy Act of 2005 (discussed in more detail in Box 8.5). The committee estimated the LCOE of new nuclear plants using an 80:20 debt-to-equity ratio, and assuming that federal loan guarantees for 80 percent of the eligible project costs are acquired. These incentives could result in a significant reduction in financing costs, and ultimately a lower LCOE at the busbar: the estimated range decreases to 6–8¢/kWh both for
|
59 |
The financial parameter ranges used for the cost calculations are shown in Table 8.C.1 in Annex 8.C. |
|
60 |
Although the costs of equity capital are likely to be cheaper for investor-owned utilities (IOUs), they are likely to take on a larger equity share than IPPs. For this and other reasons, including differences in the duration of equity repayment, the levelized cost of electricity (LCOE) for IOUs and IPPs turn out to be in the same range. However, it should be borne in mind that the ability of an IPP to compete in a restructured market depends more on the early year costs of electricity than the LCOE. Because the cost in the early years is generally greater than the LCOE, the IPP numbers here are not definitive in assessing the market competitiveness of IPP nuclear plants. |
|
61 |
These ranges encompass most of the values found in the open literature. A factor of 0.8 (derived using the Keystone spreadsheet used by the committee) was used to convert some all-in cost estimates to overnight costs, where appropriate, for comparison. |
|
BOX 8.4 Comparing the Methodologies Used to Determine Costs of New Nuclear and Fossil-Fuel Power Plants Nuclear and fossil-fuel-fired power plants provide baseload electricity supply, and a comparison of their potential cost ranges is likely to be helpful in guiding decision making. However, when making these comparisons using the data shown in this report, it should be noted that slightly different (but comparable) methodologies and assumptions have been used to estimate the ranges of potential LCOE from new fossil-fuel-fired power plants (with and without carbon capture and storage [CCS]) and from new nuclear power plants. (A discussion of the LCOE for intermittent renewable electricity sources, as well as of other energy technology options, such as energy efficiency technologies, can be found in Chapter 2.) The methodologies for estimating the LCOE for nuclear plants and fossil-fuel plants differ, at least in part because different consultants assisted the committee in developing the LCOE estimates. Although both nuclear and fossil-fuel plants provide baseload electricity and both of them are capital intensive, several of the underlying assumptions needed to calculate the LCOE are not identical. For example, a 20-year financing period was used to estimate the LCOE for new coal plants with CCS, while a 40-year financing period was used for new nuclear plants. A 20-year financing life is appropriate for a new technology such as CCS (whereby the first few plants may not operate for as long as later versions), while evolutionary light-water reactors are a more mature technology and thus more likely to operate for 40 to 60 years or beyond. In addition, the LCOE for coal plants with CCS drops between 2020 and 2035 as more experience is gained in building plants in the United States. The same reasoning has not been applied to nuclear plants, although some vendors expect that construction costs will be reduced over time, as there is more experience in constructing them. The LCOE for new nuclear plants does not change in current-year dollars between 2020 and 2035. Overall, the LCOE ranges for new coal plants with CCS and new evolutionary nuclear power plants appear to be comparable, as shown in Chapter 2 of this report. |
IOUs and for IPPs.62 The IPP first-year cost in this case is estimated to be between 7¢/kWh and 9¢/kWh. When the full 80 percent is guaranteed by the federal gov-
|
62 |
With the exception of the debt-to-equity ratio (80:20), the value used for return on debt (4 percent), and the addition of the loan guarantee fee required by the DOE, the assumptions are the same for this calculation as for the previous ranges. The details of these calculations can be found in Annex 8.C. |
|
BOX 8.5 Federal Incentives for New Nuclear Construction There are many policies that influence the viability of nuclear power in the United States.1 In particular, several federal incentives for nuclear power are in place that could affect the potential for nuclear power plant construction. The primary ones are the federal loan guarantees and production tax credit (PTC) included in the Energy Policy Act of 2005 (EPAct05).2 This law allows for a 1.8¢/kWh PTC for new nuclear power facilities for an 8-year period after the plant is placed in service (and before 2021) for the first 6000 MWe of installed capacity brought on line before 2021. This PTC could help the first few nuclear plants compete, but it does not change the cost of generating electricity. The loan guarantees are likely to have a larger effect. EPAct05 allows the Secretary of Energy, after consultation with the Secretary of the Treasury, to provide loan guarantees for up to 80 percent of eligible project costs for nuclear plant construction. It is not yet clear if the $18.5 billion loan guarantee allocation for nuclear projects contained in the 2008 Energy and Water Development Appropriations Act will be sufficient to guarantee four to five new plants, which is the number the committee judges would be needed to demonstrate that new nuclear plants can be built on schedule and on budget in the United States. The DOE issued a loan guarantee solicitation announcement in June 2008, and the Part 1 applications that were filed in response to this solicitation requested a total of $122 billion. To obtain a loan guarantee the licensee must pay a fee that is designed to cover the default risk, given a licensee’s credit rating. This “loan guarantee subsidy fee” covers the estimated long-term cost to the government of the loan guarantee,3 calculated on a net present value basis. The exact value of these fees has not been released by the DOE, but according to the agency’s website (www.lgprogram.energy.gov, accessed May 12, 2009), they will be in accordance with the methods for calculating loan guarantee subsidy costs outlined in OMB Circular A-11, part 185.4 Using information from that circular, Standard and Poor’s has attempted to estimate potential ranges for the subsidy fee (although the precise methods of calculation of the fee are not publicly available). It found that, “[f]or example, if a 1,000 MW nuclear unit built at $6,000 per kilowatt, with 80% financing from the FFB, is rated ’BB-’ with |
ernment, the standard government loan-guarantee rules require that the government itself allocate and provide the capital for the investment, which is repaid by the entity receiving the guarantee; presumably over a 30-year period in this case. A fee is also charged (loan guarantee fee) to cover the risk of failure to repay the loan. The magnitude of this fee is to be estimated by the DOE based on guidance from credit rating agencies.
|
a recovery of 70%, the subsidy cost would be a substantial $288 million while a ’BB’ rated project at the same recovery may have to pay about $192 million”5 (Standard and Poor’s, 2008). These guarantees will allow a high percentage of debt compared to equity (as much as 80 percent), which means lower average financing costs, for two reasons. First, the cost of debt is less than the cost of equity. Second, a loan guarantee means that the interest on the debt will be less than the interest that would otherwise be required. The total reduction in financing costs could result in a significantly lower levelized cost of electricity (LCOE) at the busbar, as discussed in more detail in the “Costs” section of this chapter. |
Overall, these costs seem very high compared to average wholesale electricity prices (5.7¢/kWh in 2007),63 but they may not seem so high in the future if price trends for primary fuels continue or if constraints or fees are placed on carbon
emissions.64 Finally, it should be reemphasized that such calculations, while useful, are not predictions of the future.
Cost of Alternative Plant Designs and Fuel Cycles
It is difficult to project the cost of electricity generated from plants using alternative advanced nuclear plant designs and fuel cycles. Some alternative plant designs may offer cost decreases resulting from reduced quantities of steel and concrete used in construction (Peterson, 2008), but in general, plants incorporating alternative reactor designs are likely to be significantly more expensive to construct than LWRs are. For example, a Russian expert estimated that construction costs for sodium-cooled fast reactors could be 10–15 percent more expensive than LWRs, although this range was based on limited analysis (Ivanov, 2008); the DOE estimated that fast reactors (intended to be deployed as part of the Advanced Fuel Cycle Initiative program under the Bush administration) could be as much as 30 percent more expensive than LWRs (Lisowski, 2008). As for any electricity source, in addition to construction costs, the LCOE will also depend on the capacity factor of the deployed fast reactors and other considerations. If the decision is made to pursue fast reactors, further R&D to reduce costs will be valuable.
The LCOE for plants using alternative fuel cycles is likely to be higher than for those using once-through fuel cycles, though how much higher remains uncertain. For example, the LCOE for plants using limited recycle with current-generation technology is likely to be higher than from plants using the once-through fuel cycle; however, different studies have come to different conclusions about limited recycle’s economic feasibility. In general, limited recycle using MOX/PUREX is likely to be competitive with a once-through fuel cycle only if the price of uranium is high and if the cost of reprocessing is relatively low. A study by the Massachusetts Institute of Technology concluded that limited recycle could cost approximately four times more than the once-through fuel cycle (MIT, 2003), and another study by Bunn et al. (2003) noted that at current uranium prices, limited recycle could increase the costs attributable to used fuel management by more than 80 percent. In contrast, a study by the Boston Consulting Group
|
electricity markets. See DOE/Energy Information Administration, available at www.eia.doe.gov/cneaf/electricity/wholesale/wholesalet2.xls; accessed July 2009. |
|
64 |
A comparison of the LCOE from various generating technologies (including coal, gas, and renewable technologies) can be found in Chapter 2 of this report. See especially Figure 2.10. |
(BCG, 2006), which was funded by Areva, found that the cost of limited recycle using MOX/PUREX in the United States could be comparable to the cost of the once-through fuel cycle, and an earlier study by OECD/NEA (1994) found that reprocessing was about 14 percent more expensive per kilowatt-hour of generated electricity than was the once-through fuel cycle.
Another example discussed earlier in this report is the case of a system using a fully closed fuel cycle (including fast reactors as well as fuel cycle plants). The LCOE for such a system remains speculative, but it is likely to be more expensive than the once-through approach, as a large number of fast reactors and reprocessing plants will be required. On the other hand, as discussed in the section on “Alternative Fuel Cycles,” such a closed cycle would produce a smaller volume of long-lived high-level waste than the once-through fuel cycle produces, and the long-term heat load could be reduced owing to the destruction of a large fraction of transuranics in the used fuel. If fission products were also removed from the fuel and handled separately, the short-term heat load could also be reduced, potentially allowing closer packing of waste in a repository. In this case—although a quantitative analysis has yet to be done—the increased expense for the reprocessing, the fuel fabrication, and the fast reactors might be counterbalanced by reduced cost for waste disposal if one or more future repositories become unnecessary.
POTENTIAL FOR FUTURE DEPLOYMENT
The AEF Committee’s estimates of the potential supply from nuclear power in 2020, 2035, and 2050 are discussed in this section and tabulated in Table 8.1. The committee has estimated the maximum deployment of new nuclear plants that could be built under an accelerated deployment program, as described in Part 1 of this report; however, no attempt has been made to predict what will in fact be built. Any such prediction is intrinsically uncertain because it depends on many factors, including the economic conditions in the United States and around the world over the coming decade.
The contribution of new nuclear power plants to the U.S. electricity supply before 2020 is likely to be limited because new plant construction requires a long lead time: it can take some 4 years to obtain a construction and operating license and 4–7 years to build the plant (consistent with current world trends, as shown
TABLE 8.1 Potential Supply of Nuclear-Generated Electricity in 2020, 2035, and 2050
|
|
Additional Electric Supply Compared to 2009 (TWh/yr) |
LCOE (¢/kWh) |
Maximum Net U.S. Electric Supply from Nuclear Powera (TWh) |
|
|
Many New Plants After 2020 (“Nuclear Renaissance”) |
No New Plants After 2020 (“Nuclear Stall”) |
|||
|
2020 |
Uprates of current plants: 39–63 (Capacity: 5–8 GWe) |
Uprates: negligible additional cost |
810 (current) + 94–158 (new) − 0 (retirements) Total Supply: 904–968 |
810 (current) + 94–158 (new) − 0 (retirements) Total Supply: 904–968 |
|
New Plants: 55–95 (Capacity: 7–12 GWe) |
New Plants: IOU: 8–13 IPP: 8–13 With federal loan guarantees and 80/20 financing: IOU: 6–8 IPP: 6–8 |
|||
|
2035 |
Uprates of current plants: 39–63 (Capacity: 5–8 GWe) |
New Plants:b IOU: 8–13 IPP: 8–13 With federal loan guarantees and 80/20 financing: IOU: 6–8 IPP: 6–8 |
810 (current) + 780–851 (new) − 204–209 (retirements) Total Supply: 1381–1452 |
810 (current) + 94–158 (new) − 204–209 (retirements) Total Supply: 695–759 |
|
New Plants: 741–788 (Capacity: 94–100 GWe) |
||||
in Figure 8.1).65 Thus, if the prospective owner/operator of a nuclear plant applied for a combined construction and operating license (COL) in 2009, the plant would be unlikely to produce electricity before 2017.66
|
|
Additional Electric Supply Compared to 2009 (TWh/yr) |
LCOE (¢/kWh) |
Maximum Net U.S. Electric Supply from Nuclear Powera (TWh) |
|
|
Many New Plants After 2020 (“Nuclear Renaissance”) |
No New Plants After 2020 (“Nuclear Stall”) |
|||
|
2050 |
Uprates of current plants: 39–63 (Capacity: 5–8 GWe) |
Unknown |
810 (current) + 1545–2381 (new) − 798–814 (retirements) Total Supply: 1541–2393 |
810 (current) + 94–158 (new) − 798–814 (retirements) Total Supply: 90–170 |
|
New Plants: 1545–2381 (Capacity: 196–302 GWe) |
||||
|
Note: New plants are assumed to be evolutionary designs and to have an average capacity of 1.35 GWe, except for the completion of the 1180 MWe Watts Bar-2 reactor. New plants are assumed to operate with an average capacity factor of 90 percent, and currently operating plants are assumed to continue to operate at an average capacity factor of 91 percent. Five to 9 new plants are assumed completed between 2009 and 2020; 3 per year between 2021 and 2025; 5 per year between 2026 and 2035; and 5–10 per year between 2036 and 2050. Retirements reflect the assumption that all currently operating plants receive operating license extensions to 60 years. PWRs are uprated by 10–12 percent and BWRs by 20–25 percent before being retired. All costs are expressed in constant 2007 U.S. dollars. GWe = gigawatts-electric; IOU = investor-owned utility; IPP = independent power producer; LCOE = levelized cost of electricity; TWh = terawatt-hours. aExtending the operating licenses for a fraction of currently operating plants to 80 years would decrease the number of plants retired between 2035 and 2050. Without license extensions allowing for 80-year operating lifetimes, the last currently operating plant will retire before 2056. bAfter 2020, the uncertainties in the parameter ranges are so large that costs cannot be reliably estimated. For illustrative purposes, the committee assumes no net change in real costs per kilowatt-hour after 2020. However, after 2020, many factors could affect the actual LCOE: construction costs may be reduced as experience is gained with the new designs; high rates of escalation in construction costs are likely to stabilize; and the successful construction and operation of several plants may cause financing to become more favorable. On the other hand, delays and other difficulties during construction could significantly increase costs. |
||||
It is the judgment of the committee that as many as 5–9 additional nuclear plants could be constructed by 2020.67 This projection is based on two factors: first, the Tennessee Valley Authority recently approved a project to complete the Watts Bar-2 nuclear reactor, expected to be online by 2013;68 second, the committee estimates that as many as 4–8 new evolutionary nuclear plants could be constructed by 2020, with a number of follow-on projects that would lag the initial plants by 2 or 3 years.
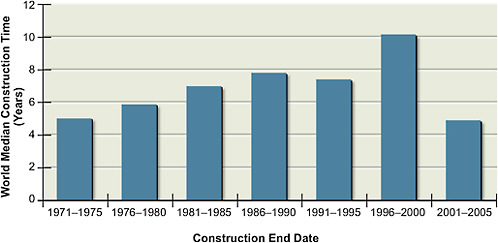
FIGURE 8.1 Average construction times for nuclear plants around the world, 1971–2005. Construction times have been decreasing worldwide for plants started since the 1990s, with recent averages over the last 5 years between 4 and 6 years from first concrete to connection to the grid.
Source: IAEA, 2007.
There are several reasonable scenarios that, in the short term, could result in 4–8 new plants. For example, each of the four major supplier teams could initiate one or two projects—one or two units of the same reactor design on a single site—once the licensing process was complete. Alternatively, several utilities could focus on one design to begin to build a fleet of standard plants; in this case, one vendor might build more than one pair of plants in the first wave. Given the currently announced plans, either scenario is plausible. These 4–8 new plants (with an average rating of 1350 MWe69) and the 1180 MWe Watts Bar completion project could increase the total U.S. nuclear generating capacity by 7–12 percent.70
Power uprates on existing plants could add another 5–8 percent to the U.S.
nuclear generating capacity by 2020, for a total increase (with new plant construction) of 12–20 percent by 2020. The maximum uprate likely with readily available technologies is estimated at 20–25 percent of the plant’s power for BWRs and 10–12 percent for PWRs. If each currently operating plant in the United States is uprated by this maximum amount reasonable71 (accounting for uprates that have already been performed), as much as 5–8 GW of additional power could be added in total. Nearly all of these capacity additions are likely to occur before 2020. As noted previously, the USNRC currently projects that it will receive applications for 3.0 GW of uprates by 2013.
It is likely, given the COL applications received by the USNRC as of July 2009, that most of the new units will be added at existing sites.72 The advantages are significant, including reduced costs (because existing infrastructure is already available); the ability to connect to existing transmission lines (although the capacity of these lines may need to be expanded); and the existence of an operating organization. In addition, local populations and governments are more likely to be supportive.
However, existing sites may not be where the demand for power exists. Building at new sites will entail extra costs to purchase the site and prepare it for construction, as well as to build new transmission lines. Also, public concerns about safety and security may need to be addressed in the regions surrounding the new plant.
After 2020, there is significantly more uncertainty in the estimated supply from nuclear power plants. Assuming that all currently operating plants receive 20-year license renewals (for total service lives of 60 years), their operating licenses will begin to expire in 2028. Because the current nuclear plants are such low-cost power producers, there is a large economic incentive to extend their operating lives even further, by an additional 20 years, to 80 years. But, as noted earlier, because many technical challenges are still to be overcome it is not clear whether extending the lifetimes of current plants to 80 years will be possible.
If not, there will be a rapid drop in nuclear capacity between 2030 and 2050, as shown in Figure 8.2. By 2035, about 30 GW will be retired; by 2050, nearly all currently operating nuclear plants will be retired. Because of the long lead times
|
71 |
Improvements or efficiency gains not yet identified have not been included in the calculation, and further improvements to existing plants may be possible. |
|
72 |
The USNRC’s current list of received COL applications is available at www.nrc.gov/reactors/new-reactors/col.html; accessed July 2009. |
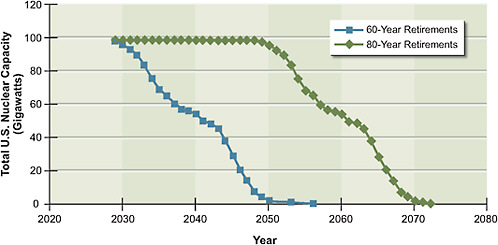
FIGURE 8.2 Effect of operating life extensions on current U.S. nuclear generating capacity. Blue squares represent the generation capacity of currently operating nuclear power plants assuming license extensions to allow for 60-year operating lives. Green diamonds represent the capacity of the current fleet of plants assuming that all 104 plants receive license extensions to allow for 80-year operating lives.
Source: USNRC, 2008.
involved in nuclear plant construction, companies will need to decide, by 2020 or shortly thereafter, whether to replace many of these plants with new nuclear reactors. However, companies are unlikely to be in a position to make such decisions with assurance at that time, unless several new U.S. nuclear plants will already have been added. It is likely that investors would want to observe whether they could be built in the United States on schedule and on budget while demonstrating safe and cost-effective operation. Thus, one purpose of providing federal loan guarantees is to acquire information needed by 2020 to make these decisions that will affect long-term U.S. electrical capacity.
If the first handful of new nuclear plants are constructed on schedule and on budget, and if they demonstrate safe and cost-effective operation, significantly more plant construction could follow between 2020 and 2050. However, if these first plants do not meet these requirements, few additional new plants are likely to be built.73 To estimate the maximum number of nuclear power plants that could
be added after 2020, the AEF Committee relied on the historical build rates in the United States: about 5 reactors per year were constructed between 1965 and 1985 as nuclear power expanded its share of electric power generation and power demand grew rapidly. In the committee’s judgment, a construction rate averaging 3 plants per year from 2021 to 2025 (to allow for learning) followed by a rate of 5 plants per year from 2026 to 2035 seems achievable. After 2035, assuming that electricity demand continues to expand, a construction rate of 5–10 plants per year could be sustained. Ultimately, however, the number of plants built will be influenced by future electricity demand, public attitudes about nuclear power, and the economic competitiveness of nuclear power compared to alternative sources of electricity.
POTENTIAL BARRIERS
Although there are several potential barriers to deployment of new nuclear power plants, the committee judges that these barriers can be reduced or eliminated if the first handful of plants are constructed on schedule and on budget, and they demonstrate initial safe and secure operation.
Economics
The large initial or upfront capital investment required for construction of new nuclear power plants could present a barrier to the expansion of nuclear power in the United States. Even for larger utilities, such a plant can represent a significant fraction of the company’s net worth,74 potentially putting the entire company at risk should the project be delayed substantially or costs escalate significantly. In addition, the substantial cost of constructing new plants is associated with a relatively high cost of electricity produced by these plants (in comparison to the cost
associated with existing plants). The significance of this barrier will depend on the growth in demand for electricity, the cost of electricity from alternative sources, and what price (if any) is placed on carbon.
Financial markets are likely to be wary of investments in new nuclear plants until it is demonstrated that they can be constructed on budget and on schedule. Nuclear plants have not been built in the United States for decades, but there are unpleasant memories, because construction of some of the currently operating plants was associated with substantial cost overruns and delays. There is also a significant gap between when construction is initiated and when return on investment is realized.
Thus, it is likely that subsidies or financial guarantees that protect investors (as discussed in Box 8.5) will be required for the first few plants. But if these investments turn out to be financially favorable, the means to support construction of additional new plants is likely to be found. Innovative financial arrangements such as joint ventures, consolidation, and risk sharing among the participants may be required, however, and difficulties involved in working out these new financial structures (particularly in regulated utilities) could affect progress toward new construction.
Regulatory and Legislative Issues
All of the existing nuclear power plants in the United States were licensed using a two-step process: first, the USNRC issued a construction permit once it was satisfied with the preliminary plant design and the suitability of the site; second, USNRC staff undertook a detailed study of the plant after construction to determine whether to issue an operating license. This process has sometimes been blamed for extensive delays in operations and expensive retrofits of constructed plants.
In recent years, the licensing process for U.S. nuclear plants has been extensively revised. The new process allows reactor design certifications, early site permits, and COLs to be granted before the plant is constructed.
Utilities have shown interest in proceeding with applications for combined licenses, to the point that the processing of the current surge of applications could cause short-term delays in beginning new plant construction. In addition, the USNRC had initially expected that, in most cases, plant designs and sites (via early site permits) would be certified before a COL was sought for a plant.
However, many COL applications have been submitted for designs that are concurrently subject to design certification review, and nearly all of the proposed applications will not seek an early site permit. As a result, the orderly stepwise process that had originally been anticipated is not occurring. This means that the work associated with the issuance of a COL must be more extensive than anticipated and that design certifications in many cases are occurring in parallel with review of COL applications. This has complicated the licensing process for the USNRC.
Public Concerns
Public concerns about nuclear technologies, such as the safety and security of nuclear facilities and the disposal of nuclear waste, could pose a barrier to an expansion of nuclear power in the United States—at least in some areas of the country. Overall, however, recent U.S. polls have shown a majority of respondents75 favoring the use of nuclear power to provide electricity, and a majority (51–67 percent) supporting the building of new nuclear plants.76 This shift over the last two decades is likely the result of the improved performance and safety record of nuclear plant operations in the United States, as well as the growing concerns about the impacts of CO2 emissions on climate change.77 Public opinion may change (becoming either more or less supportive), depending on the performance and public perceptions of the new plants.
|
75 |
In a 2009 Gallup poll, 59 percent of respondents favored the use of nuclear power for providing electricity. This number has been holding approximately steady since 2004 (Gallup, 2009), but there has been a recent rise. A 2008 Fox News poll found that 53 percent considered nuclear power to be a safe source of energy. See www.foxnews.com/story/0,2933,369827,00.html; accessed July 2009. |
|
76 |
A 2008 Zogby poll found that 67 percent of Americans surveyed support the building of new nuclear plants (23 percent were opposed, while 10 percent were unsure) (Zogby, 2008). A 2008 Fox News poll found that 51 percent supported the building of new plants. See www.foxnews.com/story/0,2933,369827,00.html; accessed July 2009. |
|
77 |
For example, in a recent poll, 71 percent of students who considered themselves environmentalists were in favor of the continued use of nuclear energy (Bisconti Research, Inc., 2006). |
Safety and Security
Public concerns about the safety78 and security79 of nuclear power plants may serve as a barrier to new construction. This phenomenon has two aspects: some members of the public question whether it is possible to operate nuclear power plants safely and securely; others are concerned, even should safety and security be technically achievable, about the enforcement of regulations to adequately ensure them (UCS, 2008).
Public opinion about the safety of nuclear plants has become more positive over time: a 2006 poll showed that 60-plus percent of respondents believed nuclear power plants to be highly safe, in contrast to 35 percent with the same pollster in 1984 (Bisconti Research, Inc., 2006). However, any perceived slippage in safety or a reactor accident anywhere in the world could have an adverse impact on this currently favorable attitude. Similarly, whether security concerns will become a barrier to future development of nuclear power could depend on the level of terrorist activity in North America and possibly elsewhere, particularly if the activity specifically targets nuclear facilities.
Some members of the public are also concerned about the health effects on neighboring populations of small amounts of radiation released during routine nuclear plant operations. These emissions are typically several orders of magnitude below statutory limits and would not be expected to produce significantly increased health risks to people living near the plants compared to health risks if no plants were present. However, they can be of great concern to local citizens who may not have confidence in the regulatory limits.80
Disposition of Used Fuel
Public concerns about the federal government’s failure to develop a final disposal pathway for commercial used fuel may also serve as a barrier to new construction. As discussed in more detail later in this chapter, from a technical perspective the absence of a geologic disposal facility does not present an impediment to contin-
|
78 |
Safety is defined here as measures that would protect nuclear facilities against failure, damage, human error, or other accidents that would disperse radioactivity into the environment. |
|
79 |
Security is defined here as measures to protect nuclear facilities against sabotage, attacks, or theft. |
|
80 |
An example is the controversy over tritium leaks at the Braidwood plant in Will County, Illinois. News coverage of public concerns about these events can be found online at www.pbs.org/newshour/bb/environment/jan-june06/tritium_4-17.html; accessed July 2009. |
ued operation of existing plants or to new construction. Technical analyses have shown that used fuel can be stored for up to a century in dry cask81 storage at low risk of release of radioactive material (see the “Impacts” section following). Concerns remain, however, and 11 states have barred construction of new reactors until the nuclear waste problem is solved.82 But such barriers may be softening, as some progress has recently been made on state bills introduced to overturn these bans.83
Domestic Technology and Skills Base
There could be shortages in certain parts and components (especially large forgings), as well as in trained craft and technical personnel, if nuclear power expands significantly worldwide. The population of suppliers of nuclear parts and components has become more limited over the last two decades, and the number of American Society of Mechanical Engineers (ASME) nuclear certificates84 held around the world fell from nearly 600 in 1980 to about 200 in 2007 (ASME, 2008). There is also an insufficient supply of people with the requisite education or training at a time when vendors, contractors, architects, engineers, operators, and regulators will be seeking to build up their staffs. In addition, 35 percent of the personnel now working at U.S nuclear utilities will become eligible for retirement in the next 5–10 years (NEI, 2007).
|
81 |
Used fuel is dry-stored in heavily shielded casks that use passive heat removal systems (conduction and convection) for cooling after it has been actively water cooled in a “used fuel pool” for at least 3 years. (See footnote 100 for a definition of used-fuel pools.) Storing and disposing of used fuel is discussed in the “Impacts” section of this chapter. |
|
82 |
Eleven states require that the USNRC make some finding regarding the potential for disposal of used nuclear fuel before an existing moratorium on new nuclear power plants within their borders is lifted. These states are Illinois, California, Wisconsin, Kentucky, Connecticut, Massachusetts, Maine, Oregon, West Virginia, Montana, and New Jersey. Minnesota prohibits new nuclear power plants altogether. |
|
83 |
Legislative hearings were held in Minnesota in March 2009 to consider the lifting of its ban. The lifting of the ban was approved by the state senate, and narrowly defeated by the state house; it will be introduced again next year. In Kentucky, a bill will be presented to the state house in 2009 that would strike down the moratorium; it was approved by the state senate and by a house committee. The governor of Wisconsin has expressed willingness to consider nuclear power as a possibility, although a bill to overturn the state ban was not taken up by the state senate (after passing the state house). |
|
84 |
The American Society of Mechanical Engineers maintains a nuclear certification program that provides a standard for quality assurance of construction materials, design, operation, inspection, and continuing maintenance of nuclear facilities. |
These bottlenecks will be a particular problem for the construction of plants between now and 2020, though they should resolve themselves over time. Some expansion is already occurring to meet this demand: Japan Steel Works is working to double its capacity, and enrollment in universities’ nuclear engineering departments is increasing. Economic incentives will eventually yield the resources in personnel and material to enable new construction to proceed, but there may be short-term dislocations as the worldwide economy adjusts.
IMPACTS
Given the small number of new nuclear plants likely to be built before 2020, their near-term impacts (compared to the currently operating fleet) are likely to be small.
Environmental85
Compared to other baseload electrical generation options, operating nuclear power plants have relatively few adverse environmental impacts, such as those derived from SOx, NOx, mercury, or CO2 emissions. The magnitude of any environmental benefits of new nuclear plants will depend on the number of plants ultimately built, of course, as well as on the environmental profiles of the energy sources displaced.
Greenhouse Gas Emissions
The U.S. power sector overall is a significant source of greenhouse gas emissions, totaling roughly 2.4 billion tonnes of CO2 in 2007 (see Figure 1.11 in Chapter 1). One of the environmental advantages of nuclear power is its small greenhouse gas footprint. In 2007, U.S. nuclear power plants were responsible for approximately 70 percent of the greenhouse-gas-free electricity production in the United States.86 However, before 2020, new nuclear plants will contribute relatively little to reducing the total greenhouse gas emissions from the U.S. power sector because of the
|
85 |
For a more thorough discussion of the topics briefly reviewed in this section, see Annex 8.D (“Environmental Impacts of Nuclear Technologies”). |
|
86 |
This estimate was calculated by adding the nuclear and renewable contributions to U.S. electricity, and calculating the nuclear fraction of this total. |
limited number of new plants that could be built (although the existing plants are likely to continue to contribute significantly). However, after 2035, if significant new construction has taken place during the preceding 15 years, the greenhouse gas emissions reduction could be substantial.
The AEF Committee uses a low case and a high case to estimate avoided CO2 equivalent emissions. For the low case, the committee’s estimate of potential new nuclear capacity (e.g., 5–9 plants by 2020) replaces an equal generating capacity of natural gas plants. For the high case, the committee’s estimate replaces an equal generating capacity of traditional coal plants without CCS.87 The CO2-equivalent emissions of the current U.S. electric power supply (about 600 tonnes CO2 equivalent per GWh) lie between the CO2 emissions of natural gas plants (about 500 tonnes CO2 equivalent per GWh) and coal plants (about 1000 tonnes CO2 equivalent per GWh).
Thus, the deployment of 12–20 GWe of new nuclear capacity (through uprates of current plants and new plant construction) could avoid some 40–150 million tonnes of CO2 equivalent per year by 2020 (0.04–6 percent of 2007 emissions).88 In 2035, a deployment of 99–108 GWe of new nuclear capacity (including that deployed before 2020) could avoid 360–820 million tonnes of CO2 equivalent per year (15–34 percent of 2007 emissions). As much as 730 million to 2.3 billion tonnes of CO2 equivalent per year could be displaced in 2050 (30–96 percent of 2007 emissions). No assumptions about scheduled plant retirements are made in these estimates. The potential reductions are shown in Table 8.2, alongside projections for the total CO2 emissions from the electric power sector in 2020, 2035, and 2050.
Nuclear power plants do emit a small quantity of CO2 on a life-cycle basis—resulting largely from energy used for processes such as uranium enrichment and plant construction—but U.S. emissions from uranium enrichment are likely to decrease in the future because several energy-efficient gas centrifuge enrichment
|
87 |
The source for the low and high supply estimates as well as capacity factors and other assumptions can be found in the section of this chapter on deployment of new nuclear plants. |
|
88 |
This calculation assumes that nuclear power plants emit 40 tonnes of CO2 equivalent per GWh (including emissions from construction, mining, fuel fabrication, and other processes). The reader is referred to Annex 8.D of this report for an explanation of how the committee arrived at 40 tonnes of CO2 equivalent per GWh. Nuclear plants are assumed to be operated at an average capacity factor of 90 percent. The maximum electricity supply from nuclear power (in TWh) in each of 3 years—2020, 2035, and 2050—is shown in Table 8.1. |
TABLE 8.2 Avoided CO2 Emissions for New Nuclear Capacity in 2020, 2035, and 2050
plants89 are being constructed and planned in the United States.90 By 2011, the two such plants expected to be on line may replace the current energy-intensive gaseous diffusion enrichment plant91 at Paducah, Kentucky. In addition, if future sources of electric power used for fuel enrichment emit less CO2, this will be reflected in the life-cycle emissions of operating nuclear plants.
Mining and Milling of Nuclear Fuel
Environmental impacts occur from the multiple processes involved in fabricating nuclear fuel. Several of these processes and their primary environmental impacts
|
89 |
Gas centrifuge plants enrich uranium through a cascade of centrifuges, which utilize the very slight mass difference between U-235 and U-238 to separate the two isotopes. For a given output, this process requires significantly less energy than does enrichment by gaseous diffusion. |
|
90 |
The effect of these new enrichment facilities on the U.S. fuel supply is discussed in more detail in the section titled “Uranium Resources.” |
|
91 |
Gaseous diffusion plants enrich uranium by forcing uranium hexafluoride through a cascade of many stages of semipermeable membranes. Like the gas centrifuge process, the gaseous diffusion process utilizes the slight mass difference between U-238 and U-235 to increase the percentage of U-235 in the final product. |
are discussed in the paragraphs that follow. For more detail on the environmental impacts of these and other processes, the reader is referred to Annex 8.D.
The primary impact of mining, in which natural uranium is extracted from the earth, and milling, in which natural uranium is chemically converted to a dry and purified uranium concentrate, is the production of slightly radioactive byproducts known as mill tailings, which are disposed of in “tailings piles.” Radon emissions from mill tailings were previously an issue of public concern in the United States. At present, uranium milled in the United States is subject to comprehensive regulation for the control of environmental impacts, including radon emissions, under the Uranium Mill Tailings Radiation Control Act of 1978. The majority of uranium is imported from nations such as Canada and Australia, which have regulations equivalent to those of the United States. However, 17 percent is imported from nations that may not have equivalent regulations, primarily Namibia and Kazakhstan (see www.eia.doe.gov/cneaf/nuclear/umar/table3.html; accessed July 2009).
In some locations, a process called in situ leach (ISL) mining has replaced hard-rock mining and milling of uranium. The use of ISL entails smaller amounts of mill tailings to be disposed of; however, there is potential for other environmental impacts, including groundwater contamination and increased water use.
An expanded deployment of nuclear power in the United States (particularly after 2020) may result in increased demand for uranium, with an associated increase in worldwide uranium mining and milling. If more mining is undertaken in the United States to meet increased domestic demand for uranium, domestic environmental impacts may rise.
Water Use
All thermal power plants use significant quantities of water during operation, primarily for cooling. Overall, the committee does not view water use to be a national barrier to an expansion of nuclear power plants in the United States. However, the water use and consumption of new plants may have significant local impacts, as would occur for any thermal power plant.
Nuclear power plants on average require more cooling water per kilowatt-hour of electricity produced than do fossil-fuel plants of comparable age, due to nuclear power plants’ lower average thermal efficiency. Most U.S. power plants use one of two types of cooling processes: once-through cooling or closed-cycle wet cooling. In some instances, these wet cooling systems can
use nonfreshwater sources such as seawater (if located on the coast), brackish water from wells or estuaries, agricultural runoff, “produced water” from oil and gas drilling operations, or treated municipal wastewater (Veil, 2007). The water consumption is often of concern with thermal power plants; however, the water use92 can also be an issue, as cooling water is returned to the source at a higher temperature.
The water-use impacts of future nuclear plants will depend on where the new nuclear plants are sited (for example, along a coastline versus the arid Southwest) and what cooling technologies are employed. If deployed after 2020, alternative cooling technologies such as dry cooling93 or hybrid cooling94 could reduce water use compared to current technologies. Dry cooling has been used for some coal-fired plants,95 but at present no commercial nuclear plants have been constructed using this technology; it is likely to have significant disadvantages, including higher costs, higher operating power requirements, and reductions in plant efficiency and capacity during hot-weather periods. Hybrid cooling may be used in several evolutionary nuclear plants proposed for construction in the United States in the near term, including the new reactor planned by UniStar for the Calvert Cliffs site in Maryland (Pelton, 2007).
Waste Management and Disposal
Electricity production by means of nuclear power results in several types of radioactive waste, all of which must ultimately be disposed of. They include waste from uranium mining and fuel production (just discussed); waste produced during operations (such as contaminated gloves, tools, water-purification filters and resins, and plant hardware); and used fuel. Additional waste will be generated when the plant itself is decommissioned.
The construction of new nuclear plants in the United States will cause the production of additional used fuel, other operational waste, and decommission-
ing waste. The characteristics of these by-products will be similar to those being produced by current plants, with two possible exceptions. First, the burn-up of nuclear fuel will likely increase as new fuel designs are developed. This will reduce the mass of used fuel generated per unit of electricity generation, although it will increase the volume of transuranics and fission products (resulting in more radioactivity) per unit mass. Second, some new plants will have fewer cables, pipes, valves, and pumps than current-generation plants have, and in some cases less structural steel and concrete. This latter element could reduce decommissioning costs and time (as well as front-end construction costs and time), while also reducing the amount of material requiring disposal.
The majority of these wastes, including most of the radioactive decommissioning waste, can be disposed of in land disposal facilities.96 However, higher-activity97 wastes constitute the primary concern; in the case of used fuel in particular, the radioactivity is very long-lived and will need to be managed (though not necessarily actively) for hundreds of thousands of years. Thus concerns associated with managing this waste are intrinsically intergenerational. Facilities for disposal of higher-activity wastes (including but not limited to the used fuel) are not available, however, and plants are currently storing such wastes on-site until a disposal pathway is determined.98
The Nuclear Waste Policy Act provided that the disposal of used fuel from commercial nuclear power plants was a federal responsibility and that a deep geological repository would be built and operated by the federal government for this purpose.99 The DOE filed an application in June 2008 to construct a repository at Yucca Mountain, Nevada. If that application (and a subsequent operating amendment) were approved by the USNRC and survived expected court
|
96 |
A “land disposal facility” is a disposal facility located within a few tens of meters of the land surface for the disposal of radioactive wastes. A “geologic repository” is not considered a land disposal facility. |
|
97 |
Activity is the rate of decay of radioactive material per unit time. |
|
98 |
The DOE has developed an environmental impact statement (EIS) for the disposal of high-level waste and nuclear fuel at the Yucca Mountain site. Licensees have already prepared EISs for storage on their sites. |
|
99 |
Disposal is to be funded by a fee of $1/MWh, paid by the ratepayers of nuclear electricity-generation companies and collected in a federally administered fund. At the end of 2007, just over $27 billion had been credited to the fund from industry payments and interest, of which about $9 billion was spent to develop a repository. Current nuclear power generation adds about $800 million to the fund annually. (See www.ocrwm.doe.gov/about/budget/index.shtml; accessed July 2009.) |
challenges, the DOE expected to open the repository after 2020. However, the prospects for the Yucca Mountain repository have been diminished and perhaps completely eliminated by the declared intent of the Obama administration not to pursue this disposal site. As stated by Energy Secretary Steven Chu before the Senate Budget Committee on March 11, 2009: “Yucca Mountain is not a workable option and … we will begin a thoughtful dialogue on a better solution for our nuclear waste storage needs” (www.congressional.energy.gov/documents/3-11-09_Final_Testimony_(Chu).pdf; accessed July 2009). The fiscal year 2010 Presidential Budget Request begins the process of eliminating funding for the Yucca Mountain program.
The statutory limit for the amount of used fuel that was planned for disposal at Yucca Mountain is less than the amount of used fuel that will ultimately be produced by existing commercial reactors. Thus, even if Yucca Mountain were approved, a second geologic repository would be needed, or modification of the statutory limit for Yucca Mountain would be required, or the fuel cycle would have had to be altered. Political and technical issues make any of these options highly speculative.
As noted previously, technical analyses have shown that used fuel could be stored for up to a century in dry cask100 storage at low risk (APS, 2007; Bunn, 2001).101 It could be stored either at plant sites (the current practice in the United States) or at regional or national facilities. Interim storage has several advantages: the storage facilities can be monitored and maintained for indefinite periods of
time; and extended surface storage allows time for the radioactive decay of isotopes with shorter half-lives, thereby reducing the heat load of the used fuel if it were later emplaced in a repository. Interim storage also could offer advantages if the United States decides to pursue reprocessing, but it has disadvantages as well: the siting and licensing of interim storage sites would likely present challenges, and eventual regional or national storage would require transport of used fuel from the plant sites.
Transportation of used fuel would result in additional expense, could engender political and public opposition, and would necessitate transporting the fuel a second time if a repository were eventually opened. In 2006, the National Research Council found that there are no fundamental technical barriers to the safe transport of used fuel and high-level waste in the United States. However, it also found that such transport faces a number of social and institutional challenges (NRC, 2006).
Of course, interim storage only buys time. The United States must eventually find appropriate means for the long-term disposition of used fuel. However, dry cask storage gives us decades to define the path for such disposition.
Safety and Security
The safety and security of nuclear power involve not only the resistance to accidents and attacks on the plants themselves but also the safety and security of the associated fuel cycles—including the potential for proliferation of weapons-usable nuclear materials and technologies.
Resistance to Accidents and Attack102
It is possible that an accident at a nuclear power plant or an attack on it could result in off-site releases of radioactive material. There are two potential sources for such radioactive releases: the nuclear fuel in the reactor core, and the used fuel being actively cooled in water pools after having been removed from the reactor.103 An accident or terrorist attack that disrupted the flow of coolant to the
|
102 |
For a more thorough discussion of the topics briefly reviewed in this section, see Annex 8.E (“Safety and Security Impacts of Nuclear Technologies”). |
|
103 |
After its removal from the reactor, used fuel continues to generate heat. Thus it must be stored in water-filled pools that have active cooling systems to remove this heat. The pools also have water-filtering systems to remove radioactive contamination. |
reactor core could damage the fuel and release some of its radioactive materials to the environment. An accident or a terrorist attack on a used-fuel pool could have similar consequences.
The 5–9 new plants that could be built before 2020 would not significantly add to the safety impacts of the 104 plants already in place. As noted earlier in this chapter, a larger number of new plants could be deployed in the United States after 2020, as many as 65 between 2021 and 2035, and an additional 75–150 between 2036 and 2050. However, if the new plants meet design specifications, their safety and security impacts will likely be comparable to or lower than the impacts of the plants already in place.
The evolutionary and advanced plant designs described in this chapter have features that are designed to incrementally enhance safety and security over the existing fleet of plants, including better physical protection of the core and used-fuel pools. Some of the designs have cooling systems that rely more on natural forces such as gravity and convection—as opposed to the operation of pumps and valves—to maintain cooling. The designs also incorporate multiple independent safety systems to ensure reliability and improve survivability should there be an accident or an attack. The vendors of some evolutionary designs cite probabilistic risk assessment (PRA) evaluations to claim that their designs have a core damage frequency (CDF)104 at least 10 times better than that of existing plants (Matzie, 2008; Parece, 2008).
Every U.S. nuclear plant has the capability to withstand an attack at the level of the Design Basis Threat (DBT),105 which is approved by the USNRC and is subject to periodic force-on-force testing. Since the September 11, 2001, attacks, changes to access controls and enhancements of the DBT have resulted in the strengthening of security.
Attacks that are beyond the DBT (including aircraft attacks) are also a concern. The USNRC and the nuclear industry have undertaken analyses of existing plants to determine their vulnerability to aircraft attacks and have made modifications to the designs and operations to mitigate the consequences. Moreover, the
USNRC recently promulgated a rule requiring applicants for new nuclear reactors to identify features and functional capabilities of their designs that would provide additional inherent protection from or avoid or mitigate the effects of an aircraft attack. The details of these analyses and modifications have not been released to the public (because of security concerns), and the committee has not reviewed this information.
Proliferation
Given that the United States is a nuclear weapons state, an expansion of nuclear power and associated fuel cycle technologies in this country does not directly affect the proliferation of nuclear weapons technology. The proliferation debate focuses primarily on this impact of nuclear power in other countries.
Nuclear power plants themselves are not a proliferation risk,106 but nuclear fuel cycle technologies such as enrichment and reprocessing introduce the risk that weapons-usable material could be produced. This is possible because the same technologies used to enrich nuclear fuel for power plants (typically 4–5 percent U-235) can be applied to achieve higher enrichments for producing weapons-usable material. In addition, conventional fuel recycling technologies (i.e., the PUREX process) separate plutonium from uranium and other transuranics.
Some argue that any departure from a once-through fuel cycle—and the associated deployment of reprocessing technologies—in the United States could indirectly lead to an increased risk of nuclear weapons proliferation via a global expansion of such technologies; even the continued U.S. R&D on alternative fuel cycles, some suggest, could encourage such a global expansion. Others argue that other countries already seeking to pursue nuclear technologies are unlikely to be governed or constrained by U.S. approaches. They suggest instead that the United States actively involve itself in fuel cycle technology development in order to lead the way to more proliferation-resistant approaches.
Because proliferation prevention is driven primarily by international politics and understandings, the example set by the United States can play only a limited role in the proliferation arena. In addition, new technology can support, but not drive, strengthened international arrangements. Thus the course of development of commercial nuclear power in the United States is but one factor in the overall proliferation picture. Meanwhile, there are difficulties with current international
efforts, particularly as the International Atomic Energy Agency (IAEA)—the organization responsible for nuclear safeguards and inspections—has limited inspection authority in some countries and, in any event, requires more resources to fulfill its mission (IAEA, 2008d).
International plans have been suggested to mitigate proliferation risks associated with the fuel cycle, even while increasing the use of nuclear power worldwide. For example, the second Bush administration’s Global Nuclear Energy Partnership (GNEP) program sought to provide a mechanism guaranteeing fresh nuclear fuel for civilian reactors and thus reducing the incentive for various countries to invest in enrichment plants. Another aspect of GNEP, in principle, was to take back used fuel so that nations currently lacking reprocessing capability would have less incentive to develop it. The position of the Obama administration on the international aspects of the GNEP program has not yet been decided, and the United States currently has no plans to take back any used fuel (with the exception of some classes of used research reactor fuel). The United States is unlikely to develop such a plan until a solution has been found for handling its own used fuel.
Uranium Resources
World uranium supplies will not be a barrier to the continuing operation of the current fleet of plants or to the expansion of nuclear power in the time periods considered in this report. The estimated supply of uranium is sufficient to supply the current and projected fleet of plants using a once-through fuel cycle for more than a century (OECD/NEA, 2007); current world uranium reserves are considered to be about 5.5 million tonnes, recoverable at a cost of up to $130/kg (OECD/NEA, 2007). Undiscovered resources107 are estimated at greater than 10.5 million tons.108 However, an analysis of current and undiscovered uranium resources indicates that exploitable resources are likely to be in the range of
100–250 million tons at prices below $410/kg,109 about 3.6 times the June 2009 monthly average uranium spot price of $114/kg.
In 2007, 14.2 million separative work units (SWU) of enriched uranium were purchased by the owners and operators of U.S. commercial nuclear power plants, only 11 percent of which was enriched domestically. The remaining 89 percent was enriched abroad, including a significant proportion from down-blended Russian highly enriched uranium (representing around 33 percent of the uranium used in U.S. commercial reactors [in U3O8-equivalent units]). The United States Enrichment Corporation, Inc. (USEC) operates the single commercial enrichment facility in the United States, a gaseous-diffusion plant in Paducah, Kentucky.
However, U.S. enrichment capacity is also unlikely to be a barrier to the continuing operation of the current fleet of plants or to the expansion of nuclear power in the time periods considered in this report. The Louisiana Energy Services Limited Parnership’s National Enrichment Facility in New Mexico is scheduled to come on line in 2009, and the USEC America Centrifuge Plant is scheduled to come on line in 2010, achieving full production in 2012. Areva is planning a third facility at a site in Idaho, with construction beginning in 2011. GE is undertaking an engineering demonstration program to test and verify laser-enrichment technology for commercial-scale production.110
These new plants will produce a significant quantity of enriched uranium. The LES plant has a planned capacity of 3 million SWU per year, and the company recently (November 2008) announced that it will pursue an expansion to 5.9 million SWU; the USEC plant has a planned capacity of 3.8 million SWU per year; and the Areva facility has a planned initial capacity of 3 million SWU per year. The combined capacity of 10–13 SWU per year is nearly as much enriched uranium as was used by the 104 operating commercial U.S. nuclear plants in 2007.
Secondary sources of uranium (from government and commercial inventories, including dismantled nuclear warheads and re-enriched uranium tailings) are now depended on for 40 percent of the uranium used in world reactors.
|
109 |
Uranium price cited was converted to 2007 dollars from 2001 dollars ($350/kg in 2001 dollars) using the Consumer Price Index conversion of 1.170 (www.uxc.com/review/uxc_Prices.aspx; accessed July 2009). |
|
110 |
The USNRC’s description of this facility is available at www.nrc.gov/materials/fuel-cyclefac/laser.html; accessed July 2009. |
Because there is a long lead-time associated with bringing new primary resources into production, a short-term supply shortfall may develop as these secondary sources decline. However, the United States is presently down-blending 17 tonnes of highly enriched uranium to be available for a fuel bank,111 and as more disarmament agreements are reached, it is likely that more Russian and U.S. highly enriched uranium will become available to be down-blended for use in power reactors.
FINDINGS
Companies in the United States are expressing renewed interest in building new nuclear power plants. Reasons cited include favorable recent experience with existing nuclear plants, particularly with regard to improved reliability and safety; concerns about natural gas prices; barriers to the construction of new coal-fired power plants; and concerns about the potential for future regulatory restrictions on CO2 emissions. Like renewable sources, nuclear power plants produce no greenhouse gases during operations.
Thus there could be significant growth in this country’s nuclear capacity in the years ahead, although substantial barriers—including high capital costs and lack of a means for the long-term disposition of used nuclear fuel—remain. The committee’s major findings on the future deployment of nuclear technologies are given below:
Plant deployment: Until 2035, new U.S. nuclear power plants are likely to be based primarily on plant designs that are evolutionary modifications of currently operating U.S. plants. Commercial deployment will depend largely on the economics of new plant construction.
-
Evolutionary designs. Evolutionary nuclear plant designs are technically ready for commercial deployment now. These designs incorporate features intended to improve operating efficiency, reliability, safety, and security.
-
Alternative designs. Some alternative nuclear reactor designs may be ready for commercial deployment by 2035. In the United States, high-temperature reactors for more efficient electricity generation or for industrial applications such as hydrogen production could be demonstrated by 2020 and deployed commercially 3–5 years later. Burner reactors intended for transmuting nuclear wastes could be demonstrated after 2025 and deployed commercially after 2035. Ultimately, commercial deployment of these technologies will depend in large part on whether they are proven to be economic.
-
Fusion. Fusion power technologies are unlikely to be ready for deployment during the time periods considered in this report, absent a significant technological breakthrough.
Used fuel disposition: The disposition of used nuclear fuel remains unresolved. The committee has identified the major issues as
-
Storage. Used fuel can continue to be stored safely and securely in dry casks at operating U.S. nuclear plants, or at one or more centralized aboveground storage sites, for up to a century until a permanent disposal solution is available. U.S. nuclear power plants produce enough spent fuel per year to fill about 400 dry casks. If all of the spent fuel currently in storage at U.S. commercial nuclear plants were to be stored together in dry casks 1.5 cask diameters apart, they would cover an area equivalent to about one-sixth of a square mile (see Annex 8.D).
-
Used fuel recycling. Reprocessing technologies could recycle fissile material in used fuel, thereby reducing the volume of long-lived high-level radioactive waste. Still, no technology completely eliminates the need for disposal facilities. Two concepts for the recycling of used fuel have recently been under consideration in the United States:
-
Partial recycle. A partial recycle program employing modifications to current-generation separation technology (PUREX) could be implemented after 2020. The resulting mixed oxide (MOX) fuel would be recycled in light water reactors (LWRs). These modifications are intended to increase proliferation resistance (relative to PUREX) by preventing the separation of plutonium, but they do not substantially reduce the amount of long-lived waste requiring disposal.
-
-
-
Full recycle. A full recycle program employing alternative separation technologies and burner reactors is unlikely to be implemented in the United States until after 2035. Such a program is aimed at extending existing uranium supplies, increasing proliferation resistance, and reducing the volume of long-lived high-level waste. Multiple recycles of used fuel and a large number of burner reactors will be needed to effectively transmute a significant fraction of the used fuel. Substantial R&D will be required before these technologies are ready for commercial-scale deployment.
-
-
There is substantial uncertainty surrounding the economic viability of both approaches.
-
Geologic disposal. A permanent U.S. geologic disposal site for used fuel will not be available until after 2020. The prospects for the previously proposed disposal site at Yucca Mountain, Nevada, are diminished by the declared intent of the Obama administration not to pursue this site. If ultimately pursued, the license application for Yucca Mountain would have to survive regulatory review by the USNRC and likely judicial challenges. As currently restricted by legislation, a repository at Yucca Mountain would not have sufficient capacity to handle all of the used fuel generated by currently operating nuclear plants; however, the site is estimated to be able to accommodate up to four times the legislated limit.
Cost: The committee estimates that the levelized cost of electricity (LCOE) from new nuclear plants deployed by 2020 and built by investor-owned utilities (IOUs) or independent power producers (IPPs) could be 8–13¢/kWh (in 2007 dollars). Federal loan guarantees and a financing structure incorporating 80 percent debt and 20 percent equity could result in a reduced LCOE of 6–8 cents for IOUs and IPPs. Under current legislation, loan guarantees are only sufficient for four to five plants. Calculated on the same basis, the cost of electricity from other baseload sources is also likely to increase by 2020—particularly if carbon constraints are imposed—and electricity from new nuclear plants may be cost competitive. The LCOE from nuclear plants and other power sources deployed after 2020 cannot be reliably estimated at present.
Supply: The committee judges that five to nine new nuclear plants could be built in the United States by 2020. Actual construction will depend on many
factors, including economics and electricity demand. If these five to nine plants meet cost and performance requirements, more plants will probably follow; otherwise, few additional plants are likely to be built.
-
Up to an additional 20 GWe could be supplied by nuclear power plants by 2020, and as much as 88 GWe could be added to the U.S. nuclear capacity between 2021 and 2035. These contributions, if achieved, would be significant: out of the 20 GW potentially supplied, new construction could potentially add up to 12 GWe of new capacity by 2020, while power uprates to existing plants could add up to 8 GWe. New construction alone could provide up to another 88 GWe by 2035. However, the actual supply added will depend on cost and other factors.
-
Unless many existing plants receive second 20-year license extensions—to allow for 80-year operating lifetimes—up to about 26 GWe of current U.S. nuclear capacity could be lost by the beginning of 2035 (assuming maximum uprates of all operating plants [see Table 8.1]) and nearly all of the remaining capacity could be lost by 2050 because of these plants’ retirements. Nearly all currently operating nuclear plants are likely to receive 20-year extensions to their current 40-year operating licenses, allowing for 60-year operating lifetimes. Work has begun to assess the technical feasibility and economic viability of extending licenses for an additional 20 years.
Potential barriers: The potential barriers to expanding nuclear power in the United States are not technical. In fact, they are mainly associated with financial and societal concerns as well as current regulatory and infrastructural limitations.
-
Financial. The high capital cost of new nuclear plants, the historically long construction times, and the lack of recent domestic experience with new construction create barriers to the deployments of these plants in the United States before 2020. Financial incentives provided by the DOE could help to surmount such barriers for the first new plants. Market and policy forces (including potential carbon emissions regulations or fees) could help as well.
-
Societal. Public concerns about nuclear technologies, if widespread, could limit the expansion of nuclear power in the United States.
-
-
Public support. Public support for construction of new nuclear plants has been increasing and in fact is at an all-time high, but that support could diminish if the new plants are not built on schedule and on budget and are not operated in a safe and secure manner. Current U.S. polls show that a majority of Americans (ranging from 51 to 67 percent) support the building of new nuclear plants.
-
Waste disposal. The absence of a permanent disposal facility for used nuclear fuel does not present a technical barrier to new construction. However, there are political and societal barriers to selecting the location(s) for long-term used fuel storage.
-
-
Regulatory. The licensing process for nuclear plants in the United States has been extensively revised. However, processing the surge of applications might cause delays in new plant construction.
-
Infrastructure. Shortages of trained personnel (including nuclear engineers and skilled-crafts workers), as well as shortages of parts and components, could be a barrier to the construction of new nuclear plants through the early 2020s. For example, the forging capacity for large components is limited. But these shortages are common to many parts of the power industry and should eventually be alleviated by market forces if new plant construction increases. At present, large forging capacity is expanding and nuclear engineering enrollments are rising.
CO2 impacts: Adding 12–20 GWe of nuclear capacity could avoid the emission of some 40–150 million tonnes of CO2 equivalent per year in 2020, and adding 99–108 GWe could avoid 360–820 million tonnes of CO2 equivalent per year in 2035. This is a significant amount: the total emissions for the U.S. power sector were roughly 2.4 billion tonnes in 2007. The majority of a nuclear plant’s relatively small life-cycle CO2 emissions are generated during construction and fuel enrichment from electricity generated by fossil-fuel sources. These emissions should decrease in the future as more efficient enrichment technologies are deployed in the United States and as the sources of electric power used for fuel enrichment emit fewer greenhouse gases.
Uranium: The world supply of uranium will not be a barrier to the continued operation of current plants or to an expansion of nuclear power over the time periods considered in this report. Known uranium reserves will be able to supply the current and projected fleet of plants using a once-through fuel cycle for more than a century.
Proliferation: Given the widespread international deployment of nuclear technologies, the proliferation impacts of the United States’ choices for commercial nuclear power deployment are likely to be relatively minor if a once-through fuel cycle is used. However, the potential proliferation impacts of alternative U.S. fuel cycle choices remain a subject of debate among experts. Proliferation prevention is driven primarily by strong international cooperation; technology to increase proliferation resistance, while important, can play only a limited role in reducing proliferation risk. Such technology can support but not replace strengthened international arrangements.
Research and development: No major additional R&D is needed for an expansion of nuclear power through 2020 and likely through 2035. However, there are still major R&D opportunities to improve nuclear technologies, including the following:
-
High burn-up fuel. Significantly increasing the maximum utilization of the reactor fuel’s fissionable content requires a considerable R&D effort, the long-term irradiation of samples, and a sustained fuel qualification campaign.
-
Reactor efficiency. R&D is needed on alternative coolants, coolant additives, and improved heat-transfer materials.
-
High-temperature materials. R&D is needed on materials that can withstand the high temperatures likely to be required for hydrogen production.
-
Alternative fuel cycles. Considerable R&D is needed before alternative fuel cycles will be ready for deployment. It is prudent to pursue such R&D, which is likely to be resource intensive and time-consuming, but to not initiate facility construction at present. Increasing proliferation resistance as well as reducing the cost of fuel cycle processes and associated facilities will be a major goal of the R&D effort. Commercial-scale facilities are unlikely to be ready for deployment until after 2035.
REFERENCES
APS (American Physical Society). 2007. Consolidated Interim Storage of Commercial Spent Nuclear Fuel: A Technical and Programmatic Assessment. Washington, D.C.
ASME (American Society of Mechanical Engineers). 2008. Nuclear Component Certification Program. New York, N.Y.
BCG (Boston Consulting Group). 2006. Economic Assessment of Used Nuclear Fuel Management in the United States. Bethesda, Md.
Bisconti Research, Inc. 2006. Recent National Public Opinion Surveys About New Nuclear Power Plants. Washington, D.C.
Bunn, Matthew, John P. Holdren, Allison Macfarlane, Susan E. Pickett, Atsuyuki Suzuki, Tatsujiro Suzuki, and Jennifer Weeks. 2001. Interim Storage of Spent Nuclear Fuel: A Safe, Flexible, and Cost-Effective Approach to Spent Fuel Management. Cambridge, Mass.: Managing the Atom Project, Harvard University, and Project on Sociotechnics of Nuclear Energy, University of Tokyo. June. Available as of December 16, 2003, at http://bcsia.ksg.harvard.edu/BCSIA_content/documents/spentfuel.pdf.
Bunn, M., S. Fetter, J. Holdren, B. van der Zwaan. 2003. The Economics of Reprocessing vs. Direct Disposal of Spent Nuclear Fuel. Cambridge, Mass.: Project on Managing the Atom, Belfer Center for Science and International Affairs, John F. Kennedy School of Government, Harvard University.
DOE (U.S. Department of Energy). 2007. Notice of a Request for Expressions of Interest in an Advanced Burner Reactor to Support the Global Nuclear Energy Partnership. Federal Register 71 (August 7):44673.
EIA (U.S. Energy Information Administration). 2008. Annual Energy Outlook 2008. DOE/EIA-0383(2008). Washington, D.C.: U.S. Department of Energy, Energy Information Administration.
Energy Daily. 2008. Areva: States, communities want reprocessing plant. October 8.
Gallup. 2009. Support for nuclear energy inches up to new high. Available at www.gallup.com/poll/117025/Support-Nucler-Energy-Inches-New-High.aspx. Accessed July 2009.
GAO (U.S. Government Accountability Office). 2008. Department of Energy: New Loan Guarantee Program Should Complete Activities Necessary for Effective and Accountable Program Management. GAO-08-750. Washington, D.C.
Garwin, R.L., and G. Charpak. 2001. Megawatts and Megatons. New York: Alfred A. Knopf.
Harding, J. 2007. Economics of Nuclear Power and Proliferation Risks in a Carbon-Constrained World. Electricity Journal 20:65-76.
Ha-Duong, M., and D.W. Keith. 2003. Carbon storage: The economic efficiency of storing CO2 in leaky reservoirs. Clean Technologies and Environmental Policy 5(3-4):181-189.
Hepple, R.P., and S.M. Benson. 2005. Geologic storage of carbon dioxide as a climate change mitigation strategy: Performance requirements and the implications of surface seepage. Environmental Geology 47:576-585.
IAEA (International Atomic Energy Agency). 2007. Milestones in the Development of a National Infrastructure for Nuclear Power. NG-G-3.1 2007. Vienna, Austria.
IAEA. 2008a. International Status and Prospects of Nuclear Power. Vienna, Austria. Available at www.iaea.org/Publications/Booklets/NuclearPower/np08.pdf. Accessed June 7, 2009.
IAEA. 2008b. Energy, Electricity, and Nuclear Power Estimates for the Period up to 2030. Vienna, Austria. Available at www.pub.iaea.org/MTCD/publications/pdf/RDSI-28_web.pdf.
IAEA. 2008c. Nuclear Power Reactors in the World. Vienna, Austria. Available at www.pub. iaea.org/MTCD/publications/pdf/RDS2-28_web.pdf.
IAEA. 2008d. Reinforcing the Global Order for Peace and Prosperity: The Role of the IAEA to 2020 and Beyond. Report prepared by an independent commission at the request of the director general of the IAEA.
Ivanov, V. 2008. Overview of the Russian sodium-cooled fast reactor program. Presentation to the Nuclear Subgroup of the AEF Committee, April.
Johnson, M. 2008. U.S. Nuclear Regulatory Commission activities on licensing of new reactors. Presentation to the National Academies’ Board on Energy and Environmental Systems, Washington, D.C., December.
Keystone Center. 2007. Nuclear Power Joint Fact-Finding. Keystone, Colo. Lisowski, P. 2008. Reactor design and fuel cycle choices. Presentation to the Nuclear Subgroup of the AEF Committee, Washington, D.C., April.
Matzie, Regis A. 2008. AP1000 nuclear power plant. Presentation at the MIT Nuclear Plant Safety Course, Cambridge, Mass.
MIT (Massachusetts Institute of Technology). 2003. The Future of Nuclear Power. Cambridge, Mass.
Moody’s Investor’s Service. 2008. New Nuclear Generating Capacity: Potential Credit Implications for U.S. Investor Owned Utilities. New York, N.Y.
NEI (Nuclear Energy Institute). 2007. Nuclear Industry’s Comprehensive Approach Develops Skilled Work Force for the Future. Nuclear Energy Institute Fact Sheet. April. Washington, D.C.
NEI. 2008a. U.S. Nuclear Industry Capacity Factors. Available at www.nei.org/resourcesandstats/documentlibrary/reliableandaffordableenergy/graphicsandcharts/usnuclearindustrycapacityfactors/. Accessed July 2009.
NEI. 2008b. New generating capacity costs in perspective. White paper. Washington, D.C.
NRC (National Research Council). 2004. Burning Plasma: Bringing a Star to Earth. Washington, D.C.: The National Academies Press.
NRC. 2006. Going the Distance? The Safe Transport of Spent Nuclear Fuel and High-Level Radioactive Waste in the United States. Washington, D.C.: The National Academies Press.
NRC. 2008. Review of DOE’s Nuclear Research and Development Program. Washington, D.C.: The National Academies Press.
Nuclear Fuel. 2009. Much discussion, but no consensus, on U.S. reprocessing options. April 20.
OECD/NEA (Organisation for Economic Co-operation and Development/Nuclear Energy Agency). 1994. The Economics of the Nuclear Fuel Cycle. Paris, France.
OECD/NEA. 2007. Uranium 2007: Resources, Production, and Demand. Paris, France.
Parece, Martin. 2008. U.S. EPR overview. Presentation to the MIT Nuclear Plant Safety Course, Cambridge, Mass.
Pelton, T. 2007. Nuclear power has new shape. Baltimore Sun. December 25.
Peterson, P. 2008. Nuclear power’s future: Advanced technologies and fuel cycles. Presentation to the Nuclear Subgroup of the AEF Committee, Washington, D.C., April.
Scroggs, S. 2008. COLA (Combined License Application Content) Engineering Evaluation of Current Technology Options for New Nuclear Power Generation. Testimony before the Florida Public Service Commission. Docket No. 070650.
Standard and Poor’s. 2008. Update on the U.S. Department of Energy Loan Guarantee Program and Standard and Poor’s Rating Considerations. October 7. New York, N.Y.
Takanobu, S., T. Masao, S. Tadao, S. Takao, U. Masaki, and K. Ryoichy. 2001. Recovery systems for uranium from seawater with Fibrons adsorbent and its preliminary cost estimation. Journal of the Atomic Energy Society of Japan 43(10):1010-1016.
Turnage, Joe. 2008. New nuclear development: Part of the strategy for a lower carbon energy future. Presentation to Center for Strategic and International Studies, July 31.
UCS (Union of Concerned Scientists). 2008. Nuclear Power in a Warming World: Assessing the Risks, Addressing the Challenges. Cambridge, Mass.
USNRC (U.S. Nuclear Regulatory Commission). 2008. Information Digest 2007–2008. NUREG-1350, Vol. 19. Washington, D.C. Available at www.nrc.gov/reading-rm/doc-collections/nuregs/staff/sr1350/v19/sr1350v19.pdf. Accessed June 7, 2009.
USNRC/DOE. 2008. Category 2 Public Workshop Co-sponsored by the USNRC and DOE on R&D Issues for Nuclear Power Plant Life Extension During Second and Subsequent License Renewal Periods, February 19–21.
Veil, J.A. 2007. Use of Reclaimed Water for Power Plant Cooling, Report No. ANL/EVS/R-07/3, Argonne National Laboratory; Use of Degraded Water Sources as Cooling Water in Power Plants, Report No. 1005359. Palo Alto, Calif.: EPRI.
Zogby International. 2008. Zogby Poll: 67% Favor Building New Nuclear Power Plants in U.S. Available at www.zogby.com/search/ReadNews.cfm?ID=1515. Accessed June 7, 2009.
ANNEX 8.A:
NUCLEAR REACTOR TECHNOLOGIES
The design of nuclear reactors has changed in the decades since the currently operating U.S. plants were deployed. The committee divides these new designs into two categories:
-
Evolutionary modifications of current U.S. designs, which are light water reactors (LWRs); and
-
Alternative reactor designs, which range from more significant modifications of currently deployed designs to entirely different concepts.
In the next few decades, the majority of the new nuclear plants constructed will be based on evolutionary reactor designs. In most cases, alternative reactor designs require significant development efforts before they will be ready for deployment.
Evolutionary Nuclear Reactor Designs
Evolutionary nuclear reactor designs incorporate modifications to currently operating LWR designs intended to make the reactors simpler and safer. For example, to prevent accidents and mitigate their effects, current LWRs utilize active safety systems that require safety-grade AC power and cooling water. In place of active systems, some new LWR designs include passive safety features (relying on gravity, natural circulation, or pressurized water tanks) to avoid the need for safety-grade AC power and cooling water systems and thereby reduce the core damage frequency (CDF).1 Other new designs provide modified active systems and claim similar reductions in CDF.
These modifications are intended to result in improved safety. The vendors of some evolutionary designs state that probabilistic risk assessment evaluations show that they have a CDF that is better than that of existing plants by a factor of 10 or more. For example, Areva has a design target for CDF that is less than 10–6 events per year for its U.S. evolutionary power reactor2 design (Parece, 2008); Westinghouse claims a CDF of 5.1 × 10⁻⁷ events per reactor per year for its
AP-1000 design (Matzie, 2008). For comparison, recent probabilistic risk assessments show that CDF for current plants is between 10–5 and 10–6 events per reactor per year (Sheron, 2008).3
Several evolutionary LWRs are operating or are being built around the world: an advanced boiling water reactor (ABWR) is operating and two large (1540 MWe) advanced pressurized water reactors (APWRs) are planned in Japan; the first Korean APR-1400 reactor (modeled after the ABB CE System 80+, a 1300 MWe APWR), was scheduled to begin construction in November of 2008;4 a European pressurized water reactor (EPR) is being constructed in Finland, with a second in Brittany, France; and the AP-1000 design is being constructed in China. Some selected examples of evolutionary reactor designs are listed in Table 8.A.1.
Some new LWR designs have been certified for use in the United States, and construction of plants based on these designs could begin once the applications are approved. If new reactors are built (pending regulatory approval), some U.S. owner-operators have plans to use the AP-1000 design; others have identified the USEPR, the ABWR, the economic simplified boiling water reactor, or the APWR as their reactor of choice.
Alternative Nuclear Reactor Designs
In addition to the evolutionary reactor designs just discussed, alternative nuclear reactor designs are being developed (and in some cases, are already in use).5 These reactors range from dramatic modifications of currently operating U.S. reactors to completely different concepts. Many new alternative reactor designs are intended to increase safety and efficiency. Some designs are intended for other purposes,
TABLE 8.A.1 Selected Examples of Evolutionary Reactor Designs
|
Design |
Supplier |
Features |
Ready for Deployment in United States Before 2020? |
Built Outside the United States? |
Planned for Deployment in the United States? |
|
ABWRa |
Toshiba/GE |
1371 MWe BWR |
Yes |
Yes; Japan |
Yes |
|
US APWRb |
Mitsubishi Heavy Industries |
1600 MWe PWR |
Yes |
Yes; Japan |
Yes |
|
VVER-1200 |
AtomEnergoProm |
1200 MWe PWR |
No |
Proposed to be built in Russia |
No |
|
SWR 1000 |
Framatome |
1254 MWe BWR |
No |
No |
No |
|
ESBWRa |
GE |
1550 MWe passive safety features BWR |
Yes |
No |
Yes |
|
AP-1000a |
Westinghouse |
1117 MWe passive safety features PWR |
Yes |
Yes; China |
Yes |
|
USEPRb |
Areva |
1600 MWe PWR |
Yes |
Yes; Finland and France |
Yes |
|
Note: Another example of an evolutionary reactor is Westinghouse’s BWR 90+. However, this plant is not planned for deployment in the near future and is likely to require further development. ABWR = advanced boiling-water reactor; APWR = advanced pressurized water reactor; BWR = boiling-water reactor; ESBWR = economic simplified boiling-water reactor; PWR = pressurized water reactor; USEPR = U.S. evolutionary power reactor. aDesign certified by the U.S. Nuclear Regulatory Commission (USNRC). Amendments to the design certifications have been submitted to the USNRC for the ABWR and the AP-1000. bThe USNRC is currently reviewing design. Sources: U.S. DOE Energy Information Administration (www.eia.doe.gov/cneaf/nuclear/page/analysis/nucenviss2.html; accessed May 12, 2009); and Areva, SWR 1000: The Boiling Water Reactor with a New Safety Concept (available at www.areva-np.com/common/liblocal/docs/Brochure/SWR1000_new_safety_concept.pdf; accessed July 2009). |
|||||
such as reactors with significantly smaller generating capacities (potentially to supply power to countries with smaller grids);6 reactors intended to reduce the long-lived high-level nuclear waste burden by destroying transuranic elements; and high-temperature designs intended to provide process heat to industry and/or to produce hydrogen. Some specific examples of new alternative reactor concepts are described in Table 8.A.2.
In 2002, the United States led the formation of the Generation IV Interna-
TABLE 8.A.2 Examples of Alternative Reactor Concepts Being Studied or Developed
|
Reactor |
Reactor Type |
Capacity (MWe/MWt) |
Originator |
Notes |
|
AHTR |
Molten salt coolant |
2400 MWt |
ORNL |
Core outlet temperature can be 1000°C; at conceptual design stage; coated-particle graphite matrix fuel |
|
FTBR |
SFR |
400–600 MWe |
India |
Runs on thorium fuel cycle |
|
SSTAR |
LFR |
10–100 MWe |
LLNL |
Contained completely within sealed container with fuel for 30 years; currently in development. |
|
KLT-40C |
PWR |
30–35 MWe and up to 200 MWt |
Russia |
To be built on boats to reach locations on the remote northern coast of Russia; plans announced to build in July 2005 |
|
CAREM |
PWR |
27 MWe/100 MWt |
Argentina/INVAP |
|
|
SMART |
PWR |
330 MWe |
KAERI |
|
|
NP-300 |
PWR |
100–300 MWe |
Areva |
To be used for electricity generation or desalination; based on submarine PWR |
|
GT-MHR |
GCR |
288 MWe |
General Atomics |
No current plans for certification in the United States; modular reactor |
|
HTR-PM |
PBMR |
200 MWt |
Chinergy |
Not of interest to the United States |
|
BN-800 |
SFR |
800 MWe |
Russia |
Being built in Russia based on BN-600; will be running in Russia; no plans to deploy in the United States |
|
NuScale |
PWR |
45 MWe |
NuScale Power, Inc. |
Plans to file for design certification with USNRC in 2010; modular reactor with passive safety features |
tional Forum (GIF), a 10-nation (plus the European Union) organization, to lay out a path for development of the next generation of nuclear plants.7 Both thermal and fast reactor designs were considered. Six reactor design concepts were
|
Reactor |
Reactor Type |
Capacity (MWe/MWt) |
Originator |
Notes |
|
Terrapower |
Traveling-wave reactor |
|
Terrapower, LLC |
|
|
Toshiba 4S |
SFR |
10 MWe/30 MWt 50 MWe/135 MWt |
Toshiba |
Under consideration in Alaska; plans to file for design certification with USNRC in 2010 |
|
Hyperion |
Uranium hydride as fuel and moderator |
25 MWe |
Hyperion, Inc. |
Has discussed design certification with USNRC |
|
PBMR |
Gas-cooled PBMR |
180 MWe |
PMBR Pty., Ltd. |
Planned to be built in South Africa |
|
ACR-700 |
CANDU PHWR |
700 MWe |
AECL |
|
|
Note: AECL = Atomic Energy Canada Ltd.; AHTR = advanced high temperature reactor; CANDU PHWR = Canada deuterium uranium pressurized heavy water reactor; CAREM = advanced small nuclear power plant; FTBR = fast thorium breeder reactor; GCR = gas-cooled reactor; INVAP = Investigaciones Aplicadas Sociedad del Estado; KAERI = Korean Atomic Energy Research Institute; LFR = lead-cooled fast reactor; LLNL = Lawrence Livermore National Laboratory; MWe = megawatts-electric; MWt = megawatts-thermal; ORNL = Oak Ridge National Laboratory; PBMR = pebble-bed modular reactor; PWR = pressurized water reactor; SFR = sodium-cooled fast reactor; SMART = system integrated modular advanced reactor; SSTAR = small, sealed, transportable autonomous reactor; USNRC = U.S. Nuclear Regulatory Commission. Sources: Forsberg et al., 2004; Jagannathan and Pal, 2008; Smith et al., 2008; Pederson, 1998; Beliav and Polunichev, 1998; www.invap.net/nuclear/carem/desc_tec-e.html; IEA, 2002; www.hyperionpowergeneration.com/; //criepi.denken.or.jp/en/e_publication/a2004/04kiban18.pdf; www.nuscalepower.com/ri-Nuclear-Regulatory-Info-And-Process.php; www.intellectualventures.com/docs/terrapower/IV-Introducing%20Terrapower_3_6_09.pdf; Ivanov, 2008. All websites above last accessed on May 12, 2009. |
||||
selected for further examination by the participating countries: the very-high-temperature reactor, the supercritical water-cooled reactor, the lead-cooled fast reactor, the sodium-cooled fast reactor, the gas-cooled fast reactor, and the molten salt reactor (GIF/NERAC, 2005). The characteristics of these reactors are summarized in Table 8.A.3.
Around the world, several alternative reactor designs are in use or planned: for example, two new types of gas-cooled reactors are planned or operating, and two sodium-cooled fast reactors are planned to be operating in the near future (in addition to the one that is currently operating). In the following sections, a number of examples of alternative reactor designs are discussed.
TABLE 8.A.3 Reactors Selected for Examination by the Generation IV International Forum
|
Reactor |
Description |
Size (MWe/MWt) |
GIF Nation Lead |
Neutron Spectrum |
Notes |
|
VHTR |
Helium-cooled with graphite moderator and ceramic fuel |
400-600 MWt up to 300 MWea |
United States |
Thermal |
Core outlet temperature approaching 950–1000°C |
|
SCWR |
Cooled and moderated by supercritical water |
1700 MWe |
Japan |
Thermal |
Improved efficiency; core outlet temperature of 500°C |
|
LFR |
Molten lead coolant |
50-1200 MWe |
United States at lower priority than VHTR |
Fast |
The DOE phased out the U.S. R&D for this concept at the end of 2005 |
|
SFR |
Liquid sodium coolant |
150-1500 MWe |
Japan leading effort with United States and France |
Fast |
|
|
GFR |
Cooled by helium or carbon dioxide |
288 MWe |
France |
Fast |
|
|
MSR |
Coolant is molten salt mixture: choice of salts (Na/Zr/F for burning; Li/Be/F for breeding) and fuels (U-238 or Th-232 fertile feed) |
1000 MWe |
France leading effort with United States and European Community |
Fast |
Limited programs are under way to evaluate concept outside the United States |
|
Note: GIF = Generation IV International Forum; GFR = gas-cooled fast reactor; LFR = lead-cooled fast reactor; MSR = molten salt reactor; MWe = megawatts-electric; MWt = megawatts-thermal; SCWR = supercritical water reactor; SFR = sodium-cooled fast reactor; VHTR = very-high-temperature reactor. a“The VHTR can also generate electricity with high efficiency, over 50 percent at 1000°C” (GIF/NERAC, 2005). Sources: GIF/NERAC, 2005; Bennett, 2008. |
|||||
Gas-cooled Reactors
New gas-cooled reactor designs include the pebble-bed modular reactor (PBMR) (which uses tennis-ball-sized fuel spheres that incorporate a carbon moderator), and gas-cooled reactors with hexagonal block fuel.8 Several PBMRs have been constructed or are planned: two PBMRs were built and operated in Germany; a small (10 MW) PBMR is operating in China (the HTR-10); the Chinese have announced plans to build two new 200 MWt PBMRs; and PBMR Pty. Ltd. is planning to build a 165 MWe demonstration plant for Eskom, the South African utility, that is expected to come on line within the next 10 years. The Japanese operate a 60 MW graphite-moderated test reactor at the Oarai Site (the HTTR).
Small Modular Reactors
In the United States, some companies have expressed interest in submitting applications for design certification of alternative reactor designs within the next few years. Most of these designs are for small modular reactors. For example, NuScale, Inc. has plans to apply to the USNRC for design certification for their 45 MWe modular LWR design in 2010, and to apply for a COL in parallel with this process. NuScale projects that their first facility may be operational by 2015 or 2016 (www.nuscalepower.com/ri-Nuclear-Regulatory-Info-And-Process.php; accessed July 2009). Toshiba also plans to apply for design certification for the Toshiba 4S reactor (a sodium-cooled reactor) in 2010 (www.eia.doe.gov/cneaf/nuclear/page/analysis/nucenviss2.html#_ftn12; http://criepi.denken.or.jp/en/e_publication/a2004/04kiban18.pdf; accessed July 2009). This reactor is under consideration for use as a power source in remote areas of Alaska. Hyperion, Inc. is also in discussions with the USNRC about design certification for its 25 MWe sealed uranium hydride-fueled reactor,9 and it has stated an intent to apply in 2012 (Johnson, 2008). However, the USNRC has stated that resources will first be applied to the operating license applications that have been submitted for evolutionary LWRs, and as time permits and resources are available, USNRC staff are conducting activities related to alternative designs (Johnson, 2008). The USNRC
|
8 |
Several previous-generation block-graphite fueled reactors were built, such as Peach Bottom 1 in Pennsylvania and Fort St. Vrain in Colorado. Both have been shut down. |
|
9 |
The reactor is intended to be maintained underground. It would be unearthed every 5 years to be shipped to the factory for refueling. For more information, see www.hyperionpowergeneration.com/product.html. |
has indicated that the design certification for these designs may be prolonged due to agency unfamiliarity with the reactor designs.
Fast Reactors
Several fast reactor designs, both “burning” and “breeding” types, are being researched. In the past, some fast reactors—notably sodium-cooled fast reactors (SFRs)—have been deployed around the world. In the past there have been problems with some of these plants, particularly with sodium leaks.10 However, an SFR in Japan, MONJU, is planned to come back on line in 2009, and Russia is currently proceeding with a second SFR, the BN-800, the construction of which began in July 2006 (IAEA, 2008).
In particular, fast reactor designs intended to reduce the quantity of long-lived high-level waste by transmitting long-lived radioisotopes into shorter-lived isotopes as part of a closed fuel cycle (“burner reactors”) are under development.11 Much of the research on these designs is funded through the U.S. Department of Energy (DOE). Under the second Bush administration, support of alternative reactors was split between the GIF program and the Advanced Fuel Cycle Initiative and Global Nuclear Energy Partnership (AFCI/GNEP). As of the writing of this report, the Obama administration had not yet officially released detailed plans for fast burner reactor and nuclear fuel cycle programs. However, in April 2009, the DOE’s Office of Nuclear Energy issued a statement that it plans to structure its nuclear fuel cycle program to concentrate on “long-term, science-based R&D … focused on the technical challenges of the back-end of the nuclear fuel cycle”12 and not on near-term technology deployment.
Significant R&D will be required before burner reactors are ready for commercial deployment. For example, highly precise nuclear measurements are needed to reduce uncertainties and define relevant characteristics, such as the fission and capture cross sections for actinides, and substantial new data will be needed to
|
10 |
The MONJU reactor in Japan suffered a sodium leak a year after being brought on line in 1994. In addition, the SuperPhenix reactor in France had many problems with sodium leaks and was shut down in 1998, having operated at full capacity for only 174 days. |
|
11 |
Under the second Bush administration, the DOE was investigating fast reactor designs to function as burner reactors as part of the Advanced Fuel Cycle Initiative (AFCI) (the technology development program associated with the Global Nuclear Energy Partnership [GNEP] program). |
|
12 |
Statement available at Nuclear Engineering International’s website: http://www.neimagazine.com/story.asp?sectionCode=132&storyCode=2052719; accessed July 2009. |
optimize system performance and economy. Improved safety, reliability, and economics will also be needed for long-term commercialization of burner reactor technologies. Thus it is the judgment of the committee that prototype burner reactors could come on line after 2025. However, developing the design, constructing prototypes and getting design certifications, testing fuel (if new type fuel is to be used), and licensing will likely push commercial operation until after 2035. Ultimately, commercial deployment of these technologies will depend upon their proving to be economic.
As mentioned previously, there is a decades-long experience with sodium-cooled fast reactors around the world, and one is currently producing electricity (the BN-600 in Russia). However, further research will be needed on fuel forms and fabrication in order to deploy these reactors as burner reactors. In August 2007, the DOE invited industry to provide concepts for burner reactors and selected four teams based on a competition (DOE, 2006). All the prototype concepts included sodium-cooled fast reactors, and one also included gas-cooled reactors (Lisowski, 2008). However, according to an April 2009 press release (mentioned previously), under the Obama administration, the DOE plans to “no longer pursu[e] near-term commercial demonstration projects.”
Very-High-Temperature Reactors
Under the Next Generation Nuclear Plant (NGNP) program, the DOE is developing a commercial-scale prototype very-high-temperature reactor. The NGNP is planned to have somewhat lower outlet termperatures than were originally envisioned for this reactor. NGNP could produce electricity as well as high-temperature process heat for use by industry. Hydrogen production is also a possibility if economically acceptable materials that can withstand the necessary high temperatures (850–1000°C) can be developed, particularly for the heat exchangers and hydrogen process equipment. There is a significant potential demand for process heat in industry, over a wide range of temperatures. However, current LWRs cannot provide the needed temperature levels. Figure 8.A.1 provides a summary of U.S. process heat use, the typical temperatures at which industry utilizes process heat, and the temperatures available from various reactor technologies. The DOE requested expressions of interest in April 2008 for a demonstration plant able to produce both hydrogen and electricity (DOE, 2008a). Current plans are for start-up in 2018–2020.
FIGURE 8.A.1 Major energy-intensive industries and typical temperatures at which they use process heat.
Source: Data from Alberta Department of Energy, 2007; Chenier, 2002; DOE, 2000; Gary et al., 2007; Moorhouse, 2007; NREL, 2001.
Research and Development Opportunities
Although R&D is not needed to deploy evolutionary nuclear plants in the near term, there are many R&D opportunities remaining for evolutionary LWR technologies (some of which could potentially be used in existing plants) and for alternative reactor technologies. Some of the major opportunities are discussed in this section.
Alternative Coolants
The thermodynamic efficiency of power plants is primarily constrained by the temperature of the coolant as it exits the reactor. Thermodynamic efficiency can be improved through the use of reactor coolants that allow higher coolant operat-
ing temperatures than does water. These include liquid metals such as sodium or lead, gases such as helium and carbon dioxide, molten salts, and operating coolants at supercritical conditions such as supercritical water or carbon dioxide. The major R&D challenges that need to be addressed include the associated chemical and metallurgical effects of these coolants on wetted materials, the fluid properties of these coolants, their radiation resistance, industrial scale handling, and safety. There is active international R&D in all of these areas. Test reactors and the first prototypes of new reactors using gas and liquid metal coolants are likely to be operable in some countries by 2020 or shortly thereafter.
Efficiency improvements in currently operating and evolutionary LWRs may be able to be gained by using coolant additives. The use of such additives could enhance heat transfer and potentially suppress phenomena that currently limit heat transfer and power density. Work has begun into the use of very dilute additions of nanoparticles to coolant water, and initial tests have been encouraging, suggesting that their use allows higher heat fluxes to be tolerated. Many R&D opportunities remain, including characterization of the enhanced heat transfer effect under realistic operating and transient conditions, metallurgical and chemical capability with other materials wetted by the coolant, radiation resistance, neutron absorption properties, and safety and environmental issues. Coolant additives (along with the associated redesign of reactors to adopt their use) are likely to be ready for commercial deployment after 2035.
Improved Heat Transfer Materials
As just noted, higher temperatures generally improve efficiency. At higher temperatures, improved materials are needed to contain the coolant and act as heat-transfer surfaces. High-temperature metal alloys developed for use in other applications such as combustion facilities and ceramics are being considered for improved heat transfer materials. Remaining R&D challenges for these materials include producing large quantities in the needed product form; improving fabricability, acceptance, and in-service inspection; understanding radiation effects; and fragility. Work is currently under way to use these materials with the alternative coolants previously described and to replace materials used in existing LWRs—for example, replacing the metallic tubes currently used for fuel cladding with ceramic tubes. After attractive advanced materials are identified, typically 15–20 years are required before the materials are commercially deployed. Since some materials of interest have been identified now, some new materials may be available after 2025, with a higher probability of successful widespread application after 2035.
Alternative Fuel Design for Light-Water Reactors
Improvements in reactor performance can be gained by improving the fuel—for example, by increasing the maximum utilization of the reactor fuel’s fissionable content (its “burn-up”) or by using fuel geometries with greater efficiencies.
The development of significantly higher burn-up fuel for LWRs could allow operating cycles to be prolonged; it could also allow the long-term heat load of the used nuclear fuel and the total amount to be stored or disposed of to be reduced.13 R&D to increase fuel burn-up would focus on the materials issues associated with fuel integrity under long-term exposure to ionizing radiation as well as mechanical design issues which limit fuel lifetimes. For example, one issue requiring R&D is swelling of the higher burn-up fuel rods due to build-up of fission products, and the resulting risk of cladding breach. The development of higher burn-up fuel is a program of continuous improvement, but in order for significant breakthroughs to occur, considerable basic research, long-term irradiation of samples, and a sustained fuel qualification campaign are needed.
In current LWRs, the fuel rods have a cylindrical geometry in which coolant flows around the outside of the rods. An annular shape would increase the surface area of the rod in contact with the coolant by 60 percent, because coolant would flow through the center of the rod as well as along the outside surface. This would allow the coolant to be heated more efficiently, and fewer fuel rods could produce more power. Studies suggest that new plants may be able to achieve up to 50 percent more core power by using annular rather than cylindrical fuel rods (Kazimi et al., 2005). Annular fuel rods could be used in the current fleet of LWRs. Some modifications will be needed in these plants (for example, larger reactor coolant pumps, a larger pressurizer, and additional or greater capacity high pressure injection); however, the same containment, reactor vessel, and the majority of current equipment and piping could be used. There is interest in commercializing this technology (Westinghouse, 2006), but commercial-scale deployment in existing LWRs is unlikely to occur before 2020.
Degradation Phenomena
Many experts now believe that it is possible that both existing and advanced plants might be able to run for extended periods, perhaps as long as 80 years.
The phenomena that will affect performance over these time periods are not well understood at a fundamental level (e.g., stress corrosion and cracking).
Technical questions raised by lifetime extension are driven by material aging issues requiring techniques for nondestructively assessing the status of operating plants. For example, nondestructive examination (NDE) techniques and systems have been used to examine systems including outlet nozzle safe-end welds, BWR internals, and reactor vessel head nozzles. Recent NDE developments have focused on phased array, modeling and Lamb wave methods. New scanning systems are being developed for the efficient delivery of these techniques, but further research is needed, particularly in light of the heightened regulatory implications for these inspections (Westinghouse, 2006).
Digital Instrumentation and Control
The application of digital instrumentation and control offers great opportunities to improve control systems and control room designs. Nonetheless, there are challenges as well. There may be undetected bugs in software and the failure mechanisms as well as unanticipated interactions among various pieces of software and hardware. There is a need and an opportunity for research to more fully understand the inevitable increased reliance on digital systems.
Advanced Simulation Codes
Much of the existing reactor system technology relies on a detailed understanding of the performance of physical objects like fuel and pressure boundary materials, and many important environmental and in-service effects on the materials are empirically based. Because of this, the development of new designs is typically very expensive and time-consuming because extensive testing is needed. Advanced simulation codes (rooted in the large computers and sophisticated analysis approaches developed to simulate nuclear weapons) may provide increased understanding and more rapid application of new technologies; they may also better exploit existing materials and designs. R&D challenges include the development of the needed codes and their validation and verification. The validation and verification will involve ensuring that the codes meet design and regulatory requirements while substantially reducing the amount of testing and detailed post-testing examination. It is very difficult to estimate how rapidly and effectively the use of advanced simulation codes may progress. Many of the currently used codes for
ANNEX 8.B:
ALTERNATIVE FUEL CYCLE TECHNOLOGIES
The life cycle of the fuel that is used in a nuclear reactor (referred to as the “fuel cycle”) can fall broadly into one of two categories:
-
A once-through fuel cycle, in which the used fuel exiting the reactor is destined for permanent disposal. The used fuel is removed from the reactor after achieving design burn-up and only a small fraction of the energy potentially available in the fuel is obtained.
-
A closed fuel cycle, in which more energy is extracted from the used fuel by processing it to separate the uranium and plutonium for reuse and to remove fission products.14 The other transuranics15 may also be reused or disposed of with the fission products.
The vast majority of nuclear-generated electricity in the world is produced using a once-through fuel cycle. The United States currently uses a once-through uranium fuel cycle; in this annex the committee focuses on alternatives to this fuel cycle.
Types of Closed Fuel Cycles
Closed fuel cycles fall into two major categories: (1) fuel cycles designed to produce at least as much new fissionable material as is destroyed in producing energy (“breeding fuel cycles”); and (2) fuel cycles designed to reduce the quantity of high-level nuclear waste ultimately requiring geologic disposal (“burning fuel cycles”). In either case, the used fuel is recycled, requiring chemical or electrochemical processing to separate the fissionable parts of the used fuel and new fuel to be fabricated. The new fuel is then inserted into another reactor for additional power generation. These steps have to be repeated a number of times to achieve
the desired efficiency, for instance, to produce sufficient new fuel or to destroy sufficient undesirable isotopes.
There is continuing interest in closed fuel cycles due to several concerns: (1) extending available supplies of uranium; (2) the potential for reducing the amount of long-lived high-level radioactive waste that must be disposed of; and (3) impeding the potential expansion of proliferation risky reprocessing technologies by developing less risky technologies which can be used in their place. Breeding and burning fuel cycles are ways to address these concerns, and are discussed in the paragraphs that follow.
Available supplies of uranium can be extended significantly through the use of a breeding fuel cycle. New fissile material can be produced in a reactor when fertile isotopes (such as Th-232 and U-238) are bombarded by neutrons, converting them to fissile isotopes (such as U-233 and Pu-239) via neutron capture. Thus, if fertile isotopes are irradiated, new fissionable material can be created in the process of producing power in the reactor. A breeding fuel cycle is designed to create at least as much new fissionable material by neutron capture (for example, the fertile isotope U-238 is converted to the fissionable isotope Pu-239) as is destroyed by fissioning isotopes such as U-235 and Pu-239 to generate power. Ultimately, the fuel is removed from the reactor and reprocessed into new fuel incorporating this fissionable material.
Much larger supplies of fresh uranium are needed to maintain a once-through fuel cycle. If the use of nuclear power worldwide increases dramatically in the 21st century, some have expressed concern that this may put a strain on available resources of mined uranium. The use of closed fuel cycles could extend current supplies. However, as is discussed in the main text of Chapter 8, known uranium reserves will be able to supply an expanded fleet of plants using a once-through fuel cycle for the current century (OECD/NEA, 2007). This fact, combined with concerns about radioactive waste management has led to an emphasis on burning fuel cycles (as opposed to breeding fuel cycles) in the United States.
The amount of long-lived high-level radioactive waste could be reduced through the use of a burning fuel cycle, which can be designed to fission transuranic elements (or transuranics) contained in the used fuel, leaving behind shorter-lived elements, known as fission products, in their place. In principle, the transuranics contained in used fuel can then be incorporated into new fuel and fissioned in burner reactors. (Breeder reactors and LWRs can also destroy transuranics, but they are not specifically designed for this purpose.) Burning fuel cycles have the potential to significantly shorten the time for management of the result-
ing radioactive waste, as the resulting fission products typically have half-lives less than 1000 years, while some transuranics have much longer half-lives, as long as hundreds of thousands of years. The volume of long-lived high-level waste that is ultimately destined for deep geologic disposal could also be reduced; similarly, the long-term heat load could be reduced owing to the destruction of a large fraction of the spent-fuel transuranics. However, this does not reduce the short-term heat load in a repository, which for the first century is dominated by fission products. To achieve closer packing of the used fuel assemblies in a repository, these fission products (in particular, cesium and strontium) would need to be separated from the waste. Thus, in order to significantly reduce the number of repositories required, it is likely that strontium and cesium would need to be separated from the high-level waste and dealt with separately, or in principle, the repository could be actively cooled for approximately the first 100 years.
Burning fuel cycles can be further separated into limited recycle and full recycle, as illustrated in Figure 8.B.1. Under limited recycle, the used fuel from LWRs is chemically or electrochemically processed to separate fissionable material from transuranics and fission products. Fuel or a target could potentially be formed using the fissionable material and/or transuranics, and the fuel or target is used in thermal reactors. There are several possible fuel forms for limited recycle:
-
Mixed-oxide (MOX) fuel consists of about 7–9 percent plutonium mixed with uranium oxide. This fuel type is currently in use outside the United States, for example, in France and the United Kingdom.16 MOX fuel can be used to fuel commercial LWRs, but its production using currently available technologies poses a greater proliferation risk than is desired in the United States.
-
Inert matrix fuel (IMF) is a proposed fuel form that consists of transuranics included with a neutron-transparent material (such as zirconium oxide). With the IMF option, spent LWR fuel would be reprocessed into such a fuel form and then inserted in the present fleet of LWRs, where the transuranics would be partially consumed. About 20 percent of the LWR reactor core would be IMF and 80 percent would be uranium
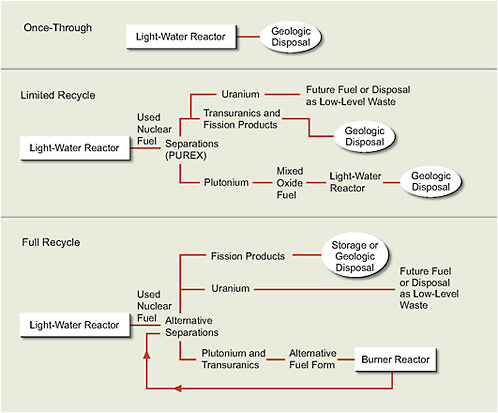
FIGURE 8.B.1 Nuclear fuel cycles. (Top) In the once-through fuel cycle, used light-water reactor (LWR) fuel is sent directly to geologic disposal. (Middle) Under limited recycle using the plutonium and uranium extraction (PUREX) process, the used LWR fuel is chemically processed to separate uranium, transuranics, and fission products from plutonium. The uranium is used or disposed of; the transuranics and fission products are disposed of. The separated plutonium is formed into mixed oxide fuel (MOX), which is sent to geologic disposal after use. (Bottom) Under full recycle, the used LWR fuel is sent through alternative separations technologies (for example, UREX+ or electrochemical reprocessing) that separate the plutonium from uranium and fission products. In most separations processes for full recycle, the transuranics remain with the plutonium, which is formed into advanced fuel forms. This fuel is used in burner reactors. When this fuel is removed from the reactor, it is returned to advanced separations, and new fuel is fabricated from the remaining plutonium. This process is repeated for multiple recycles, until the transuranics are sufficiently consumed.
-
oxide fuel.17 The advantage of IMF fuel is that it has little or no U-238. The U-238 isotope, abundant in present LWR (uranium oxide) fuel, has the disadvantage of absorbing neutrons and being converted into transuranic isotopes with long-lived radioactivity.
-
Transuranic targets, which are currently under development to burn transuranics in thermal reactors. One example may be the americium target option (Maldague et al., 1995). Spent LWR fuel would be reprocessed to extract the americium, which would be formed into americium oxide target rods and inserted into the present fleet of LWRs. About 10 to 20 percent of the LWR reactor core would be americium target rods; the remaining core would be made up of uranium oxide or MOX fuel.
Limited recycle using these technologies has the potential to reduce transuranics in the resulting high-level waste without introducing the complication of fast reactors; however, with repeated passes, a state of diminishing returns would be reached. At this point, a fast neutron spectrum would be required to continue the destruction of transuranics.
In contrast, under full recycle, used fuel would be processed to separate transuranics from fission products. Then, fuel fabrication facilities would be used to incorporate the transuranics into fuel for burner reactors. Finally, when the spent burner reactor fuel is removed from the reactor, it would be reprocessed and the recycled fuel used in burner reactors again. The last step would need to be repeated many times to significantly reduce transuranic content, and a number of burner reactors and reprocessing plants would need to be constructed for a fully closed fuel cycle to be effective. This type of full recycle and the associated reduction in transuranic content would be necessary to vastly reduce the amount of long-lived high-level waste as well as the number of repositories required to isolate high-level waste.
Alternative Separations Technologies
To implement either a burning fuel cycle or a breeding fuel cycle, separations technologies are needed to recycle (or reprocess) used nuclear fuel. These technologies
are used to extract fissionable material and sometimes transuranics from the used fuel. Several technologies are discussed in the section that follows.
Current-generation technologies for recycling used fuel—in use in France, Japan, and the United Kingdom—are based on a process developed during the Manhattan Project called plutonium and uranium extraction (PUREX). This is an aqueous chemical process used to separate plutonium and uranium from used nuclear fuel. As a part of the process, PUREX produces a separated stream of plutonium, which can pose a proliferation and theft risk. Before commercial reprocessing was discontinued in the 1970s, a U.S. company operated a PUREX plant.
Modifications of PUREX are being developed that would allow some amount of uranium to remain in the plutonium stream to increase proliferation resistance. However, the National Research Council concluded that small modifications to the process could allow the generation of a separated plutonium stream (NRC, 2008). Modified PUREX could be commercially deployed in the United States well after 2020 (Lisowski, 2008).
The primary reprocessing technology that has been under investigation as part of the DOE’s Advanced Fuel Cycle Initiative is UREX+ (DOE, 2007). UREX+ is most easily applied to oxide fuel—the fuel used in LWRs. UREX+, which is aqueous in nature, is actually a suite of processes in which uranium is extracted from transuranics along with other specifically targeted fission products. These processes (e.g., UREX+1, UREX+2) are described in Table 8.B.1. For example, in the UREX+1 process, cesium, strontium, and technetium in addition to transuranics, are extracted from the used fuel and separated from the remaining fission products. Flow sheets for UREX+1 have been developed and unit operations have occurred at engineering scale. However, the UREX separations and reprocessing approaches still must be proven out, and an integrated engineering-scale demonstration has not occurred. The technology is considered to be at the level of “proof of principle,” and commercial-scale deployment is not likely before 2035.
Electrochemical separation18 is a reprocessing technology that becomes more attractive if metal fuels are used for burner reactors or if a pre-processing step is added for oxide fuels. Electrochemical separation processes recover transuranic materials for recycle by electrochemical or selective oxidation and reduction processes using molten salts and liquid metals as the process solvent. Electrochemical
TABLE 8.B.1 UREX+ Processes
|
Process |
Product 1 |
Product 2 |
Product 3 |
Product 4 |
Product 5 |
Product 6 |
Product 7 |
|
UREX+1 |
U |
Tc |
Cs and Sr |
TRU and lanthanide fission products |
Other fission products |
|
|
|
UREX+1a |
U |
Tc |
Cs and Sr |
TRU |
Other fission products (including lanthanides) |
|
|
|
UREX+2 |
U |
Tc |
Cs and Sr |
Pu and Np |
Am, Cm, and lanthanide fission products |
Other fission products |
|
|
UREX+3 |
U |
Tc |
Cs and Sr |
Pu and Np |
Am and Cm |
Other fission products (including lanthanides) |
|
|
UREX+4 |
U |
Tc |
Cs and Sr |
Pu and Np |
Am |
Cm |
Other fission products |
|
Note: Am = americium; Cm = curium; Cs = cesium; Np = neptunium; Pu = plutonium; Sr = strontium; Tc = technetium; TRU = transuranic elements; U = uranium. Source: Idaho National Laboratory, August 10, 2006. Available at www-fp.mcs.anl.gov/nprcsafc/Presentations/NucPhysConf.pdf; accessed May 12, 2009. |
|||||||
separation is also considered to be in the proof-of-principle stage of development, and commercial-scale deployment of this technology is unlikely before 2035.19
Thorium Fuel Cycles
In addition to the fuel cycles described above, closed fuel cycles using thorium (an element approximately three times more abundant in nature than uranium) are possible. The use of thorium-based fuel cycles has been studied for about 30 years, but on a much smaller scale than for uranium or uranium/plutonium cycles (see
www.world-nuclear.org/info/inf62.html; accessed July 2009). With only around 0.8 percent of the world’s uranium reserves, but about 32 percent of the world’s thorium reserves, India has shown significant interest in developing the thorium fuel cycle. Russia and Norway have also shown some interest.
The thorium fuel cycle may offer some proliferation advantages over fuel cycles involving uranium. However, the thorium fuel cycle is technically more complicated than uranium or uranium/plutonium fuel cycles. By absorbing thermal neutrons, thorium-232 produces fissile uranium-233, which can be used as a nuclear fuel. Because the thorium itself is not fissile, a breeding and reprocessing phase must be introduced. In addition, fuel production and reprocessing are complicated by the higher melting point of thorium oxide (ThO2) as compared to uranium oxide, and by the fact that the irradiated fuel is highly radioactive. Finally, a three-stream process for separating uranium, plutonium, and thorium from used fuel, though viable, is yet to be developed (IAEA, 2005). The committee judges that current experience with thorium fuel and the associated fuel cycle is very limited, and this fuel cycle is still under development. It would not be ready for deployment in the United States until after 2035.
In addition to the potential for closed fuel cycles using thorium, once-through fuel cycles using a mixture of thorium and uranium have been considered (Radkowsky, 1999; Kazimi, 2003). The fissioning of the uranium would provide the neutrons needed to initiate the conversion of thorium-232 to fissile uranium-233. It is possible that such a fuel cycle could be deployed using current LWRs. This fuel cycle could increase proliferation resistance over the once-through uranium fuel cycle because the resulting used fuel would display a significant reduction in plutonium content compared to the used fuel from a conventional reactor. Such technology is currently being developed by Thorium Power, Ltd. Their current plans are to deploy this fuel type in a lead-test assembly in a 1 GW reactor within the next 2–3 years (see www.thoriumpower.com/files/Thorium-Power-Ltd.-Information-Kit.pdf; accessed July 2009).
Research and Development Opportunities
To deploy alternative fuel cycles in the United States, further R&D is needed. Several areas in which this research may be needed are described below.
R&D for Fully Closed Fuel Cycles
If the choice is made to pursue the option of a fully closed fuel cycle, considerable R&D is needed, particularly on fuel design, separations processes, fuel fabrica-
tion (particularly of highly radioactive recycle fuel), alternative reactors, and fuel qualification.
In addition to fuel design, development and testing work still will need to be done on specific fuel forms and types before these fuel types will be ready for deployment. Further investigation will be required on the economic and process efficiency of fuel separation processes, as well as the relative resistance to diversion of weapons-capable materials. A major R&D effort will be needed for fuel qualification of recycle fuel, as the isotopic content of the recycle fuel changes on every pass through the reactor. This fuel must thus be qualified for a range of relevant parameters or re-qualified at each pass to avoid damaging the reactor. Waste streams, waste forms, and waste disposal will also require further research.
These R&D needs are very long-term and will not allow these technologies to be commercially deployed in the United States until after 2035. Similarly, a significant number of R&D challenges still need to be overcome. Many processes have been demonstrated at the laboratory scale, and some bench-scale demonstration projects have been successfully completed. However, before commercial-scale deployment is a viable option, integrated engineering-scale demonstration will also need to be completed. Studies are beginning to determine the optimum system configuration (the number of separations plants needed to support the LWRs and the burner reactors) and costs.
R&D for Limited Recycle
As noted previously, the development and use of alternative limited recycle options (such as inert matrix fuel or transuranics targets) could reduce the transuranic waste burden on a future geologic repository without the complication of introducing fast reactors. More R&D as well as subsequent regulatory approval will be required in order for these technologies to be deployable between 2020 and 2035.
Simulation and Modeling
Although significant systems analysis and comparison of once-through and closed fuel cycles has been done, further research in this regard will be essential. In addition, work on modeling and simulations will be needed, from high-level alternative system evaluations, through assessing combined nuclear and chemical processes, and detailed fuel design, to evaluation and qualification. The results of these R&D efforts are unlikely to be of any impact prior to 2020.
ANNEX 8.C:
PROJECTED COSTS FOR EVOLUTIONARY NUCLEAR PLANTS
In view of companies’ recent interest in building new plants, there has been a great deal of effort expended to estimate the levelized cost of electricity (LCOE)20 and overnight construction costs21 for new nuclear power plants in the United States. There is no recent domestic experience to draw on, however. Moreover, at the time of this writing, it is not yet clear what effect the financial crisis of 2008–2009 will have on investment decisions regarding nuclear power. The committee’s analysis does not account for or explicitly address the impacts of the financial crisis.
Over the last few years, cost estimates in the open literature have varied by more than a factor of two. Recent estimates of the overnight cost for new construction have ranged from $2400/kW to as much as $6000/kW (NEI, 2008; Moody’s Investor’s Service, 2008). This range can be explained by several factors:
-
Recent cost escalation of commodities, which affects all new construction;
-
Uncertainty due to lack of recent builds; and
-
Different assumptions made in estimating these costs.
Based on a range of overnight costs drawn from the open literature, the AEF Committee has produced an estimate22 of the range for the LCOE for nuclear power plants deployed in the United States before 2020.23 These estimates were produced using the financial model developed for the Keystone Nuclear Power
|
20 |
The “levelized cost of electricity” at the busbar encompasses the cost to the utility of producing the power on a per-kilowatt-hour basis over the lifetime of the facility, including interest on outstanding capital investments, fuel, ongoing operating and maintenance (O&M) costs, and other expenses. See Box 2.3 in Chapter 2. |
|
21 |
“Overnight cost” is the cost of a construction project if no interest is incurred during construction. Several of the cost estimates discussed were originally expressed in terms of an all-in cost, which includes the interest incurred during construction and some owners’ costs (e.g., costs of preparing the site). For purposes of comparison, all-in estimates were converted to overnight costs by multiplying by a factor of 0.8, derived from the Keystone financial model (Keystone Center, 2007). |
|
22 |
Note that as with all projections, the committee’s are unavoidably based on assumptions that cannot be validated. In addition, the costs are rapidly changing and may go up and down; these numbers are not predictions or forecasts. |
|
23 |
Transmission costs are not included in the cost estimates discussed here. An average estimate of transmission costs for three deregulated utility districts is estimated at about 4¢/kwh (Newcomer et al., 2008). |
Joint Fact-Finding report (Keystone Center, 2007)24 and ranges for key modeling parameters gathered from a variety of sources.25
The primary modeling parameters and the ranges used are summarized in Table 8.C.1. These ranges are intended to bracket the views of a variety of analyses. For example, the range of overnight construction costs assumed by the committee falls between $3100/kW and $6000/kW, and it includes all published estimates of which the committee is aware, when standardized to current conditions. (Examples include NEI, 2008; Moody’s Investor’s Service, 2007; Harding, 2007; Keystone Center, 2007; MIT, 2003, 2009; University of Chicago, 2004; Scroggs, 2008; and TVA, 2005.) New nuclear plants are assumed to begin to deliver electricity in 2020, although a few might come on line earlier.
Due to the large up-front capital investment required, the LCOE for new nuclear plants is sensitive to the assumptions made for the financing of construction costs. All currently operating plants were built either by publicly owned26 or by investor-owned regulated utilities (IOU). However, recent restructuring of the power market has enabled companies known as independent power producers (IPPs) to provide generation services independent of utilities in some areas. IPPs are considered to face higher risk for several reasons, which leads investors to expect a risk premium on their investment. Market competition makes IPPs more sensitive to operational problems; they face direct market competition in a way that IOUs do not. For example, they are unable to pass on unexpected costs to ratepayers as an IOU might (see Box 8.C.1). In the committee’s analysis, financing parameters were treated separately for plants constructed by IPPs and IOUs. These financing parameters are summarized in Table 8.C.2.
The committee has used a range of 7–8 percent (in current dollars) for the rate of return on debt, reflecting the current trading range for debt securities on
|
24 |
The effective capital charge rate for the committee’s analysis, derived using the Keystone financial model, was verified to be consistent with that estimated by the Electric Power Research Institute in a recent publication (2008b), when assumptions are made equivalent. |
|
25 |
To aid in reviewing and evaluating the parameters affecting the cost estimates and determining their approximate uncertainties, the AEF Committee convened a workshop on the cost of electricity from new nuclear power plants in March 2008, including experts from industry, academia, and nonprofit institutions. A detailed discussion of the treatment of these parameters can be found at sites.nationalacademies.org/Energy/Energy_051536. |
|
26 |
Publicly owned utilities include both cooperative and municipal utilities. |
TABLE 8.C.1 Parameter Ranges Used in Cost Calculations
|
Parameter |
Low End |
Distribution Average |
High End |
|
Overnight cost ($/kwe)a |
3000 |
4500 |
6000 |
|
Escalation rate (%) during constructionb |
|
|
|
|
Before 2013 |
−4 |
0 |
4 |
|
After 2013 |
−4 |
0 |
4 |
|
Life-of-plant capacity factor (%)c |
75 |
90 |
95 |
|
Construction time (years) |
4d |
5.5 |
7 |
|
Decommissioning cost ($ million per unit) |
250 |
625 |
1,000 |
|
Waste disposal coste (¢/kwh) |
0.05 |
0.1 |
0.2 |
|
Fuel costs (¢/kwh) |
0.8 |
1.25 |
1.7 |
|
Uranium prices ($/lb) |
20 |
85 |
150 |
|
Enrichment prices ($/kg SWU) |
130 |
190 |
250 |
|
Life of plant (years)f |
30 |
40 |
50 |
|
Cost of regulation and licensing ($ million) |
50 |
100 |
150 |
|
Note: The parameters in the analysis were (in most cases) assumed to be independent and uniformly distributed between an upper and a lower range. The values in the table show the allowed range for each parameter. For example, the high case does not necessarily assume a $6000/kWe overnight cost and a 4 percent real escalation; 2.5 percent inflation is assumed. All costs are given in 2007 dollars. IOU = investor-owned utility; IPP = independent power producer; SWU = separative work unit. aThe capital cost range analyzed is a flat range from $3000/kWh to $6000/kWh. The use of a log-normal distribution made no significant difference in the final LCOE estimate. bOn average, no additional inflation was assumed in the nuclear sector above and beyond economy-wide inflation; however, an uncertainty of 4 percent was used in the calculations. cThe average capacity factor assumes that the lessons learned over the last few decades that have resulted in increasing capacity factors at existing nuclear plants will carry over to evolutionary designs. If plant life is extended, it may no longer be appropriate to continue to assume a 90 percent capacity factor. Also, extending the life may add costs not considered. dIn the 4-year-construction case, some costs have been accounted for in pre-construction. A flat distribution from 4–7 years was used in the analysis. This range is intended to account for the possibility of delays in construction. A log-normal distribution (which adds a low probability tail to higher and higher construction times) was examined, but ultimately not used; the use of this distribution made little difference in the final LCOE estimate. eThis value assumes isolation in a repository and does not account for the possibility that reprocessing becomes the method for waste isolation. Congress has the right to adjust this charge to utilities if needed, and this may occur; however, it is the judgment of the committee that this fee is unlikely to change before 2020. fThe physical life of the plant is typically distinct from the life of the debt. The median costs computed in this section assume a 40-year plant life. Extending the life to 50 years drops the levelized cost further, but by less than 0.2¢/kWh for an IPP and less than 0.26¢/kWh for an IOU. |
|||
|
BOX 8.C.1 Effect on the Cost of Electricity of Rate-Basing Construction Work in Progress Unlike independent power producers (IPPs), investor-owned utilities (IOUs) are in some cases able to expense interest on construction work in progress (CWIP) for new-generation facilities as it is incurred and factor it into customer rates. Although CWIP may not affect the levelized cost of electricity (LCOE) from a new power plant, it can have a significant effect on a utility’s decision process. It can substantially improve the utility’s liquidity during construction, as interest costs are immediately recovered. The initial increase in rates when a new capital-intensive plant comes on line can be very important to ratepayers, public utility commissions (PUCs), the media, utility executives, and their boards. CWIP can reduce this “rate shock” and is therefore an important factor in deciding whether to go ahead with a major capital investment. On the other hand, CWIP itself has immediate rate effects, as interest on construction work is included in rates before new power is generated. These issues can be challenging for state PUCs. Finally, although the price of electricity to the consumer averaged over time may be lower if CWIP is used, the net cost to society may be the same. CWIP shifts some risks to ratepayers that, without CWIP, the owner-operators and their investors would bear directly. |
TABLE 8.C.2 Financial Parameter Ranges Used in Wholesale Cost Calculations
|
Parameter |
IPPs |
IOUs |
Plants with 80:20 Financing and Federal Loan Guarantees |
|
Debt-to-equity ratioa |
50:50–70:30 |
45:55–55:45 |
80:20 |
|
Return on debt (%) |
8 ± 2 |
8 ± 2 |
4.5 |
|
Return on equity (%) |
14.5 ± 5.5 |
12 ± 4 |
IPP: 14.5 ± 5.5 IOU: 12 ± 4 |
|
Note: These values show the central range of the estimates. These numbers are allowed to vary in the calculations to account for uncertainty. The values are nominal, and 2.5 percent inflation is assumed. IOU = investor-owned utility; IPP = independent power producer. aAlthough 80:20 debt-to-equity ratios have been discussed by some IPPs, this financing structure is not explicitly included in the main analysis. Separate estimates for this structure (including loan guarantee assumptions) are found in the text. |
|||
utilities, as estimated prior to the recent economic slowdown.27 The committee has used a range of 11–15 percent for the return on equity (also in current dollars),28 with the lower value applying to IOUs and the upper value applying to IPPs, following discussions with Wall Street financial analysts (J. Asselstine, personal communication, 2008).
The committee estimates that the LCOE from new nuclear plants built by IPPs could be between 8¢/kWh and 13¢/kWh; for IOUs, the LCOE is also likely to be between 8¢/kWh and 13¢/kWh.29 These ranges are 80 percent confidence ranges (from 10 percent to 90 percent.) These calculations do not take into account federal incentives for nuclear power, such as loan guarantees or production tax credits. Nearly all of the recent estimates of the range of LCOE from new nuclear power plants of which the committee is aware overlap with these ranges, as shown in Table 8.C.3.
Some IPPs and IOUs (for example, UniStar; see Turnage, 2008) have displayed an interest in a financing structure of 80 percent debt and 20 percent equity. The Energy Policy Act of 2005 (EPAct05) allows the Secretary of Energy to provide federal loan guarantees for up to 80 percent of eligible project costs after consultation with the Secretary of the Treasury. These loan guarantees are likely to be necessary to achieve such a financing structure, as it is unlikely that companies will be able to acquire loans for 80 percent of the project cost without them (J. Asselstine, personal communication, 2008). These incentives could result in a significant reduction in financing costs and, ultimately, a lower LCOE at the busbar: the estimated range decreases to 6¢/kWh to 8¢/kWh both for IOUs and for IPPs.30 The first-year cost for IPPs in this case is estimated to be slightly higher, between 7¢/kWh and 9¢/kWh. The committee’s assumptions for this financing structure are shown in Table 8.C.3.
TABLE 8.C.3 Levelized Cost of Electricity for New Nuclear Construction
|
Source |
Cost of Electricity in 2007 Dollars (¢/kWh) |
Notes |
|
NEI, 2008 |
6–8 |
First-year cost for IPP; includes loan guarantees and financing with 80 percent debt, 20 percent equity |
|
|
10–12 |
First-year cost for IOU; includes rate-basing CWIP |
|
|
7–9 |
IOU LCOE; includes rate-basing CWIP |
|
Harding, 2007 |
9–12 |
LCOE |
|
Keystone, 2007 |
8–11 |
LCOE |
|
University of Chicago, 2004 |
5–8 (5–7¢/kWh in 2003 dollars) |
LCOE |
|
MIT, 2003 |
8–9 (7–8¢/kWh in 2002 dollars) |
LCOE |
|
MIT, 2009 |
8 |
LCOE |
|
EPRI, 2008 |
7 |
LCOE |
|
Energy and Environmental Economics, Inc. (for California PUC), 2008a |
15 |
IPP LCOE |
|
This report |
8–13 |
IPP LCOE |
|
|
8–13 |
IOU LCOE |
|
|
6–8 |
IPP or IOU LCOE; includes loan guarantees and financing with 80 percent debt, 20 percent equity |
|
|
7–9 |
First year cost for IPP; includes loan guarantees and financing with 80 percent debt, 20 percent equity |
|
Note: LCOE values not originally expressed in 2007 dollars were converted to 2007 dollars using the consumer price index. All costs have been rounded to the nearest cent. EPRI = Electric Power Research Institute; IOU = investor-owned utility; IPP = independent power producer; LCOE = levelized cost of electricity; MIT = Massachusetts Institute of Technology; NEI = Nuclear Energy Institute; PUC = public utility commission. aIn the 2008 study by Energy and Environmental Economics (E3) done for the California Public Utility Commission, their costs estimated how much a fixed-term purchase power agreement would cost for electricity from an IPP, whereas the AEF Committee is looking at a longer-term levelized cost. This accounts for about 10 percent of the difference in the cost estimates. In addition, E3 did not separately change the depreciation schedule for nuclear plants, which accounts for another 3 percent of the difference. |
||
To obtain a loan guarantee, a fee must be paid by the licensee that is sufficient to cover the default risk, given a licensee’s credit rating. This fee equals the “loan guarantee subsidy fee,” which covers the estimated long-term cost to the government of the loan guarantee, calculated on a net present value basis. Using information from that circular, Standard and Poor’s has attempted to estimate potential ranges for subsidy fees, (although the precise methods of calculation are not publicly available). They find that, “[f]or example, if a 1000 MW nuclear unit built at $6000 per kilowatt, with 80% financing from the FFB [Federal Financing Bank], is rated ’BB-’ with a recovery of 70%, the subsidy cost would be a substantial $288 million while a ‘BB’ rated project at the same recovery may have to pay about $192 million” (S&P, 2008). For the purposes of the committee’s estimates, the loan guarantee fee was estimated to be 5 percent of the principal. The committee has also assumed that in this case low interest rates will be available, and these calculations assume 4.5 percent return on debt.31
The committee’s calculations do not explicitly take into account the possibility that vendors could offer significant cost reductions for the first few plants offered to induce a commitment for additional units in the future or potentially capture additional sales. Such incentives could include fixing the price for all or a major portion of the work; providing selected services or equipment at deep discounts; providing especially favorable financial terms; and providing or arranging for low-cost loans or loan guarantees from financial partners or from international sources of funds. These incentives could help to overcome the barriers to construction of the first few plants. However, the terms are likely to be specific to each project and will not be known until the deal is made and publicized. Thus, these effects cannot be built into the generic cost models discussed in this report.
ANNEX 8.D:
ENVIRONMENTAL IMPACTS OF NUCLEAR TECHNOLOGIES
Electricity generated from nuclear power plants is associated with fewer negative environmental impacts (including fewer carbon dioxide, SOx, NOx, and mercury emissions) than is electricity generated from fossil-fuel plants. However, the environmental impacts from the nuclear fuel cycle are not negligible. This annex discusses the environmental impacts of nuclear power plants and associated fuel cycle technologies as well as the potential for additional impacts from an expanded nuclear deployment.
Greenhouse Gas Emissions
In operation, nuclear power plants emit essentially no greenhouse gases. However, CO2 is emitted during nuclear fuel production (particularly enrichment, which accounts for most of the life-cycle CO2 emissions) and during plant construction. Current estimates of life-cycle CO2 emissions show wide variation, primarily due to three factors:
-
Method of enrichment assumed. The gaseous diffusion enrichment process (currently in use in the United States and France) uses approximately 40 percent more electricity than gas centrifuge enrichment (currently in use in Russia and the United Kingdom, as well as other countries) per separative work unit (SWU).32
-
Source of electricity for enrichment. Variations in the generation mix used to produce the electricity required for enrichment processes can produce significant variations in life-cycle CO2 emissions.33
-
Life-cycle analysis (LCA) methods. Different studies use different methods of life-cycle analysis. For example, Fthenakis and Kim (2007) note that economic input/output (EIO) analyses can produce significantly
-
larger estimates for construction and operation than those produced using process-based analyses.34
The committee concurs with the conclusion reached by Fthenakis and Kim (2007) that life-cycle CO2 emissions for nuclear plants, assuming that the current U.S. nuclear fuel cycle is maintained, could range from 16 to 55 g CO2 equivalent per kilowatt-hour.35 For comparison, coal plants without carbon capture and sequestration produce an average of 1000 g CO2 equivalent per kilowatt-hour. This range includes many of the published life-cycle analyses the committee is aware of, with the notable exception of several European studies that estimate lower emissions (including the life-cycle estimate of 8 g CO2 equivalent per kilowatt-hour used by the Organisation for Economic Co-operation and Development/Nuclear Energy Agency [OECD/NEA, 2008]) due primarily to the use of gas centrifuge enrichment.36 The full range of life-cycle analyses reviewed is shown in Figure 8.D.1.
In the future, these life-cycle emissions associated with nuclear plants should decrease in the United States. If the sources of electric power used for fuel enrichment emit fewer greenhouse gases, emissions will be reduced for the nuclear fuel cycle. In addition, future nuclear power plants may require fewer materials and less labor to construct, which will also reduce life-cycle emissions. Finally, two gas centrifuge fuel enrichment plants are being constructed in the United States: one by the Louisiana Energy Services Limited Partnership (LES) in New Mexico, and one by the United States Enrichment Corporation, Inc. (USEC) in Ohio. These plants are planned to come on line in 2009 and 2010, with the latter to achieve full power by 2012. Areva is also planning to begin construction on a third gas
FIGURE 8.D.1 Life-cycle CO2 emissions for nuclear power plants. These estimates were gathered from the open literature. The red bars represent the estimates of Fthnakis and Kim for nuclear power plants built and operated in the United States. The estimates below this range include European and Japanese estimates that assume that nearly all fuel enrichment is done via gas centrifuge; this would not be the case in the United States in the near future. The estimates above this range were from a single source (Storm van Leeuwen and Smith, 2007). The highest estimate includes lower-quality uranium ore than the committee judges is likely to be needed in the near future. In addition, for these three estimates, a different type of life-cycle analysis was used, which may not be directly comparable with other estimates (both for nuclear and other generating options). For comparison, traditional coal plants emit approximately 1000 g CO2 equivalent per kWh of electricity produced.
Sources: Fthenakis and Kim, 2007; ACA, 2001; Vattenfall, 2005; Dones, 2003; Dones et al., 2005; Hondo, 2005; Tokimatsu et al., 2006; ExternE, 1998; British Energy, 2005; White, 1998; and Storm van Leeuwen and Smith, 2007 (SLS, 2007).
centrifuge plant in 2011. These plants may replace the energy-intensive gaseous diffusion plant at Paducah, Kentucky. In addition, General Electric (GE) (or an affiliate) has indicated an intention to build a facility in the United States deploying a laser enrichment technology.
As noted in the main text of this report, deploying new nuclear plants could have a significant effect on the total CO2 emissions in the United States after 2020, but they are likely to have little effect before then. In 2007, the total emissions for the U.S. power sector were roughly 2.4 billion tonnes of CO2. The deployment of 12–20 GWe of new nuclear capacity by 2020 (including both new plants and capacity increases at existing plants) could avoid as much as 40–150 million tonnes of CO2 equivalent per year.37 In 2035, a deployment of 100–108 GWe of new nuclear capacity could avoid 360–820 million tonnes of CO2 equivalent per year, also assuming that new nuclear capacity is replacing an equivalent capacity of coal plants. However, by 2050, as much as 730–2300 million tonnes of CO2 equivalent per year could be displaced.
Impacts on Waste from Production of Nuclear Fuel
There are environmental impacts from the multiple processes involved in producing nuclear fuel. These processes include:
-
Mining, in which natural uranium is extracted from the ground;
-
Milling, in which natural uranium is chemically converted to a dry, purified uranium concentrate: uranium octaoxide (U3O8), or “yellowcake”;
-
Conversion, in which the U3O8 is chemically converted to uranium hexafluoride (UF6) gas for enrichment;
-
Enrichment, in which the concentration by weight of the U-235 isotope is increased;
-
Fabrication of fuel.
Aside from greenhouse gases produced, the primary environmental impact from these processes involves waste from the mining and milling processes—a slightly radioactive by-product known as mill tailings. The tailings contain about 85 percent of the natural radioactivity in unprocessed uranium ore, from radioactive thorium, radium, and radon. Mill tailings also contain low levels of non-radioactive toxic heavy metals (such as chromium, lead, molybdenum, and vanadium) that were present in the ore, and they can contain toxic chemicals used in the milling process. Approximately 200 pounds of mill tailings are typically produced for each pound of natural uranium (DOE, 1997).
Radon emissions from mill tailings due to radioactive decay of uranium were previously an issue of public concern in the United States. Mill tailings are subject to comprehensive regulation in the United States under the Uranium Mill Tailings Radiation Control Act of 1978, with the result that radon emissions from tailings piles are now strictly limited and other releases are tightly controlled.
In some locations, a process called in situ leach (ISL) mining has replaced hard-rock mining and milling of uranium. Conventional mining entails removing ore-bearing rock from the ground and processing it to retrieve the uranium ore. ISL involves recovering the minerals from the ground by injecting a leaching liquid (typically native groundwater mixed with a complexing agent) into the ground in one location and pumping this liquid (which contains dissolved uranium) out of the ground in another location. ISL is in use or planned for use in several locations in the United States (www.eia.doe.gov/cneaf/nuclear/dupr/qupd_tbl4.html; accessed July 2009). In order for ISL to be used, the uranium must occur in permeable rock. In many cases, the uranium occurs in permeable sandstone aquifers. The use of ISL results in smaller amounts of mill tailings to be disposed of. Nevertheless there is potential for the environmental impacts such as groundwater contamination if the leaching liquid spreads outside the uranium deposit; the removal of hundreds of millions of gallons of water from the aquifer (particularly in dry areas); and final contamination of the aquifer that is difficult to impossible to remediate once the mining operation is complete.
At present, very little uranium is mined in the United States, although there has recently been a significant upsurge in mining activity. In 2003, 997 tonnes of U3O8 were produced from U.S. mines; in 2007, 2057 tonnes of U3O8 were pro-
duced from U.S. mines (EIA, 2007). This remains a small fraction of the approximately 49,000 tonnes of U3O8 produced in the world in 2007 (42,000 tonnes in 2003 [www.world-nuclear.org/info/inf23.html; accessed July 2009]).
This foreign dependence does not appear to represent a security risk, as there are extensive uranium resources in Canada and Australia. In 2007, 33 percent of the uranium purchased by owners and operators of U.S. civilian nuclear power reactors was imported from Russia, and it was primarily produced from down-blended38 Russian weapons-grade uranium; 88 percent of the remaining uranium was mined and milled outside the United States, primarily in Canada (21 percent of uranium purchased in 2007) and Australia (23 percent of the uranium purchased in 2007).39
The process of conversion results in less waste than from mining and milling, and these by-products are characterized by the presence of thorium, radium, and radon gas. Finally, enrichment separates natural uranium into enriched uranium for use in power plants and depleted uranium (DU). The DU must be disposed of. Because of its large density and relatively low radioactivity levels, some depleted uranium is used for commercial applications, such as ballast in commercial aircraft and ships, and in military applications, such as armor and armor-piercing munitions. Significant inventories of DU in the form of UF6 remain for disposition at enrichment sites, and these materials present potential health and environmental risks because they are maintained in the form of UF6.
The expanded deployment of nuclear power in the United States (particularly after 2020) may result in increased demand for uranium with an associated increase in worldwide uranium mining and milling. However, as noted previously, very little uranium is mined in the United States, and few nuclear plants are likely to be constructed in the United States before 2020. Thus, domestic environmental impacts related to the front end of the nuclear fuel cycle due to an increased
|
38 |
“Down-blending” refers to a process in which low enriched uranium (reactor grade) is produced from highly enriched uranium (weapons grade). |
|
39 |
Environmental regulations for mill tailings are equivalent to those in the United States in both Canada and Australia. However, the majority of uranium purchased in 2007 by owners and operators of U.S. nuclear plants that was not domestically produced (8 percent) or imported from Russia, Canada, or Australia was imported from Namibia, Kazakhstan, and Uzbekistan (13 percent). These nations may not have equivalent regulations. (Less than 1 percent was imported from the Czech Republic in 2007. Data were not included on the origin of the remaining 2 percent of the uranium—around 889,000 lb of U3O8 equivalent—in the EIA’s statistics.) See EIA (www.eia.doe.gov/cneaf/nuclear/umar/table3.html; accessed July 2009). |
deployment will be small before 2020. These impacts may increase if these initial plants are successful and many more plants are constructed after 2020, and if more mining is undertaken in the United States to meet an increased demand for uranium.
Impacts During Operations
The environmental impacts of nuclear power plants during operations in many cases are similar to those of other large thermal power plants and relate largely to water use and consumption for heat management. These impacts arise from the cooling systems of large plants. Some routine radioactive emissions also occur during plant operations.
Water Use
Thermal power plants typically use significant quantities of water during operation, primarily for cooling. The amount of water required can create problems if the location does not have an adequate water supply, or if power output at some sites must be constrained to comply with permit limitations on the temperature increase that can be accepted in the receiving waters. The amount of cooling required is determined by the thermal efficiency of the plant; nuclear power plants on average require more cooling water per kilowatt-hour of electricity produced than do fossil-fuel plants of comparable age (due to nuclear power plants’ lower average thermal efficiency.)
Most U.S. power plants use one of two types of cooling processes: once-through cooling or closed-cycle wet cooling.40 Once-through cooling is rarely, if ever, used on plants built after the 1970s, as a result of environmental restrictions imposed by Section 316 of the U.S. Clean Water Act governing thermal discharges (Section 316[a]) and intake losses (Section 316[b]).
There is a distinction between water use and water consumption; in many cases much of the water is returned to the source after it is used for cooling, albeit at a higher temperature. A nuclear plant using once-through cooling uses about 95,000–227,000 liters of water per megawatt-hour and consumes about 1,500 liters/MWh, whereas a nuclear plant using closed-cycle wet cooling uses about 3,000–4,200 liters of water per megawatt-hour of electricity produced and consumes about 2,700 liters/MWh. For comparison, a coal-fired power plant using once-through cooling uses about 76,000–189,000 liters of water per megawatt-hour and consumes about 1,100 liters/MWh, and a coal plant using cooling towers uses about 1,900–2,000 liters of water per megawatt-hour of electricity produced and consumes about 1,800 liters/MWh.
After 2020, alternatives such as dry cooling may be able to reduce water use further. Dry cooling is usually accomplished with mechanical-draft air-cooled condensers to which turbine exhaust steam is ducted through a series of large ducts, risers, and manifolds. Dry cooling still has significant disadvantages, including higher costs, higher operating power requirements, and reductions in plant efficiency and capacity during periods of hot weather. Dry cooling has been used for some coal-fired plants,41 but at present, no nuclear plants have been constructed using this technology.
Hybrid cooling, which typically consists of a dry cooling system operating in parallel with a conventional closed-cycle wet cooling system, is an alternative that is finding increased use at some new coal-fired plants. A hybrid cooling system was built in 1988 at the Neckarwestheim Nuclear Plant in Germany. Hybrid cooling is also proposed for use in several evolutionary nuclear plants intended to be built in the United States in the near term, including the new reactor proposed by UniStar for the Calvert Cliffs site in Maryland (Pelton, 2007).
The water use impacts of future nuclear plants will depend on where the plants are sited and what cooling technologies are employed. Water use and consumption will be a consideration in siting new nuclear plants in areas such as the American southwest with growing populations but limited water supplies. In some instances, wet cooling systems can use nonfreshwater sources such as seawater (if located on the coast), brackish water from wells or estuaries, agricultural runoff, produced water from oil and gas drilling operations, or treated municipal waste-water (Veil, 2007).
Routine Radioactive Emissions
Some citizens are concerned by routine radioactive emissions that occur during plant operations.42 These emissions of radiation originate from routine operations of nuclear power plants and largely consist of neutron activation products in the cooling water, fuel rod leaks, and radioactive contaminants from atmospheric emission of fission gases (particularly noble gases). Each U.S. nuclear plant is required to monitor and report these emissions to the USNRC in an annual report as a condition of maintaining its license.43 Both gaseous and liquid releases are reported in units of the amount of radiation released and the resultant dose to the hypothetical maximum exposed individual. The reports take into account any interim used fuel storage on the site as well as the operation of the plant itself, and the releases are limited by the license of the plant.44 These emissions are typically several orders of magnitude below statutory limits and would not be expected to produce meaningful health risks to people living near the plants. Nonetheless, these emissions can be of great concern to local citizens who may not have confidence in statutory limits, as seen in the controversy over tritium leaks at the Braidwood plant in Will County, Illinois.45
Disposal of Used Nuclear Fuel and Other Waste
The operation of a nuclear power plant generates several types of radioactive waste, which must be stored and eventually disposed of. These include:
|
42 |
Coal plants also produce radioactive emissions, primarily from radioactive thorium and uranium that is naturally present in coal. When coal is burned into fly ash, the uranium and thorium are concentrated at up to 10 times their original levels. Some of these materials may escape with other particulates from an operating coal plant. As a result, the radioactive emissions from a coal plant may exceed those from a nuclear plant with an equivalent capacity. |
|
43 |
Typical examples of such reports are given in Public Service Enterprise Group (PSEG, 2007) and Entergy (2007). |
|
44 |
Detection of higher than usual releases, still well below statutory limits, can be helpful in identifying leaks needing attention. The data from the annual reports show that the absolute releases and resultant doses are typically several orders of magnitude below the statutory limits. |
|
45 |
News coverage of public concerns about the tritium leaks at the Braidwood nuclear power plant in Illinois are available at www.pbs.org/newshour/bb/environment/jan-june06/tritium_4-17.html; accessed July 2009. Further information about the actions taken can be found at the Illinois EPA website: www.epa.state.il.us/community-relations/fact-sheets/exelon-braidwood/exelon-braidwood-2.html; accessed July 2009. |
-
Used fuel from the nuclear reactor (also referred to as spent fuel);
-
Other radioactive waste generated during plant operations; and
-
Radioactive decommissioning waste resulting from the demolition of the plant after permanent shut down.
Because of their radioactivity, these wastes pose unique challenges. At present, there is inadequate disposal capacity for many types of radioactive wastes, including used nuclear fuel. The following sections and Table 8.D.1 provide further detail on the management and disposal of these wastes in the United States.
Used Nuclear Fuel
The 104 currently operating nuclear plants in the United States generate about 2200 metric tons of uranium (MTU)46 per year of used nuclear fuel, an inert but highly radioactive solid. Because used fuel is highly radioactive, it must be handled using remote-handling equipment, stored in highly shielded facilities, and disposed of in a manner that is designed to sequester it from the environment such that predicted doses of certain potentially exposed people are below specified regulatory limits.
The major constituents of used fuel are uranium, transuranic elements produced by neutron capture, and fission products produced by neutron-induced or spontaneous fission of uranium and transuranic elements. The great majority of the radionuclides found in used fuel are relatively short-lived and decay to low levels over decades; for example, the radioactivity from Cs and Sr decreases rapidly a few decades after discharge from the reactor. The toxicity of used fuel as a function of time is shown in Figure 8.D.2. However, some long-lived actinides and fission products are potentially toxic for many thousands of years, and, with a once-through fuel cycle, used fuel will need to be managed (though not necessarily actively) for hundreds of thousands of years. Thus, concerns associated with managing used fuel are intrinsically intergenerational.
TABLE 8.D.1 Management and Disposal of Radioactive Waste from U.S. Nuclear Power Plants
|
|
Waste Generation at U.S. Nuclear Power Plants |
||
|
Used Fuel |
Other Operating Waste |
Decommissioning Waste |
|
|
Annual waste generation |
2200 MTU (2007) |
3,834 m3 of LLW generated by nuclear power industry (1998 data) |
|
|
Radioactivity |
Long-lived, highly radioactive |
Mostly short-lived, low-to-intermediate radioactivity; small volumes of long-lived highly radioactive waste |
Mostly short-lived, low-to-intermediate radioactivity; small volumes of long-lived highly radioactive waste |
|
Storage |
Pools: about 58,000 MTU at 65 operating sites, 9 sites with no operating reactors, and one centralized storage site |
Dry storage (drums and casks) at plant sites; storage of Greater-Than-Class-C waste in pools and casks |
No storage of Class A, B, C waste; storage of Greater-Than-Class-C waste in pools and casks |
|
|
Dry casks: about 10,500 MTU in about 900 dry casks at 40 sites |
|
|
|
Disposal |
Deep underground repositories |
Land disposal facilities for Class A, B, C waste; no disposal pathway for Greater-Than-Class-C waste |
Land disposal facilities for Class A, B, C waste; no disposal pathway for Greater-Than-Class-C wastea |
|
Current availability of storage |
Adequate wet and dry storage available on-site |
Adequate storage available on-site |
Waste can be stored on-site during decommissioning |
|
Current availability of disposal |
None |
Adequate for Class A waste; limited for Class B, C waste; none for Greater-Than-Class-C waste |
Adequate for Class A waste; limited for Class B, C waste; none for Greater-Than-Class-C waste |
|
Note: MTU = metric tons of uranium. aIn terms of radioactivity, low-level radioactive waste is classified as A, B, C, or Greater Than Class C (in order of ascending hazard) based on activities of specific radionuclides. See 10 CFR 61 for exact definitions. Sources: Used fuel quantities: NEI written communication; NEI website (www.nei.org); U.S. Department of Energy Manifest Information Management Systems (mims.apps.em.doe.gov; accessed July 2009). Storage sites: APS, 2007. |
|||
FIGURE 8.D.2 Toxicity of nuclides in used fuel from a light-water reactor. Toxicity is defined here as the volume of water required to dilute the radionuclide to its maximum permissible concentration per unit mass of the radionuclide. High index numbers denote more toxic radionuclides—that is, more water is required to dilute these radionuclides to “safe” levels. The toxicity levels shown in this figure are for direct human ingestion of used fuel and therefore would not necessarily apply for other exposure pathways. For example, radionuclide toxicities for exposures from groundwater would be dominated by isotopes that are soluble and not sorbed completely by the host rock.
Source: Oak Ridge National Laboratory.
Final Disposal
The final disposal of used fuel (as well as other high-level waste47) has been studied by the federal government since the 1950s. However, a decision as to how to permanently dispose of this material was not made until 1982. The Nuclear Waste Policy Act of 1982 provided that the disposal of used fuel from commercial nuclear power plants was a federal responsibility, as well as that the federal government would construct and operate a deep geological repository for this purpose.48 In 1987, the Nuclear Waste Policy Act Amendments Act directed the federal government to investigate Yucca Mountain, Nevada, as the nation’s first disposal site.
The 1987 Amendments Act required that the DOE, the agency responsible for siting, constructing, and operating a repository at Yucca Mountain, begin receiving commercial used fuel for disposal at Yucca Mountain no later than January 31, 1998; however, there have been delays. The DOE filed a license to construct the repository in June 2008. If that application (and a subsequent operating amendment) is ultimately approved by the USNRC (see Box 8.D.1) and survives expected court challenges, the DOE previously expected to open the repository sometime after 2020. However, the prospects for the Yucca Mountain repository are obviously diminished by the declared intent of the Obama administration not to pursue this disposal site. The FY 2010 Presidential Budget Request reduces the funding for the Yucca Mountain program to a level deemed necessary to respond to USNRC queries during the Yucca Mountain license review process.
To accommodate the used fuel from current plants, a second geologic repository may need to be constructed, or if Yucca Mountain is ultimately pursued,
|
47 |
“High-level waste” (HLW) consists of radioactive materials at the end of a useful life cycle that should be properly disposed of, including (1) the highly radioactive material resulting from the reprocessing of used nuclear fuel, including liquid waste directly in reprocessing and any solid material derived from such liquid waste that contains fission products in concentrations; (2) irradiated reactor fuel; and (3) other highly radioactive material that the U.S. Nuclear Regulatory Commission, consistent with existing law, determines by rule requires permanent isolation (USNRC online glossary, available at www.nrc.gov/reading-rm/basic-ref/glossary.html; accessed July 2009). |
|
48 |
Disposal is to be funded by a waste management fee levied at one dollar per MWh, paid by the ratepayers of nuclear electricity generation companies, and collected in a federally administered waste management fund. At the end of 2007, just over $27 billion had been collected from ratepayers and credited to the fund from industry payments and interest. About $9 billion has been spent to develop a repository (www.ocrwm.doe.gov/about/budget/index.shtml; accessed July 2009). |
|
BOX 8.D.1 Radiation Exposure Limits at Yucca Mountain The U.S. Nuclear Regulatory Commission’s (USNRC’s) approval of the Department of Energy’s (DOE’s) application to construct a repository at Yucca Mountain is predicated on a demonstration by the DOE that the repository will satisfy regulatory requirements. In 2001, the Environmental Protection Agency (EPA) published standards for the disposal of used nuclear fuel and high-level radioactive waste at the geologic repository planned at Yucca Mountain, Nevada. The standard was remanded because it was not based on and consistent with the 1995 report Technical Bases for Yucca Mountain Standards (NRC, 1995). In 2005, the EPA proposed a revised standard and it was promulgated in September 2008. The revised standard provides for a separate dose limit (100 millirem/yr) to be applied beyond 10,000 years up to 1 million years. In February 2009 the USNRC published its final rule incorporating the EPA standards into the USNRC regulations for Yucca Mountain. |
federal legislation may need to be modified to increase its capacity. (About 68,500 MTU of used fuel is currently in storage at U.S. plant sites, while storage was allocated for only 63,000 MTU of commercial used fuel at Yucca Mountain.49) If, as expected, nearly all of the 104 currently operating nuclear power plants in the United States receive 20-year license extensions (for a total of 60 years of operation), the eventual inventory of used fuel could reach 138,000 MTU, even without construction of new plants (USNRC, 2008).50
The Nuclear Waste Policy Act requires the Secretary of Energy to report to Congress no later than January 1, 2010, concerning the need for a second geologic repository. In December 2008, Energy Secretary Samuel Bodman transmitted this report to the President and the Congress; it stated that “unless Congress raises or eliminates the current statutory capacity limit … [on Yucca Mountain], a second repository will be needed” (available at www.energy.gov/news/6791.htm; accessed
July 2009). Given the experience with Yucca Mountain, even if a second repository is proposed, it is the judgment of the committee that a second repository almost certainly could not be operational until after 2035.
Interim Storage
Until a final repository becomes available, from a technical perspective, analyses have shown that used fuel can be stored for many decades in dry cask storage at low risk, or as long as society is willing to devote the attention and resources to managing it (NRC, 2001). There are two basic options for such storage:
-
Continued aboveground storage at plant sites, initially in pools and ultimately in dry casks.51
-
Centralized interim storage in dry casks at one or more regional sites or at a single national site.
Extended interim storage, whether at a plant or centralized facility, has several potential advantages. Extended surface storage would allow time for the radioactive decay of isotopes with shorter half-lives, which would reduce the heat loads if the used fuel were eventually emplaced in a repository. In addition, the facilities can be actively monitored and maintained for an indefinite period of time.
At present, used fuel is being stored at currently operating plant sites; this practice could be continued.52 As of 2009, approximately 58,000 MTU of used fuel was in storage in pools at 75 sites, and about 10,500 MTU was in dry cask storage at 40 sites. Used-fuel pools at most plants are at or near their storage
|
51 |
After removal from the reactor, used fuel is stored for several years in water-filled pools with active heat removal systems. The water is an effective heat transfer medium and also serves as an effective radiation shield. Used fuel can be moved into dry storage after at least 3 years of cooling in the pool, although most fuel being dry stored is much older. Used fuel is dry-stored in heavily shielded casks that use passive heat removal systems (conduction and convection) for cooling. |
|
52 |
As of November 2008, 40 operating generally licensed independent fuel storage installations (ISFSI) existed in the United States, and there were 15 specifically licensed ISFSIs at or away from reactor sites (see www.nr.c.gov/waste/spent-fuelstorage/locations.html; accessed July 2009). Thirty states have at least one ISFSI. The federal government is paying some plant operators’ expenses for extended on-site storage of used fuel because of the delay in opening the repository. |
capacities,53 so the quantity of used fuel in dry cask storage is expected to increase in the future. However, there is enough room at existing sites to continue to store used fuel in dry casks, even if 60-year life extensions for all operating plants are granted (APS, 2007). All current U.S. commercial used fuel stored in vertical dry casks (spaced 16.5 feet, or about 1.5 cask diameters, apart) would cover an area of about 4.4 million feet, or about one-sixth of a square mile.54 Once the plant shuts down and is decommissioned the used fuel at the site would become “stranded.” The plant operator would remain responsible for managing this fuel and would not be able to terminate the plant license until the fuel was moved off-site. At present, used fuel is stranded at six plants in the United States. The U.S. government holds ultimate responsibility for the disposition of this stranded used fuel and at least some of the costs of its storage.
Alternatively, used fuel could be collected in several regional facilities or one national interim storage facility. Development of centralized storage could reduce pressure to working out the obstacles to geologic storage, but it would also have disadvantages. Regional storage would require transport of used fuel from the plant sites, which would require additional expense and could raise public concerns, and if a repository is eventually opened, the fuel may need to be transported a second time. In addition, it requires significant time to identify and license a site. For example, the licensing process for the centralized storage site proposed by Private Fuel Storage, LLC at Skull Valley, Utah, required almost 9 years from the filing of the license application with the USNRC until a draft license was issued.55 Thus, it is unlikely that sufficient facilities could be identified and licensed before 2020.
Other Operating Wastes
In addition to used nuclear fuel, other radioactive wastes are generated during nuclear power plant operations. In the United States, these wastes are defined
by exclusion and are referred to as low-level wastes (LLW).56 These wastes have much lower radioactivity than does used fuel, and that radioactivity decays to background levels57 in less than 500 years (about 95 percent decays to background levels within 100 years or less.) These wastes include items like contaminated gloves, personal protective clothing, tools, water purification filters and resins, and plant hardware.
LLW is typically characterized both by volume and by radioactivity (measured in curies for specific isotopes). The nuclear power industry produces about 3800 m3 of LLW per year. The median for each plant is about 21 m3 for PWRs and 79 m3 for BWRs. This volume of waste is equivalent to 33.6 average-sized refrigerators per year for each PWR and 126.4 average-sized refrigerators per year for each BWR.
In terms of radioactivity, low-level radioactive waste is classified as A, B, C, or Greater-Than-Class-C (in order of ascending hazard) based on activities of specific radionuclides.58 About 90 percent of the LLW produced by U.S. nuclear plant operations is low-activity Class A waste; this waste can be disposed of in land disposal facilities. There are limited commercial disposal sites for these wastes in the United States. Higher activity wastes (Class B and C waste) can also be disposed of in land disposal facilities, but appropriate facilities are not available to generators in all states.59 Due to these limitations and the small volume of these wastes, many plants are storing these wastes on-site. Wastes with even higher activities (Greater-Than-Class-C waste) currently have no approved disposal pathway.60 This waste, which typically consists of neutron-activated metal plant hardware, is also being stored on-site at plants, usually in the used-fuel pools or in dry casks. This waste will remain at these sites until a disposal facility is available to accept it.
In recent years, the nuclear industry has made an effort to reduce the amount
of LLW produced. Cost for disposal is by volume and activity, and waste is processed to reduce volume by supercompaction.61
Decommissioning Wastes
The decommissioning of a nuclear plant after it has been permanently shut down produces large volumes of waste, some of which is radioactive.62 Decommissioning can occur immediately after shutdown, or plants may be put into a safe storage condition for a number of years to allow time for radioactive decay. In the decommissioning process, fuel is removed from the reactor core, the reactor core internals and reactor vessel are removed, other radioactively contaminated parts of the plant (e.g., contaminated piping and equipment, contaminated concrete) are removed or decontaminated, and finally, the plant is demolished. This decommissioning waste is distinct from the stranded fuel, which as discussed previously is used fuel remaining at the site after final decommissioning of the power plant.
The waste produced during the decommissioning process consists of both nonradioactive and radioactive waste. Much of the waste is uncontaminated and can be recycled (e.g., steel or concrete) or disposed of in a landfill. Radioactively contaminated waste must be disposed of in a land disposal facility (for Class A, B, and C waste, as described previously). This waste includes most of the radioactively contaminated materials from the plant, including the reactor vessel. Some of the metal components of the reactor core are Greater-Than-Class-C wastes and currently have no approved disposal pathway. They must continue to be stored on-site until these materials can be removed to a disposal facility.
Adequate funds are assured to complete this process for all U.S. plants, as every licensee is required to contribute to a USNRC-supervised fund for this purpose during the period of operations. To date in the United States, 23 commercial
nuclear power reactors have been shut down, and 9 of these have completed the decommissioning process.
Impacts from New and Expanded Deployment
Two types of impacts might result from the deployment of future nuclear technologies:
-
The construction of new nuclear plants in the United States will result in the generation of additional used fuel, other operational waste, and decommissioning waste.
-
New waste forms requiring disposal may emerge from alternative fuel cycle technologies.
New nuclear power plants will produce waste that is similar to the waste produced by current plants, with two possible exceptions. First, the burn-up of nuclear fuel will likely increase as new fuel designs are developed. This will reduce the amount of used fuel generated per unit of electricity production.63 However, the higher burn-up fuel will contain more heat-generating radioactive isotopes and may have to be actively cooled (in used-fuel pools) for longer periods of time. Second, advanced plant designs generally use fewer cables, pipes, valves, and pumps than current generation plants use and, in some cases, less structural steel and concrete. This could reduce decommissioning costs and time (as well as front-end construction costs and time) and also reduce the volume of material requiring disposal.
New nuclear plants will also generate additional used fuel. Assuming a once-through fuel cycle, if 5 to 9 new plants are constructed between 2009 and 2020, the quantity of used fuel produced each year in the United States could produce an additional 105 to 189 MTU of used fuel annually, an increase of at most 9 percent in 2020. However, if a larger number of plants are built after 2020, this amount could increase significantly. If 70 to 74 new plants are built by 2035, the amount of used fuel produced annually would increase by 71 percent between 2009 and 2035 (assuming that the operating licenses of all existing plants are extended to
60 years.)64 Given the current impasse on used fuel disposal, it should be anticipated that any new plant will be constructed with an eye toward the possibility that extended on-site storage of fuel may be required. This suggests that such storage could be incorporated into the design of new plants.
In contrast, technologies such as advanced fuel cycles may produce waste forms that are different from those produced by current U.S. plants. For advanced fuel cycles, various waste streams emerge from the separations processes. These can include separated strontium and cesium, technetium, claddings, and hulls, along with the remaining fission products. These waste streams will require specialized waste forms. For example, in the UREX+ process, the technetium isotope that is separated from used fuel would be relatively mobile if emplaced in the Yucca Mountain geologic setting unless placed in a specially designed waste form. Separation of technetium allows it to be separately handled in a specially designed waste form. The cesium and strontium isotopes in the used fuel have comparatively short half-lives and, if separated from the high-level waste for the repository, could potentially be stored in less costly aboveground or near-surface sites. These isotopes will have essentially decayed away in a few hundred years. In general, waste form certification is at the proof-of-principle stage (DOE, 2007).
ANNEX 8.E:
SAFETY AND SECURITY IMPACTS OF NUCLEAR TECHNOLOGIES
The primary impact of concern in the event of an accident or an intentional attack on a nuclear power plant is the same: major off-site releases of radioactive material. This section examines potential safety65 and security66 impacts arising from the operation of nuclear power plants in the United States. The following discussion is drawn from a recent National Research Council report on the safety and security of commercial spent nuclear fuel storage (NRC, 2006).
There are two potential sources for off-site radioactive releases: the nuclear fuel in the reactor core and in used fuel storage. An accident or terrorist attack that disrupts cooling of the fuel could damage the fuel and release radioactive material to the environment. The fuel in the reactor core of a nuclear plant generates substantial quantities of heat and radioactivity. The plant’s cooling system is designed to remove this heat from the core so it can be used for electricity generation. A loss of coolant would cause temperatures in the core to increase, even after the reactor is shut down.67 At about 1000°C, the fuel cladding68 would begin to oxidize rapidly in the presence of air or steam (if the core did not remain covered with water). This exothermic reaction releases large quantities of heat that would further raise temperatures. At about 1800°C, the cladding and fuel would begin to melt, releasing radioactive gases and aerosols into the core. These radioactive materials could be released to the surrounding environment if the reactor pressure vessel69 and the containment70 were to fail. Such releases could endanger local populations and contaminate the environment.
An accident or terrorist attack on a used-fuel pool could have similar con-
sequences. After its removal from the reactor, used fuel continues to generate heat and must be actively cooled. Fuel is stored in water-filled pools that have active cooling systems to remove this heat and water filtering systems to remove radioactive contamination. An accident or terrorist attack that results in the loss of coolant from the pool could raise fuel temperatures, possibly resulting in cladding oxidation and fuel melting with a consequent release of radioactive gases and aerosols. These processes would likely unfold more slowly than would the events following a disruption of core coolant, because the used fuel stored in pools generally has lower rates of heat generation. Consequently, plant operators would have more time to implement backup cooling measures.
The pools themselves are constructed with thick reinforced concrete walls and stainless steel liners. A 2006 National Research Council report concluded that successful terrorist attacks on used-fuel pools would be difficult, and “an attack that damages a power plant or its spent fuel storage facilities would not necessarily result in the release of any radioactivity to the environment” (NRC, 2006, p. 6). The report also noted that used fuel in dry cask storage poses considerably less risk.
Nuclear plants have backup systems and procedures designed to prevent or mitigate the consequences from the accidental disruption of coolant flow to the reactor core or used-fuel pool. For example, the reactor containment is designed to limit the release of any radioactive material from the reactor core in the event of an accident. Plants have multiple backup supplies of cooling water as well as emergency cooling systems that can flood or spray the fuel in the core with water. They also have backup sources of water for the used-fuel pools, and water sprays could be deployed to cool the fuel even if the pool could not be refilled (NRC, 2006). In addition to these backup systems, plant operators are required to perform probabilistic analyses to understand and mitigate the consequences of accidental disruptions of core cooling, as well as to develop and implement plans to notify authorities and residents living near their plants in the event of emergencies.
Safety
Efforts to improve safety in U.S. plants have focused in part on reducing the probability of the most likely sequences of events or failures that could result in a radioactive release. Most early nuclear plants were designed to conform to particular design rules, such as an insistence that the design incorporate multiple barriers and provide the means to prevent an event from resulting in a radioactive release to the public, as well as conservative engineering assumptions as to the
capabilities of materials and equipment. Over time, an analysis technique termed probabilistic risk assessment (PRA) was developed that allows the systematic evaluation of the various sequences of events or failures that could result in a release and the determination of the probability that any given sequence might arise. PRAs suggest that the likelihood of an accidental release in the United States from the currently operating reactors is small. According to the Reactor Safety Study undertaken by the U.S. Atomic Energy Commission in 1975, the probability of such an occurrence was estimated at one in 17,000 per reactor per year (USNRC, 1975). However, more recent studies have concluded that the core damage frequency is between 10−5 and 10−6 events per reactor per year for current plants (Sheron, 2008).71 Extensive efforts have been undertaken by the USNRC and the licensees to consider the accident sequences presenting the greatest risk and to implement measures to thwart them.
Some critics contend that safety problems continue to arise associated with nuclear reactors in the United States due to inadequate enforcement of standards by the USNRC (UCS, 2008), pointing to 36 instances that have occurred since 1979 where individual reactors have been shut down for more than a year to restore safety standards (Lochbaum, 2006). However, it should be noted that these shutdowns to restore standards were initiated by the USNRC.
Security
In addition to reactor accidents, after the attacks of September 11, 2001, terrorist threats to nuclear power plants have become a concern. As noted above, the primary concern is that a terrorist attack on a nuclear reactor might result in a radioactive release to the surrounding area.
Every U.S. nuclear plant has a security plan that must be approved by the USNRC to respond to an attack at the level of the Design Basis Threat (DBT)72 or below. The details of the DBT are not available to the public, but it is described as an attack carried out by a well-armed land force aided by a knowledgeable insider. The plants defend against this threat primarily through the use of a
layered security system involving access controls and requirements, physical barriers (including standoff protection for bombs), armed guards, and armored firing positions.
Attacks that are beyond the DBT are also a concern, including, in particular, air attacks. The industry and its regulator (the USNRC) have stated that defending against these types of attacks is the federal government’s responsibility,73 not that of the plant operator.
Since the September 11, 2001, attacks, the USNRC and the nuclear industry have undertaken analyses of existing plants to determine their vulnerability to aircraft attacks and have made modifications to the designs and operations to mitigate the consequences of such attacks. In addition, the DBT has been increasd in severity, with the result that the capacity to withstand terrorist attacks of all types has been enhanced. U.S. plant operators report that they have spent in excess of a billion dollars on physical upgrades and security since September 11, 2001 (www.nei.org/keyissues/safetyandsecurity/factsheets/powerplantsecurity; accessed July 2009). These include changes to plant access controls, operating procedures, and other security measures. The details of these analyses and modifications have not been released to the public (due to security concerns), and the committee has not reviewed this information.
Impacts from Expanded or New Deployments
New evolutionary nuclear plant designs are intended to improve both safety and security over currently operating plant designs. Some modern designs for reactors of the types that are proposed for near-term construction in the United States (discussed in Annex 8.A) promise to reduce core damage frequency by a factor of 10 to 100 from the probability of such an event in an existing plant. In addition, these designs include enhanced physical protection of the core and used-fuel pools intended to reduce their vulnerabilities to beyond-DBT attacks such as air attacks; designs of core cooling systems that rely on passive systems (using gravity and natural circulation) to maintain cooling in the case of an accident or terrorist attack; and the design and placement of multiple independent safety systems to provide spatial redundancy intended to improve survivability in accidents or attacks (and also to allow some maintenance on these systems to occur while the
plant is operating). In addition, the USNRC recently promulgated a rule requiring applicants for new nuclear reactors to identify features and functional capabilities of their designs that would provide additional inherent protection from or mitigate the effects of aircraft attacks. Plants are either acceptable as designed or will be upgraded.
ACA (Australian Coal Association). 2001. ACARP-Coal in Sustainable Society. Available at ciss.com.au/ref/static/reports/public/acarp/acarp1.html.
Alberta Department of Energy. 2007. Alberta’s Oil Sands 2006. December. Available at www.energy.alberta.ca/OilSands/pdfs/osgenbrf.pdf.
APS (American Physical Society). 2007. Consolidated Interim Storage of Commercial Spent Nuclear Fuel: A Technical and Programmatic Assessment. Washington, D.C.
Beliav, V., and V. Polunichev. 1998. Basic Safety Principles of KLT-40C Reactor Plants. IAEA-TECDOC-1172. International Atomic Energy Agency.
Bennett, R. 2008. Prospects for and barriers to emerging technologies: Advanced reactors. Presentation to the AEF Committee, January.
British Energy. 2005. Environmental Product Declaration for Torness Nuclear Power Station. Executive Summary available at www.british-energy.com/documents/EPD_Exec_Summary.pdf; last accessed July 2009.
Carraway, T., and B. Wills. 2001. Decontamination and decommissioning of Big Rock Point nuclear power plant. WM01 Conference, February 25–March 1, 2001, Tucson, Ariz.
Chenier, Philip J. 2002. Survey of Industrial Chemistry. Third Edition. New York: Kluwer Academic Plenum Publishers.
DOE (U.S. Department of Energy). 1997. Linking Legacies: Connecting the Cold War Nuclear Weapons Production Processes to Their Environmental Consequences. Washington, D.C.
DOE. 2000. Energy and Environmental Profile of the U.S. Chemical Industry. U.S. Department of Energy, Office of Industrial Technology. Washington, D.C. May.
DOE. 2006. Federal Register 71(151; Aug. 7):44673.
DOE. 2007. GNEP Technology Development Plan. Available at nuclear.inl.gov/gnep/d/gnep-tdp.pdf.
DOE. 2008a. Request for Expressions of Interest for the Next Generation Nuclear Plant Program. Available at nuclear.gov/pdfFiles/NGNP_EOI.pdf.
DOE. 2008b. USDOE Final Supplemental Environmental Impact Statement for a Geologic Repository for the Disposal of Spent Nuclear Fuel and High-Level Radioactive Waste at Yucca Mountain, Nye County, Nevada. DOE/EIS-0250F-S1. Washington, D.C.
Dones, R. 2003. Kernenergie. In: Sachbilanzen von Energiesystemen: Grundlagen fuer den oekologischen Vergleich von Energiesystemen und den Einbezug von Energiesystemen in Oekobilanzen fuer die Schweiz. Paul Scherrer Institut Villigen, Swiss Centre for Life Cycle Inventories, Duebendorf, CH.
Dones, R., H. Heck, M. Emmenegger, and N. Jungbluth. 2005. Life cycle inventories for the nuclear and natural gas energy systems and example of uncertainty analysis. International Journal of Life Cycle Analyses 10(1):10-23.
EIA (Energy Information Administration). 2007. Domestic Uranium Production Report (2003-2007). Form EIA-851A.
Energy and Environmental Economics, Inc. 2008. CPUC GHG Modeling Stage 1 Documentation. Attachment B. San Francisco, Calif. Available at http://www.ethree.com/GHG/R0604009_Attachment_B_v2.pdf.
Entergy. 2007. Entergy letter to USNRC of February 28, 2007, forwarding Annual Radioactive Effluent Report for 2006 Arkansas Nuclear One–Units 1 and 2, Docket Nos. 50-313, 50-368, and 72.13(IFSI). License Nos. DPR-51 and NPF-6.
EPRI (Electric Power Research Institute). 1992. Advanced Light Water Reactor Utility Requirements Document. EPRI NP-6780-L. Palo Alto, Calif.
EPRI. 2002. Water and Sustainability (Volume 3): U.S. Water Consumption for Power Production—the Next Half Century. Palo Alto, Calif.
EPRI. 2005. Maine Yankee Decommissioning Experience Report: Detailed Experiences 1997–2004. Palo Alto, Calif.
EPRI. 2008. Technology Assessment Guide for Central Station Power. Palo Alto, Calif.
ExternE 1998. ExternE: Externalities of Energy. Published by European Commission, Directorate-General XII, Science Research and Development. Office for Official Publications of the European Communities, L-2920 Luxembourg. Results are also available at http://www.externe.info/.
Forsberg, C., P. Peterson, and L. Ott. 2004. The Advanced High-Temperature Reactor (AHTR) for Producing Hydrogen to Manufacture Liquid Fuels. Available at www.ornl.gov/~webworks/cppr/y2001/pres/121482.pdf.
Fthenakis and Kim 2007. Greenhouse-gas emissions from solar electric- and nuclear power: A life-cycle study. Energy Policy 35:2549-2557.
Gary, James H., Glenn E. Handwerk, and Mark J. Kaiser. 2007. Petroleum Refining: Technology and Economics. Fifth Edition. New York: Taylor and Francis Group, LLC.
GIF/NERAC (Generation IV International Forum/U.S. Department of Energy Nuclear Energy Research Advisory Committee). 2005. A Technology Roadmap for Generation IV Nuclear Energy Systems. GIF-002-00. Washington, D.C. Available at gif.inel.gov/roadmap/pdfs/gen_iv_roadmap.pdf.
Harding, J. 2007. Economics of Nuclear Power and Proliferation Risks in a Carbon-Constrained World. Electricity Journal 20(10):65-76.
Hondo, H. 2005. Life cycle GHG emission analysis of power generation systems: Japanese case. Energy 30:2042-2056.
IAEA (International Atomic Energy Agency). 2005. Thorium Fuel Cycle—Potential Benefits and Challenges. IAEA-TECDOC-1450. Vienna, Austria. Available at //www-pub.iaea.org/MTCD/publications/PDF/TE_1450_web.pdf.
IAEA. 2007. Milestones in the Development of a National Infrastructure for Nuclear Power. NG-G-3.1 2007. Vienna, Austria.
IAEA. 2008. Nuclear Power Reactors in the World. Vienna, Austria.
IEA (International Energy Agency). 2002. Innovative Nuclear Reactor Development, Opportunities for International Co-operation. Paris, France.
Ivanov, V. 2008. Overview of the Russian sodium-cooled fast reactor program. Presentation to the AEF Committee, April.
Jagannathan, V., and U. Pal. 2008. Towards an intrinsically safe and economic thorium breeder reactor. Energy Conversion and Management 47(17):2781-2793.
Johnson, Michael. 2008. US Nuclear Regulatory Commission activities on licensing of new reactors. Presentation to the National Academies’ Board on Energy and Environmental Systems, Washington, D.C., December.
Kazimi, M.S. 2003. Thorium fuel for nuclear energy—An unconventional tactic might one day ease concerns that spent fuel could be used to make a bomb. American Scientist 91:408-415.
Kazimi, M.S., and P. Hejzlar. 2005. High Performance Fuel Design for Next Generation PWRs: 4th Annual Report. Cambridge, Mass.
Keystone Center. 2007. Nuclear Power Joint Fact-Finding. Keystone, Colo.
Lisowski, P. 2008. US DOE, Reactor design and fuel cycle choices. Presentation to the AEF Committee, Washington, D.C., April.
Lochbaum, D. 2006. Walking a Nuclear Tightrope: Unlearned Lessons of Year-plus Reactor Outages. Union of Concerned Scientists, Cambridge, Mass. Available at www.ucsusa.org/assets/documents/nuclear-power/nuclear_tightrope_report_hires.pdf.
Maldague, T., S. Pilate, A. Renard, A. Harislur, H. Mouney, and M. Rome. 1998. Recycling Schemes of Americium Targets in PWR/MOX Cores. Proceedings of the Fifth OECD/NEA Meeting on Actinides and Fission Product Partitioning and Transmutation, Mol, Belgium. Available at www.nea.fr/html/trw/docs/mol98/session4/SIVpaper3.pdf.
Matzie, Regis A., 2008. AP1000 nuclear power plant. Presentation at the MIT Nuclear Plant Safety Course, Cambridge, Mass.
MIT (Massachusetts Institute of Technology). 2003. The Future of Nuclear Power. Cambridge, Mass. Available at web.mit.edu/nuclearpower/.
MIT. 2009. Update of the MIT 2003 Future of Nuclear Power. Cambridge, Mass. Available at web.mit.edu/nuclearpower/pdf/nuclearpower-update2009.pdf.
Moody’s Investor’s Service. 2007. New Nuclear Generation in the United States. New York, N.Y.
Moody’s Investor’s Service. 2008. New Nuclear Generating Capacity: Potential Credit Implications for U.S. Investor Owned Utilities. New York, N.Y.
Moorhouse, Jeremy, and Bruce Peachey. 2007. Cogeneration and the Alberta oil sands—cogeneration benefits are maximized with extraction and upgrading integration. Cogeneration and On-Site Power Production 8(4; July).
NEI (Nuclear Energy Institute) 2008. New generating capacity costs in perspective. White paper. Washington, D.C.
Newcomer, A., S. Blumsack, J. Apt, L. Lave, and M.G. Morgan. 2008. Short-run effects of a price on carbon dioxide emissions for U.S. electric generators. Environmental Science and Technology 42(9):3139-3144.
NRC (National Research Council). 1995. Technical Bases for Yucca Mountain Standards. Washington, D.C.: National Academy Press.
NRC. 2001. Disposition of High-Level Waste and Spent Nuclear Fuel: The Continuing Societal and Technical Challenges. Washington, D.C.: National Academy Press.
NRC. 2006. Safety and Security of Commercial Spent Nuclear Fuel Storage. Washington, D.C.: The National Academies Press.
NRC. 2008. Review of DOE’s Nuclear Research and Development Program. Washington, D.C.: The National Academies Press.
NREL (National Renewable Energy Laboratory). 2001. Life Cycle Assessment of Hydrogen Production via Natural Gas Steam Reforming. NREL/TP-570-27637. Golden, Colo.
OECD/NEA (Organisation for Economic Co-operation and Development/Nuclear Energy Agency). 2007. Uranium 2007: Resources, Production, and Demand. Paris, France.
OECD/NEA. 2008. Nuclear Energy Outlook. Paris, France.
Parece, Martin. 2008. U.S. EPR overview. Presentation to the MIT Nuclear Plant Safety Course, Cambridge, Mass.
Pederson, T. 1998. BWR 90—the advanced BWR of the 1990s. Nuclear Engineering and Design 180(1; March):53-66.
Pelton, Tom. 2007. Nuclear power has new shape. Baltimore Sun, December 25.
PSEG (Public Service Enterprise Group). 2007. Letter to the USNRC dated April 26, 2007, transmitting 2006 radioactive effluent release report for Hope Creek Generating Station. Facility Operating License No. NPF-57, Docket No. 50-34.
Radkowsky, A. 1999. Using thorium in a commercial nuclear fuel cycle: How to do it. Nuclear Engineering International (January 8). Available at www.neimagazine.com/story.asp?storycode=1000169.
Scroggs, S. 2008. COLA (Combined License Application Content) Engineering Evaluation of Current Technology Options for New Nuclear Power Generation. Testimony before Florida Public Service Commission. Docket No. 070650.
Sheron, B. 2008. Technical issues in nuclear reactor regulation. Presentation at the MIT Nuclear Plant Safety Course, Cambridge, Mass.
Smith, Craig F., William G. Halsey, Neil W. Brown, James J. Sienicki, Anton Moisseytsev, and David C. Wade. 2008. SSTAR: The US lead-cooled fast reactor (LFR). Journal of Nuclear Materials 376(3):255-259.
S&P (Standard and Poor’s) 2008. Update on the the U.S. Dept. of Energy Loan Guarantee Program and Standard and Poor’s Rating Considerations. October 7. New York, N.Y.
Storm van Leeuwen, J.W., and P. Smith. 2007. Nuclear Power: The Energy Balance. Available at www.stormsmith.nl.
Tokimatsu, K., T. Kosugi, T. Asami, E. Williams, and Y. Kaya. 2006. Evaluation of lifecycle CO2 emissions from Japanese electric power sector. Energy Policy 34:833-852.
Turnage, Joe. 2008. New nuclear development: Part of the strategy for a lower carbon energy future. Presentation to Center for Strategic and International Studies, July 31.
TVA (Tennessee Valley Authority). 2005. ABWR Cost/Schedule/COL Project at TVA’s Bellefonte Site. DE-AI07-04ID14620. Available at ne.doe.gov/np2010/reports/mainreportA115.pdf..
UCS (Union of Concerned Scientists). 2008. Nuclear Power in a Warming World: Assessing the Risks, Addressing the Challenges. Cambridge, Mass.
University of Chicago. 2004. The Economic Future of Nuclear Power. Chicago, Ill.
USNRC (U.S. Nuclear Regulatory Commission). 1975. Wash-1400 NUREG-74/014 Reactor Safety Study. October. Washington, D.C.
USNRC. 2008. Information Digest 2007-2008. NUREG-1350, Vol. 19. Washington, D.C. Available at www.nrc.gov/reading-rm/doc-collections/nuregs/staff/sr1350/v19/sr1350v19.pdf. Accessed June 7, 2009.
Vattenfall, A.B., 2005. Vattenfall AB Generation Nordic Countries Certified Environmental Product Declaration of Electricity from Ringhals NPP. Available at www.vattenfall.com/www/vf_com/vf_com/Gemeinsame_Inhalte/DOCUMENT/360168vatt/386246envi/2005-EPD-Ringhals.pdf.
Veil, J.A. 2007. Use of Reclaimed Water for Power Plant Cooling, Report No. ANL/EVS/R-07/3, Argonne National Laboratory; Use of Degraded Water Sources as Cooling Water in Power Plants, Report No. 1005359. Palo Alto, Calif.: EPRI.
Westinghouse. 2006. Westinghouse World View. Issue 2. Pittsburgh, Pa.
White, S.W. 1998. Net Energy Payback and CO2 Emissions from Helium-3 Fusion and Wind Electrical Power Plants. Ph.D. dissertation. University of Wisconsin-Madison.


