
E
Supplemental Information on Land-Use Externalities from Biofuels: A Case Study of the Boone River Watershed
The committee uses the erosion productivity impact calculator (EPIC) model in conjunction with detailed field-level data for the Boone River Watershed to evaluate a number of “scenarios” where each scenario is associated with a different possible land use constituting different crops grown and different management practices on the land. To begin, a baseline land use corresponding to the 2005 cropping pattern and land management is developed, and an estimate of the externalities associated with the baseline is made. Then, various alternative land uses are proposed and evaluated using EPIC to predict the amount of nitrogen, phosphorous, sediments exported from each field as well as the amount of carbon sequestered. These levels can be aggregated to the watershed level and compared with the baseline. We also compute the amount of biofuels that the new land use can produce so that the externalities can be considered relative to the amount of acreage used to grow the feedstock or to the amount of fuel produced or both. Finally, using values from the literature, we monetize the externality end points.
The land-use conditions we evaluate include a baseline that represents 2005 cropping patterns and land use and the following counterfactual scenarios:
-
Continuous corn: The existing corn acreage that rotates with soybeans is converted to continuous corn—a change to about 90% of the acreage. As there is very little Conservation Reserve Program land or idle land in this watershed, this change is the main way in which planting decisions in this watershed can respond to increased demand for corn usage via ethanol.
-
Corn stover: The stover is removed from the baseline acreage and used to produce ethanol. We consider three possible rates of removal: 50%, 80%, and 100%.
-
Continuous corn and corn stover: This scenario is a combination of the first two; all corn and soybean rotations are changed to continuous corn, and then stover removals of 50%, 80%, and 100% are simulated.
-
Switchgrass: Switchgrass acreage is randomly placed on the baseline acreage from the baseline in percentages of 25%, 50%, 75% and, on the complete watershed, 100%. A nitrogen fertilizer rate of 123 kg/ha was simulated for the switchgrass, a rate consistent with optimal rates reported by Vogel et al. (2002) and Heggenstaller et al. (2009) for Iowa switchgrass biofuel production.
Our analysis draws heavily from the model and data sources developed by Gassman (2008), and we refer the interested reader to that document for substantially greater details on the data sources, collection methods, and assumptions. Here, we outline the basics of the model and summarize the externality estimates from the model. The Boone River Watershed covers over 500,000 acres in north central Iowa. Figure E-1 shows its location along with the Upper Mississippi River Basin and the state. The watershed is dominated by corn and soybean production, which together account for nearly 90% of its land use. The watershed is also characterized by intensive livestock production; land-applied manure from these livestock operations and commercial fertilizer applications are the primary sources of nutrients to the watershed stream system. However, manure applications were not accounted for in these simulations.
A key source of land-use data for the Boone simulations is a field-level survey of cropping patterns and conservation practices undertaken by C. Kiepe, formerly with the USDA-Natural Resources Conservation Service, who visually inspected all the fields (common land units) in the Boone watershed during the spring of 2005. These highly detailed spatially explicit data provide the basic information to populate the EPIC model. Table E-1 summarizes the cropping pattern observed: The region is almost entirely in a 1-year rotation of corn and soybeans. A few acres are in continuous corn or pasture, and a few are enrolled in the Conservation Reserve Program and are planted in a perennial cover. Additional data sources include soils information from the Soil Survey Geographic Database and the Iowa Soil Properties and Interpretations Database, climate data from NOAA and the Iowa Environmental Mesonet, topographic information from the Iowa Digital Elevation Model, and livestock operations from the Iowa Department of Natural Resources. Extensive additional details on these and other data sources used to populate the model can be found in Gassman (2008).
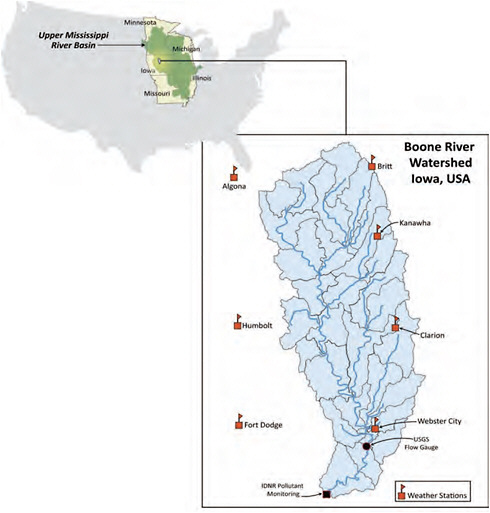
FIGURE E-1 The Boone River Watershed.
TABLE E-1 Boone River Watershed Baseline Cropping Pattern
|
|
Acres |
Percent of Watershed |
|
Corn-soybean rotation |
474,000 |
89 |
|
Continuous corn rotation |
21,000 |
4 |
|
Pasture |
16,000 |
3 |
|
Conservation Reserve Program |
13,000 |
2 |
|
Other (mixture of other rotations and alfalfa) |
9 |
<1 |
|
Total |
533,000 |
100 |
REFERENCES
Gassman, P.W. 2008. A Simulation Assessment of the Boone River Watershed: Baseline Calibration/Validation Results and Issues, and Future Research Needs. Ph.D. Thesis, Iowa State University, Ames, IA.
Heggenstaller, A.H., K.J. Moore, M. Liebman, and R.P. Anex. 2009. Nitrogen influences productivity and resource partitioning by perennial, warm-season grasses. Agron. J. 101(6):1363-1371.
Vogel, K.P., J.J. Brejda, D.T. Walters, and D.R. Buxton. 2002. Switchgrass biomass production in the Midwest USA: Harvest and nitrogen management. Agron. J. 94(3):413-420.


