
6
Linking Population Health to the Array of Health Inputs
Throughout this report, we have described conceptual issues that must be resolved in order to move forward on the production of an experimental national health account—or at least a well-organized national health data system—and to improve the medical care components of the standard economic accounts. A fully developed health data system would coordinate (1) detailed and comprehensive data covering the nation’s expenditures on, and utilization of, medical care, organized in such a way that prices and quantities of meaningfully defined units of production and consumption can be measured; (2) data that allow the nation’s health to be tracked along a number of dimensions; (3) data for monitoring non-medical factors affecting the population’s health; and (4) research results that attribute changes in the population’s health to changes in spending (of money and time) on medical care and other health-affecting goods, services, and activities.
Chapters 1 through 4 focused mainly on topic (1), which involves identifying, quantifying, and valuing the outputs of medical care—organized around the treatments of specific medical conditions—that are inputs to health. In addition, while medical care is focused mainly on treatment, some spending is targeted toward disease prevention, and many other factors determine the incidence of disease. In Chapters 2 and 3, we describe how satellite health accounts might be structured and identify the first steps in their construction—defining the units of measurement for medical care and estimating economy-wide expenditures on those units. These are tasks that the Bureau of Economic Analysis (BEA) is working on now and presumably will be for some time.
Chapter 5 focused on (2) and touched on (3), by first defining measures of current population health in a way that reflects both mortality and quality of life. They can be conceptualized jointly as quality-adjusted life expectancy and
expressed either in years or dollars (Murphy and Topel, 2006). In addition, we discussed briefly how the risk factors that predict future health might bechosen and collected. In the health account, we proposed expressing health outcomes in both natural and monetary units. Monetary valuation of health is difficult: even when the provision of medical care involves prices (although often ones that do not closely reflect cost), some inputs, such as volunteer labor for the chronically ill, do not. Also, nonmedical nonmarket inputs include time invested in one’s own health (for example, exercise and sleep) or in a relative’s health, and such activities often have additional goals besides future health, which complicates evaluation.
A comprehensive—and at this point admittedly futuristic—health account would also attempt to incorporate topic (4). It would not only identify, quantify, and value the flow of nonmedical health inputs, such as behavior trends (e.g., diet, risk taking, smoking, consumption of alcohol), research and development, and the quality of the environment; it would relate both these and medical inputs to current and future population health. While emphasizing the value in monitoring both inputs and outcomes, we have been largely agnostic on exactly how researchers go about the task of quantifying causal links between medical care, health-enhancing activities, and other inputs to the population’s health through disease modeling. This is a difficult area of inquiry, both conceptually and in terms of data requirements, that is being pursued in leading-edge research taking place across many institutions, primarily on a disease-by-disease basis; it is the type of work that BEA will probably never do. That said, results from this research could eventually be used to enhance the usefulness of a national health account that the statistical agencies play a role in constructing. While it is beyond the scope of this study to offer detailed recommendations on this academic research, in this chapter we review some of the ongoing work, offer some general guidance for U.S. efforts going forward, and describe how a national health account would provide a useful centralized data depository from which investigators could draw and into which results may feed.
Much of this chapter is concerned with developing a data system that would allow changes in the population’s health (death and impairment) to be linked to changes in spending on medical care and other factors. While the panel is skeptical about how well, at least in the short run, outcomes can be linked to medical expenditures and other factors, we strongly recommend beginning the process of gathering data in a way that improves the ability of researchers and policy makers to draw causal inferences. Creating and pooling electronic health records (discussed more below) would seem to be a prerequisite on which to focus this line of development.
6.1.
ATTRIBUTION OF HEALTH EFFECTS TO INPUTS
As discussed in Chapter 2, a major policy issue motivating research on the topic of this report is how to gauge the productivity of the medical care system,
which provides one rationale for beginning there. For this purpose, it is important that investigators have data that allow them to attribute population health effects to factors that work separately or interactively with medical care. It is advisable to begin by trying to do the medical part well, but elements included in a broader boundary of health goods, services, and activities become more important when trying to determine causality for outcomes.
There are many ways of linking medical care and other inputs to health. One is through a standard medical trial of certain inputs or interventions (e.g., diet counseling), looking at the effect of treatment on a primary outcome in which the investigator attempts to keep other factors determining the outcome constant by standardizing patients and treatment and using randomization. Another approach is the one discussed in Chapter 3, whereby econometric methods are applied on national data over time on multiple inputs and health outcomes, together with clinical insights, disease modeling, and common sense to figure out what is causing what. Intermediate approaches include epidemiological studies using specialized panel data sets such as Framingham or Surveillance, Epidemiology, and End Results (a registry of the National Cancer Institute). These specialized data sets become more useful when information from patient claims have been linked to them. Despite the problems with trials (e.g., cost, delay, external validity), we certainly support the paradigm but want to open up the possibility of using other approaches for developing data linking medical treatment and other inputs to health outcomes. Improved data on expenditures, prevalence, and death that are classified by disease will be useful for other research projects as well. They may be used for constructing comparisons over time or across countries, regions, or subpopulations in terms of burden.
Whatever methods are pursued, a system for attribution entails more than just collecting data on the multitude of factors that affect population health. Such a data system is merely a tool to help researchers working in this field. While data on high blood pressure and other personal risk factors should be collected and presented, attribution is very difficult for a number of reasons—perhaps one can say that lower hypertension will lead to fewer deaths, but overall mortality is based on many things that occur in the past, present, and future.
The problem is most severe when the objective is to attribute outcomes to services or causes; in many cases, the medical linkages are not known or well understood. For example, in the United States (and many other countries), functional limitations in the elderly will be much more important in the coming years, simply because of the demographic shift. Mobility impairments tend to be the result of multiple medical conditions, some of which are not ordinarily thought of as diseases. Arthritis (most commonly osteoarthritis, but sometimes cartilage problems, rheumatoid arthritis, or other conditions) is usually a component. Poor balance and impaired proprioception may also be important, and these may be the result of strokes or simply “aging,” meaning that there is some neurological problem but no known disease that caused it. Projecting the effects of, for example,
joint replacement may be difficult because the underlying arthritis is only one of the causes of the mobility impairment. In other words, there is not a one-to-one correspondence between the functional limitation and a disease. So the boundary and attributional issues are likely to become even greater challenges.
Even when the change in a person’s health state can be attributed to one condition—say a chronic disease—defining an episode can be difficult. Furthermore, for an elderly population with multiple chronic diseases, the determination of a primary diagnosis for a hospitalization can be somewhat arbitrary. Someone may truly be admitted because of an exacerbation of heart failure, but he or she might have needed hospitalization only because of impairment from other conditions; otherwise, he or she might have been treated on an outpatient basis.
Ideally, the complementary surveys collecting quality of life data (discussed in Chapter 5) could be better coordinated with common survey questions identified to get at nonmedical care inputs measured consistently over time. It would be valuable to assemble aggregate data on all the conceivable determinants of health in some researcher-accessible location. Depending on what kind of method will be used for attribution, very aggregate data may suffice (over time or across countries). The national health account program could begin accumulating data on time use (particularly in preventive activities), consumption trends, other risk factors, behavioral trends, the environment, etc. Even before these data are integrated into a health account, such a data clearinghouse would give researchers attempting to link cause and effect a starting place. Such a data system will be in a constant state of evolution.
With better data or understanding of causes, data components could be expanded incrementally and coordinated, and, indeed, the determinants of a population’s health will change over time, in terms of both the set of relevant factors and the impact of each. Environmental factors are notoriously difficult to pin down, since, even if measures like ambient air and water pollutants at a given site over time are available, it is hard to determine an individual’s location at all times to derive exposure values. This is also a problem for occupational exposures. It will be a big step to develop more robust data sources on personal factors like blood pressure, total cholesterol, and the glomerular filtration rate; however, their determinants (e.g., diet, air pollution exposure) involve physical or laboratory measurements, and it would be a huge undertaking to add these to surveys. That said, the Health and Retirement Study (HRS) undertakes similar tasks that can serve as a model for learning more about experience with, and the cost of, such additions.
6.2.
MEDICAL CARE EXPENDITURES AND HEALTH
The idea of a data system that coordinates information about medical spending, health outcomes, and the population’s quality and length of life may be relatively new in the United States, but efforts internationally trace back further.
Statistical agencies in all developed countries—including the United States—produce at least some components of a national health account, since all calculate total medical spending, and many perform cost-of-illness analyses (Heijink et al., 2008). Several countries have gone further, measuring health trends in addition to expenditures with the objective of facilitating disease-by-disease comparisons. In this section, we do not add to the extensive discussion from Chapters 1-4 of the medical care input to health; we only identify a sampling of efforts that have been made by government agencies to begin establishing linkages between medical expenditures and health.
Statistics Canada, the country’s statistical agency, has been experimenting with health measurement since the early 1990s. The agency has adopted the Health Utilities Index Mark 3 (HUI3) health assessment tool (see Chapter 5) and has incorporated it as a permanent component in its National Population Health Survey (Statistics Canada, 2007). Using these surveys, the government reports health-adjusted life expectancy at birth and at age 65, stratified by gender, province, and income group. The HUI3 has also been used by the agency to estimate trends in the health impact of various diseases. At the same time, the Canadian Institute for Health Information maintains the National Health Expenditure database, which tracks annual medical spending in the country (Canadian Institute for Health Information, 2006). Expenditure estimates are reported separately for over 40 disease categories, 5 payer sources, and for each province. These two agencies have joined together to publish national estimates of the economic burden of illness for the years 1987, 1993, and 1998 (Health Canada, 1998). For each of 20 disease categories, these studies report direct costs (hospital, physician, drugs, research, institutional, other) and indirect costs (premature mortality, long-term disability, and short-term disability), stratified by province, age, and gender. Over the decade, these studies have been enhanced by methodological refinements and by collection of more detailed data.
The Australian Institute of Health and Welfare divides medical spending for the country into 176 disease categories in such a way that accounts for 94 percent of medical spending. Expenditure data are available by age, sex, and service category (though not for every year). The accounts have been linked to population health data from Australia’s Burden of Disease and Injury Study (Mathers, Vos, and Stevenson, 1999). Investigators from this study used methods similar to those of the Global Burden of Disease Study (Murray and Lopez, 2006) to estimate the health of the Australian population in 1996 and 2003. Efforts are now under way to estimate the returns to medical spending for each disease category.
The motivation for much of this work is to improve the productivity of health care systems—that is, to:
-
Produce outputs of health services with a minimum of real resources (technical efficiency) at each level of care, while also minimizing the (relative) costs of inputs (cost efficiency).
-
Provide a mix of care that maximizes impact on health outcomes at a minimum input cost (cost effectiveness).
-
Set overall resources for health care consistent with achieving wider goals of social welfare and to allocate services across individuals at levels that make the best use of these resources (efficiency and equity in resource allocation).
Technical or cost efficiency can be high if a given set of medical activities—or outputs—are produced with a limited amount of inputs (see Figure 6-1). However, if the impact on health status is limited, little social value is obtained from these outputs. This is why the medical community focuses more on cost-effectiveness as it provides a measure of the actual health returns to spending (Gold, 1996).
There are a number of challenges to establishing health outcomes as the standard in the actual practice of system evaluation. First, for some interventions, it can take a long period of time before they have any significant effect on health. Second, there are not always demonstrated links between interventions and health. For example, available data may show an impact only on behaviors that affect health. Alternatively, the data may show no impact at all, and frequently there are simply no data on the effects of an intervention. Finally, when data do exist, the data collection and surveillance systems may not provide the level of detail necessary to measure desired changes in health. The goal, then, is to strike an appropriate balance between intermediate output measures and longer term health outcomes. The challenge is in defining those outputs and in gaining access to sufficient data to measure both prices and quantities.
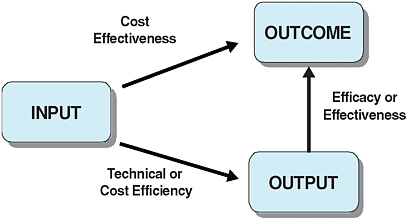
FIGURE 6-1 From inputs to outcomes.
SOURCE: Adapted from Joumard and Häkkinen (2007, p. 12).
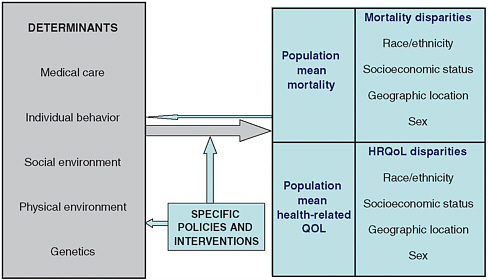
FIGURE 6-2 A schematic framework for population health planning.
NOTES: HRQoL = health-related quality of life. QOL = quality of life.
SOURCE: Kindig, Asada, and Booskie (2008). Reprinted with permission.
6.3.
NONMEDICAL AND NONMARKET INPUTS TO HEALTH
Chapter 2 lays out, in general terms, the structure of an accounting system that includes, on one side, data on the inputs to health and, on the other, data on the output, defined as population health. Beyond the Market (National Research Council, 2005) describes a similar structure. Figure 6-2 summarizes the basic elements of this relationship. Generating the data and specific accounting structure needed to quantify these relationships is a much more difficult task. Complicating the goal of establishing links between inputs to health and health itself (and even just figuring out which kinds of data to collect to inform the task) is that, as shown in the figure, health is a function of much more than just medical care.1
Population health, measured in terms of life expectancy or more subtle quality of life metrics (discussed in Chapter 5), is mediated largely by such factors as personal behaviors (e.g., sedentary lifestyle, smoking), environmental exposures, and public health measures that transpire outside the medical care setting. While health policy gives some attention to public health issues, it deals little with the social context of life, which can exert profound influences on health (Woolf, 2009). Dramatic disparities affect poor and minority populations, who endure poorer health and on average die younger than more affluent groups.
While social determinants such as education, income, and race are clearly interrelated, they exert independent effects on health as well (Robert Wood Johnson Foundation, 2008). A full explanation of changes in population health requires information on multiple aspects of the social context. Furthermore, if health consequences arising from social policies originating outside the health care sector are to be monitored, data collection in less traditional settings—such as schools and community recreation centers—will eventually be needed.
Solving the nation’s most pressing health care problems, then, will require a greater understanding of the full range of the factors that determine health and of their complex interrelationships. It is increasingly recognized that the most urgent public health challenges cannot be adequately addressed within a single discipline but instead require a more comprehensive approach. Kindig sets forth a schematic framework for population health planning—on which Figure 6-2 is based—that provides a preview of both data collection and the cross-disciplinary expertise needed for developing a health account (Kindig, Asada, and Booske, 2008).
Perhaps the most important message conveyed by this framework is that population averages can be deceiving. Mean mortality or health-related quality of life measures mask real disparities in outcomes—disparities that can be identified only with adequate data (compiled at a sufficiently disaggregated level) on the social determinants of health. Kindig divides these determinants into five categories based on the Evans-Stoddart model (1990)—(1) medical care, (2) individual behavior, (3) social environment, (4) physical environment, and (5) genetics—to which one might add age, gender, and medical history; this top-level organizational structure may be a good place to start when specifying needs for a national health data system. While some population surveys in the United States (such as National Health and Nutrition Examination Survey [NHANES] or HRS) are a good source of nonmedical health data, ultimately data on determinants of health will need to come from multiple sources as there are many other variables—safe sex practices, occupational and geographic exposures, the physical environment, and others (many of which can be very difficult to measure)—that are not covered in any single survey.
6.3.1.
Valuing Informal Care and Other Time Costs
As emphasized above, a comprehensive health account requires tracking the full range of factors that affect health, even if they do not entail market transactions. Indeed, not even all medical service inputs are reimbursed. Many of the quantitatively significant influences on health—some relating to medical care and some not—can be linked to the way in which the population spends its time. A population that spends time actively, in physical exercise, for example, will be healthier than an otherwise similar sedentary one. Another example of a nonmarket cost is waiting time—time spent in physicians’ offices or hospitals waiting for care to be provided.
The most quantitatively significant of these services is care provided by relatives. The amount of quality-adjusted time that people spend caring for the ill should be positively related to the health outcomes of the ill person (although, frequently, it is negatively related to the health outcomes of the caregiver). Unlike formal home health care, unpaid caregiving is not included in the National Health Expenditure Accounts (NHEAs). As a result, NHEAs understate total resource use in the care of the ill (or the very old or very young, for that matter, which may also affect health). Furthermore, there is a bias in estimates of the growth in resource use over time, depending on whether informal care is rising or falling relative to market care. The issue is analogous to the treatment of home production in the National Income and Product Accounts. Market-purchased services (paying a laundromat, going to a restaurant) are counted as part of gross domestic product (GDP); home production (doing the laundry at home, cooking at home) is not. As a higher percentage of women have entered formal labor markets over recent decades, and more services previously provided at home are now purchased, estimates of GDP growth could in theory exceed actual increases in valued economic activity due to the displacement of home production.
Almost all analysts of national income accounting—including those who produced the report Beyond the Market (National Research Council, 2005)—argue that nonmarket activities that are very close substitutes for market counterparts ought to be included in at least some version of GDP. Indeed, the same study states (Recommendation 6.3) that, ideally, estimates of the value of nonmarket medical care inputs, including time use, ought to be included in national health accounts. Time spent providing health-related services would be valued based on a replacement labor-cost approach; time spent in activities that improve or maintain one’s own health would be valued using an opportunity-cost approach (see National Research Council, 2005, pp. 127-130, for a full discussion of this rationale). These estimates may be small initially because of inadequate data on many aspects of time use, but this will challenge statistical agencies and researchers to call for improved data. Indeed, one reason for including these inputs in an account is that the value of time resources expended could be quite large relative to the value of market-provided services, particularly in such areas as elder and child care (LaPlante et al., 2002). Rules will have to be established dictating exactly what kind of time expenditures should be included.
Work to quantify the amount and value of time inputs to health will be constrained for the foreseeable future by data availability, although the survey options are growing. For example, data on various components of informal care provision are available in currently conducted surveys. The HRS asks respondents to report activities of daily living—such as ambulating (walking), transferring (getting up from a chair), dressing, eating and drinking, performing personal hygiene, taking medication—or instrumental activities of daily living—such as driving, preparing meals, doing housework, shopping, managing finances and medications, and using the telephone.
Ideally, because of the disease-organized framework that we recommend, time-use data would be linkable to specific diagnoses. At this point, the American Time Use Survey (ATUS) does not offer this, although this is certainly a modification that is possible. For example, this was done in the RAND Health Insurance Experiment, in which doctors were asked to link the procedures, tests, and drugs prescribed to a diagnosis on the form.2 Additionally, the HRS could provide time-use information for older populations; however, very few data are available for children, so time spent in care of such conditions as autism would be underestimated. Other possibilities could, with further development, provide additional information: the Medical Expenditure Panel Survey (MEPS) indicates why children see doctors (e.g., their condition), and the ATUS indicates the amount of time parents spend in relevant activities. MEPS would be useful for tracking time spent in care of the chronically ill (see Box 6-1).3
6.3.2.
More Boundary Issues for a Health Account
When considering the nonmarket and nonmedical contributions to population health, boundary issues (and interaction with market accounts related to other areas of economic activity) become important. Due to its close proximity to market-provided medical care, a factor such as unpaid time spent caring for an ill person, discussed above, is likely to be in scope, as might be the costs and benefits of a (nonmedical) program designed to reduce the population’s intake of foods high in saturated fats. But where should the line of inclusion be drawn? For example, education improves health, but where does its production get classified in a fully integrated satellite accounting structure? And if the spending on education inputs does not get included in the account, should the health benefits (assuming they could be isolated) be included? Probably not, but there is no obviously correct answer here. Beyond the Market points out that, at least initially during early development, there will inevitably be overlap of nonmarket accounts that cover such areas as home production, education, health, and the environment. The values from these accounts would not add up to a meaningful total, but that may be necessary for the foreseeable future given the time it would take to
|
BOX 6-1 Difficult Issues in Time Use Accounting A major research topic is how various time inputs into health should ultimately be counted and valued. For example, it is not clear that time spent by caregivers and time spent on one’s own health—for example, by patients waiting for service or actually in treatment or recovery—should be treated identically. Unlike unpaid time spent in caregiving activities (which has a market replacement value and should in general improve the health of the patient), time spent on some other activities cannot properly be called a “good.” For caregiving time, more is better from the point of view of the recipient (holding incidence of illness constant), so each hour spent in the activity is assigned a “wage” that adds value to the account totals (see National Research Council, 2005, Recommendation 6.4). It is intuitive, in aggregating inputs to health, to assign a positive value to a population’s time spent in health-improving activities, such as nursing an ill person or on the treadmill to improve one’s own cardiovascular health. If such nonmarket elements were left out of an economic account, either a larger share of the improved health would be incorrectly attributed to market inputs or there would be a bigger residual reflecting a health “profit” of sorts. In contrast, valuation is different for such inputs as time spent waiting in doctor’s offices or time required for recovery from a procedure, for which it would make little sense to simply multiply the quantity of these hours by the patient’s wage rate. While these time requirements are certainly inputs in the production function for health, adding them to the account as a positive would create the counterintuitive outcome whereby if a new method of treatment (or a new patient appointment system) were introduced that increased recovery time or waiting time (with no better outcomes), it would increase the total value captured in the account. One could think of these things as a downward quality change that, in principle, should be captured in the price index. At this point, we only raise these issues—they clearly need to be given more attention. In practice, none of this matters too much yet, since this dimension of an experimental account is so far off, but it is important to get the concept right early on. |
develop accounts in all areas for which they could productively exist. That said, in an experimental context, work on a health account should aspire as a long-term goal to include data on the value of all inputs—medical care and otherwise, market transacted and not—associated with the output (improved health).
So how should a health accounting program begin the process of prioritizing which health-affecting factors to track from the practically endless list? One conceptual approach, identified earlier, is to begin with health inputs that are closest to the medical care system, specifically with treatment of diseases, and gradually move outward to the proximate determinants of disease, such as obesity, pollution, smoking and tobacco, illegal drugs, and possibly their determinants, such as eating and exercise.
6.4.
DISEASE MODELING
Developing national health data in a way that informs resource allocation policies by allowing researchers to causally link medical care and other spending to health improvements is a great methodological (and data) challenge. We have argued that attribution of health effects to spending is most straightforward in a disease or episode context, which suggests a certain modeling approach. Detailed disease models—which estimate interactions among risk factors, specific diseases, and health outcomes—allow analysts to infer the value of medical care at that level.4 In principle, one can then aggregate across diseases to estimate the productivity of medical care as a whole. The more detailed the disease models are, the greater is their potential to help identify clear targets for more nuanced policy interventions. A full accounting is a long way off at this point because only scant data exist that would allow modeling the joint distribution of environmental and other factors. Nonetheless, the goal should be to develop detailed disease models that relate health inputs to outputs and that will allow researchers to infer the value of medical care at the disease level so that, when aggregated, it may be possible to estimate the productivity of medical care as a whole (Rosen and Cutler, 2007).
Due to the historically slow accumulation of this research, integrating health expenditure and outcome data is a long-term project. The time-consuming disease modeling required is particularly difficult for such pathologies as hypertension that have future consequences that differ from today’s. The missing link is how to attribute deaths and changes in health in the presence of multiple conditions and sequenced conditions (e.g., depression leading to obesity, leading to heart disease, leading to death). This kind of scientific endeavor is beyond the scope of traditional economic accounting as these relationships must be established in the literature on a case-by-case basis (e.g., Cutler et al., 2001).
In other disciplines (beyond economics and economic accounting) such as decision sciences and industrial engineering, an extensive history of disease modeling has developed. A comprehensive catalogue of such models spanning over 25 years of the medical literature is maintained by a team of investigators at Tufts Medical School as an Internet-based resource (see http://www.tufts-nemc.org/cearegistry/data/default.asp). These range from simple explanatory models of a single therapy for a single disease (for example, antibiotics for childhood ear infections) to broad policy models that consider several services simultaneously
(e.g., the prevention and management of coronary heart disease). However, there is no consistent set of conventions that would allow these models to be merged together to provide a picture of the health care sector as a whole.
The starting point, one that allows for the possibility of using different output metrics, is the specification of a general model of the health care portion of health attribution. For a given level of quality, health care outputs are produced from a set of health care inputs. For any given combination of inputs, however, variation in output can be expected due to differences in patient characteristics (such as comorbid conditions and disease severity) or case mix. Hence, we incorporate case mix into the production function, which can be expressed formally as:
Case-mix measures use administrative data to classify patients, encounters, or other units of output into homogeneous groups with similar expected health services utilization according to characteristics, such as diagnoses, disease severity, demographics, or a combination of these (Smith and Weiner, 1994; Berlowitz, Rosen, and Moskowitz, 1995). The basic principles underlying the development of these groupings—and their usefulness to BEA—are that they should be clinically meaningful, resource homogeneous, limited to a manageable number of groups, and derived from regularly collected data. There are several case-mix measures on the market today, many made for different purposes in different populations (Rosen, 2001; Iezzoni, 2003; McGlynn, 2008). The two main categories of efficiency measures are episode-based and person-based (or population-based). These approaches, as they apply to creating expenditure accounting categories, are described in Chapter 3.
For modeling outcomes associated with expenditures on specific disease treatments, ideally, the episode-of-care approach should be defined by clinical diagnoses (e.g., back pain) and not by the procedures used to treat those diagnoses—especially if there is any question of appropriateness of use. Removing procedure codes from the definition of episodes would likely resolve the issue but the commercial grouper software (discussed in Chapter 3) varies in its reliance on these codes.
A potential drawback to the episode-of-care approach is that it may inadvertently make primary care appear inefficient. For example, chronic diseases such as congestive heart failure and diabetes tend to be lifelong, requiring long-term therapy for patients. Individuals with these chronic diseases may have flare-ups requiring hospitalization (and triggering the start of an acute episode) with no fundamental change in their underlying chronic condition. For these patients, paying for each hospitalization on an episode-of-care basis may help control the costs of each hospitalization, but it does nothing to control the number of episodes (hospitalizations) that the person experiences. While good primary care can prevent acute exacerbations and long-term complications of chronic diseases (Starfield, Shi, and Macinko, 2005), an episode-of-care output measure will not capture these
benefits.5 To offset the ex ante assumption that delivering an episode of care is appropriate, payers’ efficiency measures and BEA price indexes could use national benchmarks to compare both the relative level of efficiency/productivity and the average quantity of episodes (The Leapfrog Group and Bridges to Excellence for Patient Safety, 2004).
A general complication to using episodes of care to categorize expenditures or, indeed, to monitor outcomes is that it applies an acute care conceptual model to an increasingly chronic disease care system, posing problems for the evaluation of the productivity and efficiency of primary care (Siu et al., 2009). For example, if good primary care prevents the complications of diabetes, there will be fewer episodes of diabetes-related acute care (perhaps hospitalizations) and an episode-of-care output measure will not capture these benefits. The function of the health account will be to make these distinctions—to determine what aspects of care are leading to improved (or degraded) health—that differentiate between medical care output (completed treatments) and the welfare that comes from it (improved health).
Person-based measures (discussed in Chapter 3) are more obviously designed to track the health effects for an individual that take place over a defined period of time resulting from the full range of medical treatments and nonmedical factors. Ambulatory care is an area in which the person-based measures have been particularly important for assessing the efficiency of a service. Unlike the hospital setting, in which a discrete episode of care is more readily defined, the variety of providers (e.g., physicians, nurses, physician assistants) and settings (e.g., physician’s offices, community health centers, hospital outpatient clinics)in which primary care is practiced hampers clear definition of discrete ambulatory care episodes (Berlowitz, Rosen, and Moskowitz, 1995; Iezzoni, 1997; Rosen, 2001). Furthermore, even if these episodes were readily defined, it is the ambulatory care nonevents, and even some inpatient events, that may represent a high level of efficiency—the chronic disease complications averted by the provision of good primary care.
6.4.1.
Microsimulation
A key strain of attribution research involves microsimulation models, which are specified at the level of individual decision makers, such as a person, families, or firms. A very large number of disease models have been developed.6 Often,
such models simulate large representative populations of these micro-level entities in order to make inferences that may apply at higher levels of aggregation, such as an entire country. This class of models is distinct from macro models whose explanatory variables already represent aggregated groups. An example of an aggregate explanatory variable is national income.
Certain types of modeling problems are best dealt with using microsimulation, whereas, for others, an aggregate approach is more appropriate. Cost-effectiveness analysis entails the application of explicit quantitative methods to analyze decisions under conditions of uncertainty (Gold et al., 1996; Weinstein et al., 2003). It has grown to be an important policy tool over the last several decades, although the United States has been slower in its adoption within health care than many other industrialized nations (Neumann, 2005; Neumann et al., 2005). Cost-effectiveness analysis is naturally suited to decisions about policies impacting the prevention, diagnosis, and treatment of disease, because data from multiple sources may be integrated into a common framework. These models can take on any of a number of possible structures, ranging from simplified life tables through discrete event simulation and Bayesian belief networks. While it is beyond the scope of this report to recommend one specific modeling approach over another, recent reviews by Spielauer (2007) and Stahl (2008) provide an overview of, and guidance as to how to choose, different simulation modeling methods to apply in the health care context.
While there are many advantages to traditional decision analytic cost-effectiveness analysis, a significant limitation of such analyses is the focus on a particular disease. Many policy interventions impact on multiple disease pathways, affecting costs and benefits in complex ways. An example is an intervention to reduce obesity. Such an intervention would affect multiple disease profiles (e.g., cardiovascular disease, breast cancer, arthritis) and, with that, future survival, quality of life, and costs. Simple cost-effectiveness analyses have a difficult time accounting for the widespread effects of such interventions. One needs an aggregate framework to account for such global impacts. The development of multidisease policy models is complex, however, and often requires several years of work.
The current modeling base, while fragmented, has still allowed considerable progress to be made, but expert opinion is clearly looking forward to a set of techniques or a framework that addresses the full complexity of care delivery and embraces the diversity of the modeling techniques. Since there are difficulties in achieving this, this is clearly an agenda for the future, rather than a statement of a problem solved. Although policy models of individual diseases are quite useful, in the long term, health policy decision makers are likely to be better served by a more integrated model of health—one that includes the multitude of diseases on which resource allocation decisions have effects.
|
of which are described at http://www.epa.gov/ttn/fera/trim_gen.html. The models go from adherence to the standard, to emissions into the air, to the effect of emissions of overall air mix, to human exposure to air, to the effects of the ingested chemical on health. Other pollutants work through different chains. |
6.4.2.
Desired Characteristics for an Integrated Model
A number of features and capabilities desirable in an integrated health policy model can be identified. First, the model should relate to the broadest possible population (i.e., not just subpopulations for which there are more data). Furthermore, the model should serve as a platform to inform a broad range of policy decisions, capture health outcomes and costs at the disease level and over time, provide a sense of the level of uncertainty around particular findings, and be able to incorporate new information on an ongoing basis.
While this may sound straightforward, in practice it is quite complex. The overarching system has multiple complicated, interacting parts. What is needed is an approach capable of capturing the essential interrelationships as well as the feedback dynamics within. As modeling progresses, disease by disease, it will be important to try to impose consistency in terms of how impacts are measured and to develop a uniform system along the lines of what others working in this area (Cutler, Rosen, and Vijan, 2006) are attempting to do.
Recommendation 6.1: A useful next step in the development of disease modeling for use in national health accounts would be to commission methodological research that develops a common language and frame of reference from which to start. A funding agency such as the National Institutes of Health or the National Science Foundation should consider supporting research to evaluate the merits and limitations of existing models for use in a variety of contexts, including national health accounting.
As part of this research, it will be important to remember that models require both a coherent theory of the natural history of the health condition and evidence regarding causal linkages among key variables. This points to the need for a strong body of comparative effectiveness research to inform the models. There is also a need to establish ongoing communication channels between the modelers, the data collection agencies, the comparative effectiveness researchers, and the policy makers who will ideally eventually be using the model results. Initial goals should include
-
the development of a preliminary list of criteria against which alternative model integration options can be rated and compared,
-
the development of a preliminary list of modeling needs that addresses contemporary and future planning issues and policy considerations, and
-
the development of a preliminary action plan for moving toward a decision about model integration for the future.
It is also important to compare macrodata and micro-level disease models to ensure that the latter are constrained by national totals, and there is more to learn in these sorts of macro-micro linkages. While national health accounts data
are available only as aggregates, the microsimulation models desired are about individual behavior. One way to compare the models with the data is to compute the necessary aggregates, from direct simulation, Monte Carlo methods, etc. The problem is that many different models can give the same aggregated behavior, so this does not provide a powerful test to compare different models. At the same time, however, it is possible to work back (or down) from the aggregate data to individual behaviors. Such ecological inferences do not have unique solutions, but the aggregate data, if used intelligently, can usually put fairly tight constraints on the individual behaviors, and the microsimulation can then be directly checked against these constraints (Shalizi, 2004). Similar macro-micro linkages can be formed for mortality modeling purposes. However, it is less clear how to ensure that quality of life is adequately constrained to national totals.
6.4.3.
Integrated Modeling Efforts Outside the United States
For policy purposes, the ultimate goal is to develop an integrated simulation and forecasting model that predicts multiple attributes of health and health care costs for a population based on risk factors, multiple diseases, uptake of medical therapies, and program interventions. In short, the goal is to model the health care sector. A number of such efforts have been initiated internationally that may serve as a guide.
As part of a recent systematic review of cardiovascular disease policy models, Capewell and colleagues consulted extensively with internationally recognized modeling experts, identifying several multidisease models in use or in development. The following model descriptions rely heavily on their report to the British Heart Foundation (Capewell et al., 2008). While this list is not complete, it does attempt to highlight all the high-quality, ongoing projects that might be used as examples of best modeling practice.
-
Dynamo-Health Impact Assessment (Dynamo-HIA, the Netherlands). The purpose of this project is to design a stochastic, dynamic microsimulation with explicit risk-factor states for annual, population-based data that models varying chronic disease processes with a discrete time frame. The model is used to estimate health impact assessment—the effect of policy interventions by modifying key parameters in the model to make projections and to show the development of the disease process over time. The model aims to contribute to informed policy making, both on the European Union level and the national level, by providing an instrument that enables health experts to predict the magnitude of health consequences that result from changing health determinants. Data required by the instrument will generally be available for most countries. The focus of this model will be cardiovascular disease, diabetes, and cancer. Once developed, Dynamo-HIA will be publicly available via a website with
-
instructions for use, including data sets on risk factors and diseases for an example application of the model. An example would be estimating potential health gains by reducing smoking, and then implementing a tax increase on tobacco. For more information, see http://www.dynamo-hia.eu/object_class/dyhia_aims.html.
-
Archimedes (United States). The Archimedes model is a comprehensive, continuous, trial-validated simulation model of human physiology, diseases, behaviors, interventions, and health care systems originally developed at Kaiser Permanente and now marketed by the independent organization Archimedes, Inc. The model currently includes several cardiovascular diseases (e.g., coronary artery disease, congestive heart failure, stroke, hypertension, dyslipidemia) as well as many other conditions (e.g., cancer, asthma, obesity) in a single integrated system, enabling it to model comorbidities, syndromes, medications with multiple effects, and more. It can be used to explore the effects of a wide variety of health care interventions on the progression, logistics, and economic outcomes of major diseases in a complex health care system. Potential applications include the design of guidelines, analysis of best practices, estimation of return on investment of care management programs, setting of clinical targets, priority setting, strategic goals, forecasting, design of performance measures, and research design. For more information, see http://archimedesmodel.com/index.html.
-
Program in Occupational Health and Environmental Medicine (POHEM, Canada). POHEM is a continuous time, longitudinal, microsimulation model of health and disease. Using equations and submodels developed at Statistics Canada as well as drawn from the medical literature, the model simulates representative populations and allows the rational comparison of competing health intervention alternatives in a framework that captures the effects of disease interactions. The model simulates representative populations and allows for a rational comparison of competing health intervention alternatives. POHEM has been building and incrementally adding disease-specific microsimulation models to a macro model of pensions and the life cycle. The first microsimulation model was of acute myocardial infarction. The purpose of the model is to project the disease burden and to compare the relative impact of various risk-factor modifications through lifestyle and drug therapies on outcomes and costs. Since the original model, several additional disease models (including colorectal cancer, osteoarthritis, and others) have been developed, and each has been added in a modular fashion to the macro model. The model also includes a validated prediction model of diabetes incidence; work on a broader diabetes model is ongoing with plans to implement it in POHEM. For more information, see http://www.statcan.ca/english/spsd/Pohem.htm.
-
Rijksinstituut voor Volksgezondheid en Milieu (RIVM, National Institute of Health and the Environment of the Netherlands, Chronic Disease Model (CDM). The RIVM CDM is a multistate transition model based on life-table methods. It has been used to describe the cardiovascular morbidity and mortality effects due to changes in cardiovascular risk factors versus changes in the rate of uptake of cardiovascular therapies. The model includes major risk factors (cholesterol, systolic blood pressure, smoking, physical activity level, and body mass index) and relevant disease states (acute myocardial infarction, other coronary heart disease, stroke, and chronic heart failure). It has also been expanded to model 20 other diseases but does not include treatments. Related transition between states is possible due to changes between classes for any risk factor, incidence, remission and progress for the considered diseases, and mortality. The model describes the life course of cohorts in terms of changes between risk-factor classes and changes between disease states over the simulation time period. The main model outcome variables are incidence, prevalence, and mortality numbers specified by disease, and quality of life adjusted outcomes. For more information, see http://rivm.openrepository.com/rivm/.
-
Prevent (the Netherlands). Prevent is a dynamic population model that can handle multiple risk factors and diseases simultaneously. The first version was developed by Louise Gunning-Schepers and Jan Barendregt in 1989. It linked risk-factor exposure to disease-specific mortality, and through that to total mortality. Changes in risk-factor exposure translate (by way of potential impact fractions) into changes in excess risk with time lags. Prevent calculates two scenarios, called “reference” and “intervention.” These scenarios differ only in a risk-factor intervention the user can specify; consequently all the differences between the two scenarios can be attributed to that intervention (counterfactual). The model has been through a number of important upgrades, including the addition of disease-specific and total morbidity (as well as disability and health care costs). The current version (3.01) includes an important conceptual change—the difference between risk factors and diseases has largely become semantic. Risk factors can be risk factors for other risk factors, diseases can be risk factors for other diseases and for risk factors. The current version allows defining “causal web” risk-factor/disease relations (although does not encourage spaghetti-like risk-factor specifications) but also simple relations, such as letting the incidence of stroke increase as a consequence of a higher prevalence of ischemic heart disease. A major extension is that risk factors can now be either categorical or continuous. Categorical risk factors can have as many categories as desired, each associated with a relative risk. Continuous risk factors can be of various distributions (normal, lognormal, Weibull) and have risk functions asso-
-
ciated with them. The risk function relates risk to level of exposure and can be either linear, two-piecewise linear, or logit. In addition to being calculated, population projections can now also be provided as an input. When the option of calculated projections is chosen, the reference and intervention population projections will differ as a consequence of different risk-factor prevalence. When the population projection is input, the two scenarios will use the same projection. For more information, see Barendregt (1999).
-
World Health Organization (WHO) CHOosing Interventions that are Cost Effective (CHOICE). The WHO CHOICE program assembles regional databases on the costs, impact on population health, and cost effectiveness of key health interventions. It also provides a contextualization tool that makes it possible to adapt regional results to the country level. This work started in 1998 with the development of standard tools and methods that have been used to generate the regional databases. An extension of cost-effective analyses was developed to inform better policy decisions at the national or regional level, called “generalized cost-effectiveness analysis,” which can be summarized in two propositions:
-
The costs and benefits of a set of related interventions should be evaluated with respect to a counterfactual. This provides sufficient information for evaluating both independent and mutually exclusive options to identify the health-maximizing combination of interventions for a given budget.
-
Results of the analysis should initially be presented in a single league table. Subsequently, the decision would be made about the appropriate cut point for classifying interventions as very cost effective, very cost ineffective, and somewhere in between.
-
-
For more information, see http://www.who.int/choice/en/.
-
HealthAgeingMOD (Australia). The HealthAgeingMOD model is a cost-benefit model system under development by an Australian Research Council grant. The system will comprise several chronic disease progression models (or modules) linked to an overarching umbrella microsimulation model representing the entire Australian population. The microsimulation model accounts for individual and family-level demographic, socioeconomic, and health risk factors; progression of health status; chronic diseases; health-related expenditures; and quality of life. It will provide 20-year projections of disease-specific incidences, prevalences, and progression with treatment costs of chronic diseases and comorbidities. The current model will account for cardiovascular disease and diabetes; others will be added once proven successful. The model will provide a more complete view of chronic disease/comorbidity costs and benefits in various scenarios. For more information, see http://www.acerh.edu.au/publications/ACERH_RR3.pdf; Walker, Butler, and Colagiuri (2008).
-
IMPACT (United Kingdom). The original IMPACT model was a cell-based model for coronary heart disease with two modules. One was for primary prevention that allowed generating incident cases and modeled the effect of interventions aimed at upstream and downstream risk factors either at the population or the individual level. It could deal with trends in risk factors over time, age, and gender. The other module dealt with disease treatments, including all relevant patient groups (acute coronary syndromes, chronic angina, survivors of myocardial infarction and heart failure) and all the evidence-based treatments. Successive versions of IMPACT have helped to explain trends in coronary heart disease in diverse populations in well over a dozen countries (Unal et al., 2004; Ford et al., 2007), and projects continue in several other countries. Published outputs from the IMPACT model now include deaths postponed and life years gained, which are then attributed to treatments in individuals or to population risk factor reductions (principally smoking and, to a lesser extent, blood pressure and cholesterol; Unal, 2004). While useful for policy purposes, there is a tremendous policy need for information on quality of life and on cost-effectiveness.
-
IMPACT2 (United Kingdom). Building on the original IMPACT model, the IMPACT2 model will simulate individual coronary heart disease patients using event-driven simulation software developed specifically for the model. A key feature of the project was consultation with policy makers at national, regional, and local levels; these consultations are guiding both model development and the web-based user interface design. The model has been designed to allow subsequent extension into other cardiovascular and chronic diseases. Like the original IMPACT model, IMPACT2 is being built with two modules: one for primary prevention and the other for management of those with coronary heart disease. By end of 2009, it is anticipated that a web-based version of IMPACT2 will be publicly available. For more information, see http://www.liv.ac.uk/ihia/index.htm.
6.5.
TYPES OF HEALTH DATA AND STATISTICS AND CHALLENGES TO THEIR IMPROVEMENT
Although significant conceptual work remains to be done in the construction of a framework on which to build national health accounts, the single biggest challenge is to create the data infrastructure—through new data collection and, perhaps more importantly, coordination of existing sources—required to support the effort. The basic data components of such a project are built from a range of sources, including censuses, vital statistics, population-based surveys, and administrative data (such as insurance claims). All of these data are currently collected in some form in the United States; however, they differ greatly in their coverage,
quality, and frequency of collection. These potential data sources are described below, and several specific examples are described in Appendix A.7
Although a large amount of information on medical care and health is produced in the United States, it does not constitute a systematic national health care data system. Today, the nation’s lack of an integrated, clinically detailed information system to track medical care and population health is a fundamental barrier to constructing a national health account and, indeed, to improving the quality and containing the costs of care itself. In medical practice, distinguishing low-value from high-value (or even contraindicated) care is rarely possible without some information on the clinical context, such as the patient’s comorbid conditions, the results of diagnostic tests, or the current (and past) treatments (Hayward, 2008). While the knowledge and technical ability exists to dramatically improve the health returns to the $2.5 trillion annual investment in medical care, this potential can be realized only with more detailed and comprehensive data on health and health determinants (including, but not limited to, medical care spending) collected more consistently and systematically over time. However, a number of current data deficiencies, discussed below, must be overcome in order to realize this goal.
In a speech titled “Shaping a Vision for the 21st Century Health Statistics,” given at a symposium marking the 50th anniversary of the National Committee on Vital and Health Statistics (NCVHS), Dorothy Rice assessed the core programs of the federal statistical system (see http://www.ncvhs.hhs.gov/50thvision21stcent.htm):
Regardless of what changes must be made in the core programs we must ensure that an information base continues to be available that will provide baseline data, be useful for monitoring trends, and have the ability to quickly detect any changes or aberrations in the economic, social, or health characteristics of the nation. The appropriate federal role in statistics is to produce national level data useful for those purposes as well as provide norms to which sub-national data can be compared. The data must be of high quality, produced in a timely manner, and relevant to issues of the day….
As we move closer to our objective of a national and systematic approach to meeting the information needs for health policy development and program evaluation, we also need to coordinate our data collection activities, both within the federal establishment and between government and the private sector. Although considerable progress has been made in coordination, we must continue to avoid unnecessary and costly duplication, to encourage comparability of information collected by different systems, and to use the ongoing data collection programs to provide specific information for many organizations. More effort is needed to provide essential data, yet reduce the burden on individual and institutional respondents. We must develop, articulate, and implement a 21st century vision for health statistics.
A key problem with the U.S. system, identified by Rice, is that data sources are not centralized. This reflects fragmentation of U.S. health care delivery itself, which has led to its myriad of resultant data sets. To move forward, development of an integrated, effective statistical system for monitoring population health (and for delivering health services in an effective, efficient, and equitable manner) is essential. These data are critical for monitoring resource allocation strategies, conducting research, and facilitating effective policy making, planning, management, and evaluation.
The current data environment in the United States involves a large number of players, each with differing mandates and roles. There are many data custodians, both public and private, national and local, that collect and maintain a wide range of population-based health and health services data, both micro and macro. Because of this fragmentation and the decentralized nature of the U.S. health statistics systems, it is difficult to determine the best roles for such agencies as the Agency for Healthcare Research and Quality (AHRQ), the Centers for Medicare & Medicaid Services (CMS), the National Center for Health Statistics (NCHS), and others in developing a coordinated health data system. It is not necessarily a negative to have some overlap of subject matter across agencies (e.g., the Census Bureau and NCHS calculate different estimates of life expectancy). However, these collectors and custodians typically have no explicit mandate to support the research community. Also, although some data are collected for research or public health purposes, much of it is done in the course of operating health care or other social systems (Black et al., 2004).
Data needs vary by purpose and agency mission. Economic accounting (BEA), price and productivity measurement (Bureau of Labor Statistics [BLS]), medical and health-oriented research (e.g., funded by the National Institutes of Health [NIH]), and health monitoring (e.g., NCHS) are all data driven, but requirements vary in terms of needed characteristics and complexity. An understanding of how these data vary is critical to forging a roadmap and setting priorities for additional data acquisition. To monitor quality change in medical care for purposes of price measurement, accurate data on health outcomes of care—defined in parallel with the expenditure categories—are needed.
One approach to begin developing the needed data infrastructure is to modify, piecemeal, the many data sets now produced to make them more useful. Another (nonconflicting) strategy is to try to better coordinate what is now produced to move away from the world of patchwork data that are historically rooted, rather than structured, to meet modern health policy needs. Inevitably, both will happen, so thought must be given to how nonstatistical agency data (e.g., military, veterans affairs) as well as nongovernment data (e.g., Kaiser Permanente and other health care plans, drug companies) can be exploited. Insurance data cannot represent the entire population but are often more comprehensive than any federal agency or public data set (except Medicare claims). A merged model of
data creation is essential and could help guide the tweaking of now fragmented surveys to make them more useful in the future.
The remainder of this chapter assesses (1) the data currently available that would be useful in the construction of national health accounts and for linking expenditures to health, (2) key data challenges to improving that data, (3) data gaps to be filled, and (4) options for how to proceed.
6.5.1.
Expenditure Data
At this point, we have already discussed the attributes of NHEAs in detail. Here, we only point out that the scope of spending included in NHEAs typically differs from that embedded in the various health surveys conducted in the United States. For example, NHEAs includes total net revenues for all U.S. hospitals, as well as government tax appropriations, nonpatient operating revenues (such as from gift shops), and nonoperating revenues (such as interest income) (see https://www.cms.gov/NationalHealthExpendData/ for more information). MEPS and the Medicare Current Beneficiary Survey (MCBS), in contrast, are event driven; most of these expenditures would not get picked up in the surveys, as they are not associated with discrete patient utilization events. Furthermore, there is little or no information about the nature, extent, or impact of trade and tax subsidies involving health resources.
Currently, limited data are available for estimating expenditures on acute care. MCBS does have this for the Medicare population. Reconciliations with National Health Expenditures data indicate that MCBS-based estimates are low by around 15 percent. Nursing home surveys could be used to uncover a large part of the missing piece (for admission periods, not long term). Claims data could possibly be combined with nursing home survey to get duration. The Census Bureau’s American Community Survey (ACS) could provide a sampling frame for the institutionalized population that could be adopted by health surveys.
6.5.2.
Censuses and Vital Statistics
Population censuses provide information on fertility, mortality, and migration. These data elements are used in the denominator of mortality rate calculations and therefore are essential for population projections and forecasting. They also serve as the basis for life tables, which allow life-expectancy statistics to be calculated. Vital statistics systems are critical for population health monitoring, in that they provide continuous information on births and deaths by age, gender, race, and other dimensions. Birth registries, the characteristics of which vary by state system, track health indicators and contain the data on live births needed
to calculate infant mortality rates.8 Mortality registries provide information on gender, age, education, occupation, residence, and cause of death, facilitating monitoring of age-specific and age-standardized death rates for total and cause-specific mortality. Accurate death attribution is quite clearly essential since health policy requires information on what people are dying from that links end-of-life spending to an episode, allowing the calculation of specific rates stratified by such variables as gender, ethnicity, educational attainment, and place of residence.
Mortality statistics are regularly published by NCHS. In fact, the agency has a long history of tracking vital statistics, in conducting population-based surveys, such as the NHANES, and in tracking measures of nonfatal health such as quality of life.9 However, until recently, there have been no systematic efforts to disaggregate the dimensions in a way that parallels what is done for national health spending. Indeed, the disease groupings in the nation’s vital statistics systems (e.g., ICD-10) are not even the same as those in the national expenditure surveys (MEPS and MCBS use ICD-9-CM).
Overall mortality rates are believed to be very accurate, but cause-of-death data are less so. Because the agency has only one need for the data—it is used for their annual survey, “How Healthy Are Americans?”—it unlikely that they would initiate enhanced data collection. Still, accounting of cause of death needs to be improved, perhaps using autopsy samples or surveys that get at disease incidence before death. And, for its beneficiary population, the Medicare-denominator file information could be linked with MCBS to measure trends in mortality.
Standard death certificates request that a causal sequence of events leading to death be specified, beginning with the “immediate cause of death” (the final event leading to death), then the “intermediate causes of death” (those leading up to the immediate cause), and finally the “underlying cause of death” (the disease initiating the sequence of events). In a separate section, information is requested on “other significant conditions contributing to death but not resulting in the underlying cause” (this might include disease risk factors such as smoking or hyperlipidemia). Most physicians do not receive formal training in filing death certificates, and it is common for the underlying cause of death to be confused for the mechanisms of death. To give a sense of the scope of the problem, in a study at one major academic medical center, close to 60 percent of death cer-
|
8 |
NCHS maintains a linked birth and infant death data set that includes information from the death certificates and from birth certificates for each infant under 1 year of age who dies in the United States, Puerto Rico, the Virgin Islands, and Guam. The purpose of the linkage is to use the many additional variables available from the birth certificate to conduct more detailed analyses of infant mortality patterns. The linked files, which permit detailed analyses of infant mortality patterns, include information from the birth certificate such as “age, race and Hispanic origin of the parents, birth weight, period of gestation, plurality, prenatal care usage, maternal education, live birth order, marital status, and maternal smoking linked to information from the death certificate such as age at death and underlying and multiple cause of death,” see http://www.cdc.gov/nchs/linked.htm. |
|
9 |
Appendix describes many of the U.S. data sets that will play a key role in supplying data for a national health account. |
tificates were completed incorrectly (Zumwalt and Ritter, 1987). In many cases, the mechanism of death (e.g., cardiac arrest) was listed without an underlying cause. Other problems related to the reliability and validity of cause-of-death data include fragmentary completion of death certificates (Kircher and Anderson, 1987; Zumwalt and Ritter, 1987), changes in nosology (Sorlie and Gold, 1987; Lindahl and Johnson, 1994), inaccuracy of listed diagnoses (Israel, Rosenberg, and Curtin, 1986), and variation in physicians’ interpretation of the causal sequence contributing to death (Gittelsohn and Senning, 1979; Gittelsohn, 1982). The system for generating cause-of-death statistics could be improved by requiring physicians to prepare forms online using a program with proper prompts to sort through the information—this should be part of the electronic medical records initiative. There also needs to be a minimum standard U.S. certificate of death; states could choose to require additional information.
The known problems with cause-of-death data as currently collected in the United States are exacerbated when comorbidities are present. Furthermore, cause of death on death certificates is an inherently poor source of data for understanding the excess risk of death due to certain risk factors as many are frequently underreported. For example, among decedents with a known diagnosis of diabetes, diabetes is listed on the death certificate less than 40 percent of the time (Bild and Stevenson, 1992; McEwen et al., 2006). In contrast, some data suggest overcoding of certain conditions. One paper reports that physicians may use coronary heart disease as a default diagnosis when uncertain about the underlying cause of death, resulting in inflated estimates of mortality from this cause (Lloyd-Jones et al., 1998). In the Framingham Heart Study data, for example, coronary heart disease was overestimated as a cause of death 8-24 percent of the time overall and by as much as twofold in the elderly (Lloyd-Jones et al., 1998).
To improve the capacity to attribute death to specific diseases, researchers should explore the linkage between death data and national surveys. For a national health account, it is important to know what the impact on mortality is of specific events and conditions. In order for this to work, the project will likely need to pull data across years to have enough records to decompose deaths by condition.
Recommendation 6.2: The National Institutes of Health should commission research exploring true causes of death and compare the results against official death records and statistics.
Part of this research may involve linking National Death Index records to MEPS or NHANES to cross-check against disease records. Since researchers will need death statistics linked to data on other characteristics—such as week and month of death—this will require using the Census Data Centers for access as there is no public use option for these data. The Health Insurance Portability and Accountability Act (HIPAA) should not be a constraint to this work, since data should be available after the death of a respondent (although state laws trump in these cases).
6.5.3.
National Surveys
We have already said a lot about population-sourced data (such as health interview surveys, epidemiological studies, and longitudinal studies), which generate information on factors such as health status, the presence of disabilities, and the use of medical care that is needed to monitor health outcomes and distributional equity.10 Routine household surveys—such as MEPS and the National Health Interview Survey (NHIS)—and the individual surveys—such as MCBS—are frequently used to monitor disparities in health and in access to, and receipt of, health care. Furthermore, they are valuable in providing information about individuals from population groups that fall beyond typical data collection boundaries, such as children not yet in school, adults outside the labor force, individuals who are uninsured and, perhaps most importantly, individuals who have not accessed health care services.
Population Coverage
When considering the characteristics of a national health account, population coverage—and specifically the ability to include difficult-to-reach subpopulations and minorities—is a major issue. Although, taken together, the nation’s health surveys provide extensive information on large portions of the U.S. population, no single instrument collects data on all subpopulations. Some at-risk populations are poorly captured in the nation’s surveys, and efforts to identify or develop appropriate microdata for these populations should be a priority. Identifying all out-of-scope populations (and in-scope populations with insufficient data coverage) will allow a compendium of data needs to be created. Filling these needs could then be rank-ordered based on any combination of policy priorities—size of the population, size of the expenditures involved, health needs of the population, or policy priorities of the population, to name a few.
Recommendation 6.3: The key data-producing agencies (National Center for Health Statistics, Centers for Medicare & Medicaid Services, and Agency for Healthcare Research and Quality, with coordination from the Bureau of Economic Analysis) should work together to identify gaps in the data coverage of U.S. population subgroups and prioritize, fund, and promote research programs to fill them.
In terms of population coverage, the most notable (but not the only) omission from the combined MEPS-MCBS data is the non-Medicare institutionalized and active-duty military populations. These populations are not included in the NHIS, which serves as the sampling frame for other key surveys (MEPS, NHANES), thereby leaving out most medical costs for Alzheimer’s patients and large costs for other diseases, particularly mental disorders. While the NHIS sampling frame
|
10 |
Again, a wide range of such surveys are described in Appendix A. |
(which MEPS uses) could be extended to include the institutionalized population, contracting with CMS to add the population to MCBS might be a more cost-effective option. They have a well-validated survey for this group as they already survey institutionalized individuals or their proxies.
It is the view of this panel that, in most cases, expanding current surveys is a better value in terms of data generated relative to creating new surveys. Either way, the goal is to have in place a nationally representative (except for uninsured) set of claims for the non-Medicare population. The Census Bureau’s ACS sampling frame for institutionalized could possibly be exploited.
Recommendation 6.4: The Medical Expenditure Panel Survey (MEPS) should be updated to track as accurately as possible the use, spending, and outcomes for the non-Medicare portion of the population. If possible, data on a panel of patients should be maintained to minimize between-patient variation. A longitudinal structure would be desirable, but much can also be done with repeated cross-sections (the panel is refreshed annually).
For the military population, the U.S. Department of Defense (DoD) collects comprehensive data on the health and health care spending of all active-duty military personnel, although this information does not appear to be readily available to researchers on a centralized basis. Likewise, the U.S. Department of Veterans Affairs (VA) collects information for the 5 million veterans using VA health services. The VA and DoD have been tasked with developing a common electronic medical record but are only starting to consider its structure and contents. The two agencies should be brought into the health accounts data collection conversations; this should be a relatively easy step as both are already required to provide comparable data for their two agencies.
Better data are also needed to monitor progress toward eliminating disparities. Aside from census and vital statistics data, no other national data permit detailed study of racial or ethnic minorities outside the three largest subgroups (non-Hispanic whites, non-Hispanic blacks, and Hispanics). Because ethnic and racial subgroups often have very diverse health status and risk behaviors, it is essential that national and state health data capture trends for these subgroups.
Disease Prevalence
Another data deficiency inherent in the nation’s surveys has to do with underestimation of disease prevalence and incidence.11 A number of surveys (NHANES,
MCBS, MEPS, and HRS for mental health) are useful for capturing health degradations associated with population disease incidence and risk factors. MCBS and MEPS already include some of the necessary longitudinal components—within each panel—for tracking these variables, but they are relatively short (MEPS is 2 years, MCBS is 3 years). HRS is also longitudinal. Even so, in addition to underestimation of the prevalence of many diseases, surveys tend to have trouble providing adequate information about low-prevalence diseases.
While national survey data, such as those generated from MEPS, are appropriate for high-prevalence illnesses, such as diabetes and cardiovascular disease, for low-prevalence conditions they tend to suffer from small sample sizes, especially for some demographic groups. For these low-prevalence conditions, additional data are required, often in the form of population- or disease-specific data sets and surveys. An example is the Surveillance, Epidemiology, and End Results Medicare data, which track expenditures for individuals with a range of cancer diagnoses. Another option increasingly explored by researchers is to combine the power of claims databases (convenience samples) with the representativeness of household surveys (probability samples), weighting the claims data to match the representativeness of the household surveys. The drawback to claims data, however, is that they are not readily accessible and are often expensive to obtain and edit to the level necessary for research.
For low-prevalence conditions, two specific types of data are needed in combination: (1) individual observations in a national probability sample (e.g., MEPS) that provide good measures for conditions that occur frequently enough in relatively small samples and for which a reliable statistical basis can be formed and (2) registries or other specialized clinical data for those rarer conditions that would otherwise require very large data sets to provide adequate informational detail. Another option is to combine the power of claims databases (convenience samples) with the representativeness of household surveys (probability samples), weighting the claims data to match the representativeness of the household survey. It would be a relatively low-cost endeavor to task CMS and AHRQ to pick one or two low-prevalence but high-priority conditions and pilot test these types of linkages. One hurdle here is that, for this research, one would ideally like to have access to a large claims database, such as the one maintained by Pharmetrics or Medstat, and this is likely to be difficult, or at least expensive.
Comparisons of MEPS, MCBS, and other national surveys (e.g., NHANES, NHIS, HRS, National Comorbidity Survey) indicate that prevalence rates are underestimated in the expenditures surveys for conditions that rely solely on utilization data for their identification (Rosen and Cutler, 2009). For example, individuals who suffer from a particular condition but do not have any attributed utilization events would not be captured by such a measure. Since the national surveys contain a few direct questions (i.e., Have you ever been told by a doctor you have ___?), it is known that the extent of underestimation varies from condition to condition. For example, among non-Medicare eligible adults in 2002, 4.6 percent responded positively for ever having been diagnosed with diabetes,
and 4.3 percent had diabetes-related utilization. However, among the same population, 14 percent responded positively to having been diagnosed with arthritis, while only 0.63 percent had related utilization.
Because underestimation of disease prevalence is largely an expenditure survey problem only for conditions that rely solely on utilization data for identification, the problem can be readily rectified.
Recommendation 6.5: Once consensus has been reached on a disease classification system for use in the national health accounts and a minimum data set has been specified, existing population survey-based databases should add questions about these diseases in order to more accurately capture population-wide health and expenditure data for the core disease set.
6.5.4.
State and Private-Sector Data Systems and Surveys
In addition to the federal health statistics surveys and programs, each of the 50 states and various private-sector entities maintain data systems and conduct surveys of hospitals, health providers, and health care organizations. The private sector includes organizations of health service providers, regional employer networks, health insurance plans, consumers, industry, and private philanthropy. These private organizations conduct many of the national and state data collection activities; quality across these sources is variable. These statistical efforts lead to duplication and overlap in the data systems in the public and private sectors—some of which is useful, and some of which is wasteful. Hospital inpatient data are collected in the public sector by CMS, NCHS, AHRQ, Substance Abuse & Mental Health Services Administration, VA, and others. At the same time, many states maintain their own hospital discharge data systems conducted by rate setting and planning offices and by health systems agencies. In the private sector, hospital data are collected by the American Hospital Association, many abstracting organizations, insurers, and health plans, among others. Although hospital data are important, their reporting burden is high; recording, storing, abstracting, and processing medical records are expensive for both the institution and the users. In many instances, the rationale for these overlapping and duplicative hospital inpatient data is difficult to justify (Rice, 2000).
Recommendation 6.6: The statistical agencies should explore the value and feasibility of acquiring private insurance data for use in the construction of medical care accounts. Major data gaps could be filled if private sources could be exploited.
For researchers and policy makers, there would be great value from pooled data from Aetna, Kaiser, and other third parties. These data sets provide large samples that allow for the collection of some information about spending on rare
conditions. The major obstacle to getting the analog of Medicare claims for the privately covered population is that health insurance companies are unlikely to be willing to incur nontrivial information technology (IT) costs just to meet federal agency needs; however, if some of these expenses could be reimbursed, this problem might be surmounted. A further issue, which may not be resolvable, is that the insurers will not want to release transaction prices (it may be possible to get charges and utilization, but actual payments would be sensitive). The issues are similar to protecting rebate information in Medicare Part D data (in that case, there was statutory protection for release of the data). Finally, the companies probably would want some liability releases.
6.5.5.
Administrative Data
One important purpose of this report is to begin identifying key data sources and to provide an indication of how these sources can be combined or better organized to add value to the national data infrastructure needed to move forward in a cost-effective manner. A potentially rich source of case-by-case data on expenditures and treatments is patient claims data. Medicare and Medicaid provide data coverage for large portions of the population. If claims forms included the “right” information, they would go a long way toward satisfying some health accounting data needs. A lot could be done with claims data for the insured population because of their enormous size and wide coverage.
In terms of linking outcomes to spending, data are already quite good for some diseases. Pharmaceutical companies collect data on the comparative effectiveness of new versus old technologies and new versus old drugs in order to make their case for reimbursement. Additional data are collected as part of clinical trials which, while limited in some senses, do provide evidence about quality changes occurring in medical care. In their influential heart attack study, Heidenreich and McClellam (2001) used clinical trial data to show that decreases in early mortality from myocardial infarction resulted from increased use of effective treatments. Data on outcomes will improve over time—ideally, BLS, BEA, and academic researchers would be able to take advantage of the millions of dollars spent in their collection. And some of these data and enhancements to the infrastructure could be developed within government sources.
Recommendation 6.7: Significant analytic value could be added to Medicare data compiled by the Centers for Medicare & Medicaid Services if more clinical information on outcomes and patient characteristics were included. It is possible that the addition of only a few clinical items to claim forms could greatly enhance performance measurement. The National Committee on Vital and Health Statistics, an advisory body to the secretary of health and human services, could provide guidance on this. The linking of tests and procedures to diagnoses would also be useful for confronting the comorbidity
problem. Even though adding lines to claim forms involves major political hurdles, the panel recommends that it be done.
More than three decades ago, RAND developed an experimental claims form that included clinical information (Newhouse and the Insurance Experiment Group, 1993), and it proved effective in defining patient episodes. This should provide encouragement that the task is feasible. However, we caution that complications will have to be dealt with. For example, cases arise in which the outcomes do not become apparent until years later. Without careful randomized control trials or other causal analyses, even with longitudinal data, it is not always possible to cleanly attribute outcomes to any particular intervention.
Overall, a reasonable strategy for constructing a core data set to underlie national health and medical care accounts would be to identify a currently available survey, or combination of surveys, such as MEPS, to serve as the backbone of the data infrastructure, then to use claims information in a supplemental role wherever population or disease coverage gaps appear. Claims data from Medicare and Medicaid would cover large portions of the population. However, there are some groups for which claims data will not be available—most obvious are the uninsured, who do not submit claims—so their spending would have to be measured another way. Patients from some kinds of institutions are also unexplored (BEA has been investigating ways of obtaining spending data for these groups).
Research is needed about how to design claim forms to be more useful for research and national accounting and specifically about how to make it easier to track episodes and outcomes. Clearly, electronic medical recordkeeping (many items are currently not coded) is essential as is some degree of standardization of forms. One could also imagine specific refinements that could be made as well, such as asking physicians to enter quality of life measures onto claims forms. Likewise, it would be helpful for research purposes to add a few select items to Medicare claims forms—e.g., questions about obesity, smoking, hypertension, or cholesterol. These advances in information content must be weighed against the additional burden that is created for doctors and to health care systems. We return to these ideas in the next section.
6.5.6.
Disease Registries
A range of data is routinely collected to provide information about specific health conditions; examples include disease surveillance systems for notifiable conditions, such as HIV, and disease registries and health services statistics, which provide information for monitoring health status and health outcomes. One advantage of surveillance and notification systems and disease registers over other types of health data collections is that these sources can provide direct measures of incidence for particular diseases in the population. A drawback is
that they provide data only on individuals who receive health care. Furthermore, the records may be poor or incomplete, depending on their source.
6.6.
ORGANIZING THE DATA INFRASTRUCTURE
It would be hard to overemphasize the difficulty of linking expenditures on medical care and other health inputs to health outcomes. Even though various projects are under way and making progress on this front, too few of the connections have been accurately quantified to make these results a focal point for a report on national health accounts. That said, there clearly needs to be a consistent set of rules to serve as a blueprint for development of the data infrastructure designed for the purpose of, among other things, informing research on the causal factors that affect the population’s health.
During the past few decades, researchers have begun focusing much more on this challenge, but what has developed is a somewhat arbitrary rule for defining episodes of treatment that would serve as the basis for linking costs to outcomes (for the medical care portion of the story). Although collecting outcomes data that can be linked to spending is a big challenge, it is not impossible—cost modeling has been conducted attempting to attribute spending to treatments and ultimately to change in health status. The National Institute of Economic and Social Research (NIESR)/York has been working with the United Kingdom’s National Health Service to collect information on outcomes that can be matched with expenditures. In conjunction with this, NIESR has published recommendations on key health accounting topics, such as measuring health system output and productivity, quality adjusting health sector output, and valuing attributes of health care.12 Research has also been done to provide a clinical basis for linking treatment, effect, and outcomes; a prototype UK account uses survival rates from a hospital episodes statistics survey and a sample of waiting times—missing quality of life for the most part (Lakhani, 2005).
Looking well into the future, creating the ability to link expenditures and health outcomes has to be an objective for the United States as well. It is clear that more research is needed before recommendations about a specific approach can be sensibly advanced. The ideal health statistics system would entail a “population-based, person-specific” data system for rigorous testing of hypotheses about the determinants of health (Roos and Shapiro, 1995; Roos et al., 1995). This system should include systematic data on health and health-related activities that can summarize health at the population and individual levels and should have coherence or “adding up” constraints (Wolfson, 1991).
The desired data elements can be organized into several categories: socio-demographics; incidence and prevalence of a select group of clinical conditions;
|
12 |
Developing new approaches to measuring National Health Service outputs and productivity: Final Report. See http://www.niesr.ac.uk/pubs/searchdetail.php?PublicationID=664. |
use of health services; health behaviors; health outcomes; and other nonhealth and/or nonmedical determinants of health. An economic accounting structure is needed so that inputs to health (most immediately, medical care), and output (population health) are tabulated independently. Improvements in health—both quantity and quality of life—are the most critical variables on the output side of a health statistics system designed to quantify the impact of health care spending.
6.6.1.
The Need for a Computerized National Data Infrastructure
The United States is a long way off from being able to satisfactorily model population health and health determinants in a systematic way, but a starting point is to begin keeping better track of risk factors, health indicators, and other related data. It is encouraging that progress has been made along some fronts, but serious data gaps remain. The remainder of this chapter discusses options and makes recommendations on how to address some of the current data deficiencies in order to move toward more integrated and comprehensive “health statistics needed for the 21st century” (Rice, 2000).
To develop a national data infrastructure, operational definitions must be developed, and core and optional data elements must be determined. Pieces of the data infrastructure will need to be created and pilot tested, in particular the linkages between databases. This will require a coordinated developmental effort, far beyond the current scale of activities. It will take several years, a research network, and a core commitment from leaders to make this happen. While building this infrastructure will be costly, failure to do so will be far more so—taking a substantial toll on the health (and wealth) of the population and the ability of policy makers to rein in wasteful spending.
The World Health Organization outlines four priorities for data collection in support of producing national health accounts (World Health Organization, 2005): (1) to use all suitable existing data, (2) to adjust existing data to make them more suitable, (3) to improve or enrich surveys and administrative records to increase their suitability, and (4) to identify and arrange for the collection or generation of data that remain “missing.” To recognize the practical constraints to data acquisition, we add a fifth goal (which really should precede the first): (5) to develop a schema to prioritize the acquisition of data.
Currently, for the United States, partial snapshots relating to the bigger attribution picture can be created. Spending on medical care can be tracked by provider and payer (NHEAs); global health and certain physiological measures are available (e.g., from such surveys as NHIS and NHANES, and HRS is promising); in addition, records on two universal health outcomes, birth and death, are collected. However, at this point, it is virtually impossible to link these things—spending on medical care to individual outcomes to population health effects—to expenditure data (in part because so many factors, in addition to medical care, affect health).
The development of a national data infrastructure designed to organize and coordinate current data and frame future data needs is critical if a national health account is to be developed. The matter appears to be a high priority for the current administration, which committed about $19 billion of the 2009 recovery package to encourage doctors and hospitals to install and use electronic health records.13 The fact that a number of private-sector technology and telecommunications companies have embarked on related projects adds to the prospect that the country may soon have an effective e-health records system. Not only will this modernization, designed to link patient health histories as well as treatment guidelines, be helpful for research and policy purposes, but also it could, if properly deployed, improve care and help curb costs by helping stem unnecessary tests, reducing errors, and coordinating treatments.
Perhaps the most critical (and most difficult) piece in the development of a national health IT infrastructure will be creating a level of interoperability that approaches what exists for most other 21st century industries (see Box 6-2).
While it is beyond the scope of this panel to make specific IT infrastructure recommendations, we point out that long-term comprehensive strategies and short-term incremental strategies need not be viewed as mutually exclusive. While current data may not be ideal, policy makers can learn a great deal simply by using—and developing better mechanisms to link—data sets that already exist. Thus, the policy choice is to determine how to most effectively allocate information systems resources to meet both short- and long-term goals.
6.6.2.
Longitudinal Data
While current surveys and administrative systems contain extensive crosssectional data, a shortage exists for large-scale longitudinal data to better track health status and health events over the life course of individuals in the population. The high expense and respondent burden associated with longitudinal surveys means that any increases in longitudinal data collection will be incremental. Other countries, having confronted this same issue, have addressed the lack of longitudinal data with dynamic microsimulation models, as described above (Wolfson, 1991, 1995; Spielauer, 2007). When microsimulation models are used, longitudinal data are still needed to set the framework, but in much smaller quantities.
Recommendation 6.8: A study should be commissioned by a funding agency (National Institutes of Health or National Science Foundation) to take an inventory of other countries’ population health statistics systems, the role played by microsimulation modeling, the implications for longitudinal
|
13 |
Currently, only about 17 percent of physicians in the United States use computerized patient records, even though some very large service providers, such as Kaiser Permanente and the Mayo Clinic, do so. See http://www.nytimes.com/2009/09/10/technology/10records.html. |
|
BOX 6-2 Interoperability and the U.S. Health Care Nonsystem The health care system in America is not a system. Rather, it is a disconnected collection of large and small medical businesses, health care professionals, treatment centers, hospitals, and all those who provide support for them. Most players have their own internal structure for gathering and sharing information, but nothing ties those isolated structures into an interoperable national system capable of making information easily shared and compared. Interoperable systems are invisible but essential, and people have come to depend on them in everyday life. Interoperable systems allow one person to speak to another using cell phones with different cellular service. ATM cards are good at virtually all banks nationwide and most banks internationally; they allow people to buy groceries and pay for gym memberships—all of this is possible because of secure interoperable systems. These systems work because the telephone and banking sectors have developed methods and standards that allow participants in their systems to easily access and exchange information while the companies operate independently and compete vigorously. If banks (which require standards of privacy and confidentiality) can use interoperable systems, health care should be able to as well. The benefits of putting such a system, which will be dispersed across many stakeholders, in place surely outweigh the costs (which include any change in the risk of confidentiality disclosure). The banking industry probably did several of these same cost/risk-benefit analyses 20 years ago, but the lasting impact of the network of point-of-service banking and portability of finance is now clear. NOTE: For more on this topic, see Walker et al. (2005). The authors estimate that interoperability and health information exchange could lead to $77 billion in savings. In addition, it would provide clinicians with full information at the point of care; it would enhance portability of information for patients; and it would give researchers a centralized data source. |
data collection, and the advantages and disadvantages of the different approaches.
The study should be oriented toward providing guidance on how existing surveys, such as NHANES or MEPS, could be modified to optimize their analytic value. The ability to make NHANES longitudinal seems to exist now; it is just not done very often.14 Data are released biannually—and with a quite short lag. A longitudinal component would be extremely useful, but the cost would be
high unless it was scaled back to include only a few targeted survey questions. It would also be useful to add NHANES measures into MEPS or to add claims information to NHANES.
Recommendation 6.9: The National Health and Nutrition Examination Survey, which is already conducted on an ongoing basis, should contain a longitudinal component to optimize its value as an input into a health account and into cost-effectiveness research. Due to confidentiality concerns, the longitudinal component (or at least publicly accessible data products derived from it) will need to be limited to key variables that do not unduly increase disclosure risks.
A trade-off exists in terms of the timing of longitudinal data collection. For example, it may be better to collect a sample that is twice as large every other year instead of annually. These options would have to be explored during the design phase. It would also be important to be able to link the data to Medicare records, which could perhaps be done in data centers. Some of this could be funded by reducing the scope of NHIS—which would just be used as a sampling frame—and then expanding the other surveys.
6.6.3.
Data Sharing and Data Linkage
In considering future prospects for improved health statistics to meet policy needs, it must be acknowledged that resources will not grow in parallel to the demand for data and medical services. Budgetary pressures require that current data collection and dissemination procedures be constantly assessed. These trends imply that it is time for the statistical agencies to make stronger efforts to coordinate data collection efforts across surveys and agencies—which may entail a cultural shift from within—to invest in the 21st century vision for health statistics. The ability to exploit multiple data sources will be a key ingredient to the success of a national health account. However, there are a number of barriers to linking provider data on expenditures with data on patients. For example, some modernizing of key data sources is needed to ease the task of creating a linkable system. If public and private data are to be linked, a common identifier will be needed. And trends in spending and in outcomes need to be measured at same metric.
Because surveys are expensive and burdensome, cost efficiency requires linking across sources whenever possible. NHEA needs to be linkable to individual-level data contained in other health data sources (NHIS, HNANES, MCBS, MEPS, etc.).15 Ideally, one would like to be able to link data from these key
|
15 |
America’s Health Insurance Plans is now working to standardize electronic personal health records with the hope that claims and other patient records (diagnoses, procedures, medications) can be carried from one insurer to another (see http://www.insurancetech.com/showArticle.jhtml?articleID=201400212). In addition, they could be linked to the National Death Index in principle. |
surveys to administrative sources (Medicare and Social Security, specifically). Expanding such efforts to the non-Medicare population is possible, but the large claims databases are managed for employers by data management firms, such as Ingenix and Medstat, so access may be an issue. Moreover, these databases are not representative of the entire private market because they typically do not include the individual and small group insured portions of the population, and of course the uninsured are not included.
Data sharing and linkage could reduce duplicative and overlapping reporting systems and in turn maximize the results of separate efforts. Some promising progress has been made on this front. NCHS has developed a program that links several of the its population-based surveys (such as NHANES and NHIS) with death certificates from the National Death Index (NDI) Medicare enrollment and claims data from CMS; and Old Age, Survivor, and Disability Insurance and Supplemental Security Income benefit data from the Social Security Administration (Centers for Disease Control and Prevention, 2010). AHRQ has developed a number of linkages to MEPS as well. Some of these data are restricted; some, such as the MEPS and NHIS public use data sets, require completion of confidentiality forms; others, such as the linked household and insurance component files, can be accessed only at AHRQ or the Census Bureau research data centers.
A number of federal statistical agencies and nongovernmental organizations (such as the National Bureau of Economic Research and the University of Michigan Institute for Social Research) have been designated statistical data centers, where many of these linked data sets reside. There is still a long way to go, however, before access to these data is satisfactory. For example, both Medicare claims data and NDI data can be linked to NHANES, however, access to these linked data sets is difficult, time consuming, and sometimes expensive to obtain. Furthermore, while some progress has been made linking data collected by different government agencies, linkages between private and public data have not yet been accomplished on any meaningful scale. While it is widely believed that the private sector does not want these linkages, this is not universally the case.
A number of currently linked data sets are underutilized because researchers are unaware they exist or have not used them before. The statistical agencies could probably productively undertake efforts to increase researcher awareness of, and ease of access to, existing linked data sets and data linkage tools, such as the U.S. Census Bureau’s American FactFinder, available at http://factfinder.census.gov.
Technical difficulties in reusing data—as with creating data set linkages—are substantially eased by good data management practices (including documentation) and timely collection and provision of “data about the data” or metadata (Piwowar et al., 2008). Data providers must create adequate, accurate metadata at the time of data set creation for efficient, cost-effective, quality data sharing downstream. Metadata requirements should be identified a priori. This requires
coordination among the data collectors (or agencies), the scientific disciplines, and the computer and information science disciplines.
6.6.4.
Data Standardization, Quality, and Timeliness
Standardization of data elements across surveys and other data sets is necessary for meaningful comparisons and for the development of a coordinated system. While some progress in developing standards has been made, surveys often continue to produce disparate estimates due to the lack of standardization. Indeed, the disease groupings in the vital statistics systems (ICD-10) are not even the same as those in the national expenditure surveys (MEPS and MCBS use ICD-9-CM); in the absence of standardization, mapping diseases from the two sources to the same groups is extremely difficult.
NCVHS has made some progress developing uniform minimum data standards, but these efforts must be continued as needs and demands for data at the state and local levels grow (Rice, 2000). Greater standardization of definitions, methods, and data reporting would certainly be a prerequisite for developing disease-based subaccounts within the NHEA. Furthermore, standards facilitate data reuse, thereby increasing the funders’ returns on investment in the data. They make data sharing easier, saving overhead and losses of time in data loading, conversion, getting systems to work properly with the data received, and with interpretation. Development and maintenance of an electronic inventory of standardized data elements in a straightforward and accessible form can markedly increase the use of these data and therefore the return on the investment from standardization.
Even if a system is well coordinated, some important data may be available only after a lengthy lag, making them out of date for policy purposes. Vital statistics data, which underlie some of the most important population health metrics, are collected on an ongoing basis. However, the process of cleaning the data and preparing them for public use means they are released only after a lag period of a year or more. Even the NHEAs have a 12-month lag until release, limiting their usefulness to policy makers. Furthermore, the lag increases substantially when NHEA-to-microdata linkages are required—as in the development of the disease-based health accounts discussed in this report. MEPS files become available 2 years after the year for which they are collected. The MCBS Access to Care file—which provides information on beneficiaries’ access to, satisfaction with, and usual source of care—and Cost and Use files—which link Medicare claims to survey-reported events to provide expenditure and source of payment data on health care services, including those not covered by Medicare—are released with a 1- and 2-year lag, respectively.
There has been a lack of political commitment to investing in the collection of quality health statistics in the public and private sectors. Until this changes, it is even more important that the investments that are made are used wisely. While
many federal statistical agencies, such as NCHS, make considerable efforts to ensure data quality, the quality and reliability of much private-sector data are unknown. Because survey results are subject to sampling, reporting, processing, and nonresponse errors; data cannot be fully interpreted unless these errors are reported. While federal statistical surveys routinely report standard errors, they are often unavailable in reports emanating from facility and manpower private-sector surveys. Improvement in the quality and reliability of health statistics reported in the private sector is urgently needed.
6.6.5.
Characteristics for a Minimum Data Set
In moving forward on development of a national health account, it is essential to identify the ideal data needs to inform policy and then to specify a minimum data set, designed to collect information consistently across all relevant surveys to ensure broad representativeness. Key long-term goals include standardizing questions representing the same concepts across surveys, identifying and filling data gaps (such as populations underrepresented in or absent from national surveys), and adding questions to surveys to obtain comparable data across survey populations.
Recommendation 6.10: A research project should be commissioned by the National Institutes of Health to identify the minimum data set of variables needed to support the infrastructure of the ideal health statistics system.
Ideally, the integrated population data set would include some biological measures, in addition to general health measures. This idea is not new—HRS already compiles biological and genetic data, so a model and some data exist. It would certainly be worthwhile to explore the possibility of enhancing MEPS with biological information. The central idea is to have data on both expenditures and health outcomes in the same place and by the same categories. Table 6-1 provides an example of what that data element list might look like.
As has been pointed out, a subset of nonmedical determinants of health will need to be collected routinely on surveys, and the research recommended above should provide guidance for the routine updating of surveys to generate data on key nonmedical influences on health. Funding agencies (e.g., NIH, National Science Foundation [NSF], Agency for Healthcare Research and Quality, etc.) should strongly consider supporting work designed to identify a small set of simple, low-burden questions that could be appended to surveys to learn more about such factors as physical environment and individual monitors (of stress, sleep hours, exercise, etc.) that affect health. The project should also catalogue the portions of the population that are and are not covered by the various data sources.
It is unrealistic to think that all of the data elements needed for a health account could be collected and coordinated in a centralized repository imme-
TABLE 6-1 Potential Data Elements for a Minimum Data Set
|
Domain |
Possible Variables |
|
Population Health Measures |
|
|
Mortality |
|
|
Generic HRQoLa |
Specific measures TBD |
|
Individual Characteristics |
|
|
Demographics |
Age, gender, race/ethnicity, social security number, marital status |
|
Socioeconomic status |
Income, education, marital status, employment/work conditions and hours, social support networks, health literacy, social environment, physical environment, personal health practices, health services |
|
Individuals: Physical and Mental Measures |
|
|
Anthropomorphic measures |
Height, weight, waist circumference, blood pressure, heart rate |
|
Chemistries |
Creatinine, glucose, direct low-density lipoprotein cholesterol, etc. |
|
Functioning |
ADL, IADL, mobility, cognitive limitations |
|
Individuals: Behaviors |
|
|
Smoking |
Smoking/amount |
|
Alcohol abuse |
Ethanol intake |
|
Physical activity |
Indicators of sedentary lifestyle |
|
Adherence to medical therapies |
Medicines prescribed/taken |
|
Health Services (ideally differentiating between acute and chronic) |
|
|
Primary care—outpatient |
Hospital-based clinic, Y/N?; diagnoses for the encounter (ICD); procedure codes (CPT); provider ID; dates of service (for inpatient and output); type and other characteristicsb |
|
Specialty care—outpatient |
Hospital-based clinic, Y/N? type? |
|
Hospital services |
|
|
Hospital services—provider |
|
|
Pharmaceuticals |
Prescription drugs taken chronically (probably more important than those taken short term).c |
|
Other (the current National Health Expenditure Accounts service categories, plus others) |
|
|
Core set of diseases linkable to utilization data |
ICD diagnoses or top 20-30 diseasesd |
|
Long-term care |
|
|
Palliative (end of life) care |
Hospice, Y/N, home/elsewhere |
|
Residential care (if included in the domain of medical care) |
Assisted living, retirement homes |
|
Domain |
Possible Variables |
|
Identifiers and other medical claim form information |
Unique patient identifiers, ICD-9 codes for admission diagnosis, unique provider ID, dates of service, codes for identifying inpatient procedures performed, Healthcare Common Procedure Coding System for outpatient (such as lab work), service charges (amount billed), allowed amount, and paid amount.e |
|
Identifiers and other pharmaceutical claim form information |
Unique patient ID, Unique pharmacist ID, National Drug Code and quantity of specific medicine, prescribing physician identifier, allowed amount, paid amount |
|
Identifiers and other hospital discharge abstract information |
Hospital identifier, admission source, discharge status, admission and discharge dates, length of stay, type of secondary insurance, patient demographics, ICD-9-CM diagnosis and CPT codes, assigned diagnostic related group and major diagnostic category, total charges |
|
Other Determinants of Health |
|
|
Environment |
Climate, air quality, access to clean water |
|
Geographic hospital data |
Wages, supplies, other hospital input prices, payer mix, disproportionate share status, hospital type (academic, community), rural, urban |
|
aHRQoL indicates health-related quality of life. bFor example, a measure of how concentrated the medical care market is. cIf it is not feasible to include entries for each drug, the top 20-30 (by sales) could simply be listed. dThere are many ways to approach which diseases are most important but, again, one simple way is to rank by cost of illness. ePaid amount will be the hardest to get for commercial claims, but for many purposes it is the most important. |
|
diately. The infrastructure will have to grow incrementally, and therefore data collection will have to be prioritized. In addressing how to pick which data to collect from a potentially endless list of factors (health, social, environmental, financial) that may affect current and future health and health care spending, potential criteria for the selection of a set of key indicators include
-
the importance of what is being measured in terms of its impact on health status and health expenditures, the policy relevance, and the susceptibility of the problem to intervention;
-
the scientific soundness of the measure in terms of its validity, reliability, and evidence base; and
-
the feasibility and cost of obtaining nationally comparable data for the measure.
It will be important to develop a consensus on and formalize a set of criteria by which the selection of key data for additional collection, standardization, etc., is prioritized. The development of a functional, policy-responsive, integrated national health data system is clearly a long-term proposition. That said, it is an achievable goal made all the more possible by the ongoing collaborative efforts of the national data agencies. It is the hope of the panel that our full set of recommendations provides a logical set of building blocks that—together but implemented separately—would contribute significantly to a more coherent and policy-responsive system of health statistics.
6.6.6.
Privacy Protection and Confidentiality
The research environment is increasingly complex, both because of rising public concerns about the privacy of individuals’ personal information and because of the complexity and lack of understanding of the legislative and regulatory frameworks guiding the conduct of research using such personal information. Since the passing of HIPAA in 1996, there has been considerable confusion over how the patient privacy rules affect quality improvement studies. From a legal standpoint, HIPAA rules do not apply equally to everyone. Public health authorities can access patient data without consent in their efforts to prevent disease outbreaks, and hospitals can use data to improve quality of care. The problem, however, lies in defining the boundaries of these activities. When is quality improvement clinical care, and when is it research? To cite one among countless examples, is a study of an intervention to estimate the reduction in rates of catheter-related bloodstream infection (Pronovost et al., 2006) simply research or is it part of care? The problem is that the line is not clearly drawn, and immediate concerns over privacy seem to supersede the longer term needs for research. At a 2003 NSF workshop on confidentiality research, Peter Madsen described this tension as the “Privacy Paradox”:
The rush to ensure complete levels of privacy in the research context paradoxically results in less social benefit, rather than in more…. [T]hrough the additional concept of utility, people will recognize that while they surely have the right to privacy, they may also come to the realization that they have a duty to share information, if the common good is to be furthered.
In addressing HIPAA challenges to research, a balance must be struck between the public’s right to know and to pursue improved health care and the right of individuals and institutions to protect their privacy.
The Institute of Medicine recently concluded that the HIPAA privacy rule is not only inadequate in safeguarding patient privacy, but also significantly impedes secondary research (Institute of Medicine, 2009). Privacy and the safeguarding of personal information against unauthorized disclosure are fundamental individual
goods in terms of respecting personal dignity and protecting patients from discrimination. Privacy also holds societal value because it encourages individuals to participate in socially desirable activities like research. At the same time, research is an equally compelling individual and societal good that can help address some of the nation’s most pressing health problems. Indeed, research on the determinants of health can help guide national efforts to focus life-saving interventions where they can do the most good in terms of improving individual and public health (Gostin and Nass, 2009).
Although informed consent is meant as a safeguard, it can also be a barrier to valuable research. The Institute of Medicine has proposed new rules that would make health research exempt from HIPAA privacy rules and emphasize data security, transparency, and accountability, regardless of the funding source. The proposed rules would add consistency in regulatory oversight and ensure protection of participants. In addition, the new system would include two alternatives to consent: (1) a system with ethical oversight to protect data privacy and security and (2) a certification system that would allow researchers to link deidentified data sets. The panel supports these recommendations.


