
1
Study Charge and Background
The Federal Aviation Administration (FAA) is responsible for designing and operating the national airspace system (NAS). The NAS consists of terminal and en route airspace and a complex network of navigation, surveillance, and communications systems used to guide and control aircraft traffic within this airspace and on the ground at airports. FAA’s workforce of about 15,700 air traffic controllers, working in more than 300 facilities across the country, directs the more than 50,000 aircraft operations that occur each day in the NAS. A key component of this workforce is the approximately 5,000 controllers who work in the 20 en route facilities that separate and direct aircraft operating in the air routes not assigned to towers, terminal facilities, and the military.
FAA is expected to provide safe, orderly, and efficient air traffic control services while meeting resource and budgetary constraints. To ensure efficient provision of these services, the agency needs good information to support decisions on the hiring, training, and deployment of controllers across its many air traffic control facilities. For many years, FAA’s decisions on controller staffing have been informed by an array of data sources and methods that have at times come under scrutiny. In particular, FAA has been asked to explain and justify the variability in controller staffing levels found across its facilities. In 1995, Congress sought an independent assessment of these methods for use in planning controller staffing in the individual control facilities. A special committee of the Transportation Research Board (TRB) was formed to conduct that earlier study, whose recommendations prompted FAA to develop further the model that is the subject of this follow-on study.1
During the 1990s, FAA’s staffing models were used mainly to develop national workforce targets for general budgetary decisions. Regional offices generated their own estimates of the number of controllers required per facility. FAA recognized that its national staffing models were too generalized and imprecise to predict staffing needs at each facility. Its models were built on highly aggregated data derived from a small number of sampled sectors and control centers. While considered adequate for generating systemwide estimates of workforce needs, the models lacked the detail needed to inform facility-level planning.
Acknowledging that FAA’s staffing models were not designed to inform facility-level staffing plans, the 1997 TRB study committee nevertheless questioned the models’ use of simple counts of the number of flights traversing a block of airspace as the main indicator of traffic demand on controlling capacity. FAA found that these volume-based measures generated staffing values that were much higher than facility managers believed were reasonable on the basis of demonstrated experience. In particular, the measures did not take into account how the complexity of traffic activity, in addition to its quantity, affects controlling capacity. The committee observed, for instance, that the models employed data on various controller actions that could be readily observed and timed, such as scanning a radar screen, typing on a keyboard, and radioing a pilot. These identified controller actions, however, were not linked to the specific tasks performed by controllers working different types of aircraft activity; for instance, a flight entering the air-space requires the controller to accept the hand-off from another controller, whereas a flight that is changing heading or altitude requires the controller to perform various checks and clearances. Establishing these connections between traffic activity and the actions that controllers must take in response was viewed as critical to developing more accurate estimates of the time demands on controllers.
In particular, the TRB committee recommended that FAA try to quantify the time controllers spend performing specific tasks as they monitor, inform, and direct the actions of aircraft. By modeling traffic activity and coupling this activity with time-varying controller tasks that must be performed in response, FAA could then estimate the total time spent executing tasks, referred to here as “task load.” The TRB commit-
tee observed that such task load estimates could be used for assessing the number of controllers needed to work given levels and patterns of traffic demand.
In the early 2000s, MITRE Corporation’s Center for Advanced Aviation System Development (CAASD), a federally funded research and development center, happened to be developing a task-based model for analyzing the traffic capacity of en route sectors. Understanding controller time demands is important for assessing traffic capacity, since the maximum number of aircraft that can safely traverse a sector in a given time period is constrained by controlling capacity, or the total time available to controllers to work the traffic. The CAASD model used historical flight operations and planning data to simulate the traffic levels and patterns of activity experienced in individual sectors. Sectors experiencing more complex traffic patterns, which require more time-intensive controller tasks per flight, were assumed to reach their maximum traffic capacity with fewer total flights than those sectors experiencing more straightforward traffic patterns. In this way, the model could estimate the real, controller-constrained traffic capacity of each en route sector at different points in time.
In light of the recommendations of the TRB study, FAA asked CAASD to investigate whether its capacity-oriented task load model could also be used to estimate the number of controllers that were needed in position to work each sector’s experienced traffic activity. By generating such retrospective estimates of “positions to traffic” (PTT), FAA believed the model could help inform staffing plans for each en route center.
How the model was adapted to meeting these needs is explained and reviewed in this report. Generally satisfied with the early results of the model’s adaptations for PTT estimation, FAA has been using the modeling results since 2007 to inform the en route portion of its annual controller workforce plan (CWP). The CWP projects the total controller workforce needed for the next decade.2 It also provides annual staffing ranges for each traffic control facility. These facility-level ranges are developed through a multistep process, as explained in Box 1-1, that considers past facility productivity, the performance of other peer facilities,
|
2 |
Air Traffic Control Workforce Plan. http://www.faa.gov/air_traffic/publications/controller_staffing. |
|
BOX 1-1 FAA Process for Projecting Facility Staffing Ranges (from 2010 Controller Workforce Plan) The FAA uses the following four information sources to estimate facility staffing ranges:
The average of these data is calculated, rounded to the nearest whole number, multiplied by 0.9 and 1.1, and then rounded again to determine the high and low points in the facility staffing range. Exceptional situations, or outliers, are removed from the averages (for example, if a change in the type or level of a facility occurred over the period of evaluation). By analyzing the remaining data points, staffing ranges are generated for each facility. The agency’s hiring and staffing plans consider all of these inputs as well as other considerations such as time on position and overtime. All of these data points are reviewed collectively and adjustments are made to facility staffing plans during the year as necessary. |
consultations with field managers, and a set of quantitative models that are referred to collectively as “staffing standards.”
The CAASD model is one of the three quantitative models that make up FAA’s staffing standards. The two others forecast future traffic levels and calculate staffing needs after making allowances for vacation, training, and work rules (e.g., required work breaks). Although FAA has been using the CAASD model to inform CWP projections for several years, the agency would like to continue doing so with even higher confidence. The agency therefore asked TRB for this follow-on study of the model and its utility for estimating PTT.
As detailed in Box 1-2, the study’s charge calls for a review of the model’s technical approach, to include the assumptions, methods, and data used for profiling traffic activity, triggering tasks, assigning task execution times, and calibrating and evaluating model parameters and results. The charge also asks for advice on how the model can be adapted to an evolving air traffic control system in a next-generation air transportation environment—one in which air traffic controller technologies and procedures may change significantly to create new controller roles, tasks, and performance capabilities.
REPORT ORGANIZATION
As background for the study, the next section describes the en route domain and role of the controllers in managing the traffic in each en route sector. Chapter 2 provides an overview of the modeling effort, including the main assumptions and basic structure of the CAASD task load model and the methods used to convert its output into estimates of PTT. Chapter 3 describes in more detail the individual elements of the model, including the modeled tasks, events that trigger them, and methods used to derive task execution times. It concludes with the committee’s assessment of these model elements and efforts to check their accuracy and that of the modeled task load. Chapter 4 provides a detailed description of the methods used to convert task load estimates into PTT. It concludes with the committee’s assessment of these conversion methods and checks on their validity. On the basis of these assessments, Chapter 5 summarizes the main study findings and conclusions relevant to the
|
BOX 1-2 Study Statement of Task The study will provide an expert review of methodologies and modeling capabilities for post facto analysis of en route sector capacity and positions to traffic (PTT) developed by the Federal Aviation Administration’s (FAA) federally funded research and development center, MITRE Corporation’s Center for Advanced Aviation System Development (CAASD). Specifically, the study will offer suggestions where applicable for strengthening the following areas:
|
BACKGROUND ON EN ROUTE AIR TRAFFIC CONTROL
From the towers of approximately 450 airports, local air traffic controllers direct takeoff and landing clearances as well as surface movements between gates, taxiways, and runways. These controllers manage
traffic within approximately 5 miles of the airport up to an altitude of about 3,000 feet. In larger metropolitan areas with multiple busy airports, controllers at terminal radar approach control (TRACON) facilities sequence departing aircraft from takeoff to transition altitude and arriving aircraft during descent.3
Once at higher altitude, transiting aircraft are monitored with radar and directed by controllers located in the 20 air route traffic control centers (ARTCCs) located across the continental United States. Each center is responsible for traffic operating in the airspace over a specific region of the country, and some also control aircraft operating over the ocean. The air-space managed by each of these centers usually covers portions of several states, typically covering 60,000 to 350,000 square miles (see Figure 1-1).
En route controllers strive to maintain a safe separation between transiting aircraft as they accept traffic from and pass traffic to other controllers at centers or terminal facilities. They communicate over voice and data channels with pilots and other controllers. Through radar surveillance and radio communications, they also provide pilots with traffic and weather advisory information. En route controllers also direct approaches to airports that do not have operational towers.
Each en route center employs between 100 and 350 controllers, with most employing 200 to 275. A controller is certified to direct traffic only within defined areas of specialization. Most centers consist of four to eight areas. Each area is typically responsible for a slice of airspace that is divided into five to nine sectors of low, high, and ultrahigh airspace (see Figure 1-2). The sectors vary in size from 500 to more than 30,000 cubic miles. There are more than 750 sectors of airspace over the continental United States.
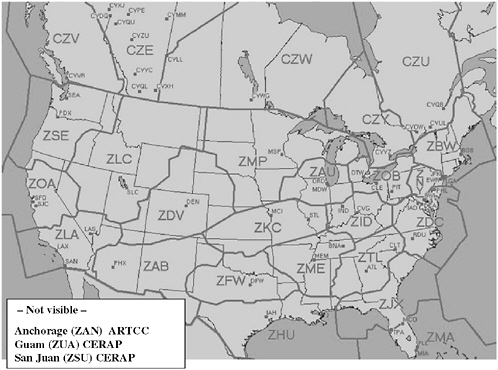
FIGURE 1-1 Boundaries of ARTCCs in the continental United States and parts of Canada. (CERAP = central radar approach.)
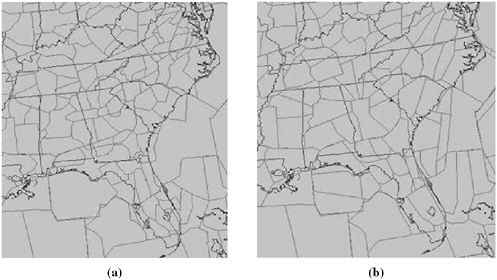
FIGURE 1-2 En route sectors over southeastern United States: (a) low altitude and (b) high altitude. (Note: Low sectors are surface to 23,000 feet. High sectors are 24,000 to 33,000 feet. Very high—sometimes called superhigh—sectors are 35,000 feet and higher.)
Controllers certified to direct traffic in an area can work traffic in any one of its sectors. If traffic demand decreases—such as during nighttime hours—a controller may be assigned to handle traffic in contiguous sectors that are combined or the entire area may be combined into one large sector. As traffic demand increases, the sectors will be uncombined and additional controllers may be added to each sector. Repeatable traffic patterns due to scheduled commercial flights aid in the planning of such sector assignments on a daily and seasonal basis.
Each sector is typically positioned with one or two controllers. A radar controller, or “R-side” controller, is the lead, responsible for radio communications with aircraft, monitoring the radar screen to maintain safe separation, and communicating with other controllers. All open sectors are staffed with one R-side controller. When two controllers work a sector, the second is an associate controller, known as a data, or D-side, controller. The D-side controller typically receives flight-plan information and helps plan and organize the flow of traffic within the sector. In the absence of a D-side controller, the R-side controller must handle these D-side responsibilities along with R-side responsibilities. During exceptionally busy periods, a third controller (T-side) may be assigned to the team, although three-member teams are not typically planned for.


