
3
Task Load Model
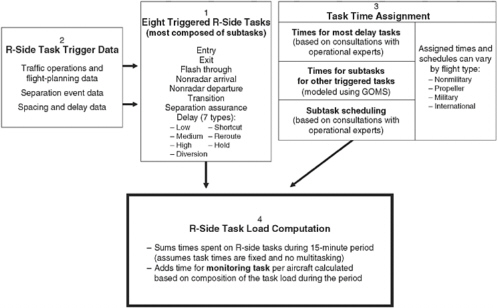
As shown in Figure 3-1, the task load model consists of four basic data and modeling components:
-
A defined set of R-side tasks performed by a controller when working traffic in a sector;
-
Analyses of traffic operations and flight-planning data to simulate the traffic activity in a sector during a time period and to indicate traffic events that trigger the occurrence of one or more of the defined R-side tasks;
-
The calculation and assignment of time spent by the R-side controller in performing each triggered task; and
-
Computation of total task load by summing the time spent by the R-side controller on these triggered tasks plus some additional time spent by the controller in monitoring the radar screen for all flights transiting the sector.
Explanations of each of these components are provided in this chapter along with a summary of the description by the Center for Advanced Aviation System Development (CAASD) of its efforts to evaluate and validate the traffic simulations, key model parameters such as task times, and the task load output from the model. The chapter concludes with the committee’s assessment of each modeling element, including evaluation and validation efforts.
TASKS IN MODEL
Eight Triggered Tasks
Each of the triggered tasks is associated with the action of an aircraft under the control of a sector. In most cases, “tasks” are actually aircraft
actions, or events, that require the lead controller to execute a series of procedures. For example, an aircraft entering a sector is referred to as an entry task. When an entry occurs, the lead controller must take a number of actions that involve verbal communication with the pilot and other controllers, such as identifying the aircraft, establishing a clearance plan, and accepting the hand-off. Only the R-side procedures handled by the lead controller are included in the model. For reasons explained in Chapter 2, the CAASD model does not estimate D-side task load.
The eight tasks in the model that are triggered by traffic activity are the following:
-
Entry, which encompasses the actions that the R-side controller must take in accepting the hand-off of an aircraft from another sector. Three types of hand-offs are distinguished in the model: those involving aircraft entering from international airspace, from a sector controlled by a different en route center, and from a sector controlled by the same center. Hand-offs are differentiated in this way in order to associate different task times with each.
-
Exit, which encompasses the actions that the R-side controller takes in handing off an aircraft to a downstream sector. Hand-offs are differentiated in the same manner as for the entry task.
-
Flash through is an entry in which the R-side controller handles the aircraft for less than 2 minutes. If after accepting the hand-off of an aircraft from an upstream sector, the controller determines that communication with the aircraft is not needed (e.g., the aircraft will be in the sector for a very short time and is separated from other aircraft), the controller will hand off the aircraft to the downstream sector without ever communicating with the pilot. The upstream sector controller will instruct the pilot to tune to the downstream sector’s radio frequency. Because the flash through task entails less work than the full entry task, the assigned task time is less than that for the entry task.
-
Nonradar arrival includes the actions taken by the R-side controller to provide services to aircraft arriving at an airport not offered the full range of radar services.
-
Nonradar departure includes the actions taken by the R-side controller to provide services to aircraft departing from an airport not offered the full range of radar services.
-
Transition consists of the actions performed by the R-side controller in clearing an aircraft to climb or descend and monitoring the aircraft to ensure that it is separated from other aircraft during the altitude transition.
-
Separation assurance requires the R-side controller to identify aircraft pairs that are projected to lose lateral and vertical separation, determine a maneuver to ensure that separation will not be lost, and issue the maneuver clearance. Identification of this task does not mean that the aircraft pair has lost separation, only that a controller’s attention was likely drawn to the pair to ensure separation.
-
Delay involves the vectoring performed by the R-side controller for traffic separation and coordination such as merging aircraft in a stream. It also involves other controller actions that increase (delay) or decrease (cut short) the amount of time that aircraft are controlled by the sector such as holding, rerouting, and diversion.
All eight of these tasks are triggered in the model by a specific aircraft action, or event, that can be identified through the flight data that are used to simulate the traffic experienced in each sector for given time periods. The one modeled R-side task that is omitted from this list is a more generalized task referred to as “monitoring.” This task entails scanning the radar display to maintain situational awareness and ensure that aircraft are following their clearances. All aircraft that transit the sector are assumed to require some amount of monitoring by the R-side controller. The modeling of the monitoring task is explained later in the discussion of task time derivation.
According to CAASD, these nine tasks are the main contributors to the lead controller’s R-side task load. The committee was told that they represent about 90 percent of the R-side tasks performed based on CAASD’s review of the literature and consultations with controller personnel and other subject matter experts.
TRAFFIC SIMULATIONS AND TASK TRIGGERS
Data Sources
The two sources of flight data used to simulate traffic and trigger tasks are the National Offload Program (NOP) and the CAASD Analysis Platform for En Route (CAPER). NOP is a collection of messages generated
by each en route center’s host computer system as traffic is worked through the center. It provides aircraft and sector identification, hand-off time, altitude, equipment type, origin, and destination. These data are used to trigger entries, exits, flash throughs, transitions, and nonradar arrivals and departures. NOP messages also provide the flight and equipment information needed to determine whether the flight is a military operation, which are allowed higher times for some tasks (as explained later).
Because FAA does not currently maintain an operations data set that contains information to trigger separation and delay tasks, CAASD uses its own analytic model to develop this information. By analyzing flight-plan and tracking data from FAA’s Traffic Flow Management System, CAPER produces a four-dimensional projection of the path of an aircraft flying through the airspace from departure to arrival with associated transit times. Separation events are identified for aircraft pairs when the CAPER-modeled positions of two aircraft are predicted to come within a set of lateral and vertical threshold parameters. These parameters have been set to identify situations that would likely have drawn the attention of the R-side controller to ensure separation.1
The CAPER model is also used to trigger the reroute and hold delay tasks. It does this by capturing the change in the estimated time of arrival (ETA) as a flight enters and exits a sector. CAPER records relevant data for all active flights each time their modeled trajectories are updated. This process creates a historical record of the change in ETA for each flight including the time stamp for when the trajectory was updated and the reason for the update. For instance, a flight may enter a sector with an ETA of 1:00 p.m.; however, while it transits the sector it is vectored to provide the spacing needed to manage the traffic flows in a downstream sector. The extra time taken to vector is 5 minutes, and thus the ETA indicated upon exit from the sector will show 1:05 p.m. The model infers
the type of action taken by assessing the size of the change in ETA. For instance, a large change in ETA is inferred to be caused by holding rather than a simple rerouting. As explained later, each of these types of delay is assigned a different task time. Finally, changes in flight-plan information are also assessed by CAPER to identify reroutes and diversions.
Evaluation and Calibration of Data Sources
CAASD performs various checks on the simulated traffic and its data sources, particularly the CAPER tool used for separation and delay triggers. The CAPER output, for instance, is routinely examined against recorded weather data to ensure that during known periods of severe weather the sector traffic simulations show an increase in the occurrence of delay tasks from holds, reroutes, and diversions. Likewise, checks are made to ensure that during periods of heavy traffic involving high volumes of crossing and transitioning aircraft the model detects higher levels of the separation-related task load.
When the use of CAPER to trigger separation events was first considered, CAASD compared the separations identified by CAPER for all Indianapolis en route sectors with actual aircraft conflicts identified in the sectors by a prototype of FAA’s URET. Consistency in results led CAASD to conclude that CAPER would generate accurate separation event data for the task load model. Further analyses were performed to calibrate the parameters used by CAPER in detecting separation events. These analyses included the random sampling of URET conflicts and the checking of flight-track histories, flight-plan amendments, and controller–pilot voice recordings. In addition to the CAPER–URET comparisons, CAASD performed sensitivity analyses to evaluate the use of alternative parameter thresholds for lateral and vertical separation minimums as well as the maximum look-ahead time for CAPER to probe flights along their trajectories.
On the basis of these analyses and through an iterative process of calibrating the CAPER trajectory modeler and air-to-air separation probe algorithms, CAASD believes there is a strong correspondence between URET conflicts and CAPER separation events. Similar checks have apparently been performed on CAPER results used for triggering the delay events. In addition, CAASD continues to sample the modeled flights to verify whether the calculated delay is consistent with observed flight
operations. These comparisons with actual traffic observations are used to adjust the CAPER parameters when warranted.
TASK TIMES AND SCHEDULES
Derivation of Task Times
The time assigned to each triggered task is a critical element of the task load model, since the task load output is a time summation. In briefings to the committee, CAASD maintained that it encountered difficulty establishing task times from the literature. Model developers apparently could find little documentation on the task times used in other relevant efforts to model controller task performance, and in the few cases in which task times could be identified, the tasks did not represent the same set of actions or assumptions as those used in the CAASD model. Hence, whereas early versions of the model tried to use literature-based task times—which had to be modified and supplemented by estimates from operational experts—CAASD later concluded that another process was needed to derive these times.
CAASD’s investigation of options for deriving task times led it to select the modeling process known as Goals, Operators, Methods, and Selection Rules (GOMS) to develop many of the task times in the model. GOMS is a type of human information processor model that is used to predict user performance for a given task and to provide an estimate of how much time it takes to accomplish the task. In short, the model assumes that humans pursue tasks according to goals. Each goal is accomplished by employing various “operators” consisting of cognitive processes, perceptions, and motor actions. These operators are sequenced into “methods” that relate how the operators are used to accomplish the goal. Because there can be more than one method for accomplishing a goal, various selection rules (e.g., “if–then” statements) are employed to describe when a user would choose one method over another. In this way, GOMS modeling predicts the time it takes for a person to accomplish a task by associating specific times with each operator and then sequencing them according to the selected method.
Specifically, GOMS-generated task times are used in the CAASD model for the entry, exit, flash through, transition, separation, nonradar,
and shortcut (delay-related) tasks. Accordingly, CAASD had to decompose each of these tasks into constituent subtasks and then further convert each subtask into its execution method and the specific operators involved (e.g., uttering words, pressing keys) as modeled by GOMS. To identify the subtasks and their execution methods and operators, model developers consulted with subject matter experts. The nature of these consultations and the methods used were not documented or explained to the committee other than to describe them as involving an iterative process until experts were satisfied with the decomposition of subtasks into operators. CAASD then simulated the actions for each operator to develop execution times. Documentation on the method of simulation was not provided, although apparently these simulations did not attempt to capture all of the perceptual or cognitive processes that affect execution time, but only the time required to perform motor actions. While CAASD informed the committee that the GOMS estimates do include subtasks such as identification of the problem, priority-ranking of the problem, and generation of a problem resolution, the potential impact on task time estimates from not including the time required for perceptual and cognitive processes was never addressed in depth.
The subtasks associated with each of the eight triggered tasks identified above, and their GOMS-generated execution times, are shown in Tables 3-1 and 3-2. It merits noting that GOMS is not used for most of the delay tasks because model developers could not identify constituent subtasks. Accordingly, CAASD consulted with subject matter experts to establish the times assigned to the delay-related actions of rerouting, holding, and diverting. To establish these times, traffic replays were presented to the experts, who estimated the task completion time. These delay task times range from 25 to 75 seconds.
The consultations with subject matter experts also led CAASD to conclude that the longer task times were needed for certain types of traffic, particularly flights involving propeller and military aircraft. For this particular traffic, assigned task times are increased by 25 percent for entry, exit, and nonradar arrivals and departures, under the assumption that additional communication and coordination are required. Although the validity of this adjustment factor was not researched by the committee, CAASD maintains that it was derived from information in FAA’s Position Classification Standard for Air Traffic Control Series.
TABLE 3-1 Times Assigned to R-Side Tasks and Subtasks
TABLE 3-2 Task Scheduling Distributions
|
Task |
Distribution Minutes |
Distribution Type |
|
Entry |
E to E + 3 |
Quasi-uniform |
|
Exit |
X − 2 to X + 2 |
Custom |
|
Flash through |
E to E + 1 |
Uniform |
|
Transition |
½(E + X) to ½(E + X) + 1 |
Uniform |
|
Nonradar arrival |
E + 4 to X |
Uniform |
|
Nonradar departure |
E − 2 to E + 3 |
Uniform |
|
Separation |
S − 6 to S + 1 |
Quasi-uniform |
|
Delay |
E to X |
Uniform |
|
E = minute of hand-off from upstream sector X = minute of hand-off to downstream sector S = minute separation event begins |
||
To assign times to the monitoring task, CAASD evaluated several alternative approaches. At first, the model assumed that a fixed amount of controller time is spent monitoring each aircraft transiting the sector. However, because some of the task times already presumed a certain amount of monitoring—especially in the case of the time-consuming delay tasks—CAASD was concerned that such a fixed time would lead to double counting and an overestimation of total monitoring task time for some flights. Model developers therefore created an algorithm to produce a monitoring task time for each aircraft transiting a sector. The algorithm assigns a monitoring time per minute a flight is in the sector. The assigned time varies depending on the composition of the R-side task load generated by the flight. Hence, if the flight’s R-side task load consists of many tasks identified as being complex (such as delays that already include a large amount of monitoring time), the algorithm selects a lower monitoring rate per minute because it is assumed that a large amount of monitoring time is already included in the flight’s R-side task load.
Task Scheduling
As discussed earlier, many of the tasks used in model are made up of subtasks. These subtasks are presumed to be performed by the R-side controller in a defined order but interspersed with subtasks being performed for other tasks. Because the model computes task load for 1-minute intervals to obtain rolling 15-minute task load estimates, CAASD needed
a method for distributing the subtasks over the entire span it takes to complete the full task. The model therefore sequences subtasks in a pattern that is thought to be typical for the task and over a completion period that is considered typical.2 These sequencing and scheduling profiles, which are shown in Tables 3-1 and 3-2, were determined through consultations with subject matter experts.
As shown in Table 3-2, the entry, exit, and separation tasks are assumed to have nonuniform distributions, since the majority of the task time is scheduled at the point when the task is triggered. Time for transition, flash through, and delay tasks is uniformly distributed over the life of the flight in the sector. The time for nonradar arrivals and departures is uniformly distributed on the basis of the entry time identified by the trigger.
Evaluation of Task Times
CAASD selected GOMS to model task times because it was viewed as providing efficiency and flexibility, since the time estimate can be calculated with relatively little effort if the operators and methods are known and accurate operator time data are available. In discussion with model developers, committee members noted that GOMS models are more commonly used to assess user performance across various prototype products and systems in which there are few practical opportunities for direct observation of human performance in operational or experimental settings, such as evaluating alternative workstation layouts and computer interfaces. When questioned about the applicability of GOMS to the air traffic control environment—which is an observable operational setting—the model developers restated their belief that GOMS offers the needed efficiency and flexibility and provided the 12 literature sources identified in Box 3-1
TABLE 3-3 Comparison of GOMS and HITL Operator Times by Data Source and Operator
|
|
GOMS |
HITL Average |
HITL Standard Deviation |
GOMS Value as a Percent of HITL Average |
|
Syllable utterance |
150 ms |
187 ms |
12.3 ms |
80.2 |
|
Keystroke |
280 ms |
247 ms |
25.7 ms |
88.2 |
|
Fixation |
500 ms |
542 ms |
117.3 ms |
92.3 |
|
ms = milliseconds. SOURCE: CAASD submission to committee. |
||||
as containing examples of previous research supporting the use of GOMS for modeling task times in situations similar the air traffic control domain. While the committee did not review each of these sources, it notes that only a few (4 of the 12) appear to involve air traffic control tasks.
Questioned on how the GOMS times were validated, CAASD pointed to the limited comparisons that have been made with experimental data from human-in-the-loop (HITL) experiments conducted in 2008 by FAA. As shown in Tables 3-3 and 3-4, when the GOMS operator times are compared with the HITL times, the former are found to be 10 to 20 percent lower than the latter. According to CAASD, these GOMS error rates are comparable with GOMS error rates generally, as observed from the literature cited in Box 3-1.
However, because the FAA HITL experiments were not conducted for the specific purpose of developing model times, they could only be used to assess some of the task times. CAASD has therefore consulted with
TABLE 3-4 Comparison of GOMS and HITL Times: Times Aggregated to Task Level with Typical Usage*
|
BOX 3-1 Sources Cited by CAASD in Support of Using GOMS Modeling for Deriving Controller Task Times* Card, S., T. P. Moran, and A. Newell. 1983. The Psychology of Human–Computer Interaction. Lawrence Erlbaum Associates, Mahway, N.J. Endestad, T., and P. Meyer. 1993. GOMS Analysis as an Evaluation Tool in Process Control: An Evaluation of the ISACS-1 Prototype and the COPMA System. Technical Report HWR-349. Organization for Economic Cooperation and Development Halden Reactor Project. Institute for Energiteknikk, Halden, Norway. Estes, S., C. Bonaceto, K. Long, S. Mills, and F. Sogandares. 2009. Carbon Copy: The Benefits of Autonomous Cognitive Models of Air Traffic Controllers in Large-Scale Simulations. In Proceedings of the 8th USA/Europe Air Traffic Management Research and Development Seminar, Napa, Calif. Gong, R. 1993. Validating and Refining the GOMS Model Methodology for Software User Interface Design and Evaluation. PhD dissertation. University of Michigan, Ann Arbor. Gray, W. D., B. E. John, and M. E. Atwood. 1993. Project Ernestine: A Validation of GOMS for Prediction. Human–Computer Interaction, Vol. 8, No. 3, pp. 237–309. Irving, S., P. Polson, and J. E. Irving. 1994. A GOMS Analysis of the Advanced Automated Cockpit. In Proceedings of the SIGCHI Conference on Human Factors in Computing Systems: Celebrating Interdependence, April 24–28, Boston, Mass., pp. 344–350. Kieras, D. E., S. Wood, K. Abotel, and A. Hornof. 1995. GLEAN: A Computer-Based Tool for Rapid GOMS Model Usability Evaluation of User Interface Designs. In Proceedings of the 8th Annual Association for Computing Machinery (ACM) Symposium on User Interface and Software Technology, Nov. 15–17, Pittsburgh, Pa., pp. 91–100. Lee, A. 1992. Accuracy of MHP/GOMS Predictions for the Task of Issuing Recurrent Commands. In ACM–Special Interest Group on Human–Computer Interaction (SIGCHI) Conference on Human Factors in Computing Systems, Monterey, Calif., pp. 105–106. |
|
Lee, S. M., U. Ravinder, and J. C. Johnston. 2005. Developing an Agent Model of Human Performance in Air Traffic Control Using APEX Cognitive Architecture. In Proceedings of the 2005 Winter Simulation Conference, Orlando, Fla., Vols. 1–4, pp. 979–987. Nesbitt, K., D. Gorton, and J. Rantanen. 1994. A Case Study of GOMS Analysis: Extension of User Interfaces. Technical Report BHPR/ETR/R/94/048. New-castle Laboratories, Wallsend, New South Wales, Australia. Ravinder, U., R. W. Remington, and S. Lee. 2005. A Reactive Computational Model of En-Route Controller. In Proceedings of the 2005 IEEE International Conference on Systems, Man and Cybernetics, Oct. 10–12, Waikoloa, Hawaii, pp. 1628–1633. Smith, E. C. 2008. Flight Management System Execution Task Time Modeling for Loading Terminal Area Navigation Procedure Changes. In Proceedings of the Human Factors and Ergonomics Society 52nd Annual Meeting, Vol. 52, No. 13, pp. 912–916. |
operational experts to obtain their opinions on the validity of the GOMS times. Although the nature of these consultations was not explained, they apparently led CAASD to conclude that the GOMS times are generally reasonable but require some adjustment to represent the times associated with speaking, which the experts thought were too high. The experts consulted also raised questions about the model’s basic assumption that tasks are performed sequentially rather than in parallel in some instances.
When the committee asked about the possibility of performing dedicated HITL experiments, CAASD agreed that doing so could yield a rich array of information but restated the concern that the experiments can be time-consuming and expensive. Model developers reported that they are continuing to evaluate the 2008 HITL data to assess the prevalence
of multitasking and to research the GOMS speech operator to make it produce times that are closer to those indicated by the HITL data and the judgment of consulted experts. In general, CAASD believes the future use of HITL experiments will be confined to the development and validation of a select number of task performance times because of the perceived time and expense of conducting such experiments.
TASK LOAD COMPUTATION
Rollup to Task Load
As previously discussed, the task times are scheduled in 1-minute intervals. The model processes the 1-minute intervals with the output rolled up to a larger time interval, typically 15 minutes. The processing that the model performs to roll up 1-minute task load is summarized by the following equation:
where
Wn = 15-minute workload at minute n, and
wijk = 1-minute workload at minute i due to task j being performed in service of aircraft k.
The task load output is computed by summing all of the time spent on R-side tasks during the measured period. In theory, the highest value for R-side task load for a 15-minute period is 900 seconds (15 minutes times 60 seconds/minute), assuming (unrealistically) that a controller can effectively use all 900 seconds of available time and that a second controller is handling the D-side task load. As discussed in Chapter 4, when the task load rollup exceeds a certain threshold (around 600 seconds), it is assumed that two controllers are working the traffic.
Evaluation of Task Load Rollups
At various stages in the development of the model, CAASD has undertaken evaluations of its task load output for accuracy. Early evaluations,
including the one described in Box 3-2, suggested that the results of the model were a major improvement over the volume-based (aircraft count) metrics that had been used previously to inform controller staffing requirements. These initial evaluations caused FAA to favor the task-based approach over the earlier methods.
In more recent evaluations, CAASD once again turned to experts for their opinions on the task load output. In 2006, CAASD assembled a group of front-line managers from 10 en route centers.3 Each manager was briefed on the background, objectives, and outputs of the task load model. Before the model results were presented, the managers were asked to rank their respective sectors by traffic complexity. The rankings were then compared with the rankings of the same sectors based on the traffic simulations and task loads generated by the model. The participants were asked if the model’s results were accurate in characterizing the individual sectors in terms of typical traffic volume and types of activity (e.g., prevalence of separations, delays, transitions). According to CAASD, for most of the sectors the managers responded that the model results closely matched their own perception of sector traffic complexity.
Although based on perceptions, these assessments were used by CAASD as guidance in making further refinements to elements of the model, particularly the delay task. The evaluations were also one of the factors that caused CAASD to seek additional information to represent international flights and flights to and from airports with no radar services.
COMMITTEE ASSESSMENT
FAA asked the committee to examine the input data and processes used for modeling traffic activity, the tasks and methods used to assign task times, and the means for validating model assumptions, parameters, and output. An assessment of each is offered next.
|
BOX 3-2 CAASD Comparisons of Task Load Output with Results of Dynamic Density Experiments A concept known as dynamic density was critical to the free flight paradigm guiding the planning of the NAS in the late 1990s and early 2000s. The dynamic density concept is built on two of the same basic principles as the CAASD model: (a) complexity affects the capacity of a sector, and (b) complexity is dynamic and changes over the course of a day for a sector. In 2002, the FAA requested that CAASD evaluate the effectiveness of four sets of dynamic density metrics developed by various research organizations for predicting air traffic complexity as perceived by controllers.* To conduct the study, traffic scenarios were evaluated by controllers in HITL experiments at the FAA Technical Center using a rating scale from the National Aeronautics and Space Administration (NASA) known as the Air Traffic Workload Input Technique (ATWIT). Using ATWIT as the basis, controllers were asked to rate their subjective assessment of the complexity level they experienced on a scale of 1 to 7. CAASD leveraged the results from those dynamic density experiments in a 2004 analysis of the task load model, comparing the scores provided in that study with the values generated by running the model with scenario data obtained from the dynamic density HITL experiments. The results of the study indicated that as estimated task load increased, the controller-perceived complexity rating tended to increase as well. While the actual predicted amount of task load was not validated, CAASD believes that the analysis demonstrated consistency between increasing task load and increasing complexity. In addition, CAASD concluded that the results indicated that the output of the model outperformed aircraft count as a predictor of both perceived complexity and the number of required controllers as rated by operational experts involved in the original dynamic density experiments. |
Traffic Modeling
Compared with simple traffic counts, the simulations of traffic in the CAASD model provide a more complete picture of both the volume and nature of traffic activity in the en route sectors. The simulations are developed through an array of traffic operations and flight-planning data that represent opportunistic use of many existing traffic data and modeling tools. The traffic activity is modeled in sufficient depth and resolution to enable reasonable approximations of traffic complexity and associated controller tasks. Because the simulated traffic can be checked against records of actual traffic activity, there is ample opportunity to validate the output accuracy and to guide the development and recalibration of modeling processes and parameters. CAASD appears to have taken advantage of these opportunities to improve the traffic modeling capabilities.
Task Coverage
The nine tasks in the model appear to be representative R-side services that must be performed in response to traffic. However, CAASD’s assertion that the model covers 90 percent of the R-side tasks is not well established. To be sure, all R-side responsibilities are not modeled; for instance, the committee observes that there are no tasks associated with issuing weather and traffic advisories, which is an R-side service. While such unmodeled tasks may or may not have a significant effect on task load, the rationale for their absence and the potential impact on task load need to be addressed.
Compared with the other modeled tasks, monitoring is the most confusing and difficult to connect to traffic activity. Monitoring involves scanning of the radar display by the controller to maintain situational awareness of flights under sector control. The model assumes that monitoring is performed by the R-side controller for all traffic, which is a reasonable assumption. It is assumed further that a certain (but undefined) amount of monitoring is already included in other task times, particularly in the time-consuming delay tasks. CAASD nevertheless added a separate monitoring task so as not to underestimate monitoring, particularly for the most straightforward traffic transiting a sector. While monitoring is an important task, its treatment in the model is confusing and
unconvincing. Since the concern about overestimating monitoring time relates mainly to the delay tasks, a simpler and more transparent treatment would be to define how much monitoring time is already included in these task times.
It is important to keep in mind that the nine tasks in the model represent only the R-side tasks. In considering the scope of R-side services only, the modeled tasks may be adequate in coverage. From the standpoint of estimating PTT, however, the model provides an incomplete picture of controller task load because the modeled tasks are not linked to D-side services. More consideration is given to this shortcoming in the following chapter.
Task Time Derivation
For seven of the nine modeled tasks, GOMS is used to derive task times. The other task times are developed through consultations with subject matter experts. None of the task times is derived from the observation and analysis of controllers performing tasks in the field or in experiments.
CAASD’s comparison of some GOMS and HITL times indicate that the former are 10 to 20 percent lower than the latter. These limited comparisons, however, are the only means by which task times have been evaluated, apart from asking subject matter experts to assess them. CAASD claims the literature lacks relevant task times, prompting it to use GOMS and other means for estimating times. CAASD selected GOMS as a primary method believing it to be an efficient and inexpensive approach, particularly when compared with gathering and analyzing data from operational and experimental settings, such as those for HITL experiments. CAASD believes that GOMS modeling will allow for continued updating of the task times even as controller procedures and capabilities change.
The committee questions the extensive use of GOMS for task time derivation and the complete absence of task times developed through field observation or HITL experiments. GOMS modeling is typically used where there is limited opportunity to observe and analyze task performance in operational or experimental settings. These conditions do not exist in the air traffic control domain. The GOMS-derived times are based largely on expert judgment, and only loosely validated against task
performance data obtained from HITL experiments conducted for other purposes. Given these circumstances, there is no way to know whether the task times used in the model are at all valid.
Computation of Task Load
The addition of task times to calculate R-side task load may be the simplest approach to computing task load while still being reasonable. However, adding task times does not account for the possibility—and real-world probability—that some tasks are performed concurrently and that the time it takes to performs tasks can change depending on the total task load or the number of controllers working the sector. These tenuous assumptions may or may not be critical to the task load results. Examining their potential impact on task load, however, is important for making a convincing case that the assumptions do not represent serious modeling deficiencies. This case has not been made.


