
CHAPTER THREE
Methods of Event Attribution
The findings of event attribution studies are influenced both by how questions about a human or natural influence on an event are asked and by the methods used to answer the questions. A natural first step in event attribution, for example, is to study observations in order to determine the rarity of the event in historical context, or to study the circulation and other aspects of the state of the climate that prevailed when the event occurred. While observations are useful, attribution studies generally use climate models, which incorporate knowledge of the physics of the climate system, to quantify how human or natural influences have changed the frequency or intensity of events like the observed event relative to a baseline forcing scenario. Climate and other numerical models are useful because they can be used to investigate responses to controlled forcing (see conditioning in the previous chapter) and also to generate a larger sample size than is possible from observations—for example, “control” runs of 1,000 years with no changes in greenhouse gas (GHG) forcing. The various options for using observations and models for event attribution are discussed in subsequent sections.
METHODS BASED ON OBSERVATIONS
The Role of Observations
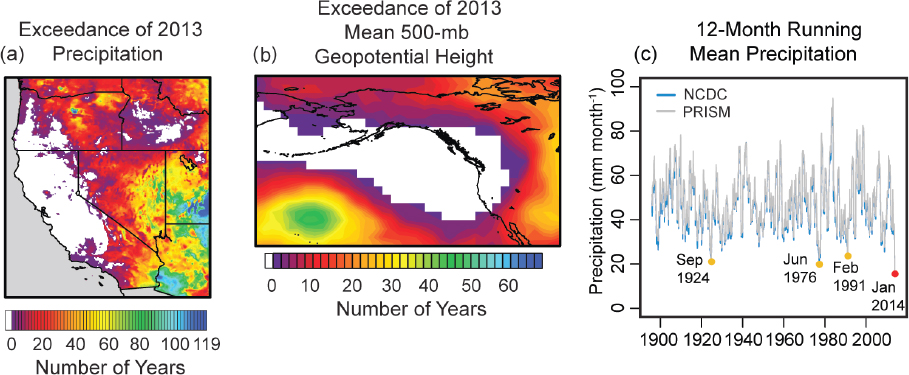
Observations are used to a varying extent in all approaches to event attribution. Many studies determine the rarity of an observed event in the context of long-term historical data, often using statistical methods. For example, Swain and colleagues (2014) fit a statistical distribution to Northeastern Pacific circulation anomalies related to the recent California drought in order to determine that the very persistent ridge type of circulation pattern1 that sustained the drought is extremely rare in the historical context (see Figure 3.1). Also, many studies begin by setting out the dynamic context from observations as an analysis of the combination of factors and events that contributed to the extreme event, and often later as a benchmark for model simulations of similar events (e.g., Hoerling et al., 2013; Pall et al., 2011).
___________________
1 A circulation pattern is an elongated area of relatively high atmospheric pressure; the opposite of trough.
A requirement for the attribution of a change in probability of events to human (or natural) influence is detection of a change either in observations of the event analyzed or in appropriately related climate variables (see Hegerl et al., 2010). In practice, statistically confident detection of a change in the frequency or the intensity of the event type itself is possible only for a subset of event types (the most common example being temperature extremes) because it takes a long observational record and well-observed statistics of extremes to be able to do so (e.g., King et al., 2015). It is often challenging to detect trends because of the limitations of the observational record (both quality and record length). Trend detection is also complicated by unforced natural variability that can cause apparent trends that may last decades.
The limitations of trend detection in the frequency or intensity of extreme events imply that event attribution must often rely on the understanding of long-term changes in variables that have a close physical relationship to the event in question and are expected to affect the frequency or the intensity of the event in question. Such attributed long-term changes could pertain to the mean state of the climate, or to extremes over a larger area, or to a variable that demonstrably contributes to the extreme event, such as higher water availability for extreme rainfall (e.g., Pall et al., 2011). The less direct the relationship is between an attributed human contribution
to change in a climate variable and a type of extreme event, the more results hinge on climate models reliably replicating the effect of human influence, and the less the result is grounded on observations.
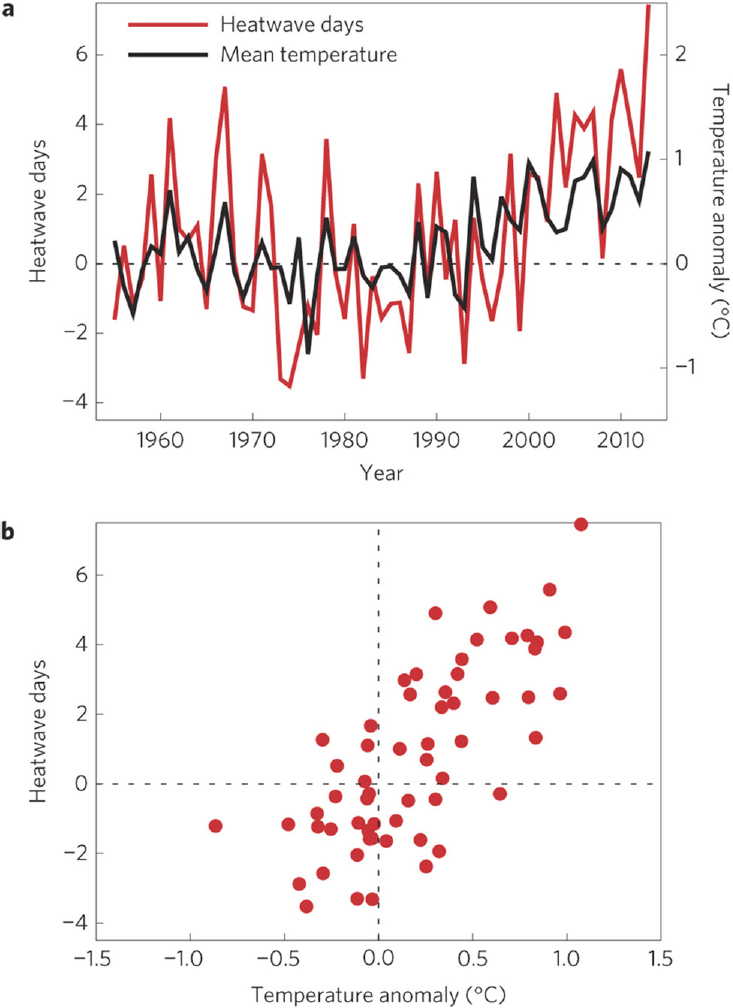
Studies often rely on a scientific understanding of the causes of change in a related aspect of temperature (such as the observed long-term warming of the regional or global climate) where there is little doubt (Bindoff et al., 2013) that there has been significant change due to human activities. These changes in mean conditions then provide a basis for expecting that there also should be related changes in extreme conditions. For instance, a change in extremes at a location may be linked directly to a change in the mean at that same location (see Figures 1.1 and 3.2), and thus, an attributed change in the mean may provide supporting evidence for attribution for the related extremes (e.g., Rahmstorf and Coumou, 2011). Somewhat less directly than is the case with temperature extremes, heavy rainfall is influenced by a moister atmosphere, which has been linked to human influence because it is an expected consequence of a warmer atmosphere (e.g., Bindoff et al., 2013; Santer et al., 2007, 2009). Significant low-frequency natural variability can make it difficult to detect a change due to human influence because the natural variability reduces the signal-to-noise ratio. Similarly, attribution may be complicated by circulation changes that can either strengthen or offset the effects of human influence, and several studies have claimed to find such an effect (Christidis et al., 2015; Herring et al., 2015a; Schaller et al., 2014; Szeto et al., 2015). Tropical cyclone intensity or the probability of severe convective storms are even further removed from temperature, but they have known relationships to large-scale climate parameters whose relationships to climate are somewhat better understood than those of the events themselves.
Event attribution is most reliable when the link to an attributed long-term change is made explicitly and is fairly tightly connected to the event. The attribution of long-term change (e.g., as assessed in Bindoff et al. [2013] and Hegerl et al. [2007]) necessarily involves both observations and models. The link between long-term change and event frequency or intensity may, in some cases, be demonstrated through the use of climate models; in other instances, however, such a link will rely on physical reasoning or conceptual models (e.g., see Hegerl and Zwiers, 2011). The establishment of a strong link may not be possible in all cases, with the result that the link to the observed attributed changes may be fairly indirect in some studies. In principle, the changing probability of a type of event could be evaluated based on climate model simulations in the absence of any trend detection in historical observations, but in most cases confidence would be lower than for attribution of changes that have actually been observed. Also, any positive result from such studies is likely to be challenged, as models are not perfect replications of reality.
Statistical Analysis of Observations
Statistical analysis of observations can be used to quantify the changing probability of specific events even in the absence of the use of climate models. Such approaches are attractive because results hinge neither on the reliability of a particular climate model nor on its ability to simulate the event in question. They do, however, hinge on the availability of long-term, high-quality data. In addition, an observation-based analysis requires a statistical analysis that quantifies changes in extremes over time: for example, the kind of changes that might be expected from GHG or aerosol forcing. In particular, such a statistical model for human influence needs to be strongly supported by understanding of the causes of related changes in the climate system (Hegerl et al., 2010). If this is the case, such studies can be complementary to attribution studies based on climate models.
Statistical Analysis of Observed Change in Events
This type of approach uses historical observations to characterize the distribution of a type of event that is similar to a particular observed event (generally excluding the particular event itself to avoid some aspects of selection bias; see Chapter 2). In order to address the human influence, it identifies a trend or covariate in observed data that may be related to human influences. This approach is justifiable only if there is supporting evidence that the covariate indeed has a causal link to human influences. Otherwise, trends caused by other factors or natural variability may be aliased, leading to either an overestimate or an underestimate of the human influence.
An example of such work is King et al. (2015), who analyze the annual recordings in the Central England Temperature (CET) meteorological dataset and rely on an earlier paper (Karoly and Stott, 2006) that attributes at least part of CET warming to human influences. They fit a generalized Pareto distribution2 (GPD) to the warmest 20% of annual temperatures above a time-varying threshold that increases linearly with CO2 concentration. This statistical model assumes no change in variability in the upper tail of the annual temperature distribution, and it also assumes that the temperature response to rising CO2 is linear. When available evidence points to a strong human contribution to the mean temperature change at that location, as in King et al. (2015), this suggests a two-step attribution (Hegerl et al., 2010) of some of the change in extremes to the human forcing. The fraction of attributable risk (FAR) is calculated based
___________________
2 The generalized Pareto distribution is a statistical distribution used to model exceedances above a specified threshold level.
on the probability of an extreme annual temperature (in particular, exceedance of the second highest annual temperature) for the present compared to the probability for early in the 20th century.
Similarly, van Oldenborgh et al. (2015) apply a generalized extreme value (GEV) distribution3 to seasonal and daily winter minimum temperature from station data in De Bilt, the Netherlands, and Chicago. The study leaves out the extreme event in question (which occurred in 2013/2014 winter in both locations) and allows the GEV location parameter to shift with climate change (represented by global mean temperature). Such an approach allows comparison of the return time of an extreme event between the climate of the 1950s and the present. Results indicate that very cold events have become significantly more rare, and very warm events more frequent. Again, results hinge on the time evolution of global mean temperature being a good approximation to the time evolution (although not magnitude) of the human influence at that location.
Overall, attribution using statistical analysis of observed time series works best for temperature, or variables that are closely related to temperature, as global and many regional results are available that quantify the human contribution to long-term temperature change. For example, regional temperature scales reasonably well with the global temperature evolution on longer timescales for many, but by far not all regions (see Sutton et al., 2015). Studies that rely on such supporting evidence attributing the trend should point this out clearly. It would be preferable if such studies could explicitly include uncertainty in the fraction of trend that is due to human influences in the analysis as well as additional uncertainty due to the indirect relationship of the variable in question to the larger-scale attributed trend. In the example of temperatures in De Bilt, for instance, the human contribution to global mean temperature is a range, not a single value, and uncertainty increases further when going to the regional scale. Any anthropogenic trend may be enhanced or reduced by decadal climate variability (Box 3.1). For example, multidecadal variability can influence regional precipitation patterns and cause apparent trends (Dai, 2013), such as those found for storminess over Great Britain (Alexandersson et al., 2000).
Observed Circulation Analogues
A second approach is based on analysis of the synoptic situation of a given event and looks for historical analogues with similar circulation states (e.g., Cattiaux et al., 2010;
___________________
3 The generalized extreme value is a statistical distribution used to model the extremes of blocks of data of fixed lengths, such as a season or 1 year.
Yiou et al., 2007) in order to determine how meteorologically similar events have changed (e.g., due to the thermodynamic effects of climate change). As such, this approach conditions on a particular synoptic situation (or sequences of situations), although studies also have diagnosed the frequency of circulation states in order to determine if these may explain or counteract any change in extreme events when conditioned (e.g., Cattiaux et al., 2010; see discussion in Chapter 2).
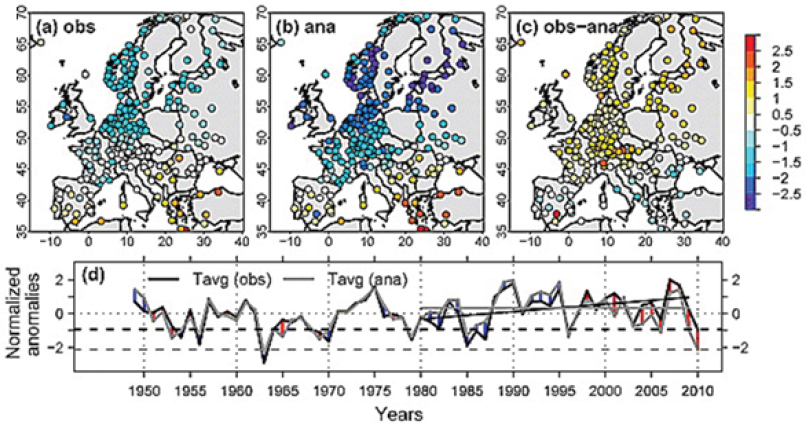
Cattiaux et al. (2010) analyze the synoptic situation of the winter of 2009/2010 in Europe and find that it was less cold than would have been expected based on temperatures from days in earlier winters with similar synoptic situations, particularly given how extreme some of the daily circulation indices were in the winter of 2009/2010. They used several indicators for circulation (e.g., North Atlantic Oscillation [NAO] index and blocking frequency) and selected atmospheric flow analogues for a period around each winter day from the past 61 years. The composite average temperature for these analogues, which were based on prior years, was significantly colder than the 2009/2010 winter mean temperature for most stations (see Figure 3.4). Subtracting the global warming trend from the 2009/2010 winter temperatures yielded similar temperatures to those of the analogues, and no trend was found in synthetic winter temperatures derived from the analogue situations, suggesting that the observed trend is not explained by changes in circulation.
The uncertainties in observation-based analyses are considerable, but they are different and complementary to the uncertainties in attribution approaches that rely strongly on climate models to estimate the difference between present conditions and those that would have occurred without human influences.
METHODS BASED ON CLIMATE AND WEATHER MODELS
In nearly all attribution studies of extreme events, climate and weather models are an indispensable tool. While the specific type and configuration of the model depends on the type of extreme event being studied, most studies use some version of a global atmospheric model. Some also may use one or more coupled climate models (e.g., from the Coupled Model Intercomparison Project Phase 5 [CMIP5] modeling project) or a model that is constructed specifically to represent a particular type of phenomenon, such as tropical cyclones. Such models represent important atmospheric processes, including, among many more, the transport of heat, moisture, and momentum by winds; the interaction of solar and infrared radiation with atmospheric gases and clouds; and the exchange of heat and moisture between the atmosphere and the land or ocean surface.
The advantages of using climate and weather models include the ability to utilize specific input conditions (e.g., sea-surface temperature [SST], levels of atmospheric CO2, or aerosols) and to compare results between simulations using different input conditions, generally for the factual (currently observable) world as it exists in the context of climate change and the hypothetical counterfactual worlds without climate change, to assess changes in event frequency. It is also necessary and useful to repeat the simulation many times (e.g., by making small random perturbations to the initial conditions) in order to generate a larger sample of simulations and thus obtain better estimates of some of the uncertainties and sensitivities involved in event attribution.
Model simulations are well suited to provide quantitative estimates of the degree to which extreme event frequencies or magnitudes in the factual world differ from what would have happened in a world unperturbed by human emissions of GHGs (and other forcing factors; see Chapter 2 for a discussion of framing). It is essential, how-
ever, that any models used for event attribution be able to simulate extreme events reasonably similar to the one that is analyzed. The models also should be carefully evaluated to assess if they correctly reproduce the statistics of extreme events, the specific weather situation leading to events, and local feedbacks that may strengthen events (see Zhang et al., 2014, 2015). It is important to note that evaluating the ability of models to simulate particularly rare events remains a challenge. Reliable simulation of non-extreme events does not necessarily indicate that a model will reliably simulate extreme events. This section describes some specific types or configurations of models and how they have been used in extreme event attribution studies.
Coupled Climate Models
Many studies use coupled climate models, such as the models that participated in CMIP5 (Taylor et al., 2012). Such models incorporate interactive representations of the atmosphere, ocean, sea ice, and the land surface, and often they also include representations of the carbon cycle. CMIP5 and similar earlier experiments are coordinated efforts of modeling groups around the world to provide simulations with global climate models using several scenarios of relevance to extreme event attribution. Some simulations of the recent past (typically 1850-2005) use only estimates of natural forcing such as changes in solar radiation and volcanic eruptions (CMIP5-NAT). Others are run using only anthropogenic forcing (CMIP5-ANT), or only GHG changes (CMIP5GHG), as distinct from anthropogenic forcing that also includes, for example, changes in sulfate aerosol distributions. The most realistic simulations of historic global climate change are usually those that include all of the above (CMIP5-ALL). For simulations covering periods after 2005, extreme event attribution studies usually draw from one or more of the four scenarios of future GHG concentrations known as Representative Concentration Pathways, or RCPs. (Note that differences between scenarios emerge only later in the 21st century, so the scenario choice has little influence for the period between 2006 and the present.) Some modeling groups have provided as many as 40 simulations of the 21st century. Preindustrial control simulations, many several hundred years long, are sometimes used to define the counterfactual world (e.g., Sun et al., 2014), while in other cases CMIP5-NAT simulations are used for this purpose (e.g., King et al., 2015).
Coupled climate models can be used to assess the changes in the likelihood of breaking current regional average monthly or seasonal temperature or rainfall records. The chances of breaking an existing record are compared in the simulated current climate with the chances in the counterfactual world and used to provide a lookup table of the FAR values for whenever a new record is set (Lewis et al., 2014).
Studies using coupled models would typically be considered unconditional attribution studies4 (see Chapter 2) unless the study specifically attempted to control for some feature of the state of the climate system. In the CMIP5 models, SSTs from a given year do not correspond to those observed in that year. Therefore, studies that condition on an observed SST anomaly pattern (conditional attribution; see Chapter 2 and discussion below) do not use CMIP5 outputs. They may, however, use the atmospheric components of coupled models that participated in CMIP5, or higher-resolution atmospheric models that are most closely related to weather prediction models.
It also is possible to use coupled models for conditional attribution studies, such as for El Niño years, by selecting specific years that have the same phase of El Niño as observed (Lewis and Karoly, 2013).
CMIP5 is most suitable for studying extremes with large spatial scale (e.g., heat waves, droughts, and cold events), though other types of studies also have used CMIP5. CMIP5 simulations have two key advantages over atmosphere-only simulations: the inclusion of the oceans, and the large number of simulations already available, which can be used to generate more robust statistics. For example, large multi-model ensembles, on the order of 100 simulations or more, have been used for studies detecting human influence on the frequency of record high CETs, such as occurred in 2014 (King et al., 2015), for study of the California drought (Seager et al., 2015), and for studies of the record warm summer in eastern China in 2013 (Sun et al., 2014).
Atmosphere-Only Models Using Observed SSTs
A second type of model simulation uses an atmospheric general circulation model (GCM) in which the observed historical evolution of SSTs and sea ice extent is specified. These are often called “AMIP” runs5 and are usually coupled to a land model. Specific patterns of SSTs and GHGs (or other boundary conditions) can be imposed, exerting a degree of conditioning on the results that is not present in CMIP simulations. Atmosphere-only model studies are most valuable when the coupling between the ocean and the atmosphere is primarily one-way: that is, when feedbacks of the atmosphere to the ocean can be neglected for the purposes of the phenomenon
___________________
4 Studies using coupled models normally include conditioning on natural external forcing of climate, such as volcanic activity and variations in solar output. This has not been a significant issue since event attribution was proposed simply because we have not seen an explosive volcanic eruption on a scale likely to significantly impact the statistics of weather events. Nevertheless, this will happen eventually, of course.
5 Originally referring to the Atmospheric Model Intercomparison Project, a specific experiment using observed SSTs from 1979 to 1993 (Gates, 1992).
being studied. The number of ensemble members in such studies can vary from a relatively small number of runs for analysis of large-scale events (order 10s of runs, e.g., Funk et al., 2013; Wilcox et al., 2015) to others using large ensembles with 100 or more simulations (e.g., Christidis and Stott, 2012). In some cases, atmospheric model ensemble simulations may consist of many thousands of model runs (e.g., Otto et al., 2015a; Pall et al., 2011; Schaller et al., 2016). Such studies are often facilitated by the climateprediction.net/weather@home infrastructure (see Box 3.4 later in this chapter). Two common features of studies that use very large ensembles is that they are often restricted to a single model, and they use a large number of short simulations (e.g., less than 1 year to perhaps a decade) in contrast to a smaller number of multidecadal or longer simulations.
Three types of perturbations are relevant for generating ensemble members: initial condition, model physics, and SSTs. Initial condition ensembles (the model is run with a variety of slightly different initial conditions at the start) are used in almost all model-based event attribution studies (including unconditional studies using ensembles such as CMIP5) to provide the replication needed to quantify the frequency of events or distribution of event magnitudes. One approach to producing such ensembles is to perturb initial condition using next-day differences from a separate simulation (e.g., see Massey et al., 2014).
Perturbed physics experiments are not generally used in attribution studies—primarily because with a prescribed-SST design, perturbations that do not significantly degrade the model climatology also have been found to have relatively little impact on variables of interest—but they could be. The opportunity for this kind of perturbation arises because processes in the models that occur at scales smaller than the resolved scale are normally approximated using information from resolved-scale fields (e.g., temperature, geopotential, winds). These approximations involve adjustable parameters with values determined from empirical studies and usually are fixed for all model runs. Atmospheric convection, which occurs on spatial scales of a few kilometers, is an example of the type of process that must be parameterized in models that have resolutions that are too coarse to allow convection to be well simulated on the explicit model grid. In perturbed physics experiments, these parameters are varied across a range of plausible values. Simulations using particular parameter combinations are evaluated both to determine the realism of the simulated climate compared with observed (20th-century) climate and to span a range of uncertainty in future climate or climate parameters, such as the climate sensitivity (Stainforth et al., 2005).
For attribution experiments, SST perturbations of the counterfactual world are sometimes used as well. Instead of simply using control simulations as in CMIP5, experiments
using fixed SSTs include “counterfactual” SSTs in which an estimate of the anthropogenic contribution to modern SST patterns is subtracted from the observed SSTs (e.g., Pall et al., 2011). Perturbations to the SST patterns are done to assess sensitivity or to quantify uncertainty in event attribution results to the choice of the counterfactual SST. Different climate models generate different patterns of SST changes in response to human influences: for example, because they exhibit different aerosol forcing or cloud feedbacks to warming. The choice of different SST patterns to be removed matters in practice, and this uncertainty is discussed below (e.g., see Figure 3.5). Studies using mul-
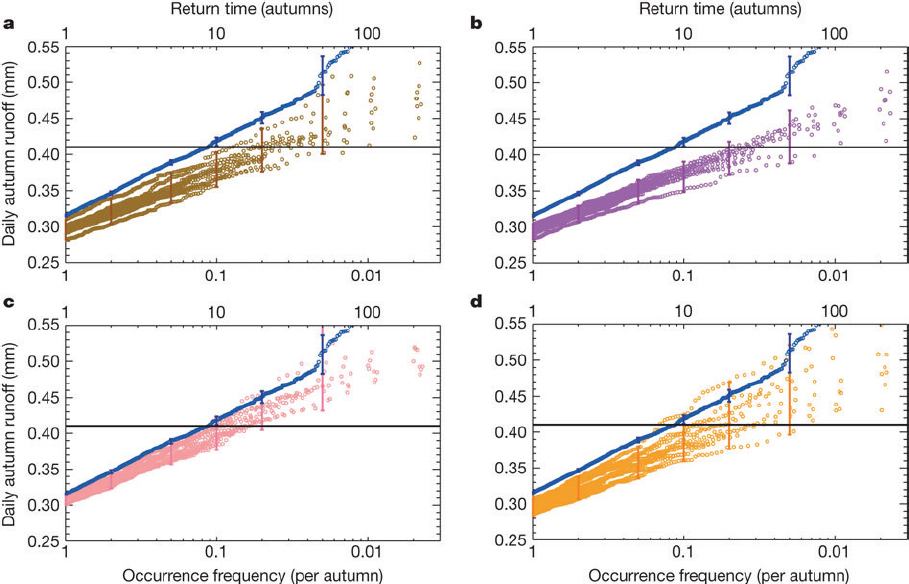
tiple estimates of counterfactual SSTs have employed both global atmospheric models (e.g., Feser et al., 2015b; Massey et al., 2014; Pall et al., 2011; Rupp et al., 2012) and a regional climate model (discussed further in the next subsection) that is nested within a global atmospheric model (e.g., Bergaoui et al., 2015; Black et al., 2015; King et al., 2015).
Studies Conditioning on Seasonal Forecasts
On the seasonal timescale, Hoerling and colleagues (2013), studying the 2011 Texas drought, use the National Oceanic and Atmospheric Administration (NOAA) Climate Forecast System (CFS) initialized at six-hourly intervals starting June 1, 2011, with CO2 concentrations set at either 1988 or modern values, for a total of 240 runs and also additional ensembles of 15 and 24 runs started on the first day of June of each summer between 1981 and 2011. Hence, they explore the impact of the increase in CO2 concentrations since 1988 conditioned on that component of climate variability that was predictable on a seasonal timescale. The weather@home contribution to the near–real-time attribution studies in the World Weather Attribution project also uses an ensemble of seasonal forecast SSTs (from the UK Met Office GLOSEA5 forecast system) to define present-day conditions prior to subtracting a range of signals of anthropogenic warming. In both of these cases, the definition of “present-day conditions” in the conditioning of attribution statements is restricted to the component of present-day weather that is predictable on a seasonal timescale. In many cases, this may be more consistent with the expectations of stakeholders interpreting attribution statements than is conditioning on SSTs precisely as observed.
Downscaling
Some types of extreme events are not well simulated by global models, either coupled or atmosphere-only, often because these models are not run at sufficiently high spatial resolution. Additional models, embedded within a global model to provide large-scale environmental conditions, may be used to represent these events better. Because these models are meant to represent finer scales than the global models in which they are embedded, such methods can be collectively termed “downscaling.” One example is a high-resolution regional atmospheric model that runs on a subset of the global domain and is forced at the lateral boundaries by the global model (e.g., Marthews et al., 2015). Other downscaling models may be designed especially to capture a specific event type. For example, Emanuel (2006) embeds an efficient, idealized tropical cyclone model within large-scale fields obtained from global models. Other downscaling methods are statistical, not involving any dynamic model at all. Examples include environmental
indices used to predict the genesis of tropical cyclones (Emanuel and Nolan, 2004; Tippett et al., 2011) or of tornadoes (Brooks et al., 2003; Diffenbaugh et al., 2013; Tippett et al., 2012; Trapp et al., 2007). These indices are derived from statistical analysis, using observations, of spatio-temporal relationships between large-scale variables and the extreme event in question. As with any other kind of model, it is important to test such specialized models—independently, and in combination with the global climate model as used in any attribution study—in order to determine model adequacy.
Highly Conditioned Simulations
The studies just discussed constrain the state by specifying SST anomaly patterns (or the component thereof that is predictable on a seasonal timescale) for factual and counterfactual world simulations. As discussed in Chapter 2, some approaches provide much stronger constraints on the current state of the climate system than conditioning on SST patterns, corresponding to different framings of the attribution question. Such highly conditioned studies, which are fewer and less well developed than the types discussed above, constrain the initial conditions closely to observed, and perform forecast-type simulations.
Some of these highly conditioned studies use ensembles of forecast simulations in order to improve estimates of uncertainty. Two types of forecasts have been undertaken: (1) weather-type forecasts, over a period of a few days; and (2) seasonal forecasts, over a period of a few months. In the first case, the model must be initialized within the predictability window—that is, only a few days in advance of the event—so that the model may actually simulate the development of the event from the beginning. For example, Meredith and colleagues (2015), who studied the floods that affected the Black Sea town of Krymsk in July 2012, use a triply nested configuration of the Weather Research and Forecasting model, initialized at six-hourly intervals over a 30-hour period (hence 6 runs) for two different SST forcings, for a total of 12 runs. Another recent example is Lackmann (2015), who use a nested modeling approach to study Hurricane Sandy.
Closely related to the forecasting approach, Hannart and colleagues (2015b) recently proposed using a data assimilation system for event attribution. The idea is to define events in a highly specific fashion such that the probability of the event is very small in both the factual and the counterfactual world, which implies that the probability of sufficient causation (Hannart et al., 2015a) also is very small. Such definitions are possible for variables that are measured on continuous scales (e.g., temperature, precipitation, and the central pressure of storm systems), and where differentiation between
minutely different values is at least possible, in principle. For example, the probability of an event defined in terms of maximum temperature that lies within a narrow range of an observed value, Tmax,obs – ε < Tmax < Tmax,obs + ε where ε > 0, converges to zero as ε approaches zero for all values of Tmax,obs even though the probability density function f(Tmax,obs) > 0 for all physically plausible values of Tmax,obs.6 Under these conditions the FAR, which Hannart and colleagues (2015b) relate to the probability of necessary causation, converges to one minus the ratio of probability density functions in the two worlds for the variable defining the event. A data assimilation system (such as an Ensemble Kalman Filter–based system of the type used at many weather forecasting centers) can then be used to estimate these probability density functions.
Development of this idea is currently in its very preliminary stages, but it suggests a path toward operational event attribution that exploits current operational weather forecasting capabilities. It would, however, be restricted to sharply focused event definitions based on quantities that are assimilated in numerical weather prediction systems.
UNCERTAINTIES IN MODEL-BASED STUDIES
Many event attribution methods and analyses rely on estimating event probabilities or distributions of event magnitudes from model simulations. As a result, confidence in attribution results necessarily depends on the skill of the model in simulating the event type under analysis in both of the scenarios. This dependence is well known in the event attribution community (e.g., Christidis et al., 2013b), but emphasis on assessing models varies across attribution studies and may be little recognized among stakeholders, policy makers, and the general public.
Model quality with regard to event attribution requires careful thought. Christidis and colleagues (2013b) contrast the ability of a model to accurately represent the climatology (i.e., the distribution of weather over time) in terms of frequency and climatological features of the event of interest with the model’s predictive skill. They argue that robust event attribution is possible even when only the climatology is well represented. The quality of the model(s) in representing an event or the climatology of an event class is best assessed using the factual simulations, because these are expected to correspond most closely to the observed climate. Even then, however, only limited information is available from observations for extreme events. For instance,
___________________
6 Note that the relationship between the probability of the event Tmax,obs – ε < Tmax < Tmax,obs + ε and the probability density function f(Tmax) is given by P(Tmax,obs – ε < Tmax < Tmax,obs + ε) = ![]()
Stott and colleagues (2004) considered whether the model’s interannual variability corresponded to that of the observations, while Pall and colleagues (2011) considered the model’s quality with respect to dynamic features, and Christidis and colleagues (2013b) considered the reliability of hindcasts.
Such evaluations are necessary, but they are not a sufficient demonstration of model quality. The quantitative correspondence of the statistics of such variables as temperature and precipitation between model output and observations does not necessarily imply that the mechanisms that produce variability and extremes are well represented in the model. Thus, assessment of the model needs to go beyond a quantitative comparison that accounts for sampling uncertainty and must assess key processes that lead to or exacerbate the event.
The quality of a model under the counterfactual scenario may be difficult to evaluate. A counterfactual scenario that describes the present-day climate, absent the influence of anthropogenic forcing but accounting for contemporaneous volcanic and solar forcing, does not exist; thus, its quality is not directly assessable by comparison against observations that have been made under exactly those forcing conditions. In this case, quality can be determined only from the evaluation of model performance under other forcing scenarios for which observational data are available.
Such assessment includes the evaluation of model quality for the factual world with anthropogenic forcing over the past several decades, and it may be based on instrumental data for time periods before extensive anthropogenic influence and possibly using paleoclimatic reconstructions of earlier periods. Also, knowledge of fundamental climate science and of model structure can provide an understanding of what kinds of events may or may not be well characterized by models in terms of the variables that are used to define the events, dependence on circulation patterns, dependence on SSTs, spatial scales, and temporal scales.
As discussed in Chapter 2, a key decision in the framing of a model-based event attribution study is the degree of conditioning that is imposed on the model. The optimal choice of both conditioning and model will depend on the question being addressed and the event under consideration.
Unconditional Attribution
At one level, the most comprehensive and most easily interpretable kind of attribution is unconditional. For this, a model must be both global and coupled to a dynamic ocean. It must then be run for sufficiently long periods to reliably determine the
statistics of the extreme in question: the rarer the extreme, the longer this needs to be. Those two constraints will limit the spatial resolution and the degree of complexity of the model that can be used. In general, at present, models that can be run in this mode will be something like CMIP5-class models (e.g., King et al., 2015; Knutson et al., 2014). The challenging part of this kind of attribution is supporting the assumption that the model is a reliable mimic of reality. Given the known capabilities (and deficiencies) of this class of model, which have been comprehensively assessed in the Intergovernmental Panel on Climate Change (IPCC) reports, this requirement has implications in terms of which kinds of extreme events can be addressed.
Most coupled models exhibit substantial biases in mean climate and variability relative to observations, especially at the regional scale, so some bias correction will almost certainly be required, and the validity of this must be established. Typically, model output is bias corrected by computing anomalies, either by subtracting or by dividing by some climatological mean and potentially adjusting the variance (e.g., Sippel and Otto, 2014). A further intervention requiring even stronger assumptions entails adjustments to quantiles to make the distribution of the model output correspond better to that of the observations (e.g., Edwards et al., 2014). The argument for such adjustments is that a model may reasonably represent long-term climate change but be offset in terms of the magnitudes of variables of interest (e.g., Bindoff et al., 2013). Such adjustments should ideally be founded in physical arguments, because it is not clear what type of evaluation against observations could be done to give confidence to estimated changes in probability or magnitude in such circumstances. Also, it should be recognized that the bias adjustments rely on observations that may be uncertain for a variety of reasons in and of themselves. Sources of observational bias and uncertainty are multiple and include insufficient or changing instrumental coverage; bias from sources such as poor placement of the instrument; inhomogeneity arising for a variety of reasons, including changes in exposure, instrument, observing protocol, and location in the case of in situ observations, and, for example, orbital drift in the case of satellite data; and uncertainty associated with gridding and analysis procedures (see previous section on observational approaches).
Temperature extremes can probably be addressed with some degree of confidence using CMIP5-class models, although there may be challenges for heat extremes where land-atmosphere coupling provides a strong feedback. In contrast, droughts would be somewhat more challenging as they depend on precipitation over land, which models generally find challenging, as well as on the land surface and its feedbacks (Seneviratne et al., 2010). To the extent that both phenomena depend on atmospheric blocking and storm track dynamics, however, these models are unlikely to be fully reliable because they continue to exhibit deficiencies in these phenomena (Flato et al., 2013). Moreover,
events such as large intense storms may not be addressable with such models, because most do not adequately simulate such events (e.g., Seiler and Zwiers, 2015a). In general, such models should be used only to address extremes that are under a strong thermodynamic control. If dynamic processes are the dominant feature of the event, as would be the case for an explosive extratropical storm or a tropical cyclone, then model uncertainty needs to be addressed, and this may be extremely challenging. The effects of dynamic and thermodynamic processes also may be difficult to disentangle—for example, as in a flooding event—because dynamic processes may control the circulation that transports and converges the moisture that produced the flood, while thermodynamic processes may determine the amount of moisture that was actually transported to the drainage basin where the flooding occurred.
Multi-model ensembles can be used for event attribution either in a sensitivity analysis framework, repeating the analysis for each model, or by averaging across models in some fashion. While a multi-model ensemble may have less bias than any single model, when representing both the mean state (e.g., Flato et al., 2013; Gleckler et al., 2008) and the indices of moderate extremes (e.g., Sillmann et al., 2013b), even results averaged across models may be biased relative to the true earth system because of shared inadequacies in their representation of the system. An example is the general equatorward bias in the North Atlantic storm track (Zappa et al., 2013b). In addition, because model ensembles are generally ensembles of opportunity, with some models being closely related (see Knutti et al., 2013), the issue is further complicated. In general, as discussed in the section “Uncertainty Quantification” below, model bias is difficult to quantify, particularly for extremes for which large observational uncertainty hinders the ability to compare to the truth (Kharin et al., 2007, 2013) and even more so for the counterfactual scenario.
Conditional Attribution
In conditional attribution analyses, model quality should ideally be assessed conditionally: Does the model accurately represent the climatology given the forcings and the conditioning factors? And, does it produce extremes similar to the observed event for similar reasons?
Conditioning on Patterns of Sea-Surface Temperatures
The first level of conditioning is by SST anomaly pattern. Because the SST pattern is imposed, an atmospheric model can be used. This has two practical benefits: First,
model biases associated with the ocean state will be mitigated. Second, because only the atmosphere and land surface are simulated, the model can be run for longer periods of time to quantify more extreme statistics, can be run at higher spatial resolution, or can include more complete representations of the land-surface or key model components.
In general, models that can be run in this mode may be something like seasonal-forecast or previous-generation weather-prediction models, which might have better representations of storm track dynamics and moist processes than CMIP5-class models, although often the atmospheric components of CMIP5-class models also are used. Because biases are usually reduced when specifying the ocean state and with potentially better representations of relevant processes, it might be possible to more confidently address some types of drought. Extratropical cyclones also may be addressable at some level. It is unlikely, however, that it would be possible to perform reliable event attribution on tropical storms and intense convective precipitation with such models, even if resolution and the representation of moist processes are somewhat better than for CMIP5 models. Although dynamically driven extremes may be reasonably well represented in such models, the dynamic response of the atmosphere to climate change remains uncertain. This uncertainty must be addressed in any attribution study, which at a minimum argues for using more than one model, although this is often not sufficient (see the section “Uncertainty Quantification” below).
Additional uncertainties arise in studies that condition on the SST patterns. One issue is the uncertainty associated with estimating the counterfactual ocean state. This uncertainty arises because such studies condition on the ocean state in the factual (i.e., currently observable) world, and therefore, they condition on a feature of that world; but one needs a corresponding ocean state in the counterfactual world. Nevertheless, studies that use atmospheric models often use multiple estimates of the ocean warming due to human influences and results—particularly in studies of precipitation—can be surprisingly sensitive to this (see Otto et al., 2015c; Pall et al., 2011; see Figure 3.4). The uncertainty associated with estimating the counterfactual ocean state is driven by the uncertainty in estimating the anthropogenic component of the factual world SSTs, which is performed using regression-based detection and attribution formalisms (e.g., Hegerl and Zwiers, 2011).
A second issue is that the attribution statement comparing the factual and counterfactual worlds depends on the conditioning in this setting; as discussed in Chapter 2, such a conditional analysis does not account for differences in the likelihood of the conditional SST anomaly pattern in the two worlds. Finally, little work has been done to date to understand how attribution statements vary across different possible ocean
states—in particular, different modes of variability (e.g., whether conditional attribution statements would differ markedly under El Niño or La Niña conditions).
One strategy for addressing extremes at smaller scales within this framework is to use regional models embedded within global models (see the section “Downscaling” above). This is a useful strategy for events that are driven by large-scale circulation and can improve the representation of precipitation extremes, particularly when associated with orographic influences. Nevertheless, uncertainties will remain and the gridpoint scale of such a model still cannot be reliably compared to the local scales at which extreme convective events are experienced (Westra et al., 2014).
Other kinds of conditioning on large-scale aspects of the climate state, such as soil-moisture anomalies, sea-ice extent, or stratospheric circulation, would be subject to similar considerations.
Conditioning on the Features of an Event
The options change yet again for conditioning on the space and timescale of a single large storm event, such as one of the named European winter storms or a tropical cyclone, which can be done with data assimilation and/or short-term forecasts. In this case, a high-resolution weather forecast model with a detailed representation of topography—and perhaps even with explicit convection—can be used because the simulations need only be performed for a few days or weeks at most. Thus, tropical storms and severe precipitation events can be studied (see e.g., Lackmann, 2015; Meredith et al., 2015), but tornadoes remain a challenge. Because the factual simulation can now be directly compared with the observed event, in all its relevant details, evaluation of whether the model is fit-for-purpose can be performed at a level that is not possible in frameworks more weakly constrained by observations (i.e., less strongly conditioned). Nevertheless, the description of the counterfactual remains a challenge because it is necessary to determine the anthropogenic component of the thermodynamic conditions relevant for the event; this introduces uncertainties comparable to those of determining the counterfactual ocean state in atmosphere-only model simulations, as discussed above.
In general, uncertainties that result from model skill limitations are difficult to describe precisely and are circumstance specific; these uncertainties are discussed further below.
UNCERTAINTY QUANTIFICATION
Uncertainty arises from many sources; some of this uncertainty is amenable to statistical characterization, while other aspects are difficult to quantify. Sampling uncertainty is the inherent uncertainty from trying to quantify the intensity and frequency of extreme weather or climate events using datasets of limited size from either observations or model ensembles. Additional uncertainties arise from the use of models in event attribution.
Quantifying Sampling Uncertainty
Sampling uncertainty arises from using a dataset of limited size—either an observational dataset or an ensemble of model simulations—to estimate event probabilities or distributions of event magnitudes. In the context of event attribution, the main source of sampling uncertainty is the chaotic unforced variability that is a pervasive feature of the climate system and that is simulated to various extents by climate models, even when run without any type of time-varying natural or anthropogenic external forcing. This can include substantial contributions from the low-frequency natural variability of the climate system (Box 3.1), including the effects of long-term oscillations that may confound the effects of human-induced changes in analyses based on short observational records. Observational uncertainty in the actual state of the climate system caused by datasets of limited size and by errors in measurements can also contribute to sampling uncertainty. Such uncertainty is represented in ensemble observational datasets such as HadCRUT4 (Morice et al., 2012) and ensemble reanalyses such as the 20th Century Reanalysis (Compo et al., 2011).
Quantifying uncertainty because of limited sampling can be addressed using well-established statistical techniques and could be done from either a frequentist or a Bayesian perspective (Box 3.2). The simplest approach is to use the empirical probability, namely, to calculate the proportion of times that the event (often defined based on a given variable exceeding a threshold) occurred. The uncertainty from the difference between this empirical probability and the true underlying probability can be estimated using a variety of standard techniques (Fagerland et al., 2015). With limited data, and when attempting to quantify small probabilities in the tail of a distribution, extreme value methods can be helpful in reducing statistical variability (Coles, 2001; Kharin and Zwiers, 2005). One difficulty that can arise is when the estimated p1 or p0 is 0, which can result in difficulty in quantifying sampling uncertainty in estimates of risk ratio (RR) or FAR as well as FAR values that become uninformative because they saturate near 1 (see Chapter 2). Some statistical techniques can estimate a one-sided
uncertainty interval in such situations (Hansen et al., 2014b), but these have not been part of common practice in event attribution analyses.
In modeling studies, uncertainty from natural variability is accounted for in analyses that use coupled models. Such model simulations sample over the state of the climate system and, if run for sufficiently long or with sufficiently large ensembles, should, in principle, represent the full distribution of natural variability as a component of sampling uncertainty. For a representative sample, however, very long time series may be needed (Wittenberg et al., 2014), and models may not capture dynamics in response to forcing or teleconnections well.
As discussed earlier, observation-based approaches that avoid the use of models often compare a recent time period intended to represent the world under anthropogenic influence to a historical time period (e.g., the early or mid-20th century) with weaker anthropogenic influences (e.g., Hansen et al., 2014b; King et al., 2015; van Oldenborgh et al., 2014) as proxies for the factual and counterfactual scenarios. Sampling uncertainty considerations discussed above apply to estimating probabilities for both time periods. For extreme events, one generally needs adequate replication over time—thus, requiring a long time period—to reduce uncertainty, and uncertainty is often high because of a paucity of data. A statistical bias may arise, however, when using data from long time periods because the climate is not stationary over that period, though some statistical techniques are able to account for some aspects of non-stationarity (King et al., 2015; van Oldenborgh et al., 2015). In addition, uncertainty can be high because the length of the time period under consideration may not represent the full range of natural variability. In the face of natural variability that includes decadal-scale variability that will not be well sampled in most observational samples, it will be difficult even to adequately quantify the uncertainty.
A technical concern with the statistical analyses in the event attribution literature is that studies often mix frequentist and Bayesian perspectives (Box 3.2) and methodologies without a clearly defined probabilistic framework. In particular, analyses often use the well-established bootstrap technique to quantify uncertainty in quantities such as FAR and RR (Christidis et al., 2013b; Pall et al., 2011; Stone and Allen, 2005). The bootstrap is a technique that estimates the sampling distribution of a statistic (Davison and Hinkley, 1997), such as an empirical probability, ![]() . In other words, it quantifies the variability of
. In other words, it quantifies the variability of ![]() (around the true p) that would occur in repeated analyses with statistically equivalent samples of data; this is the “repeated sampling” discussed in Box 3.2. In the most straightforward approach to the bootstrap, this involves resampling with replacement from the data: for example, resampling from the ensemble members in a model-based attribution analysis. This sampling distribution can then be used to es-
(around the true p) that would occur in repeated analyses with statistically equivalent samples of data; this is the “repeated sampling” discussed in Box 3.2. In the most straightforward approach to the bootstrap, this involves resampling with replacement from the data: for example, resampling from the ensemble members in a model-based attribution analysis. This sampling distribution can then be used to es-
timate a standard error or confidence interval. This is a frequentist approach because the sampling distribution is the probability density function (PDF) of the statistic, ![]() , not the PDF of the true value, p. In the frequentist approach, p is not random and therefore cannot have a distribution. Necessarily, only a Bayesian approach can provide a PDF for the true value of the quantity of interest, such as p, FAR, or RR, based on the available observational or modeling data.
, not the PDF of the true value, p. In the frequentist approach, p is not random and therefore cannot have a distribution. Necessarily, only a Bayesian approach can provide a PDF for the true value of the quantity of interest, such as p, FAR, or RR, based on the available observational or modeling data.
Event attribution analyses, however, generally plot the sampling distribution and carry out calculations with it that are presented and interpreted in a Bayesian framework. An early example of this is Stott and colleagues (2004), who report PDFs (they also call these “normalized likelihoods”) for return probability and FAR, where these PDFs are based on the bootstrap and are actually sampling distributions. This interpretation of a sampling distribution as a PDF for the quantity of interest (i.e., as a Bayesian posterior distribution) is akin to the common statistical misinterpretation that a hypothesis test provides a probability that the null hypothesis is true. In certain simple circumstances, the numerical results from interpreting the sampling distribution as a Bayesian posterior coincide with the Bayesian posterior distribution that would have been computed from implementing a Bayesian approach to the problem (Gelman et al., 2013). However, no statistical result shows that this is, in general, the case, so use of the bootstrap to compute results that are then interpreted in a Bayesian fashion is not, in general,
justified by statistical theory. Rather than carrying out a frequentist analysis and giving it a Bayesian interpretation, an analysis that seeks to provide a PDF for a quantity such as FAR or RR should use the Bayesian framework with a stated prior distribution and determine the resulting posterior distribution rather than using the bootstrap. This would require the analyst to specify a prior distribution, which can be difficult to decide on and may be subjective. A frequentist alternative that will often be straightforward to implement is to report a confidence interval calculated using standard statistical methods, such as the bootstrap.
Quantifying Uncertainty in Model-Based Analyses
In studies based on model output, one can quantify sampling uncertainty as described in the previous section, and one can reduce sampling uncertainty as much as desired by using larger ensembles, limited only by computational time and resources. Uncertainty from using a model (or models) to approximate the climate system is difficult to quantify or to reduce, however, although there is a large body of literature on uncertainty quantification for deterministic models (Santer et al., 2003; see also some of the discussion in the section “Uncertainties in Model-Based Studies”). In particular, all models have biases in representing the climate system that carry over into a bias in estimated event probabilities, even for events for which a model is carefully evaluated before its use for event attribution. As discussed further below, bias may be reduced but will not be avoided entirely by using multiple models.
The following sources of uncertainty affect estimates of event probabilities and magnitudes in model-based analyses (Hawkins and Sutton, 2009):
- Boundary condition uncertainty (sometimes called “scenario uncertainty”): This includes aspects of the system that are fixed in the model and therefore not simulated by the model. For example, depending on the model details, this can include some aspects of land-surface characteristics.
- Model uncertainty: This is the uncertainty from the inability of any model to fully represent the system, including uncertainty that arises from the need to parameterize (approximate) the representation of sub-grid scale processes. The nature of this uncertainty will vary with the type of model that is used for event attribution (e.g., ranging from global coupled models, to nested regional climate models, to very-high-resolution convection permitting models).
- Parametric uncertainty: This represents uncertainty in the appropriate values for parameters in the climate model. Parametric uncertainty could be considered to be one component of model uncertainty.
The following are additional sources of uncertainty in conditional analyses:
- Counterfactual boundary condition uncertainty: For the counterfactual scenario, there is uncertainty in boundary conditions such as the SSTs in atmosphere-only model simulations.
- Conditioning uncertainty: This is the uncertainty that arises because conditional results pertain directly only to the state of the system that is conditioned on, such as the SST state in atmosphere-only models. As discussed in Chapter 2, conditional attribution inherently ignores changes in the likelihood of the conditioning state and whether the attribution result would differ when conditioning on other possible states of the system.
Standard statistical analysis is not well suited to deal with these sources of uncertainty, and these uncertainties have not been broadly addressed in the large majority of studies, although some studies have addressed limited aspects of model uncertainty. One approach that can help to characterize the parametric uncertainty component of model uncertainty is the use of perturbed physics ensembles (PPEs) to sample from parameter distributions (e.g., Christidis et al., 2013b). The use of multi-model ensembles can help to characterize model uncertainty, as done in studies using the CMIP5 archive. In addition, some studies have done event attribution with atmosphere-only models using multiple SST patterns meant to quantify the uncertainty related to the state of the system under natural forcings (Christidis et al., 2013a; Pall et al., 2011).
Some studies account for these types of uncertainties by using methods that involve drawing samples. For example, in a PPE, one draws multiple parameter samples and runs a model simulation for each draw of the parameters. In a multi-model ensemble, the simulations available can be viewed as drawing a sample from the space of models. Interpretation, however, of such a sample based on an ensemble of opportunity of climate models—for example, those that participated in CMIP3 or CMIP5—remains a challenging topic (Annan and Hargreaves, 2010; Rougier et al., 2013). Estimation of event probabilities (and derived quantities such as FAR or RR) and uncertainties then proceeds by treating the variability induced by varying the parameters or using multiple models as sampling variability from a frequentist perspective.
While implementation of such a procedure is straightforward computationally, the statistical framework for the interpretation of the results remains underdeveloped and requires careful thought and further research. Such analyses are not easily interpreted from a frequentist statistical perspective because they combine uncertainty from conceptually different sources (e.g., chaotic variability generated spontaneously by the climate system versus deliberate investigator imposed variations of parameter values versus the sequence of difficult to characterize decisions that are made in construct-
ing a given CMIP5 climate model). They might be considered as Bayesian analyses, however, that sample from prior distributions over parameters and/or models (Tebaldi et al., 2005), although this interpretation may require some alteration to the details of the statistical analysis. Finally, it is important to recognize that while a Bayesian analysis quantifies the uncertainty for the given prior distribution (e.g., over parameters or models), results depend on that prior distribution, and the prior distribution may be difficult to characterize.
Such analyses, either frequentist or Bayesian, do not eliminate or quantify statistical bias from systematic differences between model results and the real climate system (see Box 3.3). Because observations are not available to assess the quality of model-based estimates of p0, and they will often be inadequate to assess estimates of p1, it is not possible to determine whether estimates of p1, p0, FAR, and RR are unbiased estimates of their real-world counterparts. Viewed from a Bayesian perspective, the prior distribution over parameters or models is not updated based on observed data as in a standard Bayesian analysis.
This concern about statistical bias can be stated in another way in the context of multi-model analyses. Agreement among models in estimates of p1, p0, FAR, and RR may be considered a necessary, but not sufficient, condition for confidence in an attribution statement because agreement does not limit the possibility of inadequacies and unknown errors that are common among models.
In light of the difficulties that arise in trying to quantify overall uncertainty in model-based analyses, one alternative to formal uncertainty quantification is simple sensitivity analysis that assesses how sensitive the results are to such choices as model or parameter values. For example, certain work in the statistics literature attempts to quantify the extent to which a potential source of bias could change the conclusions of an analysis (e.g., VanderWeele and Arah, 2011). Alternatively, analyses could make use of observations to weight parameter values and models based on a comparison of factual world simulations to observations. Choosing the metric on which to judge the skill of different models remains difficult, however, and rankings of models can vary widely depending on the metric and outcome under consideration (e.g., Flato et al., 2013; Gleckler et al., 2008). Furthermore, such a weighting assumes that it also holds in the counterfactual world. As yet, there has been limited success in identifying “emergent constraints” (e.g., Bracegirdle and Stephenson, 2012; Hall and Qu, 2006) that use observations to identify models that will perform similarly under future forcing, and similar difficulties can be expected when considering model performance in the counterfactual world.
In summary, given the complicated nature of the various sources of uncertainty in model-based analyses, efforts at uncertainty quantification in event attribution analyses mix frequentist and Bayesian ideas and may not carefully define the statistical framework being used. The lack of a defined statistical framework makes it difficult to evaluate the uncertainty statements, yet such evaluation is a critical component of the overall evaluation of event attribution methods. As with operational weather forecasting, it is important to evaluate not just the best estimate in the attribution statement but also the uncertainty stated for that estimate.
THE USE OF MULTIPLE METHODS
Any study on event attribution will be influenced by the way the event is selected and framed, the way uncertainties are estimated and communicated, and the extent to which the model is suitable for purpose. It is clear, however, that satisfyingly addressing uncertainties in all of these aspects is difficult if not impossible. In the absence of being able to do so, some studies have started using multiple, different methods to estimate human influences on a given event. King and colleagues (2015) use an observations-only detection method to estimate changes in return period of an unusually warm year in Central England Temperature (CET), in comparison with a CMIP5 modeling-based approach. The latter approach uses climate model simulations, selecting models that reasonably simulate the variability of CET, and it compares the probability of an anomalously hot year between simulations with natural forcings only and those that include
anthropogenic forcings. Results were not identical but were comparable, and the authors chose to communicate the conservative result. Nevertheless, while unusually hot years are an interesting test bed, they pose greatly reduced difficulties compared to other types of extremes. Hence, multi-approach papers for non-temperature extremes in particular are recommended.
There also are a variety of papers analyzing similar events in the Bulletin of the American Meteorological Society (BAMS) reports (Herring et al., 2014, 2015b), such as multiple analyses of the California drought (Funk et al., 2014; Swain et al., 2014; Wang and Schubert, 2014). The case of the California drought illustrates that careful analysis of contradictory results in particular is required and that using a single study may provide incomplete information: Swain and colleagues (2014) show that the atmospheric conditions, such as the anomalous ridge that contributed to the drought, may have been made more likely due to global warming (at least in CMIP5 models). Thermodynamic changes such as more available water vapor may counteract human influences on circulation (Wang and Schubert, 2014), which means human influences on California precipitation are unclear (all three papers).
Bringing multiple studies together, when there is robust scientific understanding, helps separate results that are reasonably robust from those that are more sensitive to framing and approach.
RAPID ATTRIBUTION AND OPERATIONALIZATION
The media, the public, and decision makers increasingly ask for results from event attribution studies during or directly following an extreme event. To meet this need, some groups are developing rapid and/or operational event attribution systems to provide attribution assessments on faster timescales than the typical research mode timescale, which can often take years (Box 3.4).
Efforts to develop rapid event attribution (hours to days) are often being developed in a research setting by university-based groups because they tend to operate in a reactionary mode and to analyze events that draw interest and that fall within their capabilities.
While some groups are working to provide attribution statements on rapid timescales, a key focus of operational attribution is to provide attribution assessments on seasonal timescales. Operational attribution is defined as a regular activity with well-established protocols to systematically evaluate the causes of extreme events based on predefined and tested methods. It would provide results on a range of timescales:
during and immediately following an event, monthly or seasonally, and for publication in annual assessments (Stott et al., 2015). Such results would be supported by subsequent in-depth study of key events and regular updates on the performance of the event attribution system. By utilizing predetermined, objective event selection criteria, selection bias (see Chapter 2) would be minimized, helping stakeholders understand how individual events fit into the broader picture of climate change (Stott et al., 2015). The nascent efforts to operationalize event attribution employ many of the methods discussed in this chapter.
Objective approaches to compare and contrast the analyses among multiple different research groups based on agreed event selection criteria are yet to be developed, although the annual BAMS special issues on event attribution (Herring et al., 2014, 2015b; Peterson et al., 2012, 2013a) could be considered an initial step in the ongoing operationalization of event attribution.
Groups engaging in various near-operational and rapid event attribution efforts acknowledge that careful consideration must be given to the assessment of uncertainties and communication of the results. As discussed in Chapter 2, the ways in which the research questions are framed can influence the outcomes and results of event attribution analyses. The time constraints associated with rapid attribution may affect framing and methodological choices by limiting analyses to approaches that can be undertaken quickly. Examples of possible limitations are: reliance on a primarily observationally based approach and possibly on station data that have not yet been quality controlled; inability to assess the robustness of model-based results through reliance on single models with specified SSTs or “off-the-shelf” global model runs from an ensemble of opportunity; and insufficient time either to investigate causal mechanisms or to evaluate the model for the particular extreme events. Providing robust attribution statements on very short timelines is therefore difficult and results are likely to be less robust. This has to be balanced against the need for timely information. Hence, it
is important to follow up on any rapid attribution with studies that are not subject to such limitations in order to evaluate and improve the reliability.
Clearly communicating key messages to stakeholders about the methods and framing choices as well as the associated uncertainties and probabilities is critical to ensuring successful operational services. Furthermore, an important component of an operational system would be the use of methods to routinely evaluate the reliability of the event attribution assessments in much the same way that objective skill scores are an important aspect of the monitoring and evaluation of the performance of seasonal forecasting systems. Additionally, such systems should have rigorous approaches to managing and implementing system improvements, again akin to the methods used to continually improve models and data assimilation systems in operational weather prediction centers.
GUIDANCE FOR INCREASING THE ROBUSTNESS OF EVENT ATTRIBUTION
There is no single best method or set of assumptions for event attribution because these depend heavily on the framing of the question and the amount of time available to respond to the question. Time constraints may themselves affect framing and methodological choices by limiting analyses to approaches that can be undertaken quickly (e.g., van Oldenborgh et al., 2015). This could mean relying primarily on observations, or using conditioned or highly conditioned modeling approaches that can be undertaken with computationally fast dynamic models, or using unconditional approaches based only on available simulations, such as the CMIP5 ensemble of historical climate change simulations.
Assessment of model quality in relation to the event or event class of interest is critical for enhancing confidence in event attribution studies. Different event types pose different requirements for model fidelity. In general, larger-scale and longer-timescale events should be representable in global models, although representation of land-surface processes may be important for drought and heat waves and may lead to biases in event amplitude—for example, in some models (e.g., Hanlon et al., 2013). Smaller-scale and shorter-timescale events may require high-resolution models, which generally will be regional and could be either embedded within a global model or run in weather-forecast mode; they also could be based on a well-performing downscaling tool. Community-developed standards could help to encourage careful assessment.
For extremely rare meteorological events (e.g., Hurricane Sandy), the combination of rarity and spatial scale makes an unconditional attribution approach challenging from a modeling perspective. In this case, following the event itself in a highly conditional
manner, either through short-term forecasts or through data assimilation, allows the use of high-resolution modeling tools capable of representing the event with great fidelity. When discussing results of such studies, however, this conditioning needs to be clearly communicated because it strongly constrains the types of statements that can be made. In particular, the change in probability of event occurrence—measured, for example, by FAR or RR—cannot be assessed by this method, and this could serve either to counteract or to amplify the changes in event magnitude or other properties that are attributed.
In almost all cases, event attribution questions relate to differences in the probability of a given event class or in the distribution of event magnitudes, and questions should be answered in the context of explanations about sources of uncertainty. Different approaches and levels of conditioning may help to control the sources of uncertainty, with greater amounts of conditioning being expected to improve signal-to-noise ratios. Nevertheless, uncertainty can never be fully eliminated. Thus, statistical methods are required in all cases, including those when the analysis is highly conditioned on specific features of the circumstances surrounding an event, to properly account for uncontrolled variability and uncertainty. Statistics plays a key role in framing, designing, and interpreting event attribution studies.
Uncertainty in event attribution results needs to be estimated as much as possible and clearly communicated. Uncertainty emerges from a number of different sources. In the context of event attribution, the main source of sampling uncertainty is the chaotic unforced variability that is a pervasive feature of the climate system and that is simulated to various extents by climate models, even when run without any type of time-varying natural or anthropogenic external forcing. This can include substantial contributions from the low-frequency natural variability of the climate system, including the effects of long-term oscillations that may confound the diagnosis of the effects of human-induced changes in analyses based on short observational records. There are well-established statistical procedures for accounting for sampling uncertainty induced by limited sample sizes in observations and in initial condition model ensembles. In contrast, quantifying uncertainty from using models to represent the climate system is difficult, and well-established statistical procedures are not available for use in the event attribution context. In some cases, results from methods that are designed explicitly to account for sampling variability have been given a Bayesian interpretation without establishing the framework within which such an interpretation would have meaning. In contrast, standard frequentist analysis or explicit implementation of Bayesian methods stands on firm statistical footing. The statistical framework for the interpretation of analyses that sample from parameter, model, and initial/boundary condition distributions is not yet well-defined and needs further development. While
a full quantification of uncertainty is desirable, it may be difficult to quantify the effect of many sources of uncertainty in a falsifiable way. Thus, sensitivity analyses may offer the best practical path forward.
Event attribution results, particularly for local events or such events that are strongly influenced by climate dynamics and its changes, are subject to substantial uncertainty and hinge on assumptions made when selecting a modeling setup and using statistical tools to quantify uncertainty. Given that these choices and the representation of uncertainties can be highly technical, communicating results of event attribution to the broader public in a way that does not overstate the result or fails to sufficiently highlight the assumptions involved in the analysis is difficult.
This page intentionally left blank.


