
4
Quality of Graywater and Stormwater
Stormwater and graywater can contain a wide variety of contaminants, including inorganic (e.g., metals, nutrients, and salts) and organic (e.g., industrial chemicals, pesticides, household chemicals) chemicals and microorganisms. The most common applications of graywater and stormwater involve nonpotable uses, such as irrigation, washing, and toilet flushing, but these uses can be associated with human contact and inadvertent ingestion exposures. Groundwater recharge of stormwater can also impact potable uses, and environmental impacts on plants and soils in irrigated areas are also possible (Australian SCEW, 2009; NRMMC et al., 2009a). Therefore, when considering the potential applications of graywater and stormwater to conserve conventional water supplies, it is important to understand water qualities, how they vary under a range of conditions, implications on various beneficial uses, and strategies to reduce the concentrations of harmful contaminants by source control and treatment.
This chapter describes what is known about the quality of graywater and stormwater sources, and issues that water quality may present to certain end uses. Treatment options are available for uses that necessitate improved or more consistent water quality (see Chapter 6). This chapter also discusses source area controls to manage water quality. Chapter 5 presents the human health and environmental risks associated with graywater and stormwater uses, which then can inform decisions regarding additional treatment needed (see Chapter 6) and affect project costs (see Chapter 7).
GRAYWATER QUALITY
Graywater may contain elevated levels of chemicals and disease-causing microorganisms (pathogens), but the quality of graywater can vary greatly from location to location based on the contributing sources (e.g., laundry, showers, baths), the amounts and types of chemicals used or disposed there (e.g., detergents, bleach, solvents, cleansers, personal care products), and the health of the residents in the source area. At smaller scales (i.e., households), these factors can result in widely variable contaminant concentrations in graywater, although larger-scale projects (i.e., large multi-residential developments) would likely have more consistent water quality, because variations in contaminant loads are averaged over many more contributing households. Table 4-1 presents general ranges of common physical, chemical, and microbial water quality constituents for graywater, considering a range of possible sources. Graywater quality varies substantially, and the ranges of water quality measurements provided in Table 4-1 are intended to provide a general idea of concentrations of each constituent that can be expected in graywater. The data are from Eriksson et al. (2002), which is the most comprehensive summary of graywater quality, and other sources where the committee deemed the number of persons contributing to the system and number of samples collected appropriate. Table 4-1 also includes water quality data from kitchen sources, which show high levels of solids, organic matter, and indicator organisms, demonstrating why kitchen water sources are typically excluded from graywater collection systems.
Many different types of microorganisms capable of causing human illness may be present in human fecal material. Depending on the specific sources contributing to the graywater, these microorganisms may be present. For example, laundry wash and rinse water, as well as shower and bathtub water may contain fecal material and therefore create the potential for pathogenic (disease-causing) microorganisms to be present in graywater. These microorganisms can be generally grouped into the following types: viruses, bacteria, protozoa, and helminths. The most common health concern caused by waterborne pathogens associated with direct exposure to graywater is gastroenteritis, although many other illnesses, including hepatitis, encephalitis, and myocarditis, may result from exposure to enteric pathogens. Fecal indicator bacteria (such as total coliform bacteria and fecal coliform bacteria) are often used as surrogates for the presence of pathogenic microorganisms, and their concentrations are therefore often used to set treatment requirements for different end uses. However, the detection of indicator bacteria does not necessarily mean that pathogenic organisms are also
present. Because pathogens are only excreted by infected individuals (Ashbolt et al., 2001), the greater the number of people contributing to graywater, the greater the likelihood of the presence of a range of pathogens. However, even in waste streams to which a small number of people contribute, when an infected individual is excreting pathogens, the concentration can be very high because of the relative lack of dilution. Perhaps more importantly, the absence of indicator microorganisms does not necessarily mean an absence of pathogenic microorganisms, because many pathogens are more persistent than the indicator microorganisms. Microorganisms capable of causing skin infections, such as Staphylococcus aureus and Pseudomonas aeruginosa, may also be present in graywater (Casanova et al., 2001). Table 4-2 summarizes reported concentrations of microbial indicators and pathogens in graywater.
The amount of organic matter is measured as total organic carbon (TOC), and biochemical oxygen demand (BOD5) is a measure of its degradability. These parameters can indicate the risk of oxygen depletion due to microbial degradation of organic matter during transport and storage of graywater, potentially resulting in hypoxia and sulfide production. High levels of biodegradable organic matter in graywater limit the potential for graywater to be stored or used for toilet flushing or in ornamental fountains without treatment, because of the likelihood of microbial growth.
Other pollutants present in graywater include xenobiotic organic chemicals, consisting of personal care products and household chemicals, although only a limited number of studies have comprehensively investigated the occurrence of these chemicals in graywater sources (Donner et al., 2010; Eriksson et al., 2002). Although trace organic chemicals, such as pharmaceuticals, household chemicals, and endocrine-disrupting chemicals, have been reported to occur in domestic raw wastewater at the household or neighborhood scale (Conn et al., 2010; Teerlink et al., 2012), the composition of graywater differs from wastewater sewage and usually exhibits lower concentrations of pharmaceutical residues and high-
TABLE 4-1 Chemical and Microbial Quality of Untreated Graywater from Individual and Combined Sources
| Parameter | Bathroom | Laundry | Kitchen Sink and Dishwasher | Graywater Combined (excludes kitchen water) |
| Physical | ||||
| Temperature (°C) | 29 | 28-32 | 27-38 | |
| Turbidity | 28-240 | 14-210 | 15-140 | |
| Total suspended solids (TSS), mg/L | 54-200 | 120-280 | 240-2,400 | |
| Total dissolved solids (TDS), mg/L | 140-1,300 | 310-930 | ||
| Electrical conductivity (µS/cm) | 82-250 | 190-1,400 | ||
| Chemical | ||||
| pH | 6.4 – 8.1 | 8.1-10 | 6.3-7.4 | 6.7-7.6 |
| Alkalinity | 24-67 | 83-200 | 20-340 | 150-200 |
| BOD5 (mg/L) | 26-300 | 48-380 | 1,000-1,500 | 125-250 |
| COD (mg/L) | 100-630 | 13-720 | 3.8-1,400 | 250-430 |
| Total organic carbon (mg/L) | 30-100 | 100-280 | 600-880 | |
| Sodium absorption ratio | 2.3 - 6 | |||
| Boron (mg/L) | 0.1-1.6 | |||
| Chloride (mg/L) | 9.0-19 | 9.0-90 | 22-34 | |
| TN (mg/L) | 5-17 | 6-21 | 0.3-74 | 0.6-5.2 |
| TP (mg/L) | 0.1-4 | 0.1->100 | 68-74 | |
| PO4 (mg/L) | 0.94-49 | 4-170 | 13-32 | 4-35 |
| NH4 (mg/L) | <0.1-15 | 0.04-11 | 0.005-6 | 0.15-3.2 |
| NO3 (mg/L) | 0.28-6.3 | 0.4-2 | 0.3-5.8 | 0-4.9 |
| Anionic surfactants (mg/L) | 21 | 92 | 6 | |
| Microbial | ||||
| Total coliform/100 mL | 102.7-107.4 | 101.9-105.2 | 107-109 | 107.2-108.8 |
| Pseudomonas aeruginosa/100 ml | 1.99 x 10⁴ | |||
| E. coli/100 mL | 101.6-103.4 | 101.5-103.9 | 105.4-109 | |
| Cryptosporidium spp. | no detection | no detection | ||
NOTE: Graywater as defined in this report does not include kitchen water.
SOURCES: Birks and Hills (2007); Casanova et al. (2001); Christova-Boal et al. (1996); Donner et al. (2010); Eriksson et al. (2002); Gross et al. (2007); Mehlhart (2005); Nolde (1999); Ottoson and Stenstrom (2003); Rose et al. (1991); Sharvelle et al. (2013); Sheikh (2010); Weingaertner (2013).
er concentrations of personal care products and antimicrobial chemicals found in hand soap (Etchepare and van der Hoek, 2015; Table 4-3). These chemicals pose possible concerns for irrigation uses (see Chapter 5).
Major ions such as sodium, chloride, and boron can also adversely affect vegetation if present at elevated concentrations. Sodium has been reported to be elevated in soil irrigated with graywater compared to potable water sources (Negahban-Azar et al., 2012). Boron in graywater can be derived from some laundry detergents and cleaning agents.
Source Control of Graywater Quality
Some practices can minimize graywater quality issues. To reduce adverse effects on irrigated plants and soils, liquid rather than powdered detergents should be used to prevent high sodium loads, and boron-containing detergents and cleaning agents should be avoided. In addition, use of products containing antimicrobial compounds is not recommended when graywater is to be applied for irrigation. Materials containing large amounts of organic matter that would exert a high oxygen demand or interfere with the disinfection process and toxic ingredients (e.g., paints, solvents) should not be poured down the drain into a graywater collection system.
The potential presence of human pathogens is a concern for irrigation, as well as for toilet flushing (see Chapter 5). The risks associated with these pathogens can be reduced by implementing such measures as not washing feces-soiled clothing or diapers in laundry machines that drain to the graywater system or diverting laundry water that is used for this purpose to the sewer.
STORMWATER QUALITY
The quality of stormwater is highly variable over time and space. Stormwater can be derived from a wide variety of
TABLE 4-2 Pathogenic and Indicator Microorganisms in Untreated Graywater
| Microorganism | Range Reported | Positive Samples (%) | Mean | Standard Deviation |
| Pathogens | ||||
| E. coli O157:H7 (per L) | ND | 0 | ||
| Salmonella (MPN/L) | detected | 13 | ||
| Legionella pneumophila | ND | 0 | ||
| Legionella non-pneumophila | ND | 0 | ||
| Campylobacter (per L) | ND | 0 | ||
| Giardia (cysts/L) | 0.5-1.5 | 63 | ||
| Cryptosporidium (oocysts/L) | ND | 0 | ||
| Enterovirus (per 10 L) | ND | 0 | ||
| Indicator organisms | ||||
| Total coliforms/100 ml | 2.2 x 10⁷ | 9.0 x 10⁷ | ||
| E. coli/100 ml | 3.9 x 10⁵ | 2.4 x 10⁶ | ||
| Fecal enterococci/100 ml | 2.5 x 10³ | 4.8 x 10³ | ||
NOTE: Eight pathogen samples were taken over 3 months from a graywater collection tank that received water from baths, showers, and sinks from 18 units of an apartment building that primarily housed married students.
SOURCE: Birks and Hills (2007).
TABLE 4-3 Maximum Concentrations of Trace Organic Chemicals Reported in European Graywater and Municipal Wastewater Effluents
| Chemical | Class | Graywater (µg/L) | WWTP Effluent (µg/L) |
| Salicylic acid | Pharmaceutical | 1.5 | 777 |
| Caffeine | Stimulant | 0.5 | 43.5 |
| Benzophenone | Personal care product | 4.9 | 0.23 |
| Galaxolide | Personal care product | 19.1 | 2.77 |
| Tonalide | Personal care product | 5.8 | 0.32 |
| Triclosan | Antimicrobial | 35.7 | 6.88 |
| 4-Nonylphenol | Surfactant | 38 | 7.8 |
| 4-Octylphenol | Surfactant | 0.16 | 1.3 |
| Bisphenol A | Plasticizer | 1.2 | 4.09 |
| Diethyl phthalate | Plasticizer | 38 | 2.58 |
SOURCE: Etchepare and van der Hoek (2015).
source areas and land uses, ranging from rooftops and open spaces to industrial areas and high-traffic roadways. The concentrations of contaminants in stormwater will also vary depending on the building materials in the catchment area, the size of the drainage area, the intensity of the storm event, and environmental and seasonal factors. Small rain events (i.e., less than 0.5 inches [1.2 cm]) generally include most of precipitation events by number, but they produce a small percentage of annual runoff volumes. The largest rains (i.e., greater than 2 inches [5 cm]) also supply a relatively small percentage of total annual flows and pollutant discharges, although heavy rains can mobilize high concentrations of solids and sediment-associated pollutants. Most of the total annual stormwater flows and pollutant discharges (frequently more than 75 percent by mass) occur from intermediate rainfall events (i.e., 0.5 to 2 inches).
Compared to graywater, an even wider array of contaminants can be found in stormwater because of the diversity of source areas. Primary contaminants of concern for beneficial uses include metals, organic chemicals (including herbicides, industrial chemicals, and petroleum-derived chemicals), pathogens, salts, nutrients, and suspended solids. Table 4-4 provides an overall summary of these contaminants, measured at stormwater outfalls at the neighborhood or regional scale, during more than 9,400 storm events. These data reflect a variety of land uses, with about 46 percent from residential areas, 19 percent from commercial areas, 17 percent from industrial areas, 8 percent from major transportation areas, 6 percent from open space areas, and 2 percent from institutional areas. For comparison, these data are presented next to U.S. Environmental Protection Agency (EPA) drinking water maximum contaminants levels and water reuse guidance for irrigation. Individual contaminant classes are discussed further in the sections that follow.
Nutrients and Organic Matter
When discharged into surface waters nutrients and organic matter can cause algal blooms and low oxygen conditions, thereby harming aquatic life. Sources of nitrogen and phosphorus to stormwater include atmospheric nitrogen deposition, fertilizer runoff, animal feces, and combined sewer overflows. In stormwater beneficial use scenarios, excess nutrients can foster algal growths in stormwater storage facilities or surface water features, such as ponds or fountains. Most storage tanks are designed to be opaque to restrict sun penetration and associated algal growths. Although nitrate poses human health concerns at high concentrations in drinking water, most stormwater concentrations are well below the 10 mg/L maximum contaminant level (see Table 4-4).
Excessive biodegradable organic matter can contribute to severe odor problems in storage systems and cause nuisances when the water is used, but organic matter in stormwater samples tends to be low. Less than 10 percent of samples in the National Stormwater Quality Database exceeded the recommended water reuse criteria for irrigation for BOD5, reflecting elevated levels of biodegradable organic matter.
Suspended Sediment
Suspended sediment (total suspended solids [TSS]) conveys particle-associated contaminants (e.g., phosphorus, metals, some organic contaminants and pathogens) (Characklis et al., 2005; Jartun et al., 2008; Murakami et al., 2005). In stormwater beneficial use scenarios, suspended solids can clog irrigation systems and can result in reduced water clarity, causing aesthetic concerns when the water is used in toilet flushing or ornamental water features. Greater than one-than half of the National Stormwater Quality Database observations exceed the recommended guidance for TSS, and the mean detected level is approximately 5 times greater than the recommended 30 mg/L level for irrigation use (Table 4-4).
Salt
Salts represent a concern for irrigation uses and groundwater infiltration. Plants have different salt tolerances, and high chloride concentrations can severely damage some plants. Excessive sodium concentrations (especially in relation to calcium and magnesium) can cause an elevated sodium adsorption ratio (SAR). High SARs dramatically inhibit water infiltration in soils when the sodium interacts with even small amounts of clay.
In northern areas, de-icing chemicals are major sources of salt to stormwater and could pose a risk to groundwater quality in stormwater infiltration projects. In a U.S. Geological Survey (USGS) occurrence study of sodium and chloride in groundwater in 19 northern U.S. states, Mullaney et al. (2009) detected chloride contamination (above the EPA secondary criteria of 250 mg/L) in 1.7 percent of drinking water wells and exceedance of the sodium advisory level (20 mg/L) in nearly 47 percent of public-supply wells and 34 percent of domestic wells. Mullaney et al. (2009) determined that de-icing salts were the predominant source. Enhanced recharge of stormwater without attention to salt concentrations could exacerbate this problem.
Pathogens
Pathogenic microorganisms in stormwater are typically derived from animal wastes (e.g., Salmonella and Campylo-
TABLE 4-4 Stormwater Quality Data at Neighborhood/Regional Outfalls from the National Stormwater Quality Database, Version 4 (March 17, 2105 version)
| Constituent | EPA Drinking Water MCLa | Irrigation Use Guidanceb | All Locations Combined (9,052 total events) | |||||
| Average of detected valuesc | 5th percentile of all valuesc | 50th percentile of all values (median)c | 95th percentile of all valuesc | # of observations | % detected | |||
| pH | 6.5 to 8.5c | 6 to 9 | 7.3 | 6.1 | 7.3 | 8.6 | 3,179 | 100 |
| Total dissolved solids (TDS) (mg/L) | 500c | 140 | 25 | 80 | 370 | 4,120 | 99 | |
| Chloride (mg/L) | 250c | 26 | 1 | 6.2 | 92 | 869 | 84 | |
| Total suspended solids (TSS) (mg/L) | 30 | 140 | 7 | 63 | 510 | 7,637 | 99 | |
| Turbidity (NTU) | 39 | 4 | 19 | 120 | 936 | 100 | ||
| BOD5 (mg/L) | 30 | 14 | 2 | 8.3 | 42 | 5,152 | 95 | |
| COD (mg/L) | 79 | 6.3 | 51 | 240 | 5,214 | 96 | ||
| TOC (mg/L) | 16 | 3 | 8.6 | 52 | 678 | 100 | ||
| Ammonia (mg/L as N) | 0.77 | <0.1 | 0.28 | 2.1 | 2,946 | 72 | ||
| Nitrate (mg/L as N) | 10 | 0.97 | <0.1 | 0.58 | 2.7 | 1,028 | 92 | |
| Nitrite (mg/L as N) | 1 | 0.17 | <0.1 | <0.1 | 0.38 | 714 | 64 | |
| Total phosphorus (mg/L as P) | 0.4 | 0.05 | 0.24 | 1.1 | 7,943 | 97 | ||
| Microorganisms | ||||||||
| Fecal coliforms (MPN/100 mL) | <200d | 60,000 | 65 | 4,600 | 200,000 | 2,168 | 92e | |
| Fecal streptococci (MPN/100 mL) | 73,000 | 500 | 19,000 | 300,000 | 1,317 | 94e | ||
| Total coliforms (MPN/100 mL) | 5.0% positive | 260,000 | 300 | 24,000 | 1,600,000 | 282 | 77e | |
| E. coli (MPN/100 mL) | 5,900 | 23 | 1,200 | 28,000 | 139 | 98e | ||
| Metals | ||||||||
| Arsenic, total (µg/L) | 10 | 100 | 5.9 | <5 | 1 | 8 | 2,367 | 34 |
| Barium, total (µg/L) | 2,000 | 55 | 2 | 21 | 110 | 582 | 66 | |
| Cadmium, total (µg/L) | 5 | 10 | 3.5 | <1 | 0.35 | 5 | 4,002 | 40 |
| Chromium, total (µg/L) | 100 | 100 | 12 | 0.5 | 4 | 25 | 2,266 | 57 |
| Copper, total (µg/L) | 1,300f | 200 | 33 | 0.5 | 13 | 94 | 5,836 | 89 |
| Iron, total (µg/L) | 300c | 5,000 | 2,700 | 17 | 470 | 6,500 | 608 | 86 |
| Lead, total, since 1984 (µg/L) | 15f | 5,000 | 34 | <5 | 8 | 100 | 4,960 | 74 |
| Nickel, total (µg/L) | 200 | 14 | <5 | 4 | 30 | 2,090 | 51 | |
| Zinc, total (µg/L) | 5,000c | 2,000 | 200 | 5.9 | 91 | 560 | 6,563 | 96 |
| Organic Contaminants | ||||||||
| Oil and grease, total (mg/L) | 21 | 0.2 | 3 | 37 | 2,256 | 68 | ||
| Total petroleum hydrocarbons(mg/L) | 3.9 | 0.3 | 1.8 | 9.6 | 295 | 65 | ||
| 2-Chloroethylvinlether (µg/L) | 3.4 | 0.2 | 2.4 | 5 | 624 | 58 | ||
| Dichlorobromoethane (µg/L) | 0.85 | <1 | 0.55 | 1.6 | 116 | 36 | ||
| 1,2-Dichloroethane (µg/L) | 5 | 1.5 | 0.05 | 0.15 | 1.8 | 247 | 21 | |
| Methlenechloride (µg/L) | 12 | <1 | <1 | 14 | 457 | 20 | ||
aEPA maximum contaminant levels (MCLs) for drinking water (see http://water.epa.gov/drink/standardsriskmanagement.cfm).
bEPA 2012 Water Reuse Guidelines (EPA, 2012a).
cIndicates secondary MCL.
dFecal coliform/100 mL (not MPN).
eMost bacteria values that are not quantified exceeded the upper limit of the analytical method (over-range).
fAction level.
NOTE: Most of these data were obtained from the municipal stormwater permit program (MS4), with additional data from the National Urban Runoff Program (EPA, 1983) and various research projects. Although the database contains sampling sites in all nine rain zones in the United States, most of the sampling data has been collected from the upper Midwest and Northeast, mid-Atlantic, Southeast, Southwest, and Northwest areas. Because these data include multiple data sets, the concentrations reported may reflect different sampling points and times for different constituents. The median and percentile values are calculated considering both the detected values and nondetected or over-range values, with no data substitutions, while the average values are for only the detected values. See Maestre (2005) for detailed discussions of effects of the multiple data sets on the overall statistics. Highlighted values exceed either the drinking water MCL or the irrigation guidance values.
SOURCES: Maestre et al. (2015); National Stormwater Quality Database, version 4 (March 17, 2015, updates; see http://www.bmpdatabase.org/nsqd.html).
bacter from birds), although leaking sewer systems or poorly functioning septic tanks can also introduce human waste into stormwater. As with graywater, given the number of possible organisms and the difficulty quantifying their occurrence, indicator bacteria (e.g., total coliform bacteria, fecal coliform bacteria, fecal streptococcus, E. coli) are often monitored instead of pathogens. However, as discussed previously, indicator bacteria may be a poor analog for human pathogens, particularly if the organisms are not derived from wastewater, as is often the case for stormwater (Clary et al., 2014). Data presented in Table 4-4 illustrate that indicator bacteria were detected in high numbers from stormwater outfalls at the neighborhood scale or larger. Mean fecal coliform bacteria concentrations exceeded the guidance value for irrigation water by more than 300-fold, while the 95th percentile fecal coliform value exceeded this guidance value by 1,000-fold.
Limited data are available on the occurrence of actual human pathogens in stormwater (Bambic et al., 2011; Page and Levett, 2010; Page et al., 2013; Vanderzalm et al., 2014), and the data can be highly variable. In a review of the literature, O’Shea and Field (1992a) cited studies that reported that some of the disease-causing microorganisms isolated from urban stormwater and streams include enteroviruses (e.g., poliovirus, coxsackieviruses, and echovirus) and bacteria (e.g., Pseudomonas aeruginosa, Staphylococcus aureus, Campylobacter, and Salmonella) (Olivieri et al., 1977; Pitt and McLean, 1986; Qureshi and Dutka, 1979). In three studies, some with limited sampling, Salmonella was the most commonly detected pathogenic bacterium in urban stormwater, with 3-80 percent positive detections reported, while the other bacterial pathogens were detected in less than 10 percent of the samples (Kinde et al., 1997; O’Shea and Field, 1992b; Schroeder et al., 2002). Two studies reported 0-10 percent of stormwater samples with detectable Cryptosporidium, while none had detectable concentrations of Giardia (Schroeder et al., 2002; Wohlsen et al., 2006). Page et al. (2013) reported protozoa detections in 50 percent of all stormwater samples for a catchment area in Australia. Bambic et al. (2011) reported that viruses are rarely detected in municipal stormwater. Adenovirus, rotavirus, enterovirus, human polyomavirus, and hepatitis A were monitored and detected in 0-5 percent of stormwater samples (Brownell et al., 2007; Grohmann et al., 1993; O’Shea and Field, 1992b; Rajal et al., 2007; Schroeder et al., 2002), although three studies reported positive adenovirus occurrences in 10-59 percent of municipal stormwater samples (CREST, 2009; Jiang et al., 2007; Page et al., 2013).
Ahmed and Toze (2015) reviewed the literature on the microbiological quality of roof runoff. Most of the studies focused on indicator organisms, and many of the results are reported as presence or absence of the organisms, rather than pathogen concentrations (Ahmed et al., 2014; NRMMC et al., 2009a). The most commonly tested bacterial pathogen appears to be Campylobacter; with reported occurrence ranging from 0 to 125 samples (Simmons et al., 2001) and 45 percent of 27 samples tested (Ahmed et al., 2008). Salmonella have also been detected, generally at lower frequencies than Campylobacter (Ahmed and Toze, 2015). Four of six samples tested for Shigella and Vibrio were positive in a study conducted by Uba and Aghogho (2000). Roof runoff has also been tested for the protozoan pathogens, Giardia and Cryptosporidium, with the highest frequency of detection being reported by Crabtree et al. (1996): 23 and 45 percent occurrence, respectively, in 45 samples. No reports of virus detection in roof-captured rainwater were found. The results of studies that reported concentrations are summarized in Table 4-5. Most of the pathogen studies used molecular methods to detect the microorganism, so it is not possible to directly infer health risk from the presence of the pathogens.
Many of the studies of the presence of pathogenic microorganisms in stormwater have focused on the same organisms. Because it is not possible to monitor water for the hundreds of potential pathogens that it may contain, researchers typically choose a few that they believe are representative of the other pathogens. There are different reasons for the choices of the different organisms. For example, enteroviruses are often chosen to represent enteric viruses, because the methodology for monitoring these viruses is standardized and well established. Rotaviruses may be chosen to represent a “worst-case” scenario for viruses, because they have an extremely low infectious dose (i.e., very few organisms are required to cause infection, so the presence of just a few rotaviruses may signify a potential public health risk). Cryptosporidium is often a target of interest because of the very large (and widely publicized) outbreaks of drinking-waterborne disease that it has caused in the United States, Europe, and Australia. Salmonella is often chosen because it is one of the most commonly detected bacteria in wastewater.
The limited data available exhibit wide ranges of occurrences and concentrations. This may be due to the size of the sample analyzed (e.g., only 5 or 10 percent of a sample may be analyzed because of methodological constraints), the temporal variability of infection in the population, and/ or limitations in analytical methods. Statistical comparisons and descriptive characteristics of these data would therefore require a much larger number of samples.
Metals
Metals in stormwater are most commonly detected when source areas include industrial storage areas, highways, streets, and parking areas. Additionally, roofing drain-
age systems, conveyance systems, and water storage tanks are often made of metallic materials or components, including aluminum, lead, zinc, and copper, which can affect water quality in stormwater capture systems (see Box 4-1).
Chronic aquatic life criteria have been established by the EPA to protect aquatic life in receiving waters. Copper, lead, cadmium, and zinc are a concern for projects with surface reservoirs or wetland features, because their mean concentrations exceed criteria for aquatic organisms (see Table 4-6; Davis et al., 2001). Some plants may be sensitive to some metals, but irrigation guidelines mostly focus on metal uptake in plants that may be consumed, such as in household gardens. Although most metal concentrations detected in stormwater are below published irrigation use guidelines, elevated levels of iron could also pose concerns for irrigation use (see Table 4-4).
Because of frequent exceedances of the EPA maximum contaminant level (MCL) (Table 4-4), lead, iron, and cadmium pose human health concerns if stormwater is consumed in large quantities (Sabin et al., 2005). Median concentrations exceeded the recommended drinking water standards for iron. Since the removal of lead from gasoline, about 35 percent of recent lead observations exceeded the drinking water MCL (National Stormwater Quality Database, version 4). The 95th percentile values in stormwater outfalls are close to the drinking water standards for arsenic and cadmium.
Organic Chemicals
A wide array of organic contaminants can also be detected in stormwater, including pesticides, industrial chemicals and solvents, and petroleum-derived chemicals. Compared to total suspended solids, nutrients, and metals, however, relatively little information is available on concentrations of organic chemicals in urban stormwater (Grebel et al., 2013). Polynuclear aromatic hydrocarbons (PAHs) are frequently detected because of releases from automobile exhaust and paving materials (see also Table 4-7). A number of chemicals used in industrial manufacturing and consumer products have been detected in stormwater, such as tire additive chemicals (e.g., benzotriazoles), plastic additives (e.g., bisphenol A, phtalates), and flame-retardants (i.e., perfluorochemicals and organophosphates) (Stachel et al., 2010). A recent study in Arizona focusing on perfluorinated chemicals concluded that secondary wastewater effluents and stormwater runoff from downtown areas exhibited similar perfluorooctane sulfonate (PFOS) concentrations ranging from 10 to 1,000 ng/L (Quanrud et al., 2010).
Also present in stormwater are herbicides (e.g., diuron, glyphosphate, 2,4-Dichlorophenoxyacetic acid [2,4-D]) and pesticides (e.g., pyrethroids, fipronil) used in residential and commercial properties and along transportation corridors (Blanchoud et al., 2004; Gan et al., 2012; Gilliom et al., 2007; Weston et al., 2009). A recent study of stormwater herbicides and insecticides conducted by the Montana Department of Agriculture reported 29 different pesticides in stormwater samples (Table 4-8). The most common groups of pesticides detected were the phenoxy herbicides (e.g., 2,4-D, 2-methyl-4-chlorophenoxyacetic acid [MCPA], and methylchlorophenoxypropionic acid [MCPP]) and herbicides used as soil sterilants (e.g., diuron, glyphosate, prometon, tebuthiuron, and triclopyr). Only two pesticides (i.e., 2,4-D and malathion) were detected at levels that exceeded aquatic life benchmarks, and none exceeded drinking water standards.
TABLE 4-5 Reported Numbers of Indicator and Pathogenic Microorganisms in Rooftop Runoff
| Microorganism | Rooftop Runoff Storage Tank | Rooftop Runoff Toilet Bowla |
| E. coli (cfu/100 ml) | ND-990 | ND-54,000 |
| Enterococci (cfu/100 ml) | ND-110 | ND-110 |
| Pseudomonas aeruginosa (cfu/100 ml) | <1-20 | <1-870 |
| Aeromonas sp. (cfu/ml) | <10-30 | <10-4,400 |
| Legionella pneumophila | ND | ND |
| Legionella non-pneumophila | ND-detected | ND-detected |
| Campylobacter | ND-detected | ND-detected |
| Campylobacter (by qPCR; cells/L) | ND-110 | ND-110 |
| Mycobacterium avium | ND-detected | ND |
| Salmonella (by qPCR; cells/L) | ND-7,300 | ND |
| Giardia (cysts/L) | ND | ND |
| Giardia lamblia (by qPCR; cells/L) | ND-580 | ND-40 |
| Cryptosporidium (oocysts/L) | ND-50 | ND-10 |
aSamples were also taken from a toilet for which untreated roof-runoff was used for toilet flushing. No pathogens were detected in toilet bowls containing domestic tap water.
SOURCES: Ahmed et al. (2012); Albrechtsen (2002); Despins et al. (2009).
TABLE 4-6 Stormwater Quality Data at Neighborhood/Regional Outfalls Compared to Chronic Aquatic Life Criteria
| Constituent | EPA Chronic/Aquatic Life Criteriaa | Medianb | 5th percentileb | 95th percentileb | Approximate Percentage Exceeding EPA Chronic Aquatic Live Criteria |
| Chloride (mg/L) | 230 | 6.2 | 1.0 | 92 | 1 |
| Arsenic, dissolved (µg/L) | 150 | 0.62 | <5 | 2.7 | 0 |
| Cadmium, dissolved (µg/L) | 0.25 | <1 | <1 | 1.0 | 35 |
| Copper, dissolved (µg/L) | BLMc | 7 | 0.8 | 40 | n/a |
| Iron, dissolved (µg/L) | 1,000 | 60 | <100 | 930 | 4 |
| Lead, dissolved (µg/L) | 2.5 | 1.0 | <5 | 15 | 20 |
| Mercury, dissolved (µg/L) | 0.77 | <1 | <1 | 0.06 | <1 |
| Nickel, dissolved (µg/L) | 52 | 2.0 | <5 | 11 | <5 |
| Zinc, dissolved (µg/L) | 120 | 55 | 6 | 450 | 30 |
aSee http://water.epa.gov/scitech/swguidance/standards/criteria/aqlife/index.cfm.
bThe median and percentile values are calculated using detected and nondetected values with no substitutions for nondetected or over-range values.
cChronic aquatic life criteria for copper are calculated using the biotic ligand model (BLM), which considers water quality parameters, including hardness, that affect copper bioavailability. See http://water.epa.gov/scitech/swguidance/standards/criteria/aqlife/copper.
SOURCE: National Stormwater Quality Database, version 4, updated March 17, 2015 (http://www.bmpdatabase.org/nsqd.html).
Comprehensive data on organic contaminants in stormwater have been collected by the state of Washington (see Table 4-7). No information relating to land uses or other site features are available, although it is expected that much of these data are associated with mixed land use areas. In many cases, the organic contaminants reported in these stormwater samples (including many organochlorine pesticides, PAHs, and polychlorinated biphenyls [PCBs]) exceeded the state’s proposed human health water quality criteria (set according to drinking water uses). In some cases, even median and minimum reported concentrations exceeded the proposed water quality criteria. At these concentrations, organic chemicals can pose hazards to aquatic life if stormwater is stored in surface reservoirs or wetlands. Additionally, toxic organic chemicals can cause cancer risks at significant exposures, particularly when drinking water supplies are augmented with stormwater through groundwater recharge (see Chapter 5). Some persistent organic chemicals, such as PFOS, do not have a strong sorption potential (Higgins and Luthy, 2006) and may percolate through soil with concentrations essentially unchanged (Quanrud et al., 2010). Very similar results were reported in an occurrence study of organic chemicals in stormwater across different stormwater catchment sites in Australia (Vanderzalm et al., 2014). Among the chemicals targeted, herbicides and notably simazine were the most detected organic chemicals, but at no site did the 95th percentile of herbicide analytes exceed the Australian drinking water guideline.
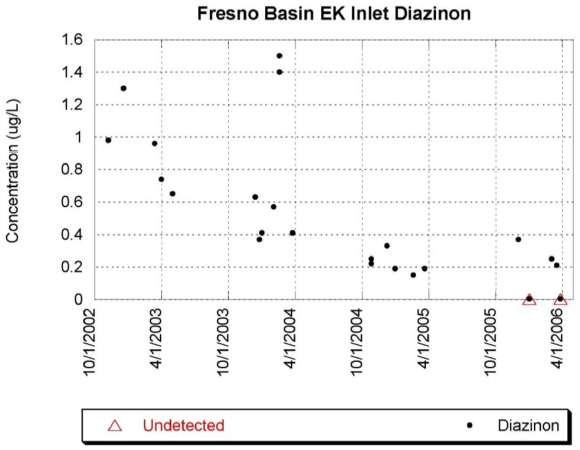
The occurrence of pollutants in stormwater can change over time based on changes in the use of certain chemicals and materials in the drainage area. This is especially true for anthropogenic compounds such as pesticides. Figure 4-1 illustrates the decreasing concentrations of Diazinon in stormwater in Fresno, California, following a ban on the pesticide (NRC, 2009a).
Source Area and Land Use Effects on Stormwater Quality and Source Control
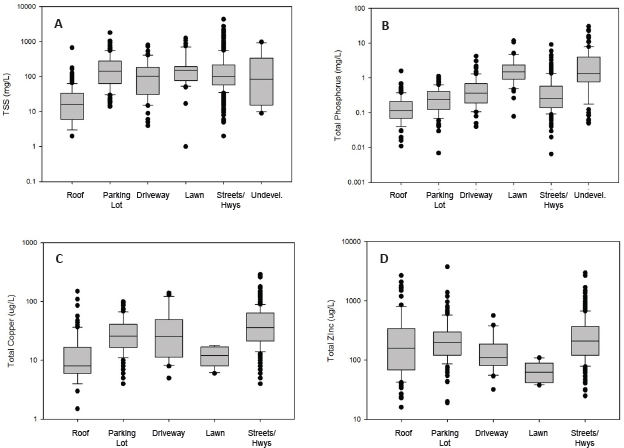
Source areas, such as roofs, parking lots, streets, and landscaped areas, have a significant effect on stormwater quality, but there are limited data describing the quality of stormwater originating from specific source areas. There can also be large variations in contaminant concentrations within a source area type associated with building or construction materials and the activities conducted at a particular site. Most of the data on the impacts of specific source areas on stormwater quality has been collected for studies on the effects of roofing materials on runoff quality (see Box 4-1). However, stormwater runoff samples compiled from research sites in Wisconsin and Michigan showed significant differences in TSS, phosphorus, copper, and zinc by source area type (Figure 4-2) (J. Horwatich, USGS, personal communication, 2015). These data included residential, commercial, and light industrial land uses. Figure 4-2a shows significantly lower levels of TSS and phosphorus in roof runoff compared to lawns, undeveloped areas, and paved surfaces such as parking lots, driveways, and streets. In contrast, lawns show the lowest levels of zinc (Figure 4-2d). Zinc concentrations in roof runoff ranged widely because galvanized metals are common materials in roof flashings. Roofs and lawns show the lowest average concentrations of
TABLE 4-7 Observed Stormwater Contaminants in the State of Washington
| Pollutant | # of Observations | % Detected | Reported Results (µg/L) | Proposed State Drinking Water Limits (µg/L) | ||
| Minimum | Median | Maximum | ||||
| Metals | ||||||
| Antimony | 50 | 32 | 0.52 | 1 | 50 | 14 |
| Arsenic | 275 | 83 | 0.17 | 1 | 30 | 10 |
| Copper | 1,495 | 92 | 0.001 | 6.4 | 12,300 | 1,300 |
| Nickel | 141 | 71 | 0.24 | 2.2 | 30 | 156 |
| Selenium | 74 | 15 | 0.5 | 0.70 | 120 | 141 |
| Zinc | 1,653 | 98 | 0.017 | 49 | 21,000 | 2,347 |
| Organochlorine Pesticides | ||||||
| 4,4’-DDD | 38 | 39 | 0.000064 | 0.0025 | 0.88 | 0.00036 |
| 4,4’-DDE | 47 | 57 | 0.00012 | 0.013 | 0.88 | 0.00025 |
| 4,4’-DDT | 46 | 57 | 0.00049 | 0.0096 | 1.8 | 0.00025 |
| alpha-HCH | 38 | 32 | 0.000093 | 0.0025 | 0.5 | 0.0039 |
| beta-BHC | 38 | 16 | 0.00012 | 0.0025 | 0.44 | 0.014 |
| Dieldrin | 38 | 42 | 0.000064 | 0.0038 | 0.88 | 0.000061 |
| Endosulfan sulfate | 48 | 58 | 0.0003 | 0.012 | 6.07 | 0.93 |
| Endrin | 38 | 13 | 0.00011 | 0.0025 | 0.88 | 0.034 |
| gamma-HCH (Lindane) | 48 | 25 | 0.00049 | 0.0025 | 0.44 | 0.019 |
| Heptachlor epoxide | 38 | 47 | 0.00012 | 0.0025 | 0.44 | 0.000045 |
| Isophorone | 31 | 13 | 0.03 | 0.06 | 10 | 8.4 |
| PAHs | ||||||
| Benzo(a)Anthracene | 658 | 24 | 0.002 | 0.08 | 11 | 0.0028 |
| Benzo(a)Pyrene | 862 | 22 | 0.004 | 0.1 | 15 | 0.0028 |
| Benzo(b)Fluoranthene | 503 | 27 | 0.0052 | 0.1 | 13 | 0.0028 |
| Benzo(k)Fluoranthene | 499 | 22 | 0.0075 | 0.1 | 13 | 0.0028 |
| Chrysene | 786 | 38 | 0.003 | 0.1 | 16 | 0.0028 |
| Dibenzo (a,h) anthracene | 786 | 10 | 0.003 | 0.1 | 10 | 0.0028 |
| Fluoranthene | 781 | 50 | 0.005 | 0.1 | 33 | 16 |
| Indeno (1,2,3-cd) pyrene | 786 | 22 | 0.003 | 0.1 | 10 | 0.0028 |
| Pyrene | 781 | 55 | 0.0054 | 0.1 | 26 | 331 |
| Volatile Organic Compounds—BTEX | ||||||
| Benzene | 209 | 10 | 0.13 | 1 | 190 | 1.2 |
| Ethylbenzene | 209 | 11 | 0.1 | 1 | 65 | 934 |
| Toluene | 210 | 15 | 0 | 1 | 460 | 4,132 |
| Trichloroethylene | 87 | 11 | 0.02 | 0.17 | 2 | 2.7 |
| Other Organics | ||||||
| PCBs | 15,277 | 28 | 0.000002 | 0.00004 | 0.28 | 0.00017 |
| Pentachlorophenol | 769 | 23 | 0.02 | 0.5 | 60 | 0.28 |
| 2,4-Dimethylphenol | 31 | 10 | 0.06 | 1 | 10 | 87 |
| Phenol | 83 | 14 | 0.01 | 0.1 | 10 | 10,690 |
| Phthalates | ||||||
| Bis(2-Ethylhexyl) phthalate | 669 | 51 | 0.024 | 1.2 | 41 | 1.8 |
| Butylbenzyl phthalate | 623 | 14 | 0.018 | 0.59 | 10 | 215 |
| Diethyl phthalate | 619 | 23 | 0.024 | 0.67 | 10 | 4,332 |
| Dimethyl phthalate | 623 | 11 | 0.021 | 0.5 | 13 | 96,386 |
| Di-n-Butyl phthalate | 623 | 15 | 0.023 | 0.5 | 10 | 455 |
NOTE: Only compounds having greater than 10 percent detection frequencies of concentrations within the reporting range limits are shown. The proposed drinking water limits shown are the state’s human health water quality criteria as contained in the proposed amendments to the Water Quality Standards for Toxicants as published in September 2014.
TABLE 4-8 Herbicides and Insecticides Observed in Helena and Billings, Montana, Stormwater
| Total # of Samples | % Detected | Median (µg/L) | Max. (µg/L) | Human Health Drinking Water Standard (µg/L) | Lowest Aquatic Life Benchmarksa (µg/L) | |
| Herbicides | ||||||
| 2,4-D | 23 | 100 | 1.23 | 27 | 70 | 13.1 |
| Bromacil | 23 | 35 | 0.02 | 0.26 | 90 | 6.8 |
| Chlorsulfuron | 23 | 30 | 0.007 | 0.036 | 1,750 | 0.055 |
| Chlopyralid | 23 | 22 | 0.029 | 0.8 | 3,500 | 56,500 |
| Dichloprop | 23 | 39 | 0.0029 | 0.099 | n/a | n/a |
| Diuron | 23 | 91 | 0.042 | 0.92 | 10 | 2.4 |
| Glyphosate | 19 | 58 | 0.0029 | 0.01 | 700 | 1,800 |
| Imazapic | 23 | 57 | 0.0015 | 0.0081 | 4,000 | n/a |
| Imazapyr | 23 | 96 | 0.021 | 0.53 | 21,000 | 24 |
| MCPA | 23 | 100 | 0.093 | 2.2 | 4 | 20 |
| MCPP | 23 | 100 | 0.14 | 4.6 | 7 | 14 |
| Picloram | 23 | 22 | 0.13 | 0.39 | 500 | 550 |
| Prometon | 23 | 100 | 0.025 | 0.61 | 100 | 98 |
| Simazine | 23 | 22 | 0.003 | 0.023 | 4 | 36 |
| Sulfomuterun | 23 | 17 | 0.056 | 0.2 | 2,000 | 0.48 |
| Tebuthiuron | 23 | 78 | 0.0015 | 0.0024 | 500 | 50 |
| Triclopyr | 23 | 96 | 0.014 | 3 | 350 | 100 |
| Insecticides | ||||||
| Imidacloprid | 23 | 30 | 0.015 | 0.05 | 400 | 1.05 |
| Malathion | 23 | 17 | 0.036 | 1.1 | 100 | 0.035 |
aAquatic life benchmarks listed here reflect the lowest benchmark values considering acute and chronic effects on fish, acute and chronic effects on invertebrates, acute effects on nonvascular plants, and acute effects on vascular plants.
NOTE: Sixteen samples were collected from four locations during four storms in Helena, and seven samples were collected from four locations during two storms in Billings. These samples were collected from streams and storm drains that received stormwater and represent mixed land use areas. The samples were analyzed for 148 pesticides.
SOURCE: Montana Department of Agriculture (2011).
copper, although some high concentrations were observed in roof runoff (Figure 4-2c). Heating, ventilation, and air conditioning (HVAC) condensers are commonly constructed of copper and as such can be a source of copper in runoff when located on rooftop areas.
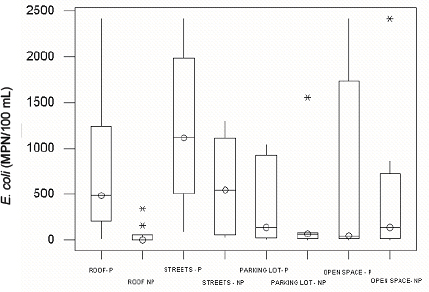
Bacteria levels in source areas vary widely (see Clary et al., 2014; Pitt et al., 2005a,b,c) but are notably increased by the presence of animals (see Figure 4-3). As an example, E. coli and enterococci levels in roof runoff vary dramatically depending on the extent of squirrel and bird activity in trees above the roofs and possibly the season. If roofs are not shaded by trees (which provide habitat for squirrels and birds), then bacteria levels are much lower (Shergill and Pitt, 2004). The presence of contaminated materials or inappropriate connections with sewage can also increase bacteria concentrations in stormwater. Overall, roof runoff is generally the preferred source area for beneficial stormwater uses based on water quality, but treatment, especially for bacteria, may be necessary to meet beneficial use guidelines, and roofing materials should be considered (see Box 4-1).
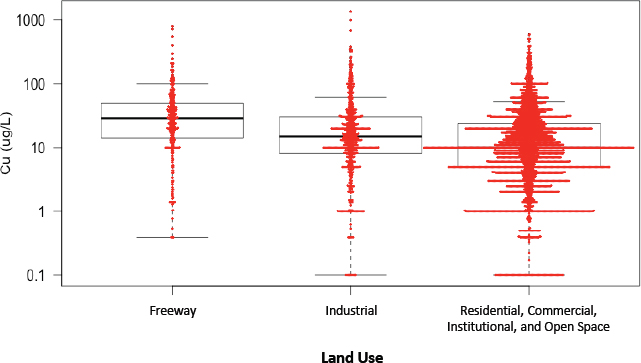
Land uses (e.g., residential, industrial, institutional) may contain multiple source area types (e.g., roofs, paved surfaces, landscaped areas), and although water quality is widely variable within a given land use, some general water quality trends can be observed among various land use types. National Stormwater Quality Database outfall data (see Table 4-4) were analyzed to identify statistically significant groupings of the data by land use categories (Pitt and Maestre, 2014). An example is shown in Figure 4-4 for copper, which showed significantly elevated concentrations in runoff from freeways and industrial land uses, compared to residential, institutional, commercial, and open land uses, although copper concentrations are extremely variable in all three land use groupings. In an analysis of Wisconsin stormwater quality by source area, only a few samples had copper concentrations in excess of the 200 µg/L irrigation guidance, and these were associated with runoff from streets and highways (Figure 4-2). If specific contaminants pose a risk for the desired beneficial use of stormwater, then land use effects on those contaminants should be understood and less-impacted areas can be selected to reduce the contaminant load at the source and reduce the level of treatment required.
For neighborhood- and regional-scale beneficial use projects in existing developed areas, source control strate-
gies can be used to focus stormwater collection on the least contaminated source areas and land uses, considering exposed materials and on-site activities. Industrial or freeway land uses should probably be avoided, unless extensive water quality treatment is incorporated. Areas mostly comprised of residential, open space, and institutional areas are generally most suitable, although areas with low animal activity would be preferred for beneficial uses when bacteria are a concern. Even in areas having the best quality stormwater, there are still constituents that may cause concern with some beneficial uses requiring treatment before use. Chapter 5 discusses methods to evaluate exposures and risk to guide treatment design.
Materials Management for Source Control
Where stormwater is captured for subsequent beneficial use, an important element of source control is the management of roofing, drainage, and tank materials, particularly in new construction. There is an increasing trend in the use of metal roofs (mainly galvanized) in residential areas for increased service life, aesthetics, and fire protection. However, metal roofs can release significant amounts of zinc, copper, and lead over both short and long time frames and under a wide range of pH and salinity conditions (see Box 4-1). There may also be use of copper flashing and gutters in high-end residential and commercial areas, which is not advised because of the associated copper releases to stormwater, particularly in coastal areas. Factory-applied coatings on the galvanized metals result in greatly reduced metal releases, while homeowner applied coatings (and painting) are not as durable and these surfaces have large metal releases within a few years of application (Clark et al., 2008a). The use of lead flashing even occurs in new construction in some areas 1and would be a significant source of lead in roof runoff for those buildings.
Galvanized materials are also not advised for roof runoff capture and storage because of the substantial zinc releases. Storage tanks and other components made from concrete, high-density polyethylene, and vinyl materials can instead be used in stormwater capture systems without elevated metal releases (Ogburn, 2013).
__________________
1 See http://marsmetal.com/sheet-lead/roofing-and-flashing for example.
A well-known example of materials management for source control is limiting copper in brake pads. In urban watersheds, up to one-half of the copper originates from brake pads.2 California and Washington recently passed legislation limiting the amounts of copper and other heavy metals in brake pads (Ch. 173-901 WAC; California Health and Safety Code sections 25250.50–25250.65). That legislation inspired similar bills in other states, effectively setting a national standard (Motavalli, 2012).
CONCLUSIONS
The quality of graywater and stormwater determines their potential uses without treatment, but many additional applications are possible with treatment. Chapter 5 discusses a risk assessment approach to determine the appropriate levels of treatment, but this approach requires a clear understanding of source water quality.
Pathogens and organic matter in graywater impact opportunities for beneficial uses without treatment. Considering the source water, human pathogens are likely to occur in graywater, although the specific types and concentrations vary substantially. The occurrence and environmental fate of pathogens in graywater are not yet well understood. Organic matter is present in high enough concentration in graywater to enhance microbial growth, thus limiting the potential uses of graywater without disinfection. Graywater also contains a wide array of personal care products. Sodium, chloride, boron, and other chemicals can impact the quality of graywater for irrigation uses. Best management practices exist for source control of microbial and chemical constituents, and such practices can be implemented at the household scale to reduce concentrations of these constituents in graywater.
Stormwater quality is highly variable over space and time and might contain elevated levels of microorganisms, metals, organic chemicals, and sediments, potentially necessitating treatment to facilitate various beneficial uses. Stormwater quality is a direct function of land use, source area, catchment size, and climatic and seasonal factors. Existing data suggest that most stormwater contains elevated levels of organic matter, suspended sediment, and indicator bacteria. Metals are also commonly found in urban stormwater runoff and may pose concerns for some beneficial uses, including irrigation and surface reservoirs or wetland features. Nutrients may also impact the function of some stormwater applications, such as ornamental water features, without treatment. Despite the enormous spatial and temporal variability of stormwater quality, the data show that there are a number of water quality parameters with at
__________________
2 See http://www.ecy.wa.gov/programs/hwtr/betterbrakes.html.
least 5 percent of samples consistently above the guideline values for irrigation, drinking, or protection of aquatic life. This suggests that in spite of aggregated data showing high variability, the treatment systems required for achieving end uses may be relatively consistent over a wide variety of catchments.
Little is known regarding the occurrence of human pathogens and organic chemicals in stormwater, and additional research is needed to characterize their occurrence and fate. Studies of the presence of microorganisms in stormwater have consistently reported high concentrations of fecal indicator microorganisms across different source areas. In the few studies that analyzed for pathogenic microorganisms in stormwater, they were generally detected, at least in some samples. However, more work is needed to characterize their occurrence and fate, particularly for roof runoff systems where the beneficial use of untreated stormwater is common and raises concerns for uses with the potential for human exposure. More research is also needed to characterize the occurrence of organic chemicals in stormwater and their fate during various uses.
Land uses, contributing areas, and collection materials can be selected that minimize contaminants of concern to optimize stormwater quality and minimize treatment requirements for the designated beneficial use. Even though all land uses have the potential for problematic water quality conditions in runoff, residential areas generally have lower concentrations of these contaminants than do commercial and industrial areas. Local data should be used to help select the best source area. On average, residential roofs have the highest quality runoff of the various source areas, but there are many exceptions. Copper and galvanized metals in roofing, piping, and stormwater capture tanks can create hazardous levels of lead, zinc, and copper in roof runoff. The presence of pets and urban wildlife can cause high levels of indicator bacteria, which may indicate the presence of disease-causing microorganisms. Regional stormwater capture and recharge systems drain large source areas and many land uses, and opportunities for catchment area separation may be limited. With increasing catchment area, stormwater quality will be more difficult to manage and treatment may be required prior to beneficial use. However, targeted source control of contaminants through materials management may be possible at larger scales. For example, stormwater containing high concentrations of road salt should be diverted from stormwater capture and infiltration systems. Limiting copper and other heavy metals in brake pads is another example.


