
4
Methods for Spatial Analysis: Identifying Scenarios
Lisa Wainger, research professor at the University of Maryland, discussed optimization modeling to analyze multi-resource management goals. She identified three elements to developing scenarios: economic efficiency, legal compliance, and social equity. Economic efficiency states that parcels (resources) will be utilized at their highest and best use. In practice, this translates to landowners using their land in a way that provides the highest income over time. Increasingly, however, public agencies are finding opportunities for preserving more land. Government protection creates a market condition to preserve agricultural land. Part of economic efficiency, she said, is the concept of cost-efficient landscapes and the maintenance of networks, energy transmission, and transportation on a large scale. Legal compliance generally relates to natural resource and human health protection, and to limits on incompatible land uses and environmental externalities. Social equity addresses the fair distribution of resources among society. Dr. Wainger presented an optimization model used to generate scenarios (Figure 4-1). The model was originally developed to address the need to meet a total maximum daily load of a pollutant by optimizing where on a landscape to place certain best management practices. The model represents a parcel of land or a landscape with certain constraints. One constraint was keeping producer profits neutral, meaning if something was done that impinged on another’s private profits, then there would be less likelihood that the action would be adopted. Other input to the model included available parcels and actions, costs and performance, and ecosystem service goals.
In describing the model, Dr. Wainger said that available parcels and actions address what land is available to convert to other land covers and other actions on the landscape. Those conversions and actions are then characterized in terms of
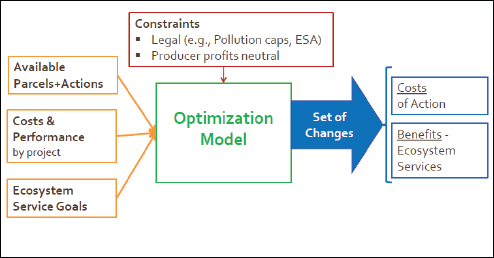
FIGURE 4-1 The components of an optimization model used to generate scenarios.
SOURCE: Lisa Wainger, Presentation, National Academies of Sciences, Engineering, and Medicine Workshop, June 2, 2015, Washington, D.C.
their costs and performance. For example, if the scenario was to develop the land, then the cost to convert the parcel and the monetary gain expected would be calculated. If instead it was a best management practice to reduce pollution, then the cost for implementation and the benefits achieved would be calculated. Dr. Wainger said the model was developed with ecosystem goals that were measurable. For example, the co-benefits of reducing pollution separate from the benefits achieved with legal requirements were quantified. Overall, the analysis from an optimization model reflects what the user perceives as important goals to set. The model computes all inputs to provide outputs that best meet all the user’s requirements while also reporting the results in terms of costs and benefits. The scenarios can vary by adjusting specific variables or more generally by focusing on broader goals, such as social equity. When using optimization models, she said, dollar values can be used, but other metrics can also be used as indicators of benefit. Such benefit indicators are based on economic principles, and can highlight which characteristics may cause harm or generate benefits.
Dr. Wainger presented case studies that address issues connecting the biophysical, social, and economic considerations as well as cumulative impacts. The first case study focused on cheatgrass in the Twin Falls District of southern Idaho.1 After cheatgrass areas in western grazing lands burn, mostly due to natu-
_________________
1 Wainger, L. A., King, D. M., Mack, R. N., Price, E. W., & Maslin, T. 2008. Prioritizing invasive species management by optimizing production of ecosystem service benefits. USDA Economic Research Service. [Available online: http://naldc.nal.usda.gov/download/32824/PDF]
ral processes, the BLM and USGS collaborate to restore the sites in order to prevent the intrusion of cheatgrass, which can dominate an area shortly after a fire. Dr. Wainger used an optimization model to analyze how a bundle of ecosystems services are maximized instead of just one service. Because it was not possible to have optimal grazing or sage-grouse habitat, the model was used to analyze how the two could coexist.
Under scenario A, the model found parcels that delivered multiple ecosystem service benefits at high levels, such as habitat protection, grazing, antelope hunting and recreation, and property protection from fire (Figure 4-2). Under scenario B, the model optimized conditions where agencies selected sites viewed as superlative for one service at time. Overall, the model outputs demonstrated that considering multiple benefits at once was more cost-effective. Successful restoration and prevention of cheatgrass was incorporated into the model as well as the actual decision process used by BLM. For example, one site under scenario B was selected because it was important for preventing fires, but did not have other co-benefits. Because the decision process BLM was using was incorporated, Dr. Wainger said, the model served as a decision support tool and not a decision-making tool.
Dr. Wainger presented another case study of an analysis on mining predominately in West Virginia that assessed an extreme scenario of 100 percent of mine permits being utilized and an intermediate scenario of 20 percent of mining permits being utilized (Figure 4-3).2 The analysis focused on one ecosystem service—freshwater angling benefits. The analysis incorporated biological models for determining game fish effects under mining scenarios and the resulting demand for fishing, which is considered a benefit indicator (Figure 4-4). Using a benefit transfer of fishing effects, monetary damages were generated from the scenarios. Dr. Wainger said the analysis demonstrated that if monetary decisions are based on one benefit, the spatial heterogeneity of the benefit can be used to separate out incompatible uses. Willingness to pay values, however, were not large relative to the value of coal, which shows the importance of trying to not meet all needs from one geographic area. The analysis demonstrated that recreational fishing impacts were fairly low in areas where mining was spatially separated from the population; however, there were clear resource-use conflicts when mining occurred in the more populated parts of the study area with recreational fishing.
Dr. Wainger summarized key concepts learned with optimization modeling. Scenario analysis can demonstrate preferred scenarios given a set of goals and constraints, how to best meet those goals, the co-benefits associated with meet-
_________________
2 Mazzotta, M., L. Wainger, and S. Silfleet. Assessing Lost Ecosystem Service Benefits Due to Mining-Induced Stream Degradation in the Appalachian Region: Economic Approaches to Valuing Recreational Fishing Impacts. Presented at Northeast Ag/Resource Economics Assoc, Morgantown, WV, June 1–3, 2014.
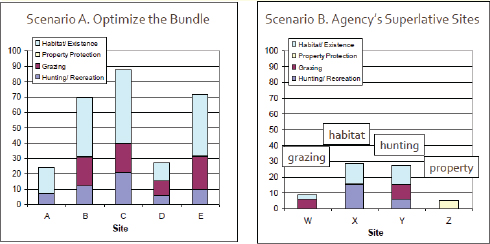
FIGURE 4-2 Output from scenarios A and B of the optimization model for restoration of burned areas to prevent cheatgrass intrusion.
SOURCE: Lisa Wainger, Presentation, National Academies of Sciences, Engineering, and Medicine Workshop, June 2, 2015, Washington, D.C.
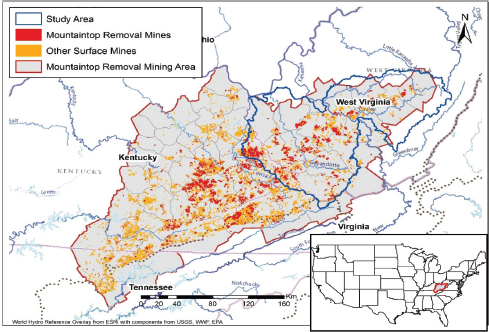
FIGURE 4-3 Modeling scenarios where mining occurred with 100 percent of mine permits being utilized and an intermediate scenario of 20 percent of mining permits being utilized.
SOURCE: Lisa Wainger, Presentation, National Academies of Sciences, Engineering, and Medicine, June 2, 2015, Washington, D.C.
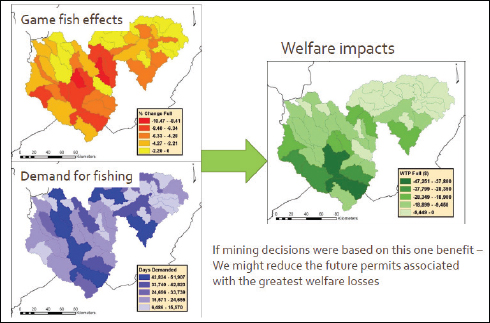
FIGURE 4-4 When monetary decisions are based on one benefit, the spatial heterogeneity of the benefit can be used to separate out incompatible uses.
SOURCE: Lisa Wainger, Presentation, National Academies of Sciences, Engineering, and Medicine Workshop, June 2, 2015, Washington, D.C.
ing those goals, and the costs associated with policy decisions. A landscape-scale analysis, cautioned Dr. Wainger, can be very sensitive to market fluctuations. For example, a seemingly simple issue like the value of corn can have large effects on the best use of a given parcel of land. Scenario analysis can reveal the costs, benefits, and sensitivities of specific policies.
Scenario analysis can demonstrate the landscape effects of policy decisions, and how applying the highest and best use principle can help clarify the best decision to make—it is a decision support tool. Dr. Wainger said benefit indicators and monetary values are useful for determining landscape-scale effects. Overall, she concluded, ideal scenarios are visions to be achieved, and by incorporating modeling tools, economic incentives, laws and policies, and social pressures, these ideals can be achieved.
Murray Hitzman, Charles F. Fogarty professor of economic geology at the Colorado School of Mines, discussed the relationship between multi-resource analysis (MRA) and mineral resources. Mineral resources are fixed in space unlike other natural resources, such as wildlife or water resources that move from one location to another. A challenge with developing mineral resources is the large volume of rock or soil required to be removed to extract a small amount
of the mineral, he noted. For example, copper mines produce copper from rock with between 0.5 to 1.5 percent copper (5,000 to 15,000 parts per million Cu per metric ton of rock).
Dr. Hitzman said that the extraction of mineral resources is not created equal with different minerals having very different physical and temporal footprints. The Olympic Dam copper mine in Australia is one of the largest copper mines in the world; however, it is underground and has a land surface disturbance of only 13 square kilometers. In contrast, the Gold Strike gold mine in Nevada is an open pit mine with a land surface disturbance of 130 square kilometers. A large open-pit copper mine in Utah was in operation for over 100 years, whereas a copper and gold mine in Wisconsin was in operation for only eight years. Mineral resources vary in their value as a commodity. Some minerals can be very high in value, such as diamonds or gold, and are transported throughout global markets hundreds or thousands of miles from where they are mined; however, other resources are lower in value, such as limestone and sand, and are transported only tens of miles from where they are mined.
Minerals can be economically important commodities at one point in time, but may lose that importance over time. Platinum was not considered an economically important commodity prior to the 1970s when catalytic convertors for automobiles were created. Platinum very quickly became a critical material for the United States. The global spatial distribution of minerals varies as well. For example, platinum deposits are not available in the United States, and are mostly located and mined in South Africa. Copper and zinc deposits, however, are mined in many countries, including the United States. Thus, different minerals have different supply risks. The National Academies of Sciences, Engineering, and Medicine issued a report3 on the criticality of minerals, which defined criticality based on its importance and supply risk (Figure 4-5).
Dr. Hitzman said that a prospective analysis would determine if a landscape has the potential for a mineral resource, and a reactive analysis would determine the impact on the landscape of developing that resource. Reactive analysis, he said, determines whether an impact on a landscape is compatible with other services provided by the landscape (e.g., water supply, recreation, energy). The analysis is based mostly on environmental impact statements and environmental impact assessments of a site prepared by the private sector; however, regulatory land and environmental agencies must consider all potential impacts over a long time scale. A prospective analysis, said Dr. Hitzman, is more similar to an MRA because it requires a wide scope and is in line with the type of studies government agencies conduct.
This analysis would address finding geologically favorable areas for mineral resources, the likelihood of economically significant amounts, and the potential
_________________
3National Research Council (NRC). 2008. Minerals, Critical Minerals, and the U.S. Economy. Washington, D.C.: The National Academies Press.
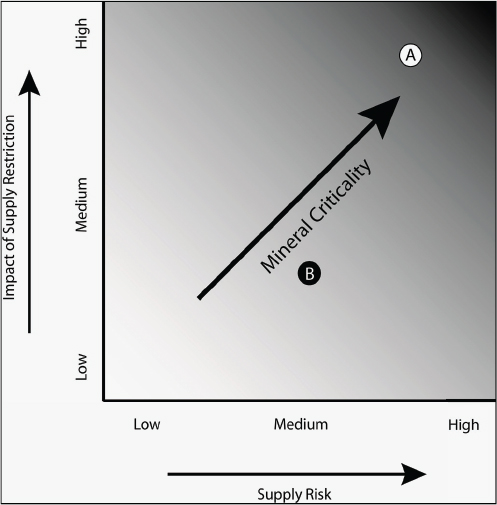
FIGURE 4-5 The criticality of a mineral as a function of its impact on supply restriction and supply risk.
SOURCE: NRC (2008) and Murray Hitzman, Presentation, National Academies of Sciences, Engineering, and Medicine Workshop, June 2, 2015, Washington, D.C.
environmental and/or social impacts of exploring and extracting the resources. The analysis would also address the economic risk and benefits of a private sector entity investing in the extraction of those resources in a way that minimizes impacts on the landscape. A private sector entity could use such information to determine the potential return on an investment and whether it is great enough to warrant the initial investment and potential risk.
Dr. Hitzman said that the role government has in conducting MRA for mineral resources would be to delineate areas with mineral deposits—such as is currently done through USGS geological mapping—classify land where mineral
resource development can occur, and identify areas where other land-use considerations preclude mineral development. Dr. Hitzman provided an example of government information aiding mineral development from Gawler Craton, South Australia. The government derived geophysical (magnetic and gravity) surveys, which led to the development of numerous geophysical targets. Such maps are two-dimensional and provide an image of minerals in the subsurface. These government-derived geophysical maps illustrate where the greatest mineral potential is, and are critical for prospective analysis by the private sector. Dr. Hitzman said that development of different products by government agencies is helpful to the mineral industry, including ore deposit models, geologic maps, and geophysical data to help determine geographically favorable areas. Also, he added, data are critical for developing these products, and landscape and commodity criticality data are needed to guide decision making in developing resources.
Dr. Hitzman commented that MRA should ask whether or not a landscape has the potential for societally beneficial mineral resources. Societally beneficial aspects can include the criticality of the deposit and infrastructure improvements, such as roads. MRA would also assess the economic value or benefit needed to overcome possible adverse impacts to the environment or landscape. Mineral resources are fixed in their location, which often results in conflict among stakeholders with a decision to extract a mineral resource. This conflict, Dr. Hitzman said, is why MRA is needed—to provide more informed decision making.
Dean Urban, professor of landscape ecology at Duke University, presented on the challenges that biophysical heterogeneity and social factors pose when managing landscapes and on multi-criteria decision frameworks for informing decisions on landscape management. He presented the software program Portfolio, which was developed for a Nature Conservancy (TNC) project assembling eco-regional portfolios.4 The software uses what he termed a greedy algorithm that allows users to assess conservation practices for different sites. A greedy algorithm follows a problem-solving heuristic of making the locally optimal choice at different stages with the hope of finding a global optimum. The TNC project assessed habitat patches in terms of biodiversity, species richness, species rarity, habitat geometry, area effects, edge effects, and threats from development. Dr. Urban said that the program was originally written nearly 15 years ago to teach graduate students about multi-criteria decision analysis, and he is encouraged to see the traction multi-criteria decision analysis has gained especially with leadership from USGS.
One lesson learned over the years, he said, is that practitioners are not interested in an optimal solution, but rather are interested in reaching better solutions. A portfolio of sites in the program is developed by assessing many different sites with many different capabilities. TNC, Dr. Urban said, deliberately used the term
_________________
4 Urban, D. 2002, in Learning Landscape Ecology: A Practical Guide to Concepts and Techniques, G. E. Sarah and M. E. Turner, eds. Berlin, Germany: Springer.
“portfolio” because, like a retirement portfolio with different financial investments, there are different risks and potential returns for each site. Individual sites are not being optimized, but rather a whole set of sites are optimized. The Portfolio software package is a decision framework with two pieces—an objectives hierarchy and a path model. The objectives hierarchy is a statement about what is being measured in the system and the targets that are set. In the TNC example, the target was to preserve biodiversity. There were different objectives—diversity, patch geometry, and landscape context. Each objective is indexed by empirical indicators, such as richness in biodiversity. The objective hierarchy is coupled to the path model, which is a statement about how actions will affect those objectives. It is a causal chain that links actions to outcomes, and is also intended to capture indirect effects that lead to impacts on non-target resources.
For many ecological applications, the links are implicit in the path model. For example, “area” as an indicator invokes the species-area relationship, geometry (e.g., edge/area indices), edge effects (e.g., forest birds in eastern United States), and connectivity. Dr. Urban presented an example of landscape-scale management of forests to reduce the risk of catastrophic fires. A simple path model would posit that managing a forest understory would reduce catastrophic fire risk. Thus, changing the forest structure by managing lighter fuels and fuel bed connectivity should result in a reduction in fire risk. Extending the path model allows a landscape manager to consider other factors that would be affected by managing the forest structure in this way; however, there is much work needed in better understanding all the connections. There has been extensive work on fire management in the western United States, for example, but little progress made on using wildlife habitat suitability models to examine what that management means for biodiversity.
Dr. Urban said that extending such applications to ecosystem services requires extending the ecologist’s view of ecosystem structure and dynamics to the supply of ecosystem services to stakeholders. To do this, stakeholders need to be identified and supplied those services, which is captured using a human well-being index. The index is quantified by monetization. There is a need, he said, for more datasets and models that would help identify stakeholders and their preferences for how resources should be managed. There is also a need for more data on ecosystem services at large spatial scales. A crucial step in extending application to ecosystem services is the service area analysis, which identifies benefits to stakeholders. Dr. Urban provided an example from the Triangle Land Conservancy in North Carolina, which identified stakeholders that most benefited from access to nature reserves held by the land trust but available to the public. The service areas were analyzed in increments of 5-, 10-, 15-, and 30-minute travel times from seven different reserves. The analysis found that the reserves were more accessible to white and wealthier stakeholders living in proximity to those reserves. Dr. Urban said that the geographic information system (GIS) used to conduct such an analysis was originally developed, to some extent, to do such an analysis but needs to be developed further so that it helps make land manage-
ment and stakeholder decisions. For example, he said, GIS needs to be better integrated into planning to determine where to best site public services, such as fire stations or hospitals, which optimizes access to stakeholders.
One challenge, Dr. Urban noted, is there is no single overarching model that can pull together all the different components required for a full assessment of management options and link them to public well-being. The Federal Guidebook on Managing Ecosystem Services, launched in December 2014, provides alternative matrices of management scenarios and ecosystem systems.5 The benefits garnered from the intersection of the services and management scenarios fill in the matrix. Constructing such a matrix allows the manager to quickly assess the value of different benefits derived from alternative scenarios. He provided an example of forest thinning from the guidebook, which positions various models (i.e., fire behavior, species distribution and population, and air plume models) between key elements of the path model (i.e., forest structure, fire behavior, species habitat, species population, and air quality). He emphasized that there are multiple models invoked throughout the assessment to estimate the production of services and value of those services. There is no single model, however, that can pull together all of the individual components to elucidate the ecosystem service values of fire management and the effect the services ultimately have on social well-being, such as the effect on healthcare costs from changes in air quality. Dr. Urban concluded that the chain-of-custody approach with multiple individuals conducting one part of the analysis and then passing it along to others leads to errors throughout the assessment process; there needs to be improved stewardship of the process.
In the question-and-answer session, the panelists responded to a question about overcoming the challenge of providing ecological outputs from models that are then used as inputs to economic models. Dr. Urban said that as an ecologist working with economists he finds it rewarding to produce model outputs in a format that economists can readily use. He added that although it may seem a simple process, it is challenging because it requires ecologists to shift their thinking about how they develop and produce model output. Dr. Wainger said it is a continuing area of work and that often the models do match directly, but there are ways to work around incompatibilities. For example, using benefit indicators suggests that not all data from models will be able to fit together for an evaluation, however, taking into consideration the public’s concerns and preferences is still possible to estimate relative differences in benefits. Dr. Hitzman added that the data from any one person’s work should be able to be used in other models and understood by other professionals. It would, however, require many professionals to change the type of output they produce.
Another question posed to the panelists was about how to connect dis-
_________________
5 National Ecosystem Services Partnership. 2014. Federal Resource Management and Ecosystem Services Guidebook. Durham: National Ecosystem Services Partnership, Duke University. [Available at: https://nespguidebook.com].
parate types of natural resources. The panelists had spoken about commodity criticality, optimization, and MRA as themes in their talks. The question posed was if commodity criticality could be integrated into MRA, and similarly, could commodity criticality also encompass optimization criteria. Dr. Wainger replied that performance, costs, and benefits can all be incorporated into an optimization model. The scale of the analysis has to be in line with the questions being asked. For example, she said, in her mountaintop mining case study there was a solution provided by the optimization model for a given question within a set area; however, if that area is broadened out to include other regions, a different solution may be optimal. Dr. Urban emphasized that methods used in a multi-criteria analysis are well suited to incorporate risk and uncertainty. Dr. Hitzman agreed that tools already exist to bring optimization and risk assessment methods into an assessment of commodity criticality.
A final question related to how to address error propagation in modeling; even with ideal data, a model will have a range of errors associated with the output. As the output from one model is used in other models, the output of those models, and their associated errors, are then used in more models. There is an accumulation or propagation of errors throughout the series of model outputs. Dr. Urban responded that especially when working in fairly complicated models, error propagation can occur very quickly. It is critical, he said, to be transparent about how much uncertainty there is in a model so that it is clear to stakeholders. He added that by being transparent and knowing where in the model there is error propagation allows an agency conducting the modeling to invest in resources necessary to minimize that uncertainty. This is a key component of adaptive management. Dr. Wainger said that error propagation can often be hidden, but can be minimized by ensuring the right level of detail is included in models used in a decision making context. It is useful, she added, to use a more conceptual model when there is more uncertainty in the data, and that it is not critical to have a robust decision; there can be a range of methods used to arrive at a decision without using complex models and conducting a rigorous uncertainty analysis.
This page intentionally left blank.


