
2
Context
To understand the utility of estimates of obesity prevalence and trends, it is important to reflect on what these types of reports offer. Prevalence studies describe the magnitude of the issue in one or more population groups at a single point in time. Trends reports describe whether the prevalence is increasing, decreasing, or staying the same in one or more population groups
over a defined period of time. Such information about the scope and status of obesity within a population is descriptive and relatively circumscribed in nature. However, it serves as key evidence for decisions related to policies, strategies, advocacy, programs, and plans for forward progress.
Before considering specific methodological approaches and the complexities associated with understanding and using such reports, several fundamental concepts must first be considered. First is the definition of obesity. Although many perceive it as a straightforward, dichotomous characteristic, it can be assessed and categorized in various ways. Second is the concept of obesity across the life course. Obesity during childhood, adolescence, and young adulthood does not operate in isolation, and has implications for the current and future health of the nation. Finally, the concept of subgroup analyses is introduced. Although the prevalence of obesity can vary by a host of factors, population-level assessments most consistently capture and differentiate subgroups based on demographic characteristics. Framing this concept is a discussion of social disadvantage and health disparities.
DEFINING OBESITY
Obesity is a general term that describes a state of excess adiposity (body fat) (Krebs et al., 2007). Although this definition appears simple, it is a condition with complex ties to biological, behavioral, and environmental factors (Albuquerque et al., 2015; Rosenquist et al., 2015; Swinburn et al., 1999). No single test definitively and universally identifies obesity. For descriptive purposes, obesity must be operationalized into a metric that can be categorized. As such, obesity status is classified based on a measure and a criterion or cut point.
Approaches to Assessing Adiposity and Obesity Status
Obesity status is assessed in clinical, research, and public health settings through a variety of approaches. Some evaluate body composition, differentiating lean body mass from adipose tissue. Others are surrogate measures of central (abdominal) or total adiposity. The sections that follow provide brief overviews of different approaches to assessing adiposity and obesity status. Discussion of specific disease outcomes in relation to some of the measures is included to highlight how such measures are often used or regarded in the literature. As noted in Chapter 1, however, it is beyond the scope of this report to provide a comprehensive overview of the association between measures of adiposity or obesity and chronic disease. Furthermore, the intent of this section is not to be exhaustive—and indeed, approaches other than those listed below exist. Instead, this section highlights the challenges of using various measures of adiposity for population-based
assessments, providing a rationale for why body mass index (BMI) is the predominant method used in reports on obesity prevalence and trends.
Dual-Energy X-ray Absorptiometry
Dual-energy X-ray absorptiometry (DXA) estimates bone mineral density, fat mass, and lean body mass based on the attenuation of two X-rays of differing energy levels as they pass through the body. Body composition estimates are derived from system-specific algorithms, which can differ between DXA machine manufacturers (Sopher et al., 2004). Various percent body fat cut points have been used to classify obesity using DXA, which further limits comparability across assessments. Although considered accurate in estimating bone density (Wells, 2014), DXA may be less accurate in providing estimates of body fat in individuals who have obesity, as well as for those on the leaner end of the spectrum (Knapp et al., 2015; Toombs et al., 2012). Because the machines have limits to the size of individual who can be successfully scanned (Wells et al., 2010), DXA may not adequately characterize entire populations, especially those with high levels of severe obesity. The radiation dose associated with a single DXA scan is considered safe for the general public, but not for pregnant women (Hu, 2008). DXA scans require specialized equipment and trained personnel, and as such, are limited to the clinical setting.
Bioelectrical Impedance Analysis
In a bioelectrical impedance analysis (BIA), an electrical current is sent through the body and the measured resistance to the current is used to calculate total body water, lean body mass, and fat mass (Kyle et al., 2004a). The measured resistance is contingent on the amount of fluid people have in their bodies, which differs significantly on an individual basis and can be affected by a number of factors, including hydration status, obesity status, and recent physical exercise (Hu, 2008; Kyle et al., 2004b). Although BIA is relatively inexpensive, portable, and non-invasive, a systematic review conducted by Talma et al. (2013) suggests that it can suffer from measurement errors and may not be suitable for assessing total body fat in children and adolescents. Various percent body fat cut points have been used to classify obesity using BIA.
Body Densitometry—Underwater Weighing and Air-Displacement Plethysmography
Both underwater weighing and air-displacement plethysmography (ADP) evaluate body composition based on body density. In underwater
weighing, body density is calculated from an individual’s weight on land, weight under water, and total volume of water displaced (Hu, 2008). The protocol for underwater weighing requires an individual to be fully submerged, to have blown out as much air from the lungs as possible, and to remain still while the measurement is being taken. In ADP, air is used as the medium instead of water. ADP is safe for most individuals, whereas underwater weighing is not appropriate for children or older adults, due to full body submersion (Hu, 2008). Both underwater weighing and ADP require highly specialized equipment, and trained personnel to take the measurements. Such assessments of body density are primarily conducted in controlled research settings.
Skinfold Thickness
Skinfold thickness assessments use calipers to measure a double fold of the skin and subcutaneous fat (fat under the skin) at various selected sites on the body (Hu, 2008). The caliper measurements are used in predictive equations to assess an individual’s percent body fat. Various percent body fat cut points have been used to classify obesity using skinfold thickness. Although skinfold thickness measurements are inexpensive to perform, their reliability is particularly dependent on the training and expertise of the person taking the measurement (Oppliger et al., 1992; Shaw, 1986).
Waist Circumference
Waist circumference measurements are used to assess abdominal obesity. Although it may be useful for predicting health risks, waist circumference does not differentiate between subcutaneous fat and visceral fat (fat around organs) and needs to be appropriately adjusted for age and BMI, as different cut points exist for children and adults (Fryar et al., 2012; Vazquez et al., 2007). Protocols vary in the anatomic site of where the measurement is taken. The National Health and Nutrition Examination Survey (NHANES) anthropometry manual, for example, instructs exam staff to take the measurement at the top of the ilium (hip bone) (CDC, 2013). Anatomic sites used in other protocols have included directly below the lowest rib cage, at the umbilicus (belly button), midway between the lowest rib and the top of the ilium, and at the narrowest part of the torso (Wang et al., 2003). The variability in the protocols used to measure waist circumference can limit the comparability and ultimately the utility of using waist circumference (Mason and Katzmarzyk, 2009). Furthermore, although waist circumference percentiles have been developed using data for U.S. children and adolescents (Fernandez et al., 2004), they are not the only reference that exists (Freedman et al., 2015a). Various cut points and
criteria for classifying waist circumference can lead to different estimates of obesity prevalence (Monzani et al., 2016).
Waist-to-Hip Ratio and Waist-to-Height Ratio
Waist-to-hip ratio (WHR) and waist-to-height ratio (WHtR) are two indices that also have been explored for their utility in defining obesity and associated health risks. The strengths of WHR are aligned with those of waist circumference, but as it requires two circumference measurements—both difficult to define and standardize—it is therefore more prone to error than is waist circumference alone (Hu, 2008; Vazquez et al., 2007). Recent work evaluating the use of WHtR suggests a simple cut point independent of age is sensitive in identifying children with elevated percent body fat (Nambiar et al., 2010) and may distinguish children with higher cardiometabolic risk (Mokha et al., 2010), although results are not conclusive (Bauer et al., 2015). Ashwell et al. (2012), in a systematic review of the literature, found WHtR to be a useful predictor of certain cardiometabolic risks in adults of both sexes and across racial and ethnic groups. Ultimately, the utility of WHtR is still limited by the need to measure waist circumference.
Body Mass Index
BMI is calculated by dividing an individual’s weight in kilograms by height in meters squared (kg/m2). BMI does not differentiate between lean body mass and adipose tissue and does not reflect body fat distribution. Accordingly, the Centers for Disease Control and Prevention (CDC) describes BMI as a screening tool for a person’s adiposity status rather than being diagnostic (CDC, 2015a). For children and adolescents, standard BMI classification criteria (discussed in the next section) can differentiate those with high adiposity from those with lower adiposity with a moderate degree of sensitivity and specificity (Flegal et al., 2010; Freedman and Sherry, 2009).
Although BMI serves as a proxy for adiposity, the relationship can vary across population groups. A highly muscular athlete, for example, may have an elevated BMI due to lean muscle mass rather than excess adipose tissue, leading to a classification of overweight with a relatively low body fat percentage (Ode et al., 2007). Adiposity also can vary with race and ethnicity. Evidence suggests that at the same BMI, blacks tend to have a lower body fat percentage than whites and some Asian populations tend to have a higher body fat percentage than whites (Flegal et al., 2010; Wagner and Heyward, 2000; WHO Expert Consultation, 2004). Flegal et al. (2010) also reported variation in body fatness by sex in Mexican-American children as compared to non-Hispanic black and white populations with the
same BMI. Age also is a consideration. The use of BMI among older adults may not adequately reflect changes in body composition, as lean body mass has a tendency to decrease and adiposity can increase as a person ages and can occur in weight-stable individuals (Ding et al., 2007; Hughes et al., 2004; Zamboni et al., 2003). Finally, recommendations and practices do not currently support the use of BMI among infants and toddlers younger than age 2 years for the purposes of weight status classification (see Box 2-1).
In spite of its limitations, BMI has methodological advantages over other existing approaches for the purposes of population-based assessments. For example, measurement of height and weight is pervasive in public health and medical settings, and accordingly, BMI can be readily calculated from such administrative data. Moreover, unlike other available approaches to assess adiposity, BMI is based on two intrinsic characteristics (height and weight) that individuals can report about themselves or about their children.1 As a result, questions about a participant’s height and weight are included a variety of surveys that could not otherwise collect directly measured height and weight data on participants (see Chapter 4). BMI is pervasive in the obesity prevalence and trends literature for population groups ages 2 years and older, and will therefore be the primary obesity classification approach discussed throughout this report.
Using BMI to Classify Obesity Status
Although obesity is often thought of as dichotomous—either people have it or they do not—its classification is based on a continuous variable that has to be categorized. The classification approach differs for adults and children, as discussed below.
Classification of Obesity in Adults
For adults, BMI is classified based on set ranges, and obesity is categorized into classes that apply to all ages and both sexes (see Table 2-1). The adult cut point for obesity, 30 kg/m2, has been associated with increased risk of mortality and morbidity (Berrington de Gonzalez et al., 2010; WHO, 1995, 2004). Some populations, particularly Asians, exhibit higher adiposity and elevated morbidity risk at lower BMI thresholds (Gray et al., 2011; Ko et al., 2001; Wen et al., 2009). A World Health Organization (WHO) expert consultation recommended using additional cut points for public health action for many Asian populations, but agreed that the
___________________
1 The accuracy of self- and proxy-reported heights and weights is discussed in greater detail in Chapter 3.
TABLE 2-1 Classification of Adult Weight Status Using Body Mass Index Cut Points
| Classification | BMI Ranges (kg/m2) |
|---|---|
| Underweight | <18.5 |
| Normal | 18.5-24.9 |
| Overweight | 25.0-29.9 |
| Obesity, Class I | 30.0-34.9 |
| Obesity, Class II | 35.0-39.9 |
| Obesity, Class III | ≥40.0 |
SOURCE: NHLBI, 1998.
standard adult cut points be retained for international classification (WHO Expert Consultation, 2004). Accordingly, use of the 30 kg/m2 cut point is standard for categorizing obesity status across population groups.
Classification of Obesity in Children, Adolescents, and Young Adults
Compared to adults, using BMI to classify obesity status in children ages 2 years and older is a more involved process. The calculated BMI must
be compared to a classification criterion that accounts for dramatic changes in height, weight, and body composition that occur over the course of childhood and vary by sex. The following sections describe the developmental considerations that prevent the use of a single BMI cut point approach that is used for adults and describe how reference populations are used to classify obesity status.
Developmental Considerations Growth, development, and maturation are hallmarks of childhood and adolescence. Although often represented by age groupings, biologic and physiologic developmental stages do not follow a strict chronologic timetable. A considerable amount of interpersonal variation is considered well within the realm of normal development, as well as observed differences between boys and girls (Ogden et al., 2011). Two developmental periods particularly affect BMI: adiposity rebound in preschool-aged children and puberty.
Adiposity rebound The BMI of preschool age children typically changes in a non-linear pattern, often referred to as “adiposity rebound.” This is a period during which a child’s height velocity should be faster than weight velocity, resulting in a leveling or decrease in BMI until it reaches its nadir. BMI then begins to increase in a linear fashion, typically between ages 4 to 7 years. The timing and velocity of the rebound can be quite variable (Hughes et al., 2014).
Puberty The relationship between puberty and obesity is complex (Crocker et al., 2014). BMI increases during puberty, with a more rapid increase during Tanner stages 1 to 3 than 4 to 5 (Xu et al., 2012). In females but not in males, percentage of body fat increases with advancing puberty (Xu et al., 2012). Longitudinal studies in girls have indicated that elevated BMI in prepuberty is associated with earlier puberty onset (Davison et al., 2003) and earlier menarche (Anderson et al., 2003). Analysis of secular trend data show that both pubertal onset and completion are now occurring at younger ages in females (Euling et al., 2008). Results from a recent study suggest that boys who are overweight have earlier pubertal timing than either normal weight boys or boys with obesity, and that boys with obesity have later pubertal time than either of the other two groups (Lee et al., 2016). Another study found an increase in likelihood of entering puberty with increasing BMI-for-age status among girls of the same age and race, but no such association was seen in boys (Crocker et al., 2014). Race and ethnicity also affect pubertal timing, with African American girls experiencing earlier pubertal initiation and menses than do white girls, with intermediate pubertal timing for Mexican American girls. African American boys enter puberty at earlier ages than do white boys (Herman-Giddens et al., 1997, 2001). Ideally, to comprehensively interpret a BMI value, information about maturation would be considered. Collecting such information
outside of the clinical setting, however, is challenging. As such, age is often used as a proxy, with the understanding that it encompasses physiologic heterogeneity.
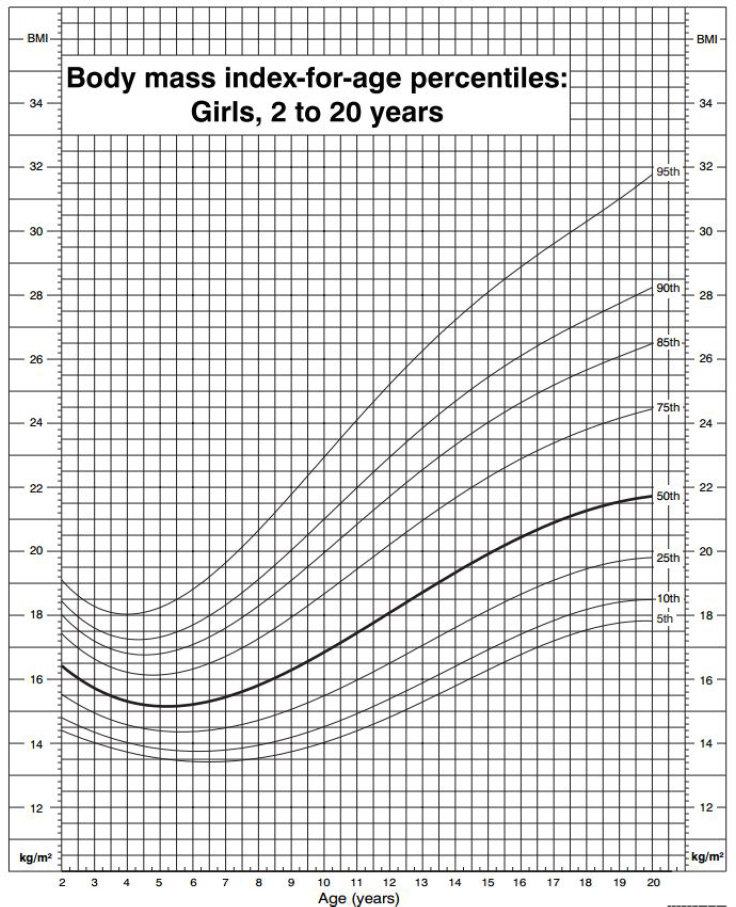
Use of Reference Populations to Classify Obesity Status To account for the changing BMI throughout childhood and adolescence, obesity status is determined through the use of a reference population. A reference population is a defined group of individuals whose data serve as the basis for comparisons. For the purposes of obesity classification, children and adolescents’ BMIs are compared to the distribution seen in the reference population, which are often visualized as growth charts (see Figure 2-1).
Although various reference populations exist (discussed in Chapter 5), the 2000 CDC sex-specific BMI-for-age growth charts are most commonly used to classify the obesity status of U.S. children and adolescents.2 In its current form, obesity classification in children is statistical—that is, it is a comparison to a distribution that previously existed in a population—although elevated values have been associated with various health risks (Freedman et al., 2015b; Kurniawan et al., 2014; Weberruß et al., 2015; Weiss, 2007). Table 2-2 presents the percentile cut points used to classify weight status based on the 2000 CDC BMI-for-age growth charts (see Box 2-2 for description of percentile). Since 2007, children, adolescents, and young adults who are at or exceed the 95th percentile have been classified as having obesity. When reviewing literature more than a decade old, it is important to note that the nomenclature regarding the 95th percentile has changed over time (see Box 2-3).
Classification of severe obesity Although the standard approaches to classifying obesity status for children, adolescents, and young adults typically accounts for changes in BMI that occur due to growth, ultimately classification is still based on a single criterion (e.g., 95th percentile on the 2000 CDC BMI-for-age growth charts). Obesity status, however, has been further classified based on how far away a value falls from the selected cut point. A range of approaches and nomenclature have been used over the past decade in an attempt to describe different levels of obesity in children.
The classification approaches and nomenclature of severe obesity in children is a function of the evolution that that has taken place over time. One previous approach was to use a higher percentile cut point (e.g., ≥99th percentile on the CDC BMI-for-age growth charts). Given that it is not advisable to extrapolate beyond the 97th percentile on the CDC growth charts (Flegal et al., 2009; Kuczmarski et al., 2000), alternative methods have emerged (Gulati et al., 2012). The prevailing cut point currently in use
___________________
2 Other CDC growth charts exist for children ages 2 years and older, including sex-specific weight-for-age and stature-for-age.
SOURCE: CDC, 2010.
is 120 percent of the 95th percentile on the CDC growth charts (Flegal et al., 2009). Investigators have further differentiated this category by dividing groups at 140 percent of the 95th percentile (Skinner and Skelton, 2014; Skinner et al., 2015).
TABLE 2-2 Classification of Weight Status for Children Ages 2-19 Years According to 2000 CDC Sex-Specific BMI-for-Age Growth Charts
| Classification | Percentile Cut Points |
|---|---|
| Underweight | <5th |
| Normal Weighta | 5th to <85th |
| Overweight | 85th to <95th |
| Obese | ≥95th |
a The phrase “healthy weight” has also been used to describe this BMI-for-age percentile range.
SOURCE: CDC, 2014.
OBESITY ACROSS THE LIFE COURSE
This report describes the approaches to and challenges of assessing obesity prevalence and trends, primarily among children, adolescents, and young adults. Although the distinction between children and adults exists for descriptive and methodologic reasons, the scope of the obesity epidemic cannot be fully understood without considering the entire life course. Because childhood is not a static characteristic, but instead a life stage leading to adulthood, it has both longitudinal and population-level implications.
Longitudinal evaluations of weight status provide insight into how obesity tracks in an individual over time. Evidence from such studies indicates that having obesity during childhood is associated with obesity status later in life. Nader et al. (2006) for example, evaluated the longitudinal weight status of 1,042 children and found that those who had an elevated BMI at any point during ages 2 to 5 years were five times as likely to have an elevated BMI at age 12 years compared to those whose BMIs were persistently in the normal range during their preschool years. In a published report on the Great Smoky Mountains Study, investigators identified four distinct weight status paths among 991 rural youth over an 8-year period (ages 9 to 16 years): (1) no obesity (73 percent of participants); (2) chronic obesity (15 percent of participants); (3) childhood obesity that resolved in adolescence (5 percent of participants); and (4) no childhood obesity but emerging adolescent obesity (7 percent of participants) (Mustillo et al., 2003). Furthermore, findings from the National Longitudinal Study of Youth suggest that adolescents ages 16 and 17 years with obesity had the highest probability of obesity at age 37 to 38 years (80 percent among males and 92 percent among females) (Wang et al., 2008).
Obesity during childhood, however, is not the sole pathway to adult obesity. Freedman et al. (2005), using longitudinal data from the Bogalusa Heart Study, reported that while children who had a BMI ≥95th percentile were likely to have obesity in adulthood, only about 20 percent of adults with elevated weight or adiposity status had a BMI ≥95th percentile during childhood. Similarly, analyses of National Longitudinal Study of Adolescent Health data found that while the majority of adolescents with obesity continued to have obesity into their 20s and 30s (the assessment period), the prevalence of obesity also increased as the cohort aged, with incident cases occurring during adulthood (Gordon-Larsen et al., 2010).
Differences in childhood and adulthood obesity also can be considered from a population perspective. Trends based on nationally representative data show that prevalence is substantially higher than it was 40 years ago among both children and adults (Fryar, 2014a,b) (see Figures 2-2 and 2-3). The directionality of trend seen among children mirrors that of adults, although at different levels of prevalence (approximately 17 versus 35 to 36 percent,
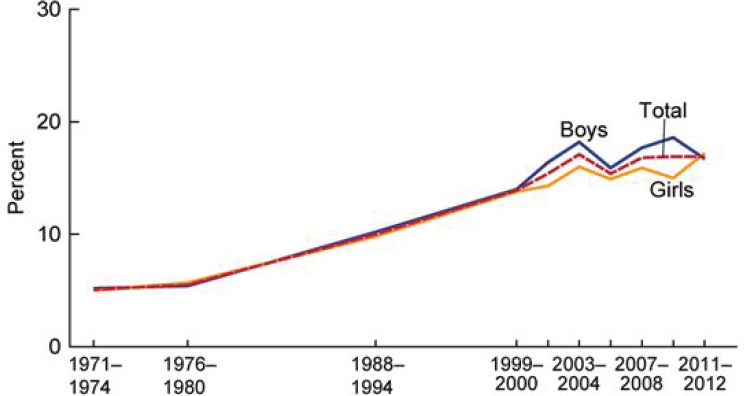
NOTE: Obesity was defined as a BMI greater than or equal to the sex- and age-specific 95th percentile from the 2000 Centers for Disease Control and Prevention Growth Chart.
SOURCE: Fryar et al., 2014a.
respectively) (Ogden et al., 2014, 2015).3 Considering children younger than age 18 years currently constitute less than one-quarter of the total U.S. population (Howden and Meyer, 2011; U.S. Census Bureau, 2016), the majority of the more than 90 million Americans estimated to be affected with obesity are adults (Ogden, 2015). Nevertheless, approximately 13 million children and adolescents are estimated to have obesity in the United States.
Although the number of children and adults affected with obesity alone is striking, the need and importance of monitoring obesity across the lifespan can be further contextualized by considering its negative health effects. Comorbidities and metabolic dysregulations associated with obesity exist in children and adults at the population level.4 Impaired glucose tolerance
___________________
3 Estimates are based on current obesity classification criteria used in the United States, which are different for adults and children. The differences in obesity status classification are explained earlier in this chapter.
4 Two caveats are associated with this statement. First, chronic diseases are multifactorial. Disease origins and progression are typically attributed to a collection of factors, not just one. As such, obesity is one of several components of these conditions. Second, associations summarize the group-wise relationship, not individual trajectories. Given the broad range of environmental, genetic, lifestyle, and biologic factors at play, not all individuals with obesity will develop all of the conditions and not all those affected with the conditions will have obesity.
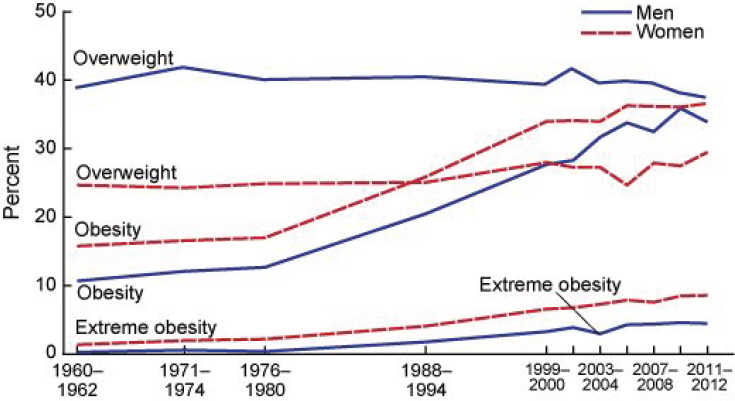
NOTES: Age-adjusted by the direct method to the year 2000 U.S. Census Bureau estimates using age groups 20 to 39 years, 40 to 59 years, and 60 to 74 years. Pregnant females were excluded. Overweight is a BMI of 25-29.9 kg/m2; obesity is BMI >30 kg/m2; and extreme obesity is a BMI >40 kg/m2.
SOURCE: Fryar et al., 2014b.
and insulin resistance, for example, have been linked to weight status and weight gain in children (Weiss, 2007). Risk of developing type 2 diabetes is increased in men and women with obesity and appears to increase with weight gain during adulthood (de Mutsert et al., 2014; Kodama et al., 2014). Obesity in adulthood has been associated with structural and metabolic changes linked to cardiovascular disease (Bastien et al., 2014). For children and adolescents, evidence suggests that obesity is associated with both an increase in cardiovascular risk factors and structural cardiovascular changes, such as increase in vascular intimal thickness and retinal vascular changes (Freedman et al., 2015b; Kurniawan et al., 2014; Weberruß et al., 2015). The persistence of obesity from childhood into adulthood also may have implications for risk of cardiovascular disease (Juonala et al., 2011). Some data suggest an association between elevated BMI during childhood and certain cancers, but the results far from conclusive (Park et al., 2012). Childhood obesity also has been associated with a range of conditions and outcomes, including obstructive sleep apnea, liver disease, orthopedic conditions, polycystic ovarian syndrome, increased incidence of bullying and teasing, depression, and anxiety (Barlow, 2007). Thus, measuring and
understanding obesity prevalence and trends across the lifespan has greater implications than simply characterizing weight status of a population.
DEMOGRAPHIC FACTORS AFFECTING THE PREVALENCE OF OBESITY
Estimates of obesity prevalence at the overall population level subsume the variability within a population and can obscure important differences that may exist. Subpopulations can differ in prevalence of obesity and in relation to obesity trends over time. Subgroup analyses need to be performed in order to determine who is affected, to what extent, and if trends differ. Individuals can be categorized by any number of factors, to the extent that data are available and the sample sizes support such comparisons. For the purposes of population-based assessments, however, groups are most often defined by demographic characteristics. Although not all comparisons are evaluations of health disparities, the assessment of health disparities typically rely on demographic characteristics (see Box 2-4).
Subgroup comparisons shed light on differences in populations, but these differences do not necessarily represent burden. This concept can be illustrated with a hypothetical example. A population of 100,000 individuals is divided into subgroups. One subgroup represents 5 percent of the popula-
tion and has an obesity prevalence of 20 percent (i.e., 1,000 individuals have obesity), while another subgroup encompasses 50 percent of the population and has a prevalence of 10 percent (i.e., 5,000 individuals have obesity). In this scenario, because one subgroup comprises a larger portion of the total population, the number of individuals affected in that group is larger than the smaller subgroup with a higher prevalence. This concept of burden is not intended to detract or diminish from assessments of differences and health disparities. Rather, it offers contextual insight into the difference.
The following sections provide an overview of relationships between obesity prevalence and key demographic factors. The information provided is largely based on national-level survey data, particularly NHANES. As will be described in Chapter 4, NHANES is the only ongoing, nationally representative population survey that collects directly measured height and weight data on participants of all ages. The relationships that are seen at the national level may not exist in every state or community. To that end, this section should be regarded as a general discussion of how individual factors may be pertinent to obesity prevalence and trends. The committee also acknowledges that behavioral, biological, and environmental factors affect the prevalence of obesity, but to be consistent with its task, it has chosen to focus only on demographic factors. Finally, the differences that are highlighted here are occurring against a backdrop of changes to the demographic landscape of the country (see Box 2-5). The demographic shifts in the U.S. population not only affect the interpretation of current estimates, but have implications for long-term assessments of the overall population and population groups.
Sex
Obesity prevalence and trends analyses are often stratified by sex, because sex plays a role in adiposity status. Boys and girls, for example, have different patterns of growth throughout childhood and therefore necessitate different sex-specific growth references (Kuczmarski et al., 2000). Assessment of body composition also suggests that after age 11 years, males generally have higher fat-free mass than do females, and females generally have higher total body fat and percent body fat compared to males (Borrud et al., 2010).
Nationally representative data from 2011-2012 suggest that the prevalence of obesity may not differ statistically between boys and girl ages 2 to 19 years, and are estimated at 16.7 percent (95 percent confidence interval [CI]: 13.9-19.8 percent) and 17.2 percent (95 percent CI: 14.8-19.9 percent), respectively (Ogden et al., 2014). A similar analysis using 2009-2010 data from the same survey, however, reported the prevalence for this age group was higher among boys than girls, estimated at 18.6 percent
(95 percent CI: 16.4-21.0) and 15.0 percent (95 percent CI: 13.3-16.8), respectively (Ogden et al., 2012). The authors posited the sample size and the classification approach of obesity for children could be contributing factors to the apparent difference between sexes. In comparing prevalence only by sex (irrespective of race, age, or other demographic factors), men and women appear to have relatively similar obesity prevalence estimates (Ogden et al., 2013), although some recent analyses suggest the prevalence is slightly higher for women (Ogden et al., 2014, 2015).
Although evaluations comparing males and females are important, sex is a variable that interacts with other sociodemographic factors. Evaluation of prevalence or trends estimates only by sex may not result in difference, but when combined with other factors may reveal that subgroups are disproportionately affected.
Age
Age is a required variable for assessing obesity status in children, adolescents, and young adults. Because of the nonlinear course of BMI throughout childhood, obesity status classification in this age range is dictated by age. Age also is the determinant used to transition a young adult from the reference population-based obesity classification approach to the single BMI cut point (i.e., 30 kg/m2). As will be discussed in Chapter 5, this has important implications for prevalence and longitudinal trends estimates.
National-level data indicate obesity prevalence increases across age groups, at least through middle age. Data from 2011-2014 suggest that obesity is more prevalent among older children (ages 6 to 11 years) and adolescents/young adults (ages 12 to 19 years) than in preschool-aged children (age 2 to 5 years) (Ogden et al., 2015) (see Figure 2-4). The national data also suggest the prevalence of obesity is typically lower among younger adults (ages 20 to 39 years) compared to older adult age groups (Ogden et al., 2013, 2015) (see Figure 2-5). Both Figure 2-4 and Figure 2-5 exemplify the role subgroup analyses can play in illuminating differences between groups. Relying solely on the overall estimates (dark blue bars; i.e., ages 2-19 years, 20 years and older) does not provide insight into the variation across age groups that the rest of the figures depicts. Such an analysis, however, does not provide specific insight into the etiology of these differences.
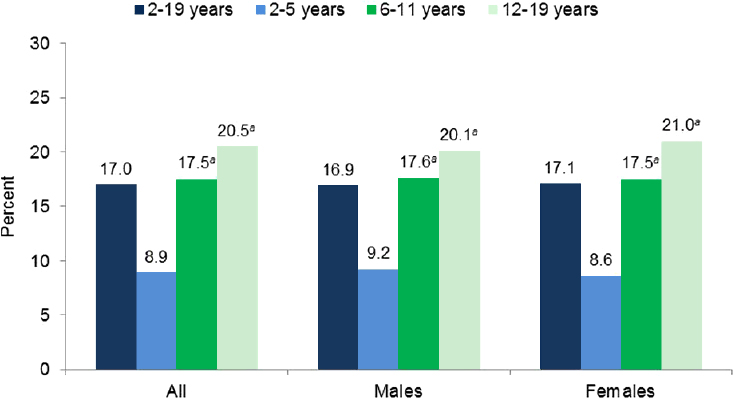
SOURCE: Ogden et al., 2015.
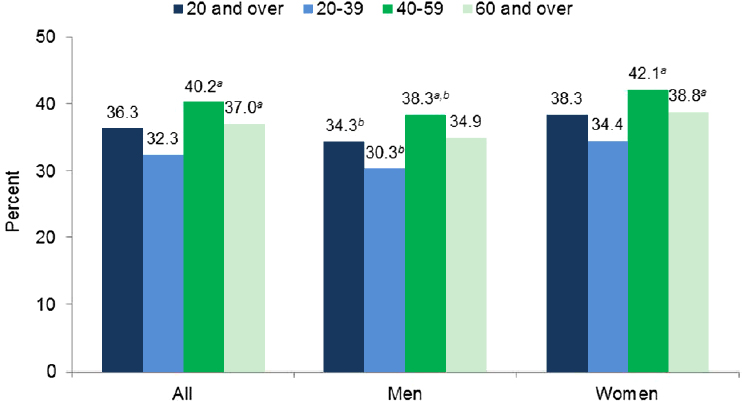
NOTES: Totals were age-adjusted by the direct method to the 2000 U.S. census population using the age groups 20-39, 40-59, and 60 and older. Crude estimates are 36.5 percent for all, 34.5 percent for men, and 38.5 percent for women. a Significantly different from those ages 20-39 years. b Significantly different from women of the same age group.
SOURCE: Ogden et al., 2015.
Despite being a continuous variable, age is typically categorized. For nationally representative data based on measured heights and weights, participants are often categorized into groups that may encompass very different life stages. For example, a child age 6 years may be very different than a pubertal child age 11 years in terms of adiposity and interpretation of BMI. These groupings are typically a result of a decision made during the analysis of the data, which will be further discussed in Chapter 5.
Race and Ethnicity
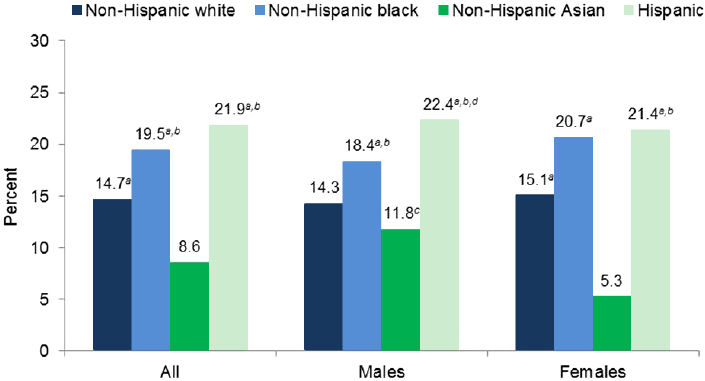
The prevalence of obesity differs by race and ethnicity groups. Based on nationally representative data, obesity prevalence among those ages 2 to 19 years appears to be highest among Hispanics and in non-Hispanic blacks, followed by non-Hispanic whites and non-Hispanic Asians (Ogden et al., 2015) (see Figure 2-6). For adults, the highest prevalence estimates have been observed in non-Hispanic blacks and Hispanic adults followed
SOURCE: Ogden et al., 2015.
by non-Hispanic whites, and non-Hispanic Asians (Ogden et al., 2015) (see Figure 2-7).
The interplay between race, ethnicity, and sex can be seen in both Figures 2-6 and 2-7. For example, the obesity prevalence in non-Hispanic Asian males ages 2 to 19 years was significantly higher than their female counterparts. This sex difference was not seen in any of the other evaluated racial or ethnic groups. Similarly, obesity prevalence in both non-Hispanic black and Hispanic women ages 20 years and older was significantly higher than of their male counterparts. This sex difference was not seen among non-Hispanic whites or non-Hispanic Asian adults. As was discussed with age, the subgroup comparisons bring to light differences in estimates of obesity prevalence across the evaluated groups.
Uncovering the relationship between race, ethnicity, and obesity can be complicated by methodologic and analytic decisions. Chapter 3 discusses how race and ethnicity data are currently being captured, while Chapter 5 expands on the limits to data analysis by racial and ethnic groups.
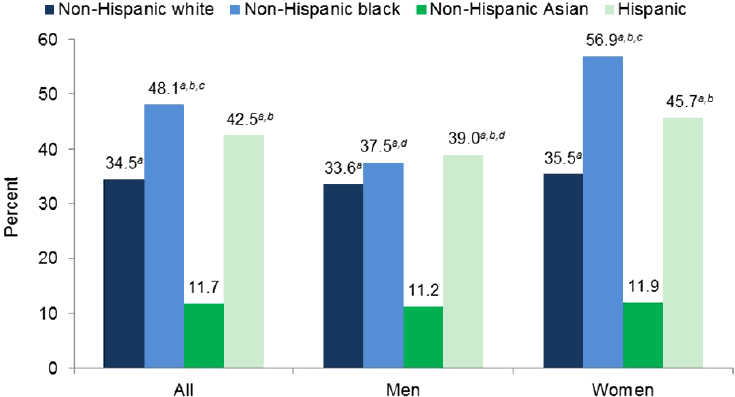
NOTE: All estimates are age-adjusted by the direct method to the 2000 U.S. census population using the age groups 20-39, 40-59, and 50 and over. a Significantly different from non-Hispanic Asian persons. b Significantly different from non-Hispanic white persons. c Significantly different from Hispanic persons. d Significantly different from women of the same race and Hispanic origin.
SOURCE: Ogden et al., 2015.
Socioeconomic Status
Socioeconomic status (SES) is a broad term, with “low SES” often used as a proxy for economic disadvantage. Chapter 3 highlights the variability in methodologies for collecting data related to socioeconomic status in studies of obesity.
Childhood obesity estimates are often evaluated by a measure of familial or community-level socioeconomic status. Measures of SES appear to interact with other factors, most notably race and ethnicity. For example, Taveras et al. (2013) reported that obesity among children ages 7 years was more prevalent among blacks and Hispanics than among children of other races or ethnicities, but the differences were attenuated when accounting for socioeconomic confounders and parental BMI. In a different evaluation based on data from 1999 to 2010, the prevalence of obesity was approximately twice as high among children who lived in a home where the adult head of household did not complete high school (a measure often used for SES)
compared to those whose adult head of household completed college (May et al., 2013). The overall effect of this relationship on obesity prevalence differed by the racial or ethnic group evaluated, with college completion leading to the lowest prevalence estimates among non-Hispanic whites, but not among the other racial or ethnic groups.
The relationship between SES and obesity in adults is complex and appears to interact not only with race and ethnicity, but also with sex. Based on 2005 to 2008 nationally representative data, obesity prevalence was similar among men across income levels, but was significantly higher among non-Hispanic black and Mexican American men of higher income (Ogden et al., 2010). In contrast, higher-income women had lower prevalence estimates of obesity, and the overall trend was similar across races and ethnicities, though the trend was significant only in non-Hispanic white women (Ogden et al., 2010). The relationship is complex and it exemplifies the need and utility of subgroup comparisons.
Rurality
Population density appears to affect the prevalence of obesity. A recent meta-analysis reported that children living in rural areas had 26 percent greater odds of obesity compared to children living in urban areas (Johnson and Johnson, 2015). Rurality, like the other demographic factors, does not operate unilaterally. For example, one study demonstrated no differences in the obesity rates for children ages 2 to 4 years from rural and urban areas with low SES, although multiple studies of older children of varying SES levels have demonstrated a consistent increase in odds for obesity for children living in rural areas compared to urban areas. Rural communities also appear to have higher rates of adult obesity than do non-rural areas (39.6 percent versus 33.4 percent) (Befort et al., 2012).
Geographic Location
Current data suggest that different regions of the Unites States may be differentially affected by obesity. Evaluating geographic differences by regions of the United States is difficult because of a general lack of valid comparable data across states (see Chapter 4 for additional information). State-level estimates of adult obesity based on self-reported height and weight from the Behavioral Risk Factor Surveillance System, for example, suggest a higher prevalence in the Southeastern United States, compared with other regions of the country (Le et al., 2014). In contrast, data from NHANES and the REasons for Geographic and Racial Differences in Stroke (REGARD) study (n = 6,615 and n = 6,138, respectively), which directly
measured heights and weights, showed the highest prevalence of obesity in the Midwest (Le et al., 2014).
SUMMARY
Childhood and adolescence is a dynamic time of growth, development, and maturation. Body composition changes dramatically over the course of the first two decades of life, and as such, the classification of obesity status must be adaptive rather than static. BMI is currently the dominant approach used for assessing obesity status. For children and adolescents, BMI must be compared to a reference population for classification, with the 2000 CDC BMI-for-age growth charts being the most common reference population used. Some population groups appear to be disproportionately affected by obesity. Demographic factors used to identify such groups include sex, age, race and ethnicity, rurality, and geography. These differences are occurring in a national population that is rapidly changing.
REFERENCES
Albuquerque, D., E. Stice, R. Rodriguez-Lopez, L. Manco, and C. Nobrega. 2015. Current review of genetics of human obesity: From molecular mechanisms to an evolutionary perspective. Molecular Genetics and Genomics 290(4):1191-1221.
American Academy of Pediatrics Committee on Nutrition. 2014. Assessment of Nutritional Status. Edited by R. E. Kleinman and F. R. Greer. 7th ed, Pediatric Nutrition. Elk Grove Village, IL: American Academy of Pediatrics.
Anderson, S. E., G. E. Dallal, and A. Must. 2003. Relative weight and race influence average age at menarche: Results from two nationally representative surveys of US girls studied 25 years apart. Pediatrics 111(4 Pt 1):844-850.
Ashwell, M., P. Gunn, and S. Gibson. 2012. Waist-to-height ratio is a better screening tool than waist circumference and BMI for adult cardiometabolic risk factors: Systematic review and meta-analysis. Obesity Reviews 13(3):275-286.
Barlow, S. E. 2007. Expert committee recommendations regarding the prevention, assessment, and treatment of child and adolescent overweight and obesity: Summary report. Pediatrics 120(Suppl 4):S164-S192.
Bastien, M., P. Poirier, I. Lemieux, and J. P. Despres. 2014. Overview of epidemiology and contribution of obesity to cardiovascular disease. Progress in Cardiovascular Diseases 56(4):369-381.
Bauer, K. W., M. D. Marcus, L. El ghormli, C. L. Ogden, and G. D. Foster. 2015. Cardiometabolic risk screening among adolescents: Understanding the utility of body mass index, waist circumference and waist to height ratio. Pediatric Obesity 10(5):329-337.
Befort, C. A., N. Nazir, and M. G. Perri. 2012. Prevalence of obesity among adults from rural and urban areas of the United States: Findings from NHANES (2005–2008). Journal of Rural Health 28(4):392-397.
Berrington de Gonzalez, A., P. Hartge, J. R. Cerhan, A. J. Flint, L. Hannan, R. J. MacInnis, S. C. Moore, G. S. Tobias, H. Anton-Culver, L. B. Freeman, W. L. Beeson, S. L. Clipp, D. R. English, A. R. Folsom, D. M. Freedman, G. Giles, N. Hakansson, K. D. Henderson, J. Hoffman-Bolton, J. A. Hoppin, K. L. Koenig, I. M. Lee, M. S. Linet, Y. Park, G. Pocobelli, A. Schatzkin, H. D. Sesso, E. Weiderpass, B. J. Willcox, A. Wolk, A. Zeleniuch-Jacquotte, W. C. Willett, and M. J. Thun. 2010. Body-mass index and mortality among 1.46 million white adults. New England Journal of Medicine 363(23):2211-2219.
Borrud, L. G., K. M. Flegal, A. C. Looker, J. E. Everhart, T. B. Harris, and J. A. Shepherd. 2010. Body composition data for individuals 8 years of age and older: U.S. Population, 1999-2004. Vital and Health Statistics 11(250):1-87.
Braveman, P. A., S. Kumanyika, J. Fielding, T. Laveist, L. N. Borrell, R. Manderscheid, and A. Troutman. 2011. Health disparities and health equity: The issue is justice. American Journal of Public Health 101(Suppl 1):S149-S155.
CDC (Centers for Disease Control and Prevention). 2010. Growth charts. http://www.cdc.gov/growthcharts/index.htm (accessed February 17, 2016).
CDC. 2013. National Health and Nutrition Examination Survey (NHANES) anthropometry procedures manual. http://www.cdc.gov/nchs/data/nhanes/nhanes_13_14/2013_Anthropometry.pdf (accessed March 11, 2016).
CDC. 2014. Recommended BMI-for-age cutoffs. http://www.cdc.gov/nccdphp/dnpao/growthcharts/training/bmiage/page4.html (accessed March 22, 2016).
CDC. 2015a. Body mass index (BMI). http://www.cdc.gov/healthyweight/assessing/bmi/index.html (accessed May 11, 2016).
CDC. 2015b. Using the WHO growth standard charts. http://www.cdc.gov/nccdphp/dnpao/growthcharts/who/using/index.htm (accessed February 17, 2016).
Crocker, M. K., E. A. Stern, N. M. Sedaka, L. B. Shomaker, S. M. Brady, A. H. Ali, T. H. Shawker, V. S. Hubbard, and J. A. Yanovski. 2014. Sexual dimorphisms in the associations of BMI and body fat with indices of pubertal development in girls and boys. Journal of Clinical Endocrinology and Metabolism 99(8):E1519-E1529.
Davison, K. K., E. J. Susman, and L. L. Birch. 2003. Percent body fat at age 5 predicts earlier pubertal development among girls at age 9. Pediatrics 111(4 Pt 1):815-821.
de Mutsert, R., Q. Sun, W. C. Willett, F. B. Hu, and R. M. van Dam. 2014. Overweight in early adulthood, adult weight change, and risk of type 2 diabetes, cardiovascular diseases, and certain cancers in men: A cohort study. American Journal of Epidemiology 179(11):1353-1365.
Ding, J., S. B. Kritchevsky, A. B. Newman, D. R. Taaffe, B. J. Nicklas, M. Visser, J. S. Lee, M. Nevitt, F. A. Tylavsky, S. M. Rubin, M. Pahor, and T. B. Harris. 2007. Effects of birth cohort and age on body composition in a sample of community-based elderly. American Journal of Clinical Nutrition 85(2):405-410.
Euling, S. Y., M. E. Herman-Giddens, P. A. Lee, S. G. Selevan, A. Juul, T. I. Sorensen, L. Dunkel, J. H. Himes, G. Teilmann, and S. H. Swan. 2008. Examination of US puberty-timing data from 1940 to 1994 for secular trends: Panel findings. Pediatrics 121(Suppl 3):S172-S191.
Fernandez, J. R., D. T. Redden, A. Pietrobelli, and D. B. Allison. 2004. Waist circumference percentiles in nationally representative samples of African American, European American, and Mexican American children and adolescents. Journal of Pediatrics 145(4):439-444.
Flegal, K. M., R. Wei, C. L. Ogden, D. S. Freedman, C. L. Johnson, and L. R. Curtin. 2009. Characterizing extreme values of body mass index-for-age by using the 2000 Centers for Disease Control and Prevention growth charts. American Journal of Clinical Nutrition 90(5):1314-1320.
Flegal, K. M., C. L. Ogden, J. A. Yanovski, D. S. Freedman, J. A. Shepherd, B. I. Graubard, and L. G. Borrud. 2010. High adiposity and high body mass index-for-age in US children and adolescents overall and by race-ethnic group. American Journal of Clinical Nutrition 91(4):1020-1026.
Freedman, D. S., and B. Sherry. 2009. The validity of BMI as an indicator of body fatness and risk among children. Pediatrics 124(Suppl 1):S23-S34.
Freedman, D. S., L. K. Khan, M. K. Serdula, W. H. Dietz, S. R. Srinivasan, and G. S. Berenson. 2005. The relation of childhood BMI to adult adiposity: The Bogalusa Heart Study. Pediatrics 115(1):22-27.
Freedman, D. S., H. G. Lawman, A. C. Skinner, L. C. McGuire, D. B. Allison, and C. L. Ogden. 2015a. Validity of the WHO cutoffs for biologically implausible values of weight, height, and BMI in children and adolescents in NHANES from 1999 through 2012. American Journal of Clinical Nutrition 102(5):1000-1006.
Freedman, D. S., C. L. Ogden, and B. K. Kit. 2015b. Interrelationships between BMI, skinfold thicknesses, percent body fat, and cardiovascular disease risk factors among US children and adolescents. BMC Pediatrics 15:188.
Fryar, C. D., Q. Gu, and C. L. Ogden. 2012. Anthropometric reference data for children and adults: United States, 2007-2010. Vital and Health Statistics 11(252):1-48.
Fryar, C. D., M. D. Carroll, and C. L. Ogden. 2014a. Prevalence of overweight and obesity among children and adolescents: United States, 1963–1965 through 2011–2012. http://www.cdc.gov/nchs/data/hestat/obesity_child_11_12/obesity_child_11_12.pdf (accessed February 17, 2016).
Fryar, C. D., M. D. Carroll, and C. L. Ogden. 2014b. Prevalence of overweight, obesity, and extreme obesity among adults: United States, 1960–1962 through 2011–2012. http://www.cdc.gov/nchs/data/hestat/obesity_adult_11_12/obesity_adult_11_12.pdf (accessed February 17, 2016).
Gordon-Larsen, P., N. S. The, and L. S. Adair. 2010. Longitudinal trends in obesity in the United States from adolescence to the third decade of life. Obesity (Silver Spring) 18(9):1801-1804.
Gray, L. J., T. Yates, M. J. Davies, E. Brady, D. R. Webb, N. Sattar, and K. Khunti. 2011. Defining obesity cut-off points for migrant South Asians. PLoS ONE 6(10):e26464.
Grummer-Strawn, L. M., Reinold, C., and N. F. Krebs. 2010. Use of World Health Organization and CDC growth charts for children aged 0-59 months in the United States. MMWR Recommendations and Reports 59(Rr-9):1-15.
Gulati, A. K., D. W. Kaplan, and S. R. Daniels. 2012. Clinical tracking of severely obese children: A new growth chart. Pediatrics 130(6):1136-1140.
Herman-Giddens, M. E., E. J. Slora, R. C. Wasserman, C. J. Bourdony, M. V. Bhapkar, G. G. Koch, and C. M. Hasemeier. 1997. Secondary sexual characteristics and menses in young girls seen in office practice: A study from the Pediatric Research in Office Settings network. Pediatrics 99(4):505-512.
Herman-Giddens, M. E., L. Wang, and G. Koch. 2001. Secondary sexual characteristics in boys: Estimates from the National Health and Nutrition Examination Survey III, 1988-1994. Archives of Pediatrics and Adolescent Medicine 155(9):1022-1028.
Hobbs, F., and N. Stoops. 2002. Demographic trends in the 20th century. Washington, DC: U.S. Government Printing Office.
Howden, L. M., and J. A. Meyer. 2011. Age and sex composition: 2010. Washington, DC: U.S. Government Printing Office.
Hu, F. 2008. Obesity epidemiology. New York: Oxford University Press, Inc.
Hughes, A. R., A. Sherriff, A. R. Ness, and J. J. Reilly. 2014. Timing of adiposity rebound and adiposity in adolescence. Pediatrics 134(5):e1354-e1361.
Hughes, V. A., R. Roubenoff, M. Wood, W. R. Frontera, W. J. Evans, and M. A. Fiatarone Singh. 2004. Anthropometric assessment of 10-y changes in body composition in the elderly. American Journal of Clinical Nutrition 80(2):475-482.
IOM (Institute of Medicine). 2005. Preventing childhood obesity: Health in the balance. Washington, DC: The National Academies Press.
Johnson, J. A., 3rd, and A. M. Johnson. 2015. Urban-rural differences in childhood and adolescent obesity in the United States: A systematic review and meta-analysis. Childhood Obesity 11(3):233-241.
Juonala, M., C. G. Magnussen, G. S. Berenson, A. Venn, T. L. Burns, M. A. Sabin, S. R. Srinivasan, S. R. Daniels, P. H. Davis, W. Chen, C. Sun, M. Cheung, J. S. Viikari, T. Dwyer, and O. T. Raitakari. 2011. Childhood adiposity, adult adiposity, and cardiovascular risk factors. New England Journal of Medicine 365(20):1876-1885.
Knapp, K. M., J. R. Welsman, S. J. Hopkins, A. Shallcross, I. Fogelman, and G. M. Blake. 2015. Obesity increases precision errors in total body dual-energy x-ray absorptiometry measurements. Journal of Clinical Densitometry 18(2):209-216.
Ko, G. T., J. Tang, J. C. Chan, R. Sung, M. M. Wu, H. P. Wai, and R. Chen. 2001. Lower BMI cut-off value to define obesity in Hong Kong Chinese: An analysis based on body fat assessment by bioelectrical impedance. British Journal of Nutrition 85(2):239-242.
Kodama, S., C. Horikawa, K. Fujihara, S. Yoshizawa, Y. Yachi, S. Tanaka, N. Ohara, S. Matsunaga, T. Yamada, O. Hanyu, and H. Sone. 2014. Quantitative relationship between body weight gain in adulthood and incident type 2 diabetes: A meta-analysis. Obesity Reviews 15(3):202-214.
Krebs, N. F., J. H. Himes, D. Jacobson, T. A. Nicklas, P. Guilday, and D. Styne. 2007. Assessment of child and adolescent overweight and obesity. Pediatrics 120(Suppl 4):S193-S228.
Kuczmarski, R. J., C. L. Ogden, L. M. Grummer-Strawn, K. M. Flegal, S. S. Guo, R. Wei, Z. Mei, L. R. Curtin, A. F. Roche, and C. L. Johnson. 2000. CDC growth charts: United States. Advance Data from Vital and Health Statistics 314.
Kurniawan, E. D., C. Y. Cheung, W. T. Tay, P. Mitchell, S. M. Saw, T. Y. Wong, and N. Cheung. 2014. The relationship between changes in body mass index and retinal vascular caliber in children. Journal of Pediatrics 165(6):1166-1171.
Kyle, U. G., I. Bosaeus, A. D. De Lorenzo, P. Deurenberg, M. Elia, J. M. Gomez, B. L. Heitmann, L. Kent-Smith, J. C. Melchior, M. Pirlich, H. Scharfetter, A. M. W. J. Schols, and C. Pichard. 2004a. Bioelectrical impedance analysis—part I: Review of principles and methods. Clinical Nutrition 23(5):1226-1243.
Kyle, U. G., I. Bosaeus, A. D. De Lorenzo, P. Deurenberg, M. Elia, J. M. Gomez, B. L. Heitmann, L. Kent-Smith, J. C. Melchior, M. Pirlich, H. Scharfetter, A. M. W. J. Schols, and C. Pichard. 2004b. Bioelectrical impedance analysis—part II: Utilization in clinical practice. Clinical Nutrition 23(6):1430-1453.
Le, A., S. E. Judd, D. B. Allison, R. Oza-Frank, O. Affuso, M. M. Safford, V. J. Howard, and G. Howard. 2014. The geographic distribution of obesity in the US and the potential regional differences in misreporting of obesity. Obesity (Silver Spring) 22(1):300-306.
Lee, J. M., R. Wasserman, N. Kaciroti, A. Gebremariam, J. Steffes, S. Dowshen, D. Harris, J. Serwint, D. Abney, L. Smitherman, E. Reiter, and M. E. Herman-Giddens. 2016. Timing of puberty in overweight versus obese boys. Pediatrics 137(2):1-10.
Mason, C., and P. T. Katzmarzyk. 2009. Variability in waist circumference measurements according to anatomic measurement site. Obesity 17(9):1789-1795.
May, A. L., D. Freedman, B. Sherry, and H. M. Blanck. 2013. Obesity—United States, 1999-2010. MMWR Supplements 62(3):120-128.
Mokha, J. S., S. R. Srinivasan, P. DasMahapatra, C. Fernandez, W. Chen, J. Xu, and G. S. Berenson. 2010. Utility of waist-to-height ratio in assessing the status of central obesity and related cardiometabolic risk profile among normal weight and overweight/obese children: The Bogalusa Heart Study. BMC Pediatrics 10(1):1-7.
Monzani, A., A. Rapa, F. Prodam, N. Fuiano, G. Diddi, A. Petri, S. Bellone, and G. Bona. 2016. High discrepancy in abdominal obesity prevalence according to different waist circumference cut-offs and measurement methods in children: Need for age-risk-weighted standardized cut-offs? PLoS ONE 11(1):e0146579.
Mustillo, S., C. Worthman, A. Erkanli, G. Keeler, A. Angold, and E. J. Costello. 2003. Obesity and psychiatric disorder: Developmental trajectories. Pediatrics 111(4 Pt 1):851-859.
Nader, P. R., M. O’Brien, R. Houts, R. Bradley, J. Belsky, R. Crosnoe, S. Friedman, Z. Mei, and E. J. Susman. 2006. Identifying risk for obesity in early childhood. Pediatrics 118(3):e594-e601.
Nambiar, S., I. Hughes, and P. S. Davies. 2010. Developing waist-to-height ratio cut-offs to define overweight and obesity in children and adolescents. Public Health Nutrition 13(10):1566-1574.
NHLBI (National Heart, Lung, and Blood Institute). 1998. Clinical guidelines on the identification, evaluation, and treatment of overweight and obesity in adults. Bethesda, MD: National Heart, Lung, and Blood Institute.
NIH (National Institutes of Health). 2016. Environmental Influences on Child Health Outcomes (ECHO) program. Bethesda, MD: National Institutes of Health. https://www.nih.gov/echo (accessed May 11, 2016).
Ode, J. J., J. M. Pivarnik, M. J. Reeves, and J. L. Knous. 2007. Body mass index as a predictor of percent fat in college athletes and nonathletes. Medicine and Science in Sports and Exercise 39(3):403-409.
Ogden, C. L. 2015. Obesity in the US: Beyond the data. PowerPoint presentation at Evaluating Approaches to Assessing Prevalence and Trends in Obesity: Data Gathering Public Workshop, Washington, DC.
Ogden, C. L., and K. M. Flegal. 2010. Changes in terminology for childhood overweight and obesity. National Health Statistics Reports (25):1-5.
Ogden, C. L., M. M. Lamb, M. D. Carroll, and K. M. Flegal. 2010. Obesity and socioeconomic status in adults: United States, 2005-2008 50. http://www.cdc.gov/nchs/data/databriefs/db50.htm (accessed March 28, 2016).
Ogden, C. L., Y. Li, D. S. Freedman, L. G. Borrud, and K. M. Flegal. 2011. Smoothed percentage body fat percentiles for U.S. children and adolescents, 1999-2004. National Health Statistics Reports (43):1-7.
Ogden, C. L., M. D. Carroll, B. K. Kit, and K. M. Flegal. 2012. Prevalence of obesity and trends in body mass index among US children and adolescents, 1999-2010. Journal of the American Medical Association 307(5):483-490.
Ogden, C. L., M. D. Carroll, B. K. Kit, and K. M. Flegal. 2013. Prevalence of obesity among adults: United States, 2011–2012 131. http://www.cdc.gov/nchs/data/databriefs/db131.htm (accessed March 28, 2016).
Ogden, C. L., M. D. Carroll, B. K. Kit, and K. M. Flegal. 2014. Prevalence of childhood and adult obesity in the United States, 2011-2012. Journal of the American Medical Association 311(8):806-814.
Ogden, C. L., M. D. Carroll, C. D. Fryar, and K. M. Flegal. 2015. Prevalence of obesity among adults and youth: United States, 2011–2014 219. http://www.cdc.gov/nchs/data/databriefs/db219.htm (accessed February 17, 2016).
OIS (Office of Immigration Statistics). 2014. 2013 yearbook of immigration statistics. Washington, DC: U.S. Department of Homeland Security, Office of Immigration Statistics. https://www.dhs.gov/publication/yearbook-2013 (accessed March 28, 2016).
Oppliger, R. A., R. R. Clark, and J. M. Kuta. 1992. Efficacy of skinfold training clinics: A comparison between clinic trained and experienced testers. Research Quarterly for Exercise and Sport 63(4):438.
Park, M. H., C. Falconer, R. M. Viner, and S. Kinra. 2012. The impact of childhood obesity on morbidity and mortality in adulthood: A systematic review. Obesity Reviews 13(11):985-1000.
Raiten, D. J., R. Raghavan, A. Porter, J. E. Obbagy, and J. M. Spahn. 2014. Executive summary: Evaluating the evidence base to support the inclusion of infants and children from birth to 24 mo of age in the Dietary Guidelines for Americans—“the B-24 project.” American Journal of Clinical Nutrition 99(3):663s-691s.
Rosenquist, J. N., S. F. Lehrer, A. J. O’Malley, A. M. Zaslavsky, J. W. Smoller, and N. A. Christakis. 2015. Cohort of birth modifies the association between FTO genotype and BMI. Proceedings of the National Academy of Sciences USA 112(2):354-359.
Shaw, V. W. 1986. The accuracy of two training methods on skinfold assessment. Research Quarterly for Exercise and Sport 57(1):85-90.
Skinner, A. C., and J. A. Skelton. 2014. Prevalence and trends in obesity and severe obesity among children in the United States, 1999-2012. JAMA Pediatrics 168(6):561-566.
Skinner, A. C., E. M. Perrin, L. A. Moss, and J. A. Skelton. 2015. Cardiometabolic risks and severity of obesity in children and young adults. New England Journal of Medicine 373(14):1307-1317.
Sopher, A. B., J. C. Thornton, J. Wang, R. N. Pierson, Jr., S. B. Heymsfield, and M. Horlick. 2004. Measurement of percentage of body fat in 411 children and adolescents: A comparison of dual-energy x-ray absorptiometry with a four-compartment model. Pediatrics 113(5):1285-1290.
Swinburn, B., G. Egger, and F. Raza. 1999. Dissecting obesogenic environments: The development and application of a framework for identifying and prioritizing environmental interventions for obesity. Preventive Medicine 29(6 Pt 1):563-570.
Talma, H., M. J. Chinapaw, B. Bakker, R. A. HiraSing, C. B. Terwee, and T. M. Altenburg. 2013. Bioelectrical impedance analysis to estimate body composition in children and adolescents: A systematic review and evidence appraisal of validity, responsiveness, reliability and measurement error. Obesity Reviews 14(11):895-905.
Taveras, E. M., M. W. Gillman, K. P. Kleinman, J. W. Rich-Edwards, and S. L. Rifas-Shiman. 2013. Reducing racial/ethnic disparities in childhood obesity: The role of early life risk factors. JAMA Pediatrics 167(8):731-738.
Toombs, R. J., G. Ducher, J. A. Shepherd, and M. J. De Souza. 2012. The impact of recent technological advances on the trueness and precision of DXA to assess body composition. Obesity (Silver Spring) 20(1):30-39.
U.S. Census Bureau. 2011a. Age and sex composition: 2010. Washington, DC: U.S. Government Printing Office. http://www.census.gov/prod/cen2010/briefs/c2010br-03.pdf (accessed March 28, 2016).
U.S. Census Bureau. 2011b. Overview of race and Hispanic origin: 2010. Washington, DC: U.S. Government Printing Office. http://www.census.gov/prod/cen2010/briefs/c2010br-02.pdf (accessed March 31, 2016).
U.S. Census Bureau. 2011c. Population distribution and change: 2000 to 2010. Washington, DC: U.S. Government Printing Office.
U.S. Census Bureau. 2016. 2014 American Community Survey 1-year estimates. Washington, DC: U.S. Government Printing Office.
U.S. Census Bureau Newsroom. 2012. U.S. Census Bureau projections show a slower growing, older, more diverse nation a half century from now. Washington, DC: U.S. Government Printing Office. https://www.census.gov/newsroom/releases/archives/population/cb12-243.html (accessed March 28, 2016).
Vazquez, G., S. Duval, D. R. Jacobs, Jr., and K. Silventoinen. 2007. Comparison of body mass index, waist circumference, and waist/hip ratio in predicting incident diabetes: A meta-analysis. Epidemiologic Reviews 29:115-128.
Villar, J., D. G. Altman, M. Purwar, J. A. Noble, H. E. Knight, P. Ruyan, L. Cheikh Ismail, F. C. Barros, A. Lambert, A. T. Papageorghiou, M. Carvalho, Y. A. Jaffer, E. Bertino, M. G. Gravett, Z. A. Bhutta, and S. H. Kennedy, for the International Fetal Newborn Growth Consortium for the 21st Century. 2013. The objectives, design and implementation of the INTERGROWTH-21st project. BJOG 120:9-26.
Wagner, D. R., and V. H. Heyward. 2000. Measures of body composition in blacks and whites: A comparative review. American Journal of Clinical Nutrition 71(6):1392-1402.
Wang, J., J. C. Thornton, S. Bari, B. Williamson, D. Gallagher, S. B. Heymsfield, M. Horlick, D. Kotler, B. Laferrère, L. Mayer, F. X. Pi-Sunyer, and R. N. Pierson. 2003. Comparisons of waist circumferences measured at 4 sites. American Journal of Clinical Nutrition 77(2):379-384.
Wang, L. Y., D. Chyen, S. Lee, and R. Lowry. 2008. The association between body mass index in adolescence and obesity in adulthood. Journal of Adolescent Health 42(5):512-518.
Weberruß, H., R. Pirzer, B. Böhm, R. Dalla Pozza, H. Netz, and R. Oberhoffer. 2015. Intimamedia thickness and arterial function in obese and non-obese children. BMC Obesity 3:2.
Weiss, R. 2007. Impaired glucose tolerance and risk factors for progression to type 2 diabetes in youth. Pediatric Diabetes 8(Suppl 9):70-75.
Wells, J. C. K. 2014. Toward body composition reference data for infants, children, and adolescents. Advances in Nutrition 5(3):320S-329S.
Wells, J. C., D. Haroun, J. E. Williams, C. Wilson, T. Darch, R. M. Viner, S. Eaton, and M. S. Fewtrell. 2010. Evaluation of DXA against the four-component model of body composition in obese children and adolescents aged 5-21 years. International Journal of Obesity (London) 34(4):649-655.
Wen, C. P., T. Y. David Cheng, S. P. Tsai, H. T. Chan, H. L. Hsu, C. C. Hsu, and M. P. Eriksen. 2009. Are Asians at greater mortality risks for being overweight than Caucasians? Redefining obesity for Asians. Public Health Nutrition 12(4):497-506.
WHO (World Health Organization). 1995. Physical status: The use and interpretation of anthropometry. Geneva: World Health Organization.
WHO. 2004. Obesity: Preventing and managing the global epidemic. Geneva: World Health Organization.
WHO. 2006. WHO child growth standards: Length/height-for-age, weight-for-age, weight-for-length, weight-for-height and body mass index-for-age: Methods and development. Geneva: World Health Organization.
WHO Expert Consultation. 2004. Appropriate body-mass index for Asian populations and its implications for policy and intervention strategies. Lancet 363:157-163.
Xu, L., M. Li, J. Yin, H. Cheng, M. Yu, X. Zhao, X. Xiao, and J. Mi. 2012. Change of body composition and adipokines and their relationship with insulin resistance across pubertal development in obese and nonobese Chinese children: The BCAMS Study. International Journal of Endocrinology 2012:389108.
Zamboni, M., E. Zoico, T. Scartezzini, G. Mazzali, P. Tosoni, A. Zivelonghi, D. Gallagher, G. De Pergola, V. Di Francesco, and O. Bosello. 2003. Body composition changes in stable-weight elderly subjects: The effect of sex. Aging Clinical and Experimental Research 15(4):321-327.


