
6
Framework for Assessing Prevalence and Trends in Obesity to Inform Decision Making
The variation that exists in the methods, data sources, and analytic approaches used to estimate obesity prevalence and trends has made navigating and understanding the literature challenging. Interpreting estimates requires attention to the details, nuances, and caveats of published reports. Evaluating studies for the purpose of informing a decision requires more than just deciphering what the statistics represent. Appropriate application of reports involves considering how the parameters of the estimate align with a specific information need.
This chapter presents a conceptual guide to assist those seeking to better understand and use published estimates of obesity prevalence and trends. Two important concepts are integrated into this tool. The first is the committee’s synthesis of the evidence presented in the preceding chapters. In considering how to facilitate the interpretation of estimates, the committee defined three interdependent, core components of a study: the individuals assessed (“population”), the data collection methods employed (“methodology”), and the analytic approaches used (“analysis”). The second concept focuses on the policy makers, program planners, and others who use reports on obesity to inform decision making (“end users”). As discussed below, these end users have different and often specific information needs.
END USERS OF OBESITY PREVALENCE AND TRENDS REPORTS
Prevalence and trends reports provide insight into the scope and status of obesity within a defined population. This type of information is fundamental to understanding and describing the issue, and often serves as a key piece of evidence used to inform decisions related to policies, strategies, advocacy, funding, programs, and other plans for forward progress.
Potential end users of obesity prevalence and trends reports encompass a broad range of individuals, groups, and organizations that operate at the national, state, regional, and community levels (see Box 6-1). They come from a variety of sectors, including various levels of government, com-
munity organizations, schools, health care organizations, and the private sector (IOM, 2013). Interest in obesity, however, is wide ranging because its determinants are broad and extend well outside the traditional sphere of health. A host of seemingly tangential decisions can have an impact on the obesity status of a population and may be informed by the obesity literature. These could include, but are not limited to, decisions about education and assistance programs (IOM et al., 2009).
Specific Information Needs
Prevalence or trend estimates describe obesity in a particular population. An estimate for individuals identifying as Asian, for example, represents the collective prevalence in this group but does not necessarily reveal differences that may exist among subgroups that fall under this broad category (e.g., by age, by geographic area, by racial or ethnic origin groups). Similarly, a nationally representative estimate that describes the country as a whole encapsulates the variability within each state, region, and community. Prevalence at different levels of geography (region, state, and locality) will inherently fall above and below a broad national estimate.
Identifying the boundaries of an estimate is necessary for both proper interpretation and appropriate application. When using published reports for decision making, end users must seek estimates that are not only of the highest quality, but also most closely aligned with their own goals or information needs. Box 6-2 provides illustrative examples of the need for and uses of specific and relevant estimates, from the perspective of end users at the local level. Ideally, reliable, representative, comparable, and current estimates would exist for a wide range of groups at the national, state, and local level. At present, however, select groups and populations are better represented in published reports than are others. Many reasons exist for this, with a prominent one being that investigators who design and conduct obesity prevalence and trends studies face limitations with respect to purpose, feasibility, cost, time, and sample size. Investigators must decide which groups to include and what information will be used to establish those groups. As such, the extent to which available analyses meet the exact information needs of end users will vary.
ASSESSING PREVALENCE AND TRENDS (APT) FRAMEWORK: INTERPRETING OBESITY REPORTS TO INFORM DECISION MAKING
To help end users interpret and apply estimates, the committee offers the Assessing Prevalence and Trends (APT) Framework (see Figure 6-1). The proposed framework provides a conceptual process for how end users
can approach published reports, consider the strengths and weaknesses of obesity estimates, and synthesize the information for the purposes of decision making. The assessment process is separated in to three phases: (1) end user’s identification of goal or information need, (2) assessment of published report(s), and (3) end user’s synthesis to inform decision making. Driving the assessment are questions related to each of the framework elements. An expanded list of questions is provided in Table 6-1.
Phase 1: Identify the Goal
In the first phase of the framework, end users identify their goal for assessing the published report(s). This includes a consideration of the decision to be made as well as the need for additional information to fill a gap in the evidence. Being clear about their goal is intended to help end users determine the utility of the findings presented in a report in light of their unique information needs.
End user goals will vary in depth, complexity, and specificity. Some goals may be relatively narrow, focusing on the estimates included in the
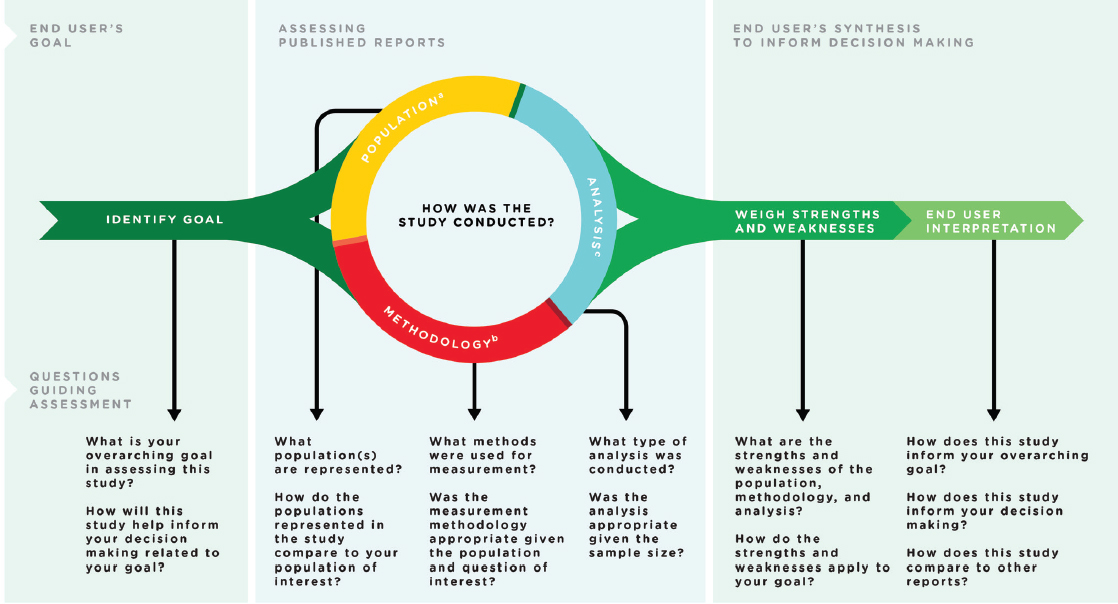
TABLE 6-1 Expanded List of Questions End Users Can Use to Guide Assessment of Published Reports to Inform Decision Making
| Framework Phase | Framework Element | Potential Questions |
|---|---|---|
| End User’s Goal | Identify Goal |
|
| Assessing Published Reports | Population |
|
| Methodology |
|
| Framework Phase | Framework Element | Potential Questions |
|---|---|---|
| Analysis |
|
|
| End User’s Synthesis to Inform Decision Making | Weigh Strengths and Weaknesses |
|
| End User Interpretation |
|
NOTES: The provided list is intended to facilitate the assessment process. The list of questions is not exhaustive, and the relevance of each question will depend on the report being assessed and the end user’s goal.
a End users may prioritize population, methodology, and analysis differently, depending on their particular overarching goal. For example, end users may rank finding a population that most closely resembles their population of interest higher than methodologic and analytic ap-
proaches. Others may specifically be seeking information collected through direct measure, or find an analysis that uses a similar statistical approach.
b Pertinent to the methodology framework element, as well.
c Pertinent to the analysis framework element, as well.
d Pertinent to the population framework element, as well.
e Reports based on “census-level” data may not present confidence intervals, as the estimate is thought to reflect the actual prevalence in the population.
published reports. For example, an end user may simply want to know what can be said about a single estimate describing a certain population group. Although implicit in the use of the framework, this goal represents a fundamental and common challenge shared by a wide range of end users. This goal may also serve as a starting point for using the framework in an iterative, stepwise manner, progressively moving toward a more complex goal (see Box 6-3). Other report-centric goals may be comparative in nature. For instance, an end user may have multiple reports providing different estimates for the same population and may need to decide which, if any, provides the strongest evidence. The end user goal can also be broad in nature, with the obesity estimates serving as one piece in a wide range of evidence being weighed. For example, those designing strategies to address health disparities in a given population may include obesity as one of the health outcomes being considered. In this scenario, the broad goal would be determining what strategies should be developed, and the obesity literature would be used to assess the existence of disparities in weight status. This goal may be further refined by the characteristics defining the population of interest. For instance, one end user may be focused on rural families in a town on the U.S.–Mexico border, while another may be concerned with young adults in a large metropolitan area in the Northeast. Despite the overall goal being the same for these two end users, the specific information they will need to inform their decision will be significantly different.
A balance must be struck during this initial reflection. Personal interests and objectives can influence how information is processed and conclusions are drawn (Tversky and Kahneman, 1974). End user goals that seek to “justify” or “prove” a particular point of view can bias the identification of reports and interpretation of findings. The purpose of end users identifying their own goal or need for information at the outset of the process is done so as not to cloud judgment or lose objectivity, but rather to define the boundaries for the assessment.
Phase 2: Assess Published Reports
In the second phase of the assessment process, end users evaluate the published report(s). The three core components of a report (population, methodology, analysis) inform the interpretation of the estimate. The previous chapters’ discussions of considerations associated with study design, data collection, specific data sources, and analysis are intended to facilitate such an appraisal (see Chapters 3 through 5). The dynamic assessment of these three components in context of each other provides a means for end users to consider how the approach taken in one may have benefited or limited one or both of the other components. By the end of the assessment of the published report, end users should clearly understand the parameters associated with the estimate.
Phase 3: Synthesize Findings to Inform Decision Making
In the final phase of the assessment process, end users turn back to their goal in order to synthesize and interpret the report(s) findings in context of their information needs for decision making. To accomplish this, end users first weigh the strengths and weaknesses of each report. The end user is encouraged to consider the strengths and weaknesses generally at first, then in relation to their specific information needs and decision-making priorities.
End users will categorize the same feature of the report differently, depending on their overall objective and the data gap they are trying to fill. For example, some end users would consider state-representative samples a strength of a report, while some end users at the community level may view this parameter as a weakness for their particular decision-making process. Once the end user has established what the strengths and weaknesses are, they then determine how the findings inform their decision.
In most instances, the report(s) on obesity prevalence and trends will only be one of many sources of information considered when making a decision. The extent to which such additional information is used in the decision-making process, however, should not detract from the importance of the concepts presented in the APT Framework.
UNDERLYING PRINCIPLES OF THE FRAMEWORK
The APT Framework is a conceptual guide intended to serve as a starting point for those who wish to better understand and apply published reports and brings together considerations specific to the assessment of obesity status and general to any prevalence and trends study. It is grounded in six underlying principles discussed below and summarized in Box 6-4.
The APT Framework Can Be Used Both for Assessing Individual Reports and for Synthesizing Multiple Reports
The committee used the word “report” to describe a publication, peer-reviewed or otherwise, with original analysis that produces estimates of obesity prevalence or trend for a defined population group and/or subgroup. Some reports, especially at the state and local level, are summaries of primary analyses and may not contain the detail needed to adequately assess the findings. In these instances, end users are advised to identify and review the primary source of the results, if possible.
The APT Framework guides an end user through the assessment thought process. The number of reports assessed and how they are evaluated through the APT Framework will depend on the end user and the availability of reports related to the end user’s goal. In some instances, the framework would be used to assess a single report. In other instances, as described in Box 6-3, an end user can start by using the framework to identify the parameters that affect the interpretation of the individual estimates, then progressively consider them together. In practice, a broader assessment of multiple reports would bolster decision making. However, given the limitations of the current state of the literature, the committee recognizes that pertinent information may only reside within a single report for certain end users’ goals.
A Variety of End Users Can Use the APT Framework
End users are varied and are not limited to obesity stakeholders. A wide range of individuals, groups, and organizations may need to refer to prevalence and trends reports for decision making (see Box 6-1). It is anticipated that end users will have various backgrounds and expertise. The intent of
the framework is to provide a range of end users with sufficient guidance on the elements that affect the interpretation and application of estimates, while remaining general enough to accommodate the diverse literature and the broad array of decisions that may be informed by obesity prevalence and trends reports. Box 6-5 describes the skills end users may need using the APT Framework.
An End User’s Goal Informs the Application of Any Report or Reports
Reports on obesity prevalence and trends are generally designed to address a specific set of questions within a defined set of parameters. The estimates presented in reports are guided not only by the question the report’s authors sought to answer, but also methodologies used and analytic limits of the collected data. The APT Framework directs the end users to further this line of thinking and reflect on the type of information that is needed to ultimately inform their decision making. An end user’s goal need not directly align with the stated purpose of a report for that report to offer the end user valuable information. Clearly defined goals can help end users identify reports for assessment, and can help them prioritize and
weigh the core components within a report (see below) or across a set of reports (see above).
The Three Core Components of a Published Report Are Interdependent
Three core components in a report inform the interpretation of an obesity prevalence or trend estimate: the population assessed, the methodologies employed, and the analysis approach used. As discussed and demonstrated throughout the preceding chapters, these components do not exist or operate in isolation. A decision made in one of the components can affect either or both of the other components. The assessment of reports on obesity prevalence and trends necessitates a fundamental understanding of each of these components in relation to the others. As such, appraisal of the population, methodology, and analysis is not a linear process, but rather is dynamic and iterative.
Questions Lead the End User Through the Assessment Process
The APT Framework illustrates the conceptual process of assessing a study’s applicability to a decision-making goal. In each of the phases of the APT Framework, the end user is prompted to consider pertinent questions to ask, as represented by the lower portion of the visual. The questions that appear on the figure itself serve as a starting point. Table 6-1 provides an expanded list of potential questions that end users can use to guide their assessment. The list of questions presented in this chapter is by no means prescriptive or exhaustive. End users may find some of the question more relevant to their specific information needs than others, and as they are thinking through the evaluative process may develop questions of their own.
The APT Framework Facilitates an Assessment of the Evidence to Inform the Decision-Making Process
In the first phase of the framework, identification of end user goal grounds the assessment in the specific information need. The second phase of the framework helps the end user understand the bounds of an estimate. The final phase brings the first two phases together, and the end user considers how that estimate compares to the information being sought. By using the end user’s goal to contextually frame the assessment process, the APT Framework highlights the interface between reading a report for meaning and using the findings for a specific application. This concept is further explored in the example presented in Box 6-6.
REFINEMENT, ADAPTATIONS, AND ALTERNATIVE USES OF THE APT FRAMEWORK
The concepts presented in the proposed framework represent the committee’s synthesis of key considerations related to inconsistencies that exist in the literature and consideration for principles of epidemiology, data collection, and statistical analysis that affect the interpretation of estimates of obesity prevalence and trends. It is expected that as a wide variety of end users begin using the framework, various components will be further refined to enhance its utility. The committee also foresees opportunities for
the framework to be adapted for specific end user groups (e.g., community-based organizations, elected officials, school boards). In these adaptations, the fundamental concepts would remain, but the specific questions helping guide the assessment would be those that are most relevant to that particular end user group.
Opportunities also exist to use the APT Framework for purposes other than understanding and applying an estimate. One such scenario would be the planning of data collection. An end user could assess a published report not to interpret a specific estimate, but rather to determine whether the
design and data collection methodologies led to reliable estimates, allowing them to consider specific methods or study designs in generating new data. Alternatively, end users could use the framework to walk through key considerations related to each element to bring clarity to their planning. Another possible alternative use for the APT Framework is to provide guidance to those preparing results for publication. Investigators and authors can compare their report to the elements in the framework to ensure all relevant details are included and presented in an accessible manner. This could lead to better alignment of systematic information presentation, eventually allowing for easier comparisons across reports.
REFERENCES
IOM (Institute of Medicine). 2013. Evaluating obesity prevention efforts: A plan for measuring progress. Washington, DC: The National Academies Press.
IOM, TRB (Transportation Research Board), and NRC (National Research Council). 2009. Local government actions to prevent childhood obesity. Washington, DC: The National Academies Press.
Kann, L. 2015. Youth Risk Behavior Surveillance System: Measurement of obesity. PowerPoint presentation at Evaluating Approaches to Assessing Prevalence and Trends in Obesity: Data Gathering Public Workshop, Washington, DC.
Ogden, C. L., M. D. Carroll, C. D. Fryar, and K. M. Flegal. 2015. Prevalence of obesity among adults and youth: United States, 2011–2014 219. http://www.cdc.gov/nchs/data/databriefs/db219.htm (accessed February 17, 2016).
Pivec, L. 2015. Panel remarks at Evaluating Approaches to Assessing Prevalence and Trends in Obesity: Data Gathering Public Workshop, Washington, DC.
Pronk, N. 2015. From research to roadmap: Frameworks to connect knowing and doing. PowerPoint presentation at Evaluating Approaches to Assessing Prevalence and Trends in Obesity: Data Gathering Public Workshop, Washington, DC.
Ricketts, T. 2015. Panel remarks at Evaluating Approaches to Assessing Prevalence and Trends in Obesity: Data Gathering Public Workshop, Washington, DC.
Tversky, A., and D. Kahneman. 1974. Judgment under uncertainty: Heuristics and biases. Science 185:1124-1131.


