
The workshop’s opening session featured a speaker who discussed the application of systems science approaches to complex public health issues such as obesity and reviewed opportunities and challenges associated with stakeholders’ use of systems science models. Jack Homer, a 40-year veteran of system dynamics modeling and director of Homer Consulting, covered several topics in his presentation: (1) requirements for a useful and reliable systems model, (2) the roles of qualitative mapping and group model building in systems science efforts, (3) levels of evidence and the “possibility frontier” for reliable models, (4) system dynamics models that either focus on or include obesity, (5) concepts of equity and social justice in systems science models, and (6) characteristics of effective modeling projects.
Homer explained that public health stakeholders want to make decisions that will stand the test of time and avoid shortsightedness, but he acknowledged the challenge for models given the uncertainties in social systems that hamper precise forecasting. He referenced statistician George Box’s famous quote that “All models are wrong, but some are useful” to highlight a key characteristic of useful models—that they can correctly anticipate intervention impacts even if their baseline predictions are imprecise; that is, models can be good decision-making tools even if they are not forecasting tools (Homer and Hirsch, 2006; Sterman, 2002). He added that sensitivity analyses to assess the level of confidence in a model’s results often reveal that its policy conclusions are robust despite uncertainty in point predictions.
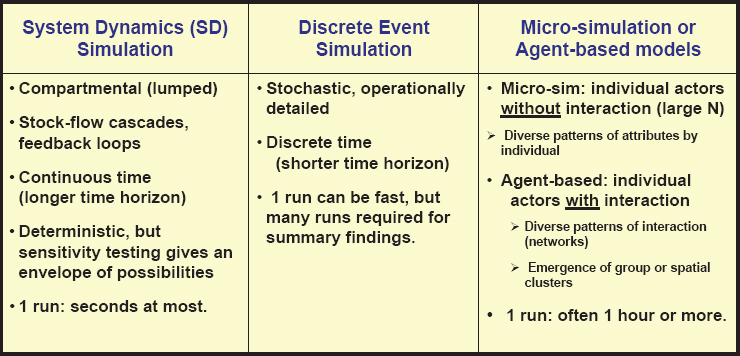
Homer compared three simulation approaches to systems science modeling—system dynamics simulation, discrete event simulation, and microsimulation (individual actors without interaction)/agent-based (individual actors with interaction) models (Borshchev and Filippov, 2004; Luke and Stamatakis, 2012). He underscored that despite different methods and emphases (see Figure 2-1), all three approaches agree that models must be testable, focused, and scientifically developed (Homer, 1996; Levy et al., 2011).
Homer went on to contrast systems science models, which he described as quantitative simulation approaches, with systems maps, which he described as qualitative pictures that can be useful even though they have limitations. As an example, he showed the UK Foresight Tackling Obesities: Future Choices Project Report (2007) systems map illustrating factors that contribute to obesity, pointing out that the map is expansive and causal but unfocused and untestable (United Kingdom Government Office for Science, 2007). According to Homer, a map is an unreliable tool for drawing behavioral inferences; however, formal testing can bridge the gap from structure to behavior.
SOURCE: Presented by Jack Homer, September 16, 2020.
Homer shared three quotes that he described as being representative of the debate about the roles of qualitative mapping and group model building in systems science efforts (Siokou et al., 2014) (see Box 2-1). These quotes, he suggested, convey that both approaches have value in enriching the modeling process but are unreliable for predicting intervention outcomes.
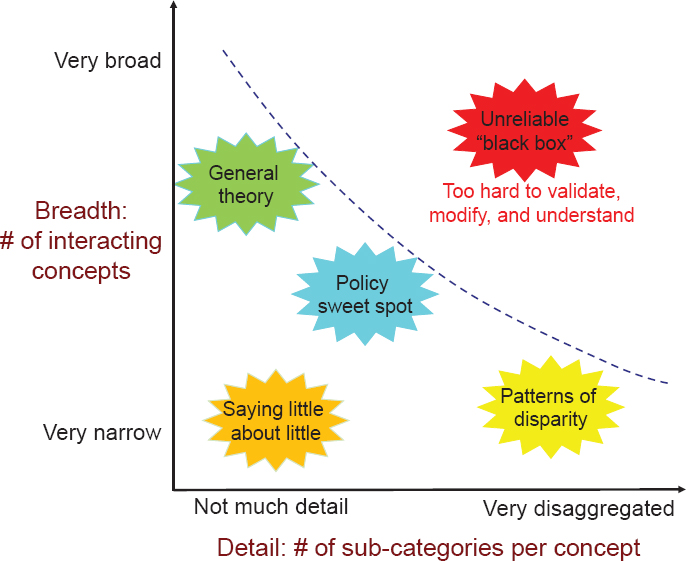
Homer then turned to quantified simulation models and practical considerations for their reliability. He described a conceptual diagram illustrating the “possibility frontier” of reliable modeling, which he characterized as a depiction of modeling choices and their feasibility and value (see Figure 2-2). The number of interacting concepts in a model (i.e., breadth) increases as one moves up the y-axis, he explained, and the number of subcategories per concept (i.e., level of detail) increases as one moves along the x-axis. The dotted line in the figure represents the possibility frontier, he continued, beyond which lies a “black box” area of models that are overly broad and overly detailed. He stated that these models are limited by a lack of sufficient data to support all of their assumptions and are too difficult to validate, modify, and understand.
Homer next described types of reliable models within the possibility frontier, from models of general theory (rich in concepts but with little operational detail) to models that explore patterns of disparity (with few interacting variables but highly disaggregated by subpopulations and subgroups). He maintained that the “policy sweet spot” is marked by models with adequate breadth and detail to be useful for decision makers.
Homer then described a conceptual diagram for thinking about how a model’s level of evidence (i.e., reliability, graded as A, B, or C) is related to its scope and the time required for its development. The broader the model’s scope, he explained, the longer it takes to achieve a high (A) level of evidence. A narrow model might take only days or weeks to achieve a high level of evidence, he elaborated, whereas a broader model could take months or years to achieve that same level.
According to Homer, artificial intelligence and machine learning could accelerate the process of achieving a high level of evidence so that broad models could be developed more quickly, but these techniques cannot fully bridge the gap. Machine learning enables mining of large databases for statistical regularities, he explained, but correctly inferring causation from these statistical regularities is unlikely. He added that artificial intelligence cannot fully overcome the challenges of incomplete data and incompatible datasets. Therefore, he asserted, science will continue to be a back-and-forth process between hypotheses, data, and the desire for parsimony, and he highlighted the role of human judgment in this process.
Homer moved on to describe a system dynamics model that he developed with the Centers for Disease Control and Prevention’s (CDC’s) Division of Nutrition, Physical Activity, and Obesity in 2005. He explained that this model of the U.S. population stratified by sex and single-age cohorts shows how caloric imbalances translate to upward and downward flows in
SOURCE: Presented by Jack Homer, September 16, 2020.
body mass index (BMI) categories and explains trajectories in obesity and severe obesity over time by sex and age group. The model, he elaborated, was informed by 30 years of longitudinal data from the U.S. Census and the National Health and Nutrition Examination Survey (NHANES) and by data on 1-year weight changes among adults and children, which he said provided key information about the BMI upflow and downflow rates (Homer et al., 2006).
Homer next cited results from the 2005 system dynamics model mentioned above, which he characterized as a fairly confident step forward given the level of data available at the time. First, the model indicated that the caloric imbalance responsible for the increased prevalence of obesity from 1970 to the 2000s was only about 1 or 2 percent, or less than 50 calories per day, within any given age, sex, and BMI category. Second, Homer reported that the impacts of changing environments on adult obesity take decades to manifest fully through the “carryover effect” built into the aging structure. Thus, he explained, preventive interventions may take longer than expected to produce results. Third, the model suggested that youth interventions are likely to have a relatively small impact on future adult
obesity. Finally, Homer reported, the model indicated that ideal policy responses would combine preventive interventions with effective weight loss options for people with obesity (Homer et al., 2006). Homer remarked that other modelers who took a similar calorie-based, “BMI transitions” approach reached similar conclusions about caloric imbalances (Fallah-Fini et al., 2014; Wang et al., 2007). He encouraged researchers to use whatever modeling technique they find useful as long as it produces reliable answers that can help decision makers.
Homer then referenced several other system dynamics models that have focused either on obesity (such as models of individual weight management) or on topics in which obesity plays a role (such as models of food market transformation, diabetes onset and progression, cardiovascular disease development, and the relationship of social determinants of health to county-level morbidity and mortality) (Hamid, 2009; Hirsch et al., 2014; Jones et al., 2006; Milstein and Homer, 2020; Struben et al., 2014). He noted that some systems models stratify populations by race, class, or gender to describe the associated differences and project the impact of targeting an intervention to one subpopulation or another. However, he observed, he is aware of no published systems model focused directly on the dynamics of equity and social justice. He suggested that if one could model the social forces that reinforce inequity and undermine justice, then those results could help identify opportunities to reverse these forces.
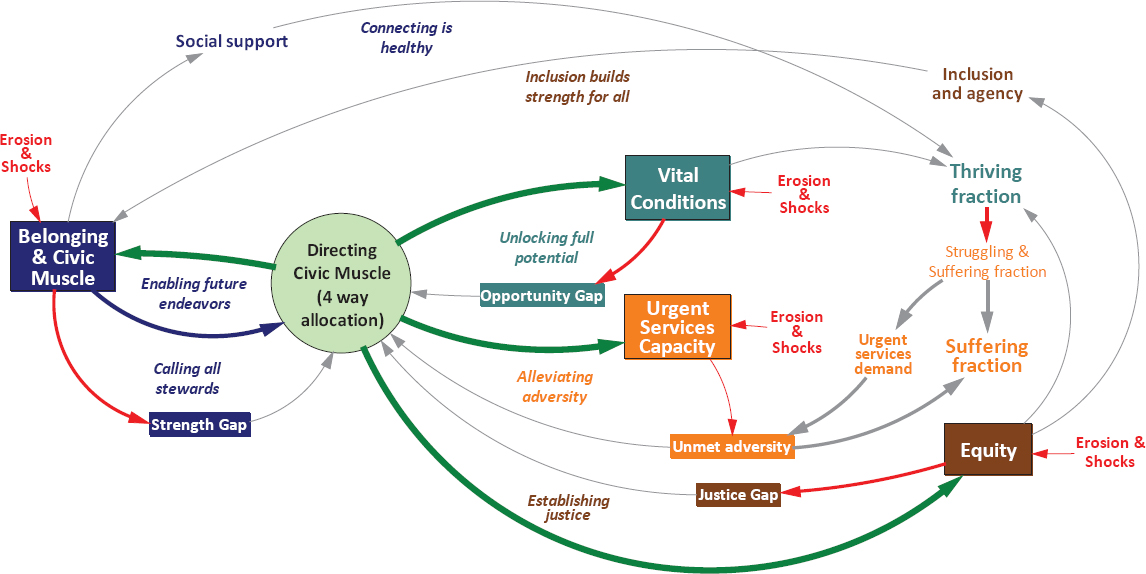
Homer described a preliminary model along these lines (see Figure 2-3). This high-level model, he explained, depicts community actions and conditions involved in the response to a shock such as the Great Recession or the coronavirus pandemic, and can indicate a community’s resilience or ability to rebound. The model is based loosely on CDC’s Healthy People 2030 Well-Being Framework, he added, and includes concepts such as vital conditions, urgent services capacity, civic muscle (i.e., capacity for action and investment), and equity. In this preliminary model, he elaborated, postshock decisions about how to allocate civic muscle have long-term effects. For example, Homer continued, previous levels of equity may never be regained if this is not made a high priority. He qualified his description of this model by characterizing it as suggestive and not yet ready for “prime time,” as it lacks operational detail and includes only rough estimates of some key parameters. He called for local case studies and longitudinal data to advance the model from a thought-provoking “toy” to a more serious tool.
In closing, Homer drew on his previous modeling experiences to suggest a blueprint for what he described as an ideal systems science modeling project—to which substantial funding and more than 1 year of time are allocated. First, he urged adherence to best practices for model building, testing, and documentation (Homer, 2019a; Rahmandad and Sterman, 2012). Best practices exist for conducting systems modeling, he elaborated,
SOURCES: Presented by Jack Homer, September 16, 2020; Milstein and Homer, 2020. Image used with permission of The Rippel Foundation.
as well as for reporting outputs and documenting models so that others can replicate and verify them. Second, he suggested anchoring models to well-established datasets (such as NHANES or the Behavioral Risk Factor Surveillance System) and the best studies, explaining that a core of well-accepted longitudinal data helps a modeling effort establish respect and credibility. Third, he encouraged enlisting analysts to extract data, as well as statisticians who can help interpret the data. Fourth, he called for including stakeholders, decision makers, and subject-matter experts as advisers on modeling teams to help ensure that the models produced will reflect their concerns and knowledge. Fifth, he encouraged engaging other thought leaders around the country and the world who can serve as allies and intermediaries as modelers work with decision makers. Finally, Homer appealed for involving junior modelers as apprentices and helping them gain experience with all of the intricacies of large projects aimed at providing input for public policy.


