
Appendix B
Supplemental Figures and Tables from Commissioned Analyses
As described in Chapter 3, the committee commissioned two analyses to understand the extent of health care costs—to the Medicare program, to private health care payers, and to patients—that arise from billing for discarded drugs and biologicals from single-dose vials. The focus of these analyses was not to assess the economic value of the discarded drug but rather to get a sense of the amount of drugs that are being discarded and to identify any inefficiencies in the current system of tracking the amount of discarded drugs yearly. One analysis looked at Medicare claims that used the JW modifier code,1 examining how much of total Medicare spending they represent; examined patterns in the claims using the JW modifier code and whether those claims accurately reflected the amount spent each year by Medicare on discarded drugs; and explored compliance with the JW modifier. The second analysis looked at the use of the JW modifier in the private health care system and estimated the costs associated with discarded drugs for both patients and their payers in this system.
The key findings from those two analyses are described in Chapter 3, but the analyses included a great many results and details that were not included in the chapter. These additional results are provided below in
___________________
1 As described in Chapters 2 and 3, the JW modifier is the mechanism through which health care providers can bill and be reimbursed for the discarded portion of a drug from a single-dose vial in a way that formally documents the amount of drug that was discarded. The modifier can be used for any single-dose vial in which some drug is discarded, regardless of whether the drug is administered in a fixed dose or a dose based on weight.
the form of figures and tables describing the use of the JW modifier in various situations and settings.
COSTS OF DISCARDED DRUGS
The first issue the researchers addressed was the insurance payment associated with the portion of drugs discarded each year, both drugs that are paid for by Medicare and those paid for by private insurers. Basic estimates of payment for the discarded drugs can be obtained by adding up the payment of the drug claims for which the JW modifier was applied. However, given the evidence of inconsistent use of the JW modifier by physicians (described in Chapter 3), it is likely that a significant percentage of discarded drugs are never reported via the JW modifier, implying that the estimates of the total payment of discarded drugs based on Medicare claims are likely to be significantly low. Thus, the researchers went beyond these basic calculations to obtain a more accurate idea of the amount of spending on the drugs that are discarded each year.
For example, to get a sense of just how low the JW modifier–based estimates of waste are for drugs paid for by Medicare Part B, the researchers analyzed the top five drugs in terms of spending on discarded drugs (i.e., spending associated with claims with the JW modifier) and estimated the amount of spending on discarded drugs that was not reported. This was done by first calculating a patient-drug-specific ratio of JW-associated spending to total spending for claims with the JW modifier and then applying that ratio to calculate additional potential waste for observed encounters where the patient received the drug but there was no claim for discarded drug (i.e., claim with the JW modifier) for that encounter. As shown in Table B-1, the total spending on discarded drug as a percentage of total spending for the drug ranged from 9 percent to 27 percent for these drugs without accounting for the amount of unreported spending. After including the estimated amount of unreported spending on discarded drugs, the percentage ranged from 11 percent to 28 percent. It is important to note that even with the inclusion of the estimated unreported spending, these figures are likely an underestimation of spending on discarded drug because it is not possible to calculate potential waste for patient–drug combinations where the JW modifier was never used, which accounts for a sizable percentage of patient–drug combinations.
In another analysis to estimate the costs of discarded drugs, the researchers included only health care providers who used the JW modifier. Wide variations across drugs were also observed between calculation that included and excluded health care providers who never used the JW modifier (see Table B-2). In some drugs (e.g., omalizumab), the difference
TABLE B-1 Estimated Costs of Discarded Drugs Paid for by Medicare Part B ($ millions), 2018
| Drug | Total Part B Spending ($ in millions) | Observed JW Waste Spending | Total Observed JW Waste Spending as a Percentage of Total Part B Spending (%) | Potential Waste Spending, Patient-Drug Level | Total Waste Spending (observed + potential) | Total Waste Spending as a Percentage of Total Part B Spending (%) |
|---|---|---|---|---|---|---|
| Bortezomib | 90.5 | 24.2 | 27 | 1.31 | 25.51 | 28 |
| Trastuzumab | 175 | 15.9 | 9 | 4.20 | 20.10 | 11 |
| Romiplostim | 48.4 | 10.6 | 22 | 2.01 | 12.61 | 26 |
| Paclitaxel Protein-Bound | 56 | 7.6 | 14 | 1.05 | 8.61 | 15 |
| Carfilzomib | 52.1 | 6.7 | 13 | 1.41 | 8.13 | 16 |
NOTES: Top five drugs in terms of spending on claims with the JW modifier, 2018. All estimates based on the 20 percent sample and not scaled to estimate 100 percent.
TABLE B-2 Use of the JW Modifier and Associated Spending Among Medicare Part B Providers Who Sometimes/Always Used Modifier, 2018
| Excluding Health Care Providers Who Never Used JW Modifier | Including Health Care Providers Who Never Used JW Modifier | |||
|---|---|---|---|---|
| Percent of Claims with the JW Modifier | Percent of Spending on the JW Modifier Claims | Percent of Claims with the JW Modifier | Percent of Spending on the JW Modifier Claims | |
| Belimumab | 47.0 | 3.3 | 36.3 | 2.6 |
| OnabotulinumtoxinA | 54.9 | 11.6 | 36.3 | 7.9 |
| Daptomycin | 42.1 | 17.5 | 20.2 | 9.2 |
| Decitabine | 85.4 | 25.2 | 74.6 | 22.6 |
| Golimumab | 65.6 | 9.7 | 51.2 | 7.6 |
| Infliximab | 22.7 | 2.2 | 14.4 | 1.4 |
| Omalizumab | 45.3 | 10.3 | 25.2 | 6.3 |
| Romiplostim | 71.1 | 22.9 | 67.5 | 22.0 |
| Tocilizumab | 48.8 | 4.1 | 34.8 | 2.9 |
| Azacitidine | 84.4 | 24.6 | 76.4 | 22.8 |
| Bortezomib | 87.6 | 29.1 | 79.7 | 27.0 |
| Brentuximab Vedotin | 67.1 | 11.3 | 63.9 | 10.8 |
| Cabazitaxel | 90.1 | 28.5 | 85.3 | 27.2 |
| Carfilzomib | 75.4 | 14.2 | 68.7 | 12.9 |
| Cetuximab | 46.4 | 4.0 | 41.4 | 3.6 |
| Daratumumab | 37.6 | 1.7 | 33.0 | 1.5 |
| Elotuzumab | 46.8 | 5.1 | 38.8 | 4.2 |
| Ipilimumab | 56.9 | 8.4 | 54.0 | 8.0 |
| Paclitaxel Protein-Bound | 73.3 | 15.3 | 64.9 | 13.9 |
| Panitumumab | 57.8 | 6.2 | 52.7 | 5.7 |
| Pemetrexed Disodium | 51.1 | 3.3 | 44.8 | 2.9 |
| Ramucirumab | 59.2 | 4.5 | 55.2 | 4.2 |
| Ado-Trastuzumab Emtansine | 63.3 | 7.1 | 57.5 | 6.6 |
| Trastuzumab | 65.5 | 10.5 | 58.3 | 9.4 |
| Doxorubicin HCL Peg-Liposomal | 22.9 | 4.4 | 18.4 | 3.5 |
NOTES: Sample of drugs include those with greater than 10 percent claims with the JW modifier in 2018. Excluded health care providers with fewer than 11 claims for a given drug.
in the percentage spending on JW claims could be as large as 50 percent (i.e., 10.3 percent versus 6.3 percent).
The committee’s second commissioned analysis examined the use of the JW modifier in drug treatments paid for by private insurers. Although the MarketScan data used in this analysis did not allow for the sorts of physician-to-physician comparisons that were carried out with the Medicare data, the consultant performed an analysis with patient–drug pairs (i.e., situations involving one patient being treated with the same drug on multiple occasions) to gain insight into how consistently the JW modifier is used in claims on private insurance. For each patient–drug pair the consultant categorized compliance with the Centers for Medicare & Medicaid Services (CMS) mandate of the JW modifier into three levels: no compliance, partial compliance, and full compliance.
Of the 62 drugs with at least one JW modifier claim, the researcher focused specifically on the 25 drugs for which there was at least a 5 percent JW compliance rate at the patient–drug pair level (see Table B-3). Of these, azacitidine had the highest JW compliance rate, with full compliance for 18.51 percent of patient–drug pairs and partial compliance for 23.51 percent of patient–drug pairs. A total of 17 drugs had a JW compliance rate of at least 20 percent when full and partial compliance rates were combined.
The researchers imputed the potential additional spending on discarded drugs using the same approach described in the Medicare analysis by applying a patient–drug-specific ratio to the partially compliant group. The researchers found that using the approach employed by CMS, discarded drugs accounted for 0.81 percent of total insurance payment on the 18 drugs with discarded amount over $1 million (see Table B-4). However, this percentage was based on the underused JW modifier. When the potential additional spending imputed from the partially compliant group was included, the percentage of total insurance payment on discarded drugs increased to 1.6 percent (see Table B-4). For some drugs the difference between imputed and raw percentage was large. For example, the raw percent was 3.9 percent for carfilzomib and the imputed percentage was close to 8 percent. This analysis again demonstrated the underestimation of costs associated with discarded drugs when the calculation was relying on the use of the JW modifier.
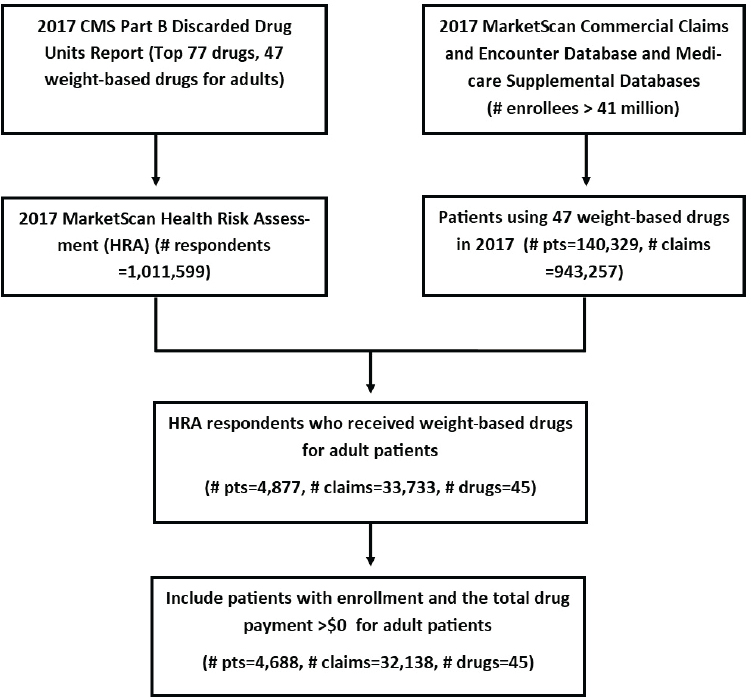
To better understand the financial impact of discarded drugs, the researchers conducted an additional analysis that used the actual weight and height of patients to determine the discarded percentage of their drugs. In the MarketScan data, there is Health Risk Assessment (HRA) survey data that include patients’ self-reported weight and height information. From the 77 Part B drugs, the researchers identified 45 weight-based drugs. They abstracted recommended drug dosage and its vial size for a drug to treat a specific disease based on IBM Micromedex. They then
TABLE B-3 Distribution of Percentage of JW Compliance Among Drugs with at Least 5 Percent JW Modifier Claims in the MarketScan Data
| Drug | Generic Name | Number of Patients | Compliance (%) | ||
|---|---|---|---|---|---|
| No | Full | Partial | |||
| J9025 | Azacitidine* | 940 | 57.98 | 18.51 | 23.51 |
| J1602 | Golimumab | 2,853 | 62.99 | 20.68 | 16.33 |
| J9041 | Bortezomib | 3,640 | 64.2 | 17.17 | 18.63 |
| J9043 | Cabazitaxel | 351 | 66.67 | 22.79 | 10.54 |
| J0894 | Decitabine* | 545 | 67.16 | 18.35 | 14.5 |
| J9047 | Carfilzomib | 1,005 | 68.76 | 10.05 | 21.19 |
| J2796 | Romiplostim | 680 | 71.18 | 7.5 | 21.32 |
| J9264 | Paclitaxel Protein-Bound | 3,678 | 71.83 | 14.11 | 14.06 |
| J9354 | Ado-Trastuzumab Emtansine | 688 | 73.26 | 9.01 | 17.73 |
| J0490 | Belimumab | 2,001 | 74.06 | 3.85 | 22.09 |
| J3262 | Tocilizumab | 2,429 | 77.07 | 4.49 | 18.44 |
| J9042 | Brentuximab Vedotin | 504 | 78.57 | 10.12 | 11.31 |
| J9176 | Elotuzumab | 238 | 78.57 | 7.14 | 14.29 |
| J9145 | Daratumumab | 1,182 | 78.6 | 4.23 | 17.17 |
| J9305 | Pemetrexed Disodium | 3,844 | 78.85 | 8.82 | 12.33 |
| J9355 | Trastuzumab | 9,925 | 78.89 | 3.85 | 17.26 |
| J9308 | Ramucirumab | 824 | 79.85 | 8.62 | 11.53 |
| J9055 | Cetuximab | 1,540 | 80.52 | 4.94 | 14.55 |
| J0585 | OnabotulinumtoxinA* | 57,960 | 80.66 | 10.65 | 8.69 |
| J9303 | Panitumumab | 738 | 81.17 | 5.15 | 13.69 |
| J9228 | Ipilimumab | 1,378 | 81.71 | 10.3 | 7.98 |
| J1745 | Infliximab | 28,552 | 89.14 | 2.52 | 8.35 |
| Q2050 | Doxorubicin HCL Peg-Liposomal* | 1,946 | 92.24 | 1.95 | 5.81 |
| J9299 | Nivolumab | 5,790 | 93.61 | 1.93 | 4.46 |
| J0878 | Daptomycin* | 7,223 | 94.12 | 2.38 | 3.5 |
* Indicates multiple brand and/or generic names for a specific Healthcare Common Procedure Coding System code.
collected the drug claims of these 45 drugs from the Commercial Claims and Encounter databases and the Medicare Supplemental Databases in IBM MarketScan data in 2017. Then, they linked the HRA data with the drug claims to select patients with known weight/height; the final study cohort included 4,688 patients (see Figure B-1).
TABLE B-4 Percentage of JW Claims and Discarded Amount for 18 Drugs with Discarded Amount ≥ $1 Million in MarketScan Data
| Generic | Observed Number of Claims | Number of Claims | Total | Percentage | ||||
|---|---|---|---|---|---|---|---|---|
| Net Pay $ Million | JW Net Pay $ Million | JW Claim | JW Net Pay | |||||
| Raw | Imputed | Raw | Imputed | |||||
| Total | 854,901 | 4,039,256 | 99,51.5 | 80.6 | 3.62 | 6.56 | 0.81 | 1.6 |
| Trastuzumab | 9,925 | 150,843 | 679 | 16 | 9.72 | 20.82 | 2.35 | 5.18 |
| Infliximab | 28,552 | 254,503 | 12,87.7 | 8.5 | 5.29 | 10.87 | 0.66 | 1.44 |
| Bortezomib | 3,640 | 98,359 | 121.1 | 7.3 | 18.18 | 27.09 | 6.06 | 8.79 |
| OnabotulinumtoxinA* | 57,960 | 219,057 | 183.5 | 7.1 | 13.29 | 20.28 | 3.89 | 5.69 |
| Bevacizumab | 38,194 | 228,783 | 489.9 | 5.9 | 4 | 8.11 | 1.2 | 2.47 |
| Paclitaxel Protein-Bound | 3,678 | 41,835 | 101 | 4.2 | 15.99 | 22.67 | 4.14 | 6.02 |
| Ipilimumab | 1,378 | 5,684 | 175.9 | 3.2 | 9.69 | 14.78 | 1.81 | 2.62 |
| Carfilzomib | 1,005 | 35,661 | 65.2 | 2.5 | 16.01 | 27.52 | 3.9 | 7.98 |
| Golimumab | 2,853 | 19,097 | 66.2 | 2.4 | 20.65 | 29.31 | 3.57 | 5.16 |
| Brentuximab Vedotin | 504 | 4,261 | 77.2 | 2.3 | 10.82 | 17.84 | 3.03 | 4.64 |
| Romiplostim | 680 | 20,427 | 43.4 | 2.3 | 16.05 | 29.7 | 5.33 | 9.92 |
| Pembrolizumab | 4,828 | 32,471 | 296.1 | 1.9 | 2.21 | 4.64 | 0.63 | 1.41 |
| Ado-Trastuzumab Emtansine | 688 | 8,367 | 66.1 | 1.7 | 13.1 | 24.51 | 2.56 | 4.87 |
| Pemetrexed Disodium | 3,844 | 26,535 | 139.2 | 1.6 | 10.97 | 20.37 | 1.17 | 2.16 |
| Omalizumab | 7,459 | 81,999 | 103.4 | 1.5 | 4.65 | 8.19 | 1.47 | 2.6 |
| Cabazitaxel | 351 | 2,391 | 14.7 | 1.1 | 20.16 | 24.97 | 7.37 | 9.83 |
| Rituximab | 17,568 | 87,867 | 584.7 | 1 | 0.68 | 1.85 | 0.18 | 0.56 |
| Nivolumab | 5,790 | 60,779 | 370.6 | 1 | 1.93 | 6.31 | 0.28 | 1.09 |
* Indicates multiple brand and/or generic names for a specific Healthcare Common Procedure Coding System code.
NOTE: CMS refers to the Centers for Medicare & Medicaid Services and pts refers to patients.
Of the 4,688 patients in the study cohort (see Figure B-7), the researchers multiplied patients’ weight/height with recommended drug dosage to obtain patients’ drug units used for treatment assuming no dose reduction, and computed the discarded drug units by subtracting patients’ treatment drug units from the full vial sizes. They calculated the percentage of the discarded drug units by dividing the discarded units over the full vial sizes. They limited the analyses to drugs with more than 10 claims for each drug, and included 38 drugs. The findings are depicted in Figure B-2, which shows the mean, minimum, and maximum discarded percentage for each drug, ordered by the discarded percentages. The mean discarded percentage ranged from less than 1 percent to close to 40 percent. Furthermore, within each drug, variations in patients’ weight
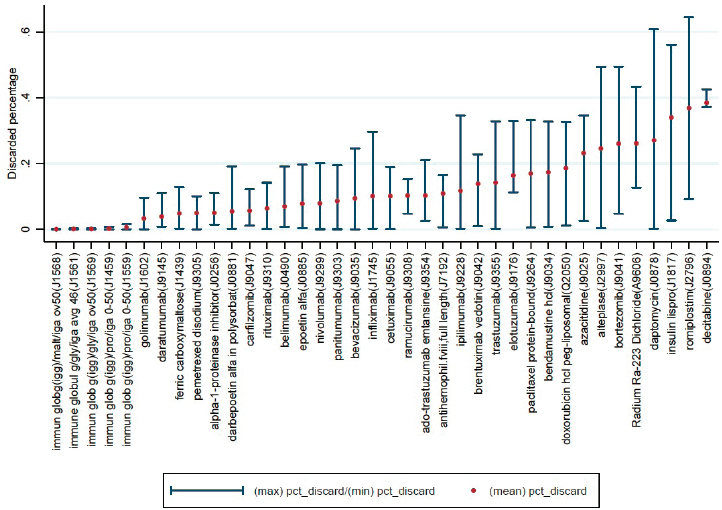
or BSA resulted in a noticeable range between minimum and maximum percentages for some drugs.
The researchers then analyzed payment variables from claims data to estimate the financial burden of discarded drugs for private payers and patients. On average, private insurance paid $36,652 per patient on weight-based drugs, and of this amount, $2,992 (8.2 percent) was spent on discarded drugs. The mean out-of-pocket cost was $1,043, and of this, $78 (7.5 percent) was spent on discarded drugs. Although the average out-of-pocket cost for discarded drugs was moderate, a small subset of patients disproportionately bore the financial burden, especially those enrolled in high-deductible plans. For these patients, the top 10 percent paid more than $380 for discarded drugs, whereas for patients not in high-deductible plans, the top 10 percent paid more than $260.
THE JW MODIFIER COMPLIANCE RATE
There was substantial variation in health care providers’ use of the JW modifier from one drug to another, as shown in Figure B-3. To simplify this part of the analysis, the consultant restricted it to the 25 drugs in the
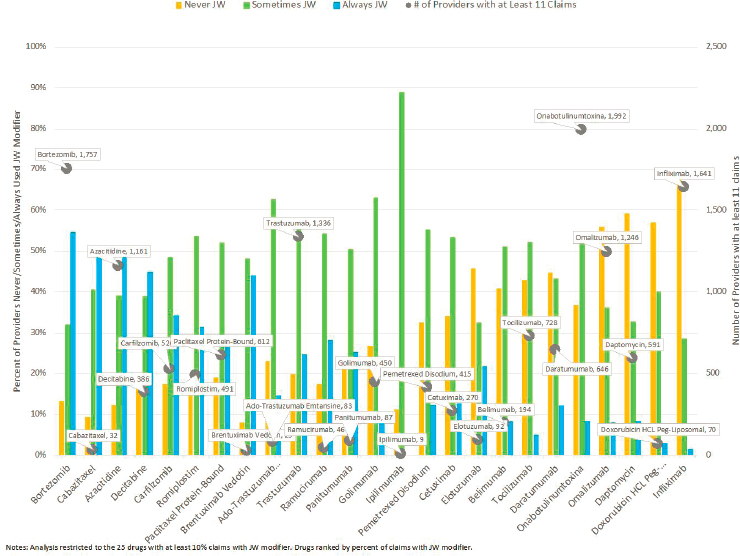
sample for which at least 10 percent of claims had the JW modifier and also restricted it to health care providers with at least 11 claims for the drug using a 20 percent random sample of Medicare fee-for-service outpatient and carrier claims in 2018. As the figure shows (y-axis), the number of health care providers included in the analysis varied widely according to the particular drug, from 9 health care providers with at least 11 claims for ipilimumab to close to 2,000 health providers with at least 11 claims for onabotulinumtoxinA. Among this sample of health care providers, the percentage who never used the JW modifier varied across drugs, from 8 percent of health care providers administering brentuximab vedotin never using the modifier for that drug to 70 percent of those administering infliximab. Given the large percentages of physicians with more than 11 claims who used the modifier in some cases but not others, there is clear evidence that health care providers’ use of the JW modifier is inconsistent from one drug to another.
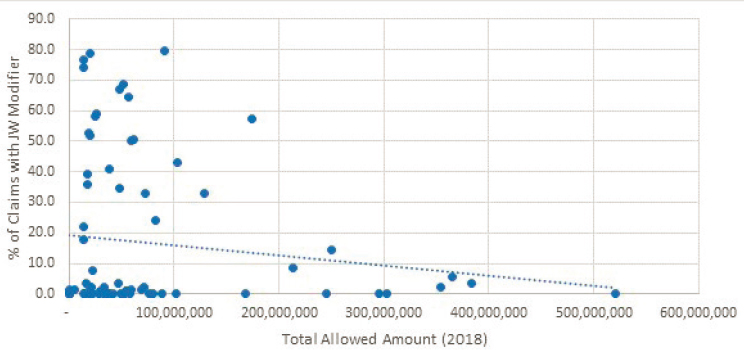
In addition to their analyses of spending on discarded drugs, the consultants who performed the Medicare analysis also looked for what factors might influence the likelihood that a physician will use the JW
modifier. For example, to assess whether there was any relationship between the total amount Medicare spent on a drug and the likelihood that the JW modifier would be used in a claim, the researchers examined the percentage of claims with the JW modifier across drugs with different total allowed amounts in 2018. As shown in Figure B-4, there was very low negative correlation between total Medicare spending on a drug and the percentage of claims with the JW modifier.
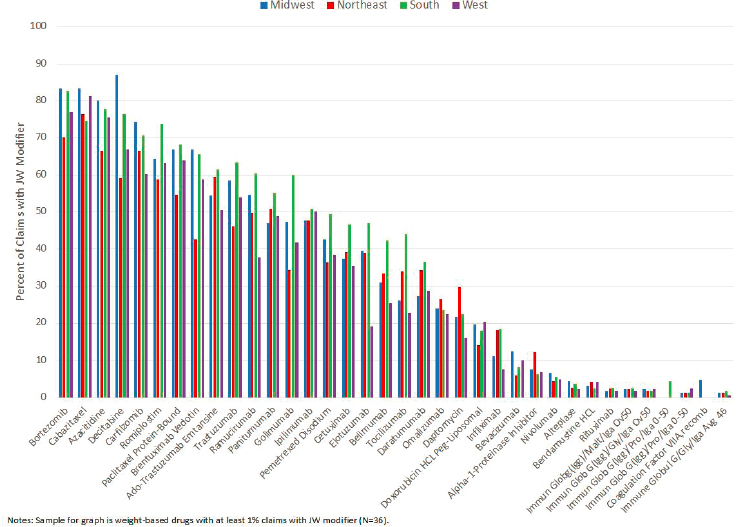
A second possible correlation examined by the researchers was the influence of geographic region on likelihood of JW modifier use. Among weight-based drugs in the sample for which at least 1 percent of claims had the JW modifier (40 of 77 drugs), the researchers found few consistent patterns or substantial differences in terms of use of the modifier across regions, as shown in Figure B-5.
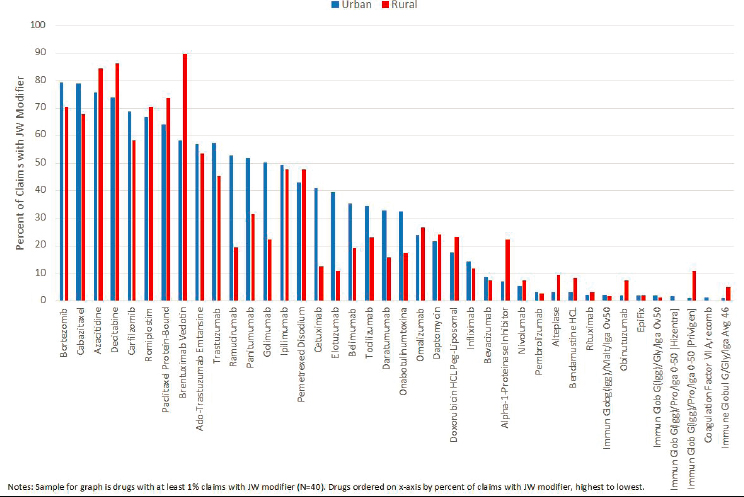
Nor was a physician’s location in an urban versus a rural area a major factor in the use of the JW modifier. As shown in Figure B-6, among drugs in the sample for which at least 1 percent of Medicare claims had the JW modifier (40 of 77 drugs), the use of the JW modifier in urban versus rural areas did not follow any sort of consistent pattern.
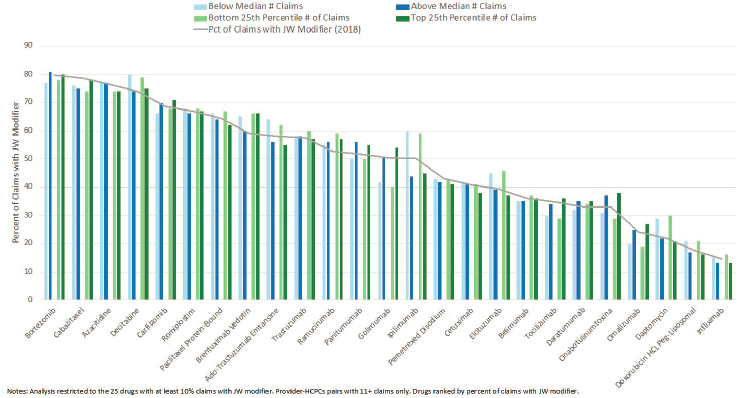
As shown in Figure B-7, the rates of JW modifier use were similar between health care providers with above median number of claims for a particular drug (dark blue bars) and those with below the median number of claims (light blue bars) and also between health care providers in the bottom 25th (dark green bars) and top 25th percentiles (light green bars) of claims for that drug. There was no relationship between provider volume of claims and use of the JW modifier.
The only consistent pattern identified across drugs was the higher use of the JW modifier in physician office settings relative to hospital outpatient departments, as shown in Figure B-8. Across the 40 drugs in
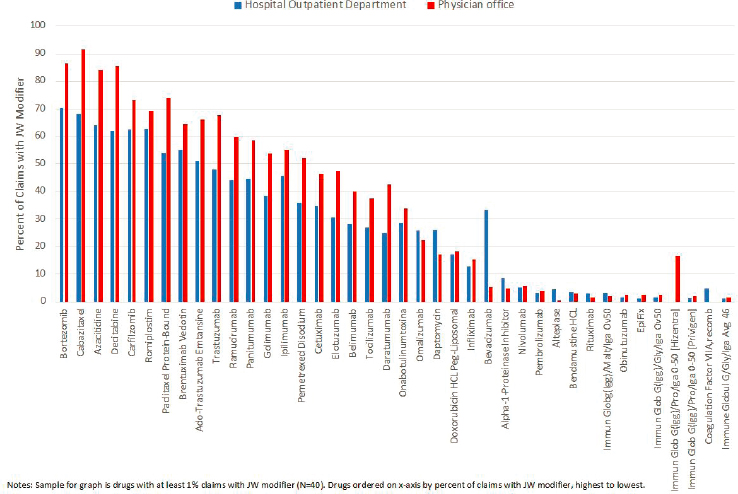
the sample with at least 1 percent of Medicare claims with the JW modifier, JW modifier use was higher in terms of the percentage of claims for a given drug with the JW modifier in physician office settings relative to hospital outpatient departments.


