


Below is the uncorrected machine-read text of this chapter, intended to provide our own search engines and external engines with highly rich, chapter-representative searchable text of each book. Because it is UNCORRECTED material, please consider the following text as a useful but insufficient proxy for the authoritative book pages.
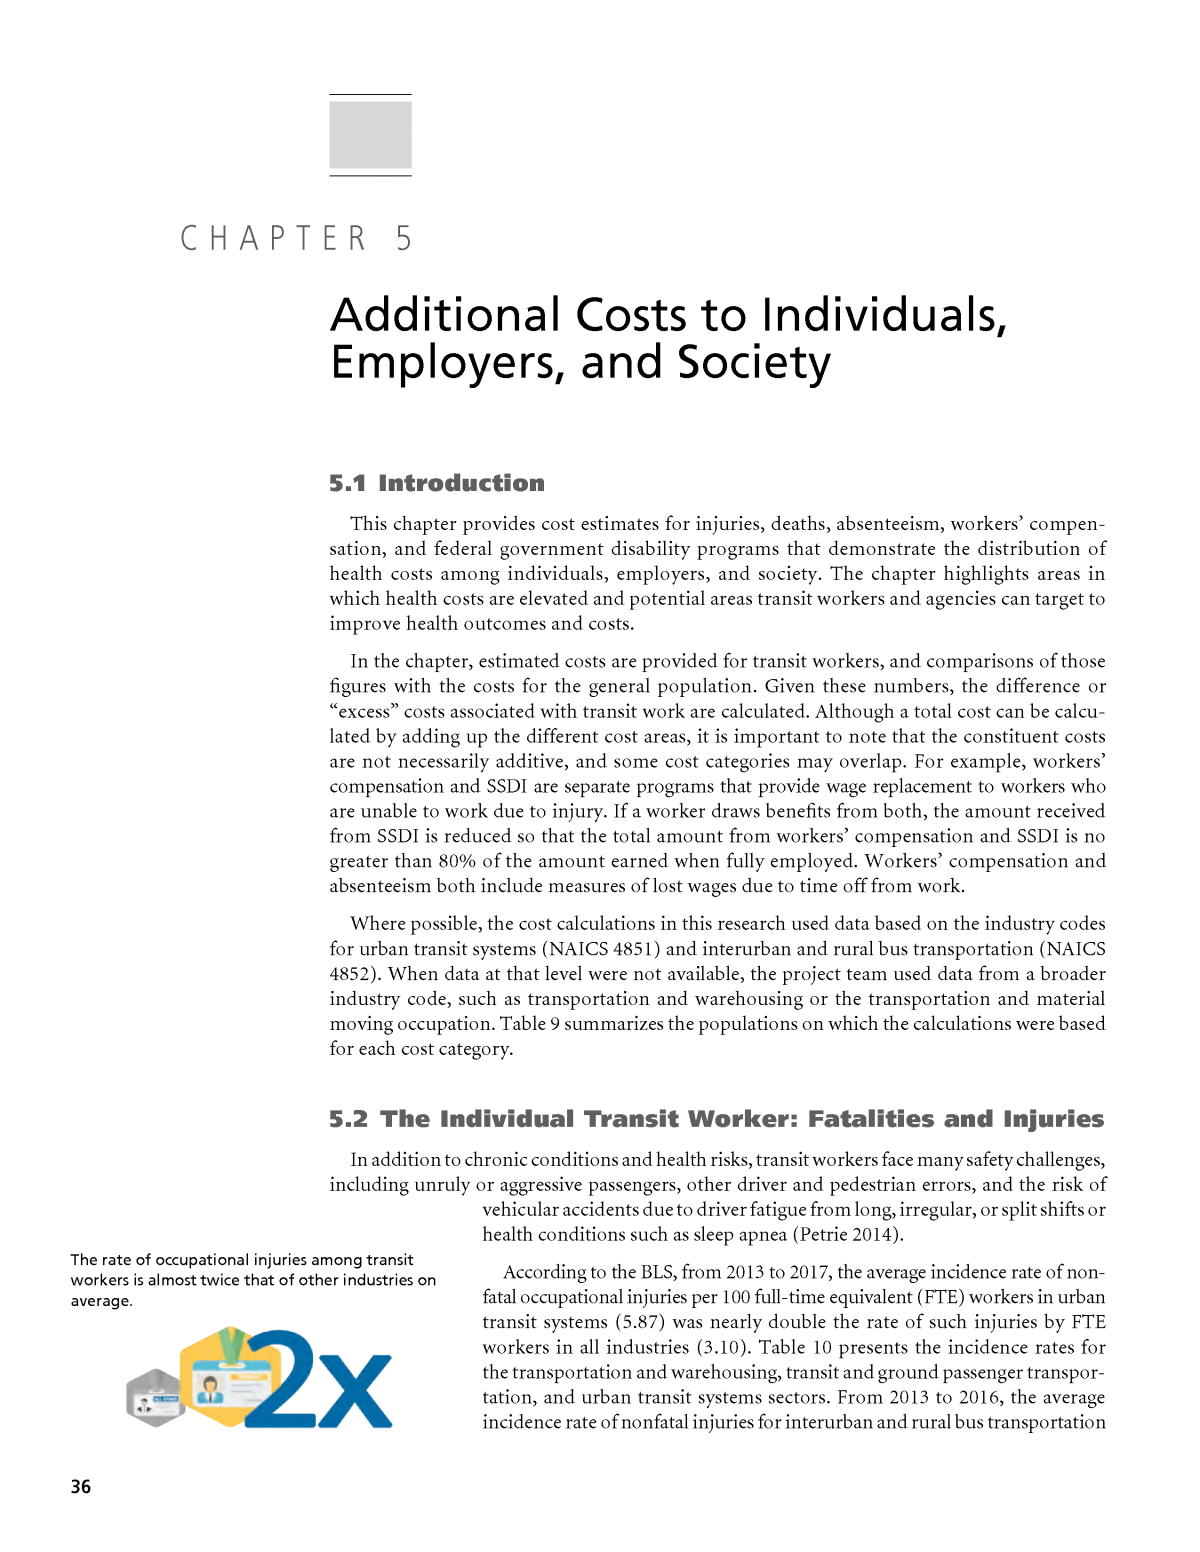
36 5.1 Introduction This chapter provides cost estimates for injuries, deaths, absenteeism, workersâ compen- sation, and federal government disability programs that demonstrate the distribution of health costs among individuals, employers, and society. The chapter highlights areas in which health costs are elevated and potential areas transit workers and agencies can target to improve health outcomes and costs. In the chapter, estimated costs are provided for transit workers, and comparisons of those figures with the costs for the general population. Given these numbers, the difference or âexcessâ costs associated with transit work are calculated. Although a total cost can be calcu- lated by adding up the different cost areas, it is important to note that the constituent costs are not necessarily additive, and some cost categories may overlap. For example, workersâ compensation and SSDI are separate programs that provide wage replacement to workers who are unable to work due to injury. If a worker draws benefits from both, the amount received from SSDI is reduced so that the total amount from workersâ compensation and SSDI is no greater than 80% of the amount earned when fully employed. Workersâ compensation and absenteeism both include measures of lost wages due to time off from work. Where possible, the cost calculations in this research used data based on the industry codes for urban transit systems (NAICS 4851) and interurban and rural bus transportation (NAICS 4852). When data at that level were not available, the project team used data from a broader industry code, such as transportation and warehousing or the transportation and material moving occupation. Table 9 summarizes the populations on which the calculations were based for each cost category. 5.2 The Individual Transit Worker: Fatalities and Injuries In addition to chronic conditions and health risks, transit workers face many safety challenges, including unruly or aggressive passengers, other driver and pedestrian errors, and the risk of vehicular accidents due to driver fatigue from long, irregular, or split shifts or health conditions such as sleep apnea (Petrie 2014). According to the BLS, from 2013 to 2017, the average incidence rate of non- fatal occupational injuries per 100 full-time equivalent (FTE) workers in urban transit systems (5.87) was nearly double the rate of such injuries by FTE workers in all industries (3.10). Table 10 presents the incidence rates for the transportation and warehousing, transit and ground passenger transpor- tation, and urban transit systems sectors. From 2013 to 2016, the average incidence rate of nonfatal injuries for interurban and rural bus transportation C H A P T E R 5 Additional Costs to Individuals, Employers, and Society The rate of occupational injuries among transit workers is almost twice that of other industries on average.
Additional Costs to Individuals, Employers, and Society 37 workers was roughly similar to that of urban transit systems workers, at 5.80 per 100 FTE workers. However, during the same period, the annual number of cases and annual incidence rates for interurban and rural bus transportation workers showed greater variation than did the cases and incidence rates among urban transit workers (BLS 2019b). Injury and fatality costs (or cost-of-illness studies) are commonly estimated using dis- counted future earnings. Costs in the future are scaled to a base year using a discount rate, on the premise that the cost today is not equivalent to that same amount days, months, or years from now. Cost-of-illness estimates often are broken into direct costs and indirect costs, which are additive. Direct costs represent medical expenditures to treat a condition. Indirect costs conceptually represent economic products not produced due to impairment, and they generally are measured by lost earnings. Prevalence methods estimate only the direct and indirect costs of injuries and diseases incurred during a given year, even if the injury or disease began or occurred in previous years, and mortality costs are assigned to the year of death. In contrast, the incidence approach assigns and discounts direct and indirect costs to the year in which the condition first appears (Hartunian, Smart, and Thompson 1980). The value of a statistical life (VSL) is a measure of risk formally defined as the additional cost that individuals would be willing to pay for improvements in safety (a reduction of risk) that would collectively reduce the expected number of fatalities by one. The âwillingness to payâ approach provides an alternative to the discounted future earnings approach, which may underestimate indirect or mortality costs because the value that some place on life is not solely measured by oneâs earning capacity (U.S. DOT 2016b). Cost Category Populations on Which the Data Are Based Workers Injury costs Urban transit systems (NAICS 4851); truck drivers (Biddle 2013) Mortality costs Bus service and urban transit (NAICS 485, excluding NAICS 4853) Employers and society Absenteeism Transportation and warehousing (NAICS 48-49) Workersâ compensation (premiums) Trade, transport, and utilities industry (NAICS 22, 42, 44-45, 48-49) Workersâ compensation (claims) Urban transit systems and interurban and rural bus transportation (NAICS 4851, 4852); transit and intercity bus drivers (SOC 53-3052) Disability (SSDI) Transportation and material moving (SOC 53-0000) Disability (SSI) Transportation and material moving (SOC 53-0000) Medicare Transportation and material moving (SOC 53-0000) Table 9. Populations represented by each cost category. Industry NAICS Code Average Incidence Rate (per 100 FTE workers) Average Number of Annual Cases (thousands) Employment (May 2017) All industries, private and public (e.g., state and local government) All 3.10 3,433,600 142,549,250 Transportation and warehousing 48-49 4.47 196,580 5,792,400 Transit and ground passenger transportation 485 4.26 14,400 496,120 Urban transit systems 4851 5.87 2,460 47,000 Source: Categories and data drawn from BLS (2019b), Table SNR05, Incidence rate and number of nonfatal occupational injuries by industry and ownership, 2013â2017 Table 10. Incidence rates, nonfatal occupational injuries in transit workers per 100 FTE workers, 2013â2017.
38 Improving the Health and Safety of Transit Workers with Corresponding Impacts on the Bottom Line Estimates of willingness to pay are derived from responses in real markets based on consumer purchase or employment decisions (revealed preferences), or in hypothetical markets (stated preferences). In revealed preference studies, the value of safety cannot be measured directly, as people make purchases or employment decisions for various factors in addition to safety. The relative influence of safety in the purchasing or employment decision must be determined through statistical techniques. Stated preference studies evaluate more alternatives than those for which market data are available, but there is no guarantee that an individual would carry out the stated preference when faced with the scenario in real life (U.S. DOT 2016b). The U.S. DOT uses VSL estimates in its analyses to quantify the benefits of preventing or reducing injuries, illnesses, and deaths from regulations. The U.S. DOTâs 2016 VSL was based on nine revealed-preferences studies on employment decisions. The 2016 VSL estimate of $9.6 million represents the average VSL from the nine studies, scaled to 2016 dollars; it is the single nationwide value associated with the prevention of an expected fatality for all population groups. The VSL scaled to 2018 dollars is $10.04 million. Transit and ground transportation workers experienced a fatality rate of 9.9 deaths per 100,000 workers between 2003 and 2006; by comparison, the overall U.S. workforce had a fatality rate of 3.9 deaths per 100,000 workers (CDC 2014). Transit workers have some of the highest rates of nonfatal occupational injury and illnesses associated with lost productivity and job transfers in the United States (BLS 2019b). From 2013 to 2017, an average of 15.6 fatal injuries took place per year among bus service and urban transit workers (NAICS 485, excluding NAICS 4853) (BLS 2018a). Based on the number of fatal injuries and hours worked, the fatal injury rate for 2013â2017 for bus service and urban transit workers per 100,000 FTE workers was 5.24. Applying this fatal injury rate to the transit worker population of 359,669 results in an estimated 18.83 fatalities. Based on the given VSL, the cost of these 18.83 fatalities was $189,174,784 in 2018 dollars. Table 11 presents the calculation of the fatality cost. Table 12 provides the fatality costs of transit workers at the general population fatal injury rate, the excess costs of transit worker fatalities (based on their higher fatality rate), and the fatality cost per transit worker (adjusted to 2018 dollars). For all workers from 2013â2017, the average annual number of fatal injuries was 4,628 and the fatal injury rate per 100,000 FTE workers was 3.54. Applying the âall workersâ injury rate to the transit worker popula- tion results in an estimated 12.74 fatalities per 100,000 workers and a total fatality cost of $128,003,273. Compared to the cost of fatal injuries among general workers, the fatality cost Factor Description Factor Notes Fatalities 15.6 Average number of fatalities among urban transit systems/bus service workers (NAICS 4851 and 4852), 2013â2017 Fatality rate per 100,000 FTE workers 5.24 Fatal injury rate per 100,000 FTE workers based proportionally on the number of fatal injuries from 2013â2017 to total hours worked from 2013â2017 Transit worker population 359,669 Transit worker population based on data from APTA (2018) Estimated fatalities 18.83 Fatality rate divided by 100,000, multiplied by transit worker population VSL $10,043,987 VSL in 2018 dollars Cost of fatalities $189,174,784 Estimated fatalities multiplied by the VSL Sources: BLS (2019b); BLS (2018a); U.S. DOT (2016b); CDC (2014); Hartunian, Smart, and Thompson (1980). Table 11. Estimated cost of fatalities for transit workers using VSL (2018 dollars).
Additional Costs to Individuals, Employers, and Society 39 of transit workers represents an excess cost of $61.17 million. Given the higher prevalence of chronic conditions as discussed in Chapter 4, it also is interesting to consider that post- retirement or industry departure, fatality rates for transit workers might continue to be higher than those of the general public. The U.S. DOT has developed an alternative method to estimate the costs of nonfatal injuries because detailed âwillingness to payâ estimates on the entire spectrum of possible disabilities often are unavailable. Generally, estimates are available for an average injury resulting in a lost workday and not for a range of injuries varying in severity. Per the U.S. DOT, â[e]ach type of accidental injury is rated . . . in comparison with the alternative of perfect health. These scores are grouped according to the Maximum Abbreviated Injury Scale (MAIS), yielding coefficients that can be applied to VSL to assign each injury class a value corresponding to a fraction of a fatalityâ (U.S. DOT 2016a). The MAIS indicates the highest level of injury severity that a patient sustains. Table 13 shows the MAIS levels and corresponding values of injuries prevented, in 2018 dollars. On average, from 2013â2017 the 2,460 injuries in the urban transit system workers sector (NAICS 4851) compare to a base of 1,298 injuries in the general population, following an incident ratio of 3.10/5.87 (see Table 10). The project team could not locate a distribution of injuries focused solely on transit workers; however, because truck drivers encounter some of the same work conditions as transit bus drivers, a usable scale (based on injuries to truck drivers) was found in Decker, Otte, and Muller et al. (2016). Work conditions common to truck drivers and transit workers include sedentary work, sitting upright, and long shifts. Table 13 shows the distribution of truck driver injuries as classified by MAIS level. The distribution of truck driver injuries is skewed more toward minor injuries, corresponding to the lowest level on the MAIS scale. Factor Description Fatality Rate Fatality Cost Fatality Cost per Transit Worker Transit workers (A) * 5.24 $189,174,784 $526 Transit workers at fatality rate of general population (B) 3.54 $128,003,273 $356 Excess cost of transit worker fatalities (A â B) $61,171,511 $170 * See Table 11. Table 12. Fatality costs for transit workers and costs per transit worker (2018 dollars). MAIS Level Fraction of VSL Value Distribution of Truck Driver Injuries by MAIS Total General Population Cost (n = 1,298) Total Transit Worker Cost (n = 2,460) MAIS 1 (minor) 0.003 $30,132 75.68% $29,597,730 $56,094,310 MAIS 2 (moderate) 0.047 $472,067 14.86% $91,083,489 $172,623,562 MAIS 3 (serious) 0.105 $1,054,619 5.41% $73,994,324 $140,235,776 MAIS 4 (severe) 0.266 $2,671,701 1.35% $46,863,072 $88,815,991 MAIS 5 (critical) 0.593 $5,956,084 2.70% $208,945,877 $395,999,120 MAIS 6 (unsurvivable) 1 $10,043,987 0.00% -- -- Total 100.00% $450,484,492 $853,768,760 Urban transit system (NAICS 4851) injuries averaged 2,460 annually from 2013â2017. Based on a ratio of incidence rates of urban transit system workers to all workers, annual injuries for the general population averaged about 1,298. Total cost for each respective population equals the value of injury level, the distribution of injuries by MAIS based on a study of truck driver injuries, and the total number of injuries of the respective population. The value column equals the VSL in 2018 dollars ($10.04 million) multiplied by the fraction of the VSL. Totals reflect rounding (e.g., $853,768,760). Source: U.S. DOT (2016a) Table 13. Estimated cost of injuries to transit workers (2018 dollars).
40 Improving the Health and Safety of Transit Workers with Corresponding Impacts on the Bottom Line As Table 13 shows, the estimated 5-year cost of injuries for transit workers is $853.77 million. The difference in cost for injuries for transit workers, based on their higher rates of injury compared to the general population, is $403.28 million. Table 14 provides the injury cost of transit workers at the general population injury rate, excess costs, and costs per worker. The estimates for fatalities and injuries rely on the use of VSL, which is commonly used in U.S. DOT and U.S. EPA analyses. As this analysis pertained to transit workers, the project team also used the VSL. Studies in the literature with estimates of fatalities and injuries have relied on different methods to calculate estimated costs, some of which are presented in Table 15. For example, estimates of fatality costs are derived using the cost-of-illness method, Factor Average Injury Rate 2013â2017 Injury Cost Injury Cost per Transit Worker Transit workers (A) * 5.87 $853,768,760 $2,374 Transit workers at injury rate of general population (B) 3.10 $450,484,492 $1,252 Excess cost of transit worker (A â B) $403,284,268 $1,121 * See Table 10 and Table 13. Table 14. Injury costs for transit workers and costs per transit worker (2018 dollars). Source Population Estimate (total cost unless otherwise noted) Fatalities NIOSH (2017) All workers in the United States (2010 dollars) 2003: $5.84 billion 2004: $6.16 billion 2005: $6.05 billion 2006: $6.31 billion 2007: $5.65 billion 2008: $5.23 billion 2009: $4.42 billion 2010: $4.63 billion 2003â2010 average cost of fatality: $1.05 million Biddle (2013) Production, transport, and material moving occupation (2006 dollars) 2003â2006: $2.97 billion, 3,238 fatalities 2003â2006 average cost of fatality: $916,000 CDC (2014) Transit and ground transportation (NAICS 485) (2006 dollars) 2003: $54 million, 75 fatalities 2004: $53 million, 80 fatalities 2005: $48 million, 75 fatalities 2006: $50 million, 66 fatalities 2003â2006 average cost of fatality: $692,000 Injuries Leigh (2011) All workers in the United States (2007 dollars) 2007: 8.56 million occupation injuries, $185.84 billion (includes medical costs of $45.95 billion and indirect costs of $139.89 billion) National Safety Council (n.d.) All workers in the United States (2017 dollars) 2017: $161.50 billion (includes wage and productivity losses of $50.7 billion, medical expenses of $34.3 billion, and administrative expenses of $52.0 billion); $39,000 per medically consulted injury Table 15. Estimates of fatality and injury costs found in literature.
Additional Costs to Individuals, Employers, and Society 41 which combines medical expenses and indirect costs such as discounted earnings and the present value of lost household production. Leighâs injury estimates are derived from medical costs and indirect costs including discounted earnings, fringe benefits, and home production (Leigh 2011). National Safety Council estimates of injury costs are based on medical expenses, wage and productivity losses, and administrative costs of insurance (National Safety Council n.d.). Among the studies listed in Table 15, average estimates for the costs of fatalities between 2003 and 2010 ranged from approximately $700,000 to $1,045,000 for the various worker populations, amounts much smaller than the $10.04 million VSL. Similarly, average esti- mates for injury costs from the sources cited in Table 15 are in the tens of thousands, whereas the injury estimates in this research, based on fractions of the VSL, estimated injuries at the lowest level of severity to cost $30,132. 5.3 Cost to Employers and Society 5.3.1 Absenteeism Injuries and chronic illnesses in transit workers can create large eco- nomic losses to workers and employers through reduced workdays and job dis ruptions. When workers are sick, it exacts a cost not only to the indi- vidual but also to the employer (e.g., the transit agency) and the public. To accommodate worker productivity losses, employers may need to add shifts to the existing workforce or hire new workers. These adjustments can come at a cost to employers in terms of lost productivity from diversion of resources to recruit, hire, and train new staff and increased spending for these activities (Blatter, Mühlemann, and Schenker 2012). Employers also must cover the absent workerâs wages and potential overtime for other employees to replace the absent workerâs shifts. Public and private transit workersâ (split between the transit and ground passenger trans- portation and urban transit systems industries) rate of days away from work ranks in the top 10 among the highest rate industries, and is higher than the all-industry incidence rate of 1.0 per 100 full-time workers. BLS data for 2016 listed 26 of the highest rate industries, defined as those with the highest incidence rate of injury and illness cases with days away from work and at least 500 total recordable cases. Table 16 shows the incidence rate per 100 employees for the 10 industries with the highest rates, including Absenteeism is the habitual absence of an employee, which can occur as a result of an illness or injury. For employers, the costs associated with absenteeism include the wages paid to the absent worker, potential overtime paid to other employees, and lost productivity. Industry NAICS Code Incidence Rate per 100 Full-Time Workers All industries, including state and local government 1.0 Nursing and residential care facilities (state government) 623 7.2 Fire protection (local government) 92216 5.2 Police protection (local government) 92212 4.3 Heavy and civil engineering construction (local government) 237 4.2 Scheduled passenger air transportation (private industry) 481,111 4.1 Transit and ground passenger transportation (local government) 485 3.7 Urban transit systems (private industry) 4851 3.6 Correctional institutions (state government) 92214 3.5 Framing contractors (private industry) 23813 3.3 Marine cargo handling (private industry) 48832 3.3 Source: BLS (2019b) Table 16. Highest incidence rates of nonfatal occupational injury and illness cases with days away from work, 2016 (reproduced from BLS).
42 Improving the Health and Safety of Transit Workers with Corresponding Impacts on the Bottom Line transit and ground passenger transportation (ranked sixth) and urban transit systems (ranked seventh), as found by the BLS. Table 17 shows how the incidence rate of cases with days away from work compares to the total amount of wages lost based on the assumption that the employer must pay someone in the same wage category to fill the shift. Compared to employers in some other industries, transit employers cannot go as easily without a transit workerâs services for a day. Often the employer is required to replace the worker on his or her operating or maintenance shift. The cost estimate of absenteeism per worker is the product of the total hourly compensa- tion, the lost worktime rate, and the annual number of hours worked per year for an FTE posi- tion. The total hourly compensation is the product of the mean hourly wage and a loaded wage factor that accounts for non-wage benefits provided to employees. In this estimate, the mean hourly wage is the weighted average of the means for urban transit system workers and inter- urban and rural bus transportation workers (NAICS 4851 and 4852) in 2018 dollars, or $20.46. The loaded wage factor of 1.42 is the average for years 2014â2018 for the trade, transportation, and utilities industry and is based on the ratio of total compensation to wages and salaries. The lost worktime rate is a percentage of the hours absent out of the hours usually worked, which for the transportation and warehousing industry averaged 1.50% from 2014â2018 (BLS 2018b). Annual compensation lost per worker is multiplied by the transit worker population of 359,669, resulting in the total cost of absenteeism. These calculations are shown in Table 17. Table 17 shows that the total costs for transit workers during this period amounted to approximately $314 million, based on the calculation of lost wages based on the mean hourly wage, a loaded wage factor representing benefits paid by the employer on top of wages paid to the employee, and working 2,000 hours annually. The 1.5% average lost worktime rate for transit workers exceeds the 1.38% average lost worktime rate for the general population. Consequently, the estimated total cost and total cost per transit worker also are greater than the costs for the general population. As Table 18 shows, using the same calculation at the lower lost worktime rate for the general population (rounded to 1.4%) results in total costs of about $289 million. Table 18 shows the difference in injury-related costs attributable to Factor Description Factor Notes Mean hourly wage $20.46 2018 dollars; weighted average of the mean hourly wages for urban transit systems workers (NAICS 4851) and interurban and rural bus transportation workers (NAICS 4852) Loaded wage factor 1.42 Average ratio of total compensation to wages and salaries for private-industry trade, transportation, and utility workers, as provided by 2014â2018 employer cost for employee compensation data from the BLS Lost worktime rate a 1.5% Lost worktime rate, defined as hours absent as a percentage of hours usually worked, based on 50 work weeks at 40 hours per week (one FTE position); 1.5% is the average lost worktime rate for transportation and warehousing workers from 2014â2018 Employer cost for lost compensation (hourly) $0.44 Product of the mean hourly wage, loaded wage factor, and lost worktime rate Annual compensation lost per transit worker $874 Product of hourly lost compensation and the number of hours worked annually, based on 2,000 hours (one FTE position) Absenteeism cost $314,301,144 2018 dollars; annual compensation lost per transit worker multiplied by the transit worker population of 359,669 a BLS (2018b) Table 17. Estimation of total wages lost annually from absenteeism due to injury/illness for transit workers, 2014â2018 (2018 dollars).
Additional Costs to Individuals, Employers, and Society 43 lost worktime for transit workers at the rate estimated for transit workers (1.5%) and at the rate estimated for general workers (1.4%). The difference reveals the excess costs that can be attributed to the higher rate of lost worktime among transit workers. As Table 18 shows, when based on the lost worktime rate of the general population (1.4%), the estimated total costs of absenteeism for transit workers exceeded the costs of absenteeism for the same population of general workers by $25.14 million. This translates to an estimated excess cost of $70 per transit worker compared to the average worker. For some perspective on the number of days that individual illnesses contribute to absen- teeism, a study by Asay, Roy, Lang, Payne, and Howard (2016) used MEPS and MarketScan data to show how four major chronic conditions/risk factorsâhypertension, diabetes, obesity, and smokingâcontributed to absenteeism. Table 19 reproduces the data from the study without calculations or adjustments. As illustrated in Table 19, workers with hypertension, diabetes, or obesity miss on average 1 day more of work per year than do workers without these conditions. Workers who currently smoke miss half a day more of work. The costs per employee associated with absenteeism appear to vary by condition. The cost of absenteeism per employee attributed to hypertension is nearly twice that of the cost of absenteeism attributed to smoking. Additionally, absenteeism associated with obesity appears to have higher costs at a national level in comparison to the other three conditions. Given that an estimated 10% of transportation workers have diabetes and nearly one-third of transportation workers have obesity and are currently smoking, these findings suggest that efforts to help transit workers decrease their risk of disease may have important implications for worker productivity and employer costs. Absenteeism estimates from other studies, presented in Table 20, indicate that the project teamâs estimate for absenteeism was conservative. Stewart, Ricci, Chee, and Morganstein Factor Lost Worktime Rate Injury Cost Injury Cost per Transit Worker Transit workers at lost worktime rate of transit workers (A) * 1.5% $314,301,144 $874 Transit workers at lost worktime rate of general population (B) 1.4% $289,157,053 $804 Excess cost of transit worker absenteeism (A â B) $25,144,091 $70 * See Table 17. Table 18. Estimated excess absenteeism costs for transit workers compared to the general population of workers, 2014â2018 (2018 dollars). Chronic Condition/ Risk Factor Number of Excess Missed Work Days (number of days/year relative to workers without conditions/risk factors) a Estimated Cost to Employer per Employee per Yearb Total Cost per Year (billions) Hypertension 1.13 (95% CI: 0.84, 1.42) $298 $10.3 Diabetes 1.03 (95% CI: 0.63, 1.42) $272 $2.2 Obesity 1.02 (95% CI: 0.70, 1.33) $269 $11.2 Smoking 0.58 (95% CI: 0.25, 0.92) $153 $3.6 a Data from MarketScan and the MEPS. For consistency across other findings, estimates based on MEPS by single condition or risk factor. b Assumes an average employment cost of $33.00 per hour and an 8-hour work day (in 2015 dollars). Source: Reproduced from Asay, Roy, Lang, Payne, and Howard (2016) Table 19. Absenteeism and related cost estimates for chronic conditions or risk factors for U.S. workers aged 18â64 years, 2008â2011 (2015 dollars).
44 Improving the Health and Safety of Transit Workers with Corresponding Impacts on the Bottom Line (2002) estimated health-related lost productive time due to absenteeism and presenteeism cost employers $225.8 billion in 2012, or $1,685 per employee annually. Other studies have estimated an absenteeism cost of at least $260 billion in terms of wages, benefits, and oppor- tunity costs (Integrated Benefits Institute n.d.) and calculated absenteeism costs of $2,660 per shift worker per year (Circadian n.d.). Statistics from 2017 recorded the urban transit systems industry as having one of the highest incidence rates of occupational injuries and illness cases with days away from work, with a median of 25 days away from work compared to a median of 8 days for all industries (BLS 2017c). 5.3.2 Workersâ Compensation Workersâ compensation provides wage replacement and medical benefits to workers that have suffered injuries or illnesses directly as a result of their employment. In return for benefits, recipients waive their right to sue their employer for negligence. Unlike disability, which requires a longer employment history, workersâ compensation is available to an employee from the first day of his or her employment. Workersâ compensation covers medical care from the injury or illness, replacement income, costs for retraining, compensation for any permanent injuries, and benefits to survivors of workers who are killed on the job. Workersâ compensation pays 100% of injury-related medical costs for injured workers. Wage replacement rates vary by state but are, on average, approximately two-thirds of a workerâs pre-injury gross wage. As was noted in Chapter 4, the MEPS data used for estimates and calculations in this report do not indicate which expenditures are covered by workersâ compensation. Workersâ compensation is financed exclusively by employers except in three states (Washington State, Oregon, and New Mexico) where workers pay part of the cost of workersâ compen sation benefits and services directly through payroll deductions or charges. Typically, employers purchase workersâ compensation insurance from private insurers or a state insurance fund, although large employers may choose to self-insure (National Academy of Social Insurance 2018). Workersâ compensation costs are estimated using two methods wherein the results provide a range for the estimate. The first method is based on the workersâ compensation premiums Source Description of Estimate Notes Stewart, Ricci, Chee, and Morganstein (2002) Lost productive time due to absenteeism and âpresenteeismâ (health-related reduced performance on days at work) ⢠Health-related lost productive time in 2002 cost employers $225.8 billion, or $1,685 per employee; ⢠For the transportation and moving occupation (SOC 53), the total cost was $12.0 billion. Integrated Benefits Institute (n.d.) Absenteeism costs (involving wages and benefits, missed revenues, costs of hiring substitutes, and overtime costs) ⢠Of the $530 billion estimated annual cost to U.S. employers due to poor health, at least $260 billion is due to absences (including $178 billion in wages and benefits and $82 billion in opportunity costs, such as missed revenues, costs of hiring substitutes, and overtime). Circadian (n.d.) Absenteeism costs (per worker) ⢠Absenteeism costs employers $2,660 per shift worker annually, in 2014 dollars. BLS (2017c) Incidence rate of nonfatal occupational injury and illness cases with days away from work, 2017, per 100 FTE workers ⢠The listed rate of absenteeism for urban transit systems (NAICS 4851) is one of the highest (2.9), contrasting with the incidence rate for âall industriesâ (1.0). ⢠The 1,320 cases with days away from work resulted in a median number of 25 days away from work. Table 20. Absenteeism cost estimates found in relevant literature. Workersâ compensation provides wage replacement and medical benefits to workers that have suffered injuries or illnesses directly as a result of employment.
Additional Costs to Individuals, Employers, and Society 45 paid by employers. Using the premium method, the cost of workersâ compensation is calcu- lated as the product of the mean hourly wage (weighted average of the mean hourly wage for urban transit systems and interurban and rural bus transportation workers), loaded wage factor (ratio of total compensation to wages and salaries), average workersâ compensation cost as a percentage of total compensation, annual hours, and the transit worker population. This results in a workersâ compensation cost to employers of $413,826,181 annually. Using quarterly historical data from BLS, from 2014â2018, the average proportion of workersâ compensation cost to total hourly compensation for trade, transport, and utility workers was 2.0% (BLS n.d.). The project team assumed that this same ratio would apply to transit workers. Table 21 provides the results of this analysis. For all private industry workers, the average proportion of workersâ compensation cost to total hourly compensation from 2014â2018 was 1.4% (BLS n.d.). Accounting for the lower general populationâs workersâ compensation as a percentage of total compensation results in an estimated cost of $292,686,289 for the general population and an excess cost of $121,139,893 for the transit worker population. Table 22 displays a summary of the costs of workersâ compensation, the excess costs for transit workers, and the costs per transit worker as estimated using the premium method. Factor Description Factor for Transit Workers Notes Mean hourly wage $20.46 Weighted average of the mean hourly wages for urban transit systems workers (NAICS 4851) and interurban and rural bus transportation workers (NAICS 4852) Loaded wage factor 1.42 Average ratio of total compensation to wages and salaries for private-industry trade, transportation, and utility workers, as provided by years 2014â2018 employer cost for employee compensation data from the BLS Workers' compensation as a percentage of total compensation 2.0% Average ratio from 2014â2018 of workersâ compensation cost per hour to employers over total compensation for trade, transport, and utility workers Annual hours per FTE worker 2,000 Based on 50 weeks per year and a 40-hour workweek Workers' compensation cost $413,826,181 Product of mean hourly wage, loaded wage factor, workers' compensation as a percentage of the total compensation, annual hours worked per worker, and transit worker population of 359,669 (APTA 2018) Table 21. Estimation of workersâ compensation costs based on employersâ premiums (2018 dollars). Factor Description Workersâ Compensation as a Percentage of Total Compensation Workersâ Compensation Cost Cost per Transit Worker Transit workers (A)* 2.0% $413,826,181 $1,151 Transit workers at workersâ compensation percentage to total compensation of general population (B) 1.4% $292,686,289 $814 Excess cost of transit worker (A â B) $121,139,892 $337 * See Table 21. Table 22. Estimation of workersâ compensation costs for transit workers and costs per transit worker using the premium method (2018 dollars).
46 Improving the Health and Safety of Transit Workers with Corresponding Impacts on the Bottom Line The second method estimates workersâ compensation costs through ben- eficiary claims. Using Washington State Fund claims data. From 2002â2010, the urban transit systems and inter urban and rural bus transportation industries (NAICS codes 4851 and 4852) had a claim rate of 411.5 per 10,000 FTE positions (Anderson, Bonauto, and Adams 2014). Assuming that the population of transit workers in Washington State exhibits similar char- acteristics to the transit worker population nationwide and that regulatory conditions are similar, applying that claim rate to the transit worker popu- lation of 359,669 (APTA 2018) would result in 14,799 workersâ compensa- tion claims. For the Washington State Fund, the average incurred cost for claims among the transit and intercity bus drivers SOC code for fiscal years 2014â2018, adjusted to 2018 dollars, was $17,689 per claim (Washington State Department of Labor & Industries n.d.). By comparison, in Des Moines, IA, the average incurred costs for claims among fixed-route operators, maintenance employees, and para- transit operators was $10,867 from August 21, 2014, to July 3, 2018. Fiscal years 2014â2018 were selected to provide the 5 most recent years of claims data. Washington State Fund claims data lists occupations by SOC 2000, without listing the numeric code of the occupation. The project team was unable to match the claims data occu- pations with the numeric SOC 2000 code for the transportation worker occupations; thus, only the transit and intercity bus driver injuries were included in the calculation of the average incurred claim cost. The product of the average cost per claim and the estimated number of claims results in a workersâ compensation claims cost of $261,780,645. Table 23 describes these calculations further. Washington State Fund data from 2002â2010 indicate that the workersâ compensation claim rate for all workers was 191.1 per 10,000 FTE positions (Anderson, Bonauto, & Adams, 2014). Applying the all workers claim rate to the transit worker population would result in 6,873 workersâ compensation claims and an estimated claims cost of $121,581,613. Table 24 displays a sum- mary of the costs of workersâ compensation, the excess costs for transit workers, and the cost per transit worker using the claims method. Table 25 summarizes the costs of workersâ compensation for transit workers and the general population through the estimation of employersâ premiums and claim costs, as presented in Table 22 and Table 24. Musculoskeletal disorders were the most common injury type in the Washington State Fund from 2002â2010, making up 108,225 of the total 267,420 injuries. Factor Description Factor for Transit Workers Notes Claim rate per 10,000 FTE positions 411.5 Transit worker claim rate based on weighted average from Washington State Fund data on NAICS codes 4851, Urban Transit Systems (106 claims and 5,370 FTE positions), and 4852, Interurban and Rural Bus Transportation (655 claims and 13,125 FTE positions) Estimated annual claims 14,799 Number of estimated claims equals the product of the claim rate and transit worker population of 359,669 (APTA 2018), divided by 10,000 Average claim cost $17,689 Average cost of all transit and intercity bus driver claims from fiscal years 2014â2018 for Washington State Total annual workersâ compensation cost $261,780,645 Product of estimated claims and the average claim cost Table 23. Estimation of costs based on workersâ compensation claims (2018 dollars).
Additional Costs to Individuals, Employers, and Society 47 5.3.3 Federal Disability Programs Workers whose illnesses prevent their full participation in the workforce may become eligible for safety net programs. Two of the larger federal programs covering disability benefits are SSDI and SSI. 5.3.3.1 SSDI SSDI provides benefits for persons who are totally disabled, which is defined as the inability to engage in âsubstantial gainful activityâ due to any medically determined physical or mental health impairment that is either expected to result in death or has lasted or can be expected to last continuously for no less than 12 months. Funded as an insurance program through workersâ contributions to the social security trust fund (via âFICAâ payments that are deducted from workersâ paychecks), SSDI benefits also apply to individuals who are age 55, blind, and unable to carry on gainful activity, and may be granted to eligible dependents (SSA 2017; SSA n.d.-a; SSA n.d.-b). SSDI benefits are available to workers whether or not their disability is associated with a work-related injury, but SSDI benefits are not payable for partial or for short-term disability (SSA 2017). 5.3.3.2 SSI SSI provides cash assistance to persons (including children) who are aged, blind, or disabled and who have little or no income or resources to meet necessities (SSA n.d.-b; SSA n.d.-c). SSI is funded by the federal government using general tax revenues. Some states also fund their own supplemental assistance programs. Eligible persons may receive assistance from state and federal SSI programs either separately or as a combined amount, and some eligible persons may receive both SSDI benefits and SSI assistance (SSA n.d.-b). Factor Description Workersâ Compensation Claim Rate per 10,000 FTE Positions Workersâ Compensation Cost Workersâ Compensation Cost per Transit Worker Transit workers (A) * 411.5 $261,780,645 $728 Transit workers at workersâ compensation claim rate of general population (B) 191.1 $121,581,613 $338 Excess cost of transit worker (A â B) $140,199,032 $390 * See Table 23. Table 24. Estimation of workersâ compensation costs for transit workers and costs per transit worker using the premium method (2018 dollars). Estimated Costs Premium Estimation Method Claims Estimation Method Transit worker cost $413,826,181 $261,780,645 General population cost $292,686,289 $121,581,613 Excess cost of transit workers $121,139,892 $140,199,032 Transit worker cost per transit worker $1,151 $728 General population cost per transit worker $814 $338 Excess cost per transit worker $337 $390 Table 25. Summary of workersâ compensation costs by estimation method (2018 dollars). Social Security Disability Insurance (SSDI) provides benefits for total disability. A worker who is totally disabled is unable to continue or return to the work he or she did before the onset of a medically determined physical or mental health impairment, and is unable to adjust to other work because of the medical condition (SSA n.d.-a). The Supplemental Security Income Program (SSI) provides cash assistance to persons who are aged, blind, or disabled and who have little or no income or resources to meet necessities. Some states also operate SSI programs. Eligible persons may receive both state and federal SSI assistance, and some persons may qualify to receive both SSDI benefits and SSI assistance (SSA n.d.-b).
48 Improving the Health and Safety of Transit Workers with Corresponding Impacts on the Bottom Line 5.3.3.3 Estimating Costs for SSDI and SSI Estimates for the costs of SSDI and SSI were calculated separately, but a similar method was used for both, and the results were similar. To determine the cost of SSDI, the project team estimated the percentage of recipients who were or had been in the transit worker industry and multiplied that population by the average annual benefit. Based on 2018 data from the National Beneficiary Survey, 9.9% of SSDI beneficiaries and 6.0% of SSDI beneficiaries who also received SSI assistance had been employed in the trans- portation and material moving occupation (SSA 2018a). Taking a weighted average of these percentages, the project team determined that 0.090666 (about 9.1%) of SSDI recipients had been employed in the transportation and material moving occupation. To further restrict the SSDI population in the transportation and material moving occupation, the project team then took a ratio of the size of the transit worker population relative to the transit and material moving population. As of May 2017, total employment in the transit and material moving population was 9,978,390 million, compared to a transit worker population of 359,669 (APTA 2018). Applying the ratio (359,669/9,978,390, or 0.036045) to calculate the subset of SSDI recipients belonging to the transit worker population yielded 28,148 workers (rounded), which was then multiplied by the average yearly benefit. The average yearly benefit is simply the monthly benefit for disabled workers ($1,201.30 in 2018) multiplied by 12, or $14,415.60 (SSA 2018c). The calculations can be shown as: = Average monthly SSDI beneficiaries = 8,613,167 à proportion of SSDI beneficiaries in the transportation and material moving occupation à 0.090666 (rounded) à ratio of transit worker population to the transportation and material moving population à 359,669/9,978,390 (a ratio of 0.036045, which yields 28,148 recipients) à average monthly benefit à 12 à $1,201.30 à 12 ($14,415.60) = estimated annual cost (number of workers à annual cost) = $405,770,309 (rounded) * Rounding decisions at each step can affect the final number, but for purposes of estimation the differences are fairly minor. In estimating the SSDI costs, the numbers used in the final step of the calculation used by the project were 28,148 à $14,415.60 = $405,770,309. Estimated annual cost of SSDI (transit workers) in 2018* To arrive at an estimated annual cost of SSI among recipients who had been transit workers (number of recipients à annual cost of SSI per recipient), several calculations were necessary. First, the project team estimated the percentage of recipients who had been employed in the transit worker industry. According to the 2018 National Beneficiary Survey data, 7.1% of SSI recipients and 6.0% of combined SSDI/SSI recipients had been employed in the transpor- tation and material moving occupation (SSA 2018a). Taking a weighted average of these percentages determined that 0.066620% (about 6.7%) of SSI recipients had been employed in the transportation and material moving occupation. This percentage was roughly in line with the proportion of transportation and material moving employment in the total workforce in 2018. The project team then estimated the proportion of SSI recipients in the transportation and material moving occupation who had been transit workers. This was done by multiplying it by the ratio of the transit worker population to the transit and material moving population (359,669/9,978,390, or 0.036045). The resulting subset of SSI recipients, rounded to the nearest whole number, was then multiplied by the average annual benefit. The average monthly SSI benefit in 2018 for blind and disabled recipients was $571.01, making the annual benefit $6,852,12 (SSA 2018b). Using the data from the 2018 National Beneficiary Survey, the calculations can be shown as:
Additional Costs to Individuals, Employers, and Society 49 * Rounding decisions at each step can affect the final number, but for purposes of estimation the differences are fairly minor. In estimating the SSI costs, the numbers used in the final step of the calculation used by the project were 16,818 à $6,852.12 = $115,238,954. = Average monthly SSI recipients = 7,003,750 à proportion of SSI recipients in the transportation and material moving occupation à 0.066620 (rounded) à ratio of transit worker population to transportation and material moving population à 359,669/9,978,390 (a ratio of 0.036045, which yields 16,818 recipients) à average monthly benefit à 12 à $571.01 à 12 ($6,852.12) = estimated annual cost (number of workers à annual cost) = $115,238,954 (rounded) Estimated annual cost of SSI (transit workers) in 2018* 5.3.3.4 Medicare Persons under the age of 65 are eligible for Medicare coverage after 24 consecutive months of receiving SSDI. Persons under age 65 who have been diagnosed with end-stage renal disease or amyotrophic lateral sclerosis do not have to undergo the 24-month waiting period to qualify for Medicare (Cubanski, Neuman, and Damico 2016). Medicare recipients under age 65 qualifying through disability can enroll in hospital and medical insurance and prescription drug coverage (Parts A, B, and D). Like SSDI, Medicare pays benefits whether or not the injury is work-related. To calculate the Medicare costs attributed to the transit worker population, the project team assumed that the proportion of Medicare beneficiaries under age 65 who had been transit workers was the same as the proportion of transit workers to the total workforce. According to the U.S. Department of Health and Human Services, in 2016 the average monthly number of disabled Medicare beneficiaries equaled 9 million people. The project team adjusted this number to reflect the number of beneficiaries who had been transit workers, then multiplied this figure by the average Medicare costs per capita. A 2016 study pub- lished by the Henry J. Kaiser Family Foundation showed that costs associated with Medicare beneficiaries under age 65 were higher than those for beneficiaries over age 65 (Cubanski, Neuman, and Damico 2016). According to Cubanski, Neuman, and Damico, per capita Medicare spending for the under-65 group in 2014 was $13,098, whereas per capita spending for the 65-and-over group was $9,972. Adjusting the 2014 dollars to 2018 dollars, the per capita annual Medicare spending for beneficiaries under age 65 was about $13,893. Applying the data from the Kaiser Foundation study, the resulting estimate of the Medicare costs that could be attributed to transit workers was calculated as $315,484,742, using the following formula: * Rounding decisions at each step can affect the final number, but for purposes of estimation the differences are fairly minor. In estimating the Medicare costs, the numbers used in the final step of the calculation used by the project were 22,708 à $13,893.11 = $315,485,742. = Population of Medicare beneficiaries under age 65 = 9,000,000 à proportion of transit workers in the total workforce (assumed the same for disabled workers) à 359,669/142,549,250 (a ratio of 0.002523, which yields 22,708 beneficiaries [rounded]) à annual per capita spending on Medicare beneficiaries under age 65 à $13,893.11 = estimated annual cost (number of workers à annual cost) = $315,484,742 (rounded) Estimated annual cost of Medicare (transit workers, adjusted to 2018 dollars)* Medicare is the federal program that provides hospital and medical insurance for people age 65 and older. Medicare also is available to persons with disabilities under age 65 under certain conditions. Source: Centers for Medicare and Medicaid Services
50 Improving the Health and Safety of Transit Workers with Corresponding Impacts on the Bottom Line To calculate excess and general population disability costs, the disability prevalence ratios of transit workers were compared to those of the general population. Statistics from the U.S. Department of Labor in 2012 projected that bus drivers and subway, streetcar, and other rail transportation worker occupations experienced disability prevalence rates of 8.1% and 5.9%, respectively (or a weighted average of 8.0%). The disability prevalence among all occupa- tions was 5.5% (U.S. Department of Labor n.d.). Using the ratio of 5.5% to 8.0% to determine the number of disability assistance beneficiaries under an all-occupations disability preva- lence rate, the project team developed cost projections for the general population. The ratio of 5.5% to 8.0% was an added term to be multiplied for each of the cost equations for SSDI, SSI, and Medicare. For example, the cost of Medicare for the general population was calculated by multiplying the number of Medicare beneficiaries under age 65, the proportion of transit workers to the total workforce, the ratio of 5.5% to 8.0% (rounded to the nearest whole number, or beneficiary), and the per capita spending on Medicare beneficiaries under age 65. Similarly, the annual cost of SSDI or SSI for the general population was calculated by multiplying the SSDI or SSI beneficiary population, the proportion of beneficiaries in the transportation and material moving occupation, the ratio of the transit worker population to the transporta- tion and material moving population, the ratio of 5.5% to 8.0% (rounded to the nearest whole number, or beneficiary), the average monthly benefit, and 12. Table 26 provides a summary of the disability costs and the cost per transit worker. The excess costs calculated for transit workers likely understate the total payments to transit workers with disabilities, given that transit workers are more prone to illness and injury. (Table 10 showed that the incidence rate for nonfatal occupational injuries was 5.9 per 100 full-time workers for urban transit systems.) The kinds of health conditions associated with disability also are frequently associated with transit workers. For example, nearly three- quarters of persons filing claims for disability benefits in 2016 had a primary diagnosis of a disease of the musculoskeletal system and connective tissue (SSA 2017). Table 27, which reflects statistics for 2016 from SSA, displays the numbers and percentage of disabled workers receiving SSDI by diagnostic group without adjustments. As shown in Table 27, in 2016 more than one-quarter of disabled workers had an eligible disability related to mental health, and nearly one-third of disabled workers had an eligible Factor SSDI SSI Medicare Notes Transit workers cost (A) $405,770,309 $115,238,954 $315,484,742 Calculated costs of SSDI, SSI, and Medicare for transit workers in 2018 dollars Transit worker cost at disability rate of general population (B) $277,428,222 $78,792,988 $215,704,439 Uses the disability prevalence ratios of all occupations to public transit workers (5.5 to 8.1%) to estimate disability beneficiaries under the all occupations rate of 5.5% Excess cost of transit workers $128,342,087 $36,445,966 $99,780,303 (A â B) Cost per transit worker $1,128 $320 $877 (A) divided by transit worker population of 359,669 Cost at disability rate of the general population per transit worker $771 $219 $600 (B) divided by transit worker population of 359,669 Excess cost per transit worker $357 $101 $277 (A â B) divided by transit worker population of 359,669 Table 26. Disability costs for the transit worker population and general population (2018 dollars).
Additional Costs to Individuals, Employers, and Society 51 disability related to the musculoskeletal system and connective tissue. Given the prevalence of mental health and musculoskeletal disorders in transit workers, these findings illustrate the potential societal impacts related to federal resources. 5.4 Additional Costs to Society In addition to the disability and Medicare payments associated with the health conditions and risks of transit workers, some costs are qualitative, unquantifiable, or simply more difficult to quantify. Unquantifiable costs include costs to commuters and other travelers on the transit system. Inferior service that leads to delays and irregularities in the schedule will cost travelers in terms of the value of their time. If travelers switch to alternative methods of travel, revenues for the transit system or mode will be affected. Lower revenues can reinforce a cycle of inferior service, as fewer resources will be available to allocate toward workers and infrastructure improvements, particularly in the face of decreasing ridership. Another cost not quantified in this chapter is the cost to families. A 2012 study by Asfaw, Pana-Cryan, and Bushnell found that among families of workersâ compensation recipients, the odds of another family member being hospitalized were 31% higher in the 3 months after the occupational injury than in the 3 months that preceded the injury. If the workerâs occu- pational injury was severe, the odds for family members were 56% higher in the 3 months after the injury. Occupational injuries can diminish family income, cause family members to undertake greater physical burdens to care for the injured family member, and trigger psychological stress (Asfaw, Pana-Cryan, and Bushnell 2012). Other costs not quantified in this chapter include fatalities and injuries to those outside the transit vehicles (e.g., on the road, rail, or in other vehicles). Costs related to turnover include safety costs due to inexperienced drivers and training costs when transit workers are absent due to illness or injury, are disabled, or seek early retirement. 5.5 Conclusions The purpose of this chapter was to present monetized estimates of the costs due to the health risks and conditions faced by transit workers and to highlight areas for transit workers and agencies where costs are elevated. For example, health and wellness programs may improve the health conditions of workers, thus reducing costs across multiple categories. Further improvements in on-the-job safety may decrease disability and injury costs. Estimates have been provided to better understand the health costs of transit workers that are paid by employers, society, and individuals in terms of injury and mortality costs. The costs estimated Diagnostic Group Number and Percentage of Disabled Workers Circulatory system 716,119 (8.1%) Endocrine, nutritional, and metabolic diseases (e.g., diabetes) 269,065 (3.1%) Injuries 337,772 (3.8%) Mental health (nonintellectual disability) 2,315,807 (26.3%) Musculoskeletal system and connective tissue 2,342,133 (32.3%) Respiratory system 243,896 (2.8%) Source: Reproduced from SSA (2017) Table 27. Disabled worker recipients of SSDI by diagnostic group, 2016.
52 Improving the Health and Safety of Transit Workers with Corresponding Impacts on the Bottom Line in this chapter are not an exhaustive list of employer and societal costs, and many additional costs cannot be itemized, such as quality of service. Costs presented are not additive, and the cost categories overlap. Table 28 compiles the estimates that were computed in this chapter. Cost estimates ranged from $115 million on the low end for SSI to $854 million on the high end for injury costs. For each category, the cost attributed to transit workers exceeded that of the general popu lation because the transit worker population had higher incidence rates, claim rates, or disability prevalence. Table 28. Compilation of cost estimates (2018 dollars). Cost Category Transit Worker Cost Cost per Transit Worker Excess Cost Excess Cost per Transit Worker Workers Injury Costs $853,768,760 $2,374 $403,284,268 $1,121 Mortality Costs $189,174,784 $526 $61,171,511 $170 Employers and Society Absenteeism $314,301,144 $874 $25,144,092 $70 Workersâ Compensation $261,780,645â $413,826,181 $728â$1,151 $121,139,893â $140,199,032 $337â$390 Disability (SSDI) $405,770,309 $1,128 $128,342,087 $357 Disability (SSI) $115,238,954 $320 $36,445,966 $101 Medicare $315,484,742 $877 $99,780,303 $277
