
some period of time, productivity gains will be achieved at a lower capital intensity in the United States than experience in other countries suggests is required. The board believes that this is a temporary phenomenon. In the long term, continuation of the U.S. investment lag behind most of the industrial world will be accompanied by further declines in the rates of productivity growth, with negative consequences for both standards of living and employment.
Although their measurement is less well advanced, intangible investments —workforce training, research and development, market development, advertising, and various other corporate activities—contribute to growth by creating a more flexible workforce, new products and process improvements, and new markets. Expanding established companies’ portfolios of products and markets and fostering new enterprises is especially important when the dominant firms are having to shrink the costs of traditional lines of business to remain competitive or increase market share. This broadening of the business base, not productivity growth alone, is needed to ensure a high rate of job creation. Because intangibles combine front-loaded costs with uncertain future returns, they are difficult to collateralize and therefore are less appropriately financed with debt. This makes them highly sensitive to fluctuations in the cost of equity capital, as we describe below.
HISTORICAL AND COMPARATIVE PERFORMANCE
The slowdown in U.S. growth is evident in a comparison of industrial countries’ growth in per capita real GDPs over a 30-year period adjusted for purchasing power parity (Table 1). There is undoubtedly some truth in the proposition that other countries are simply catching up, a natural and expected phenomenon of international economics after World War II. Indeed, growth rates converged in the 1970s and early 1980s. In the late 1980s and early 1990s, however, growth rates diverged, a reversal not expected if the post-war catch-up process were simply being completed. The decline in the U.S. growth rate is undoubtedly related to the decline in U.S. investment rate in plant and equipment and intangibles.
U.S. saving, inadequate for several years, continues to decline. As Table 2 shows, net national saving (the sum of personal and corporate saving and any government budget surplus) fell to 1.4 percent of GDP in 1993 after a continuous slide from 5 percent to nearly 8 percent of GDP in the 1960s and 1970s. In 1992, net saving (0.7 percent of GDP) was
TABLE 1 Real Growth Rate in Per Capita GDP at Purchasing Power Parity (Percent)
|
1960-1970 |
1970-1980 |
1980-1985 |
1985-1992 |
|
|
United States |
2.5 |
1.6 |
1.6 |
1.2 |
|
Japan |
8.9 |
3.2 |
3.0 |
3.5 |
|
Germany |
3.4 |
2.5 |
1.3 |
2.4 |
|
France |
4.4 |
2.6 |
1.0 |
1.9 |
|
United Kingdom |
2.2 |
1.8 |
1.9 |
1.6 |
SOURCE: Organization for Economic Cooperation and Development (OECD),National Accounts Annual.
nearly 3 percentage points below the level of 1982, at the bottom of one of the deepest post-war recessions. Table 3 compares net national saving in the United States with that of other industrialized nations. The U.S. rates have always been the lowest, but in the late 1980s and early 1990s the gap between the United States and Japan and Germany increased.
The pattern of a low and declining rate of saving is repeated in the rate of investment. Nonresidential fixed investment is shown in Table 4. The 1992 rate of U.S. plant and equipment investment hit a 30-year low of 9.2 percent of GDP (see Table 2), all but 1 percent of which represents depreciation (the rate at which productive capital wears out or is retired from service). In 1993 it grew only slightly, to 9.8 percent of GDP.
Although reliable comparative data on private intangible investments other than research and development (R&D) are lacking, on the basis of anecdotal evidence and from its understanding of characteristic methods of financing different kinds of investment, the board believes it likely that the decline in U.S. corporate intangible investments has exhibited a similar pattern, although not uniform across industries or firms. The decline of U.S. business expenditures on R&D as a share of GDP in the late 1980s and its plateau in the early 1990s are consistent with this observation (Table 5), although it should be emphasized that R&D represents a small part of intangible private investments.
Generally accepted accounting rules require that most intangible investments made to develop new markets be reported as expenses rather than as investment. These expenses, therefore, reduce reported earnings even though they do not pertain primarily to a company’s current operations. Thus, companies desiring to show higher reported earnings may choose to forego intangible investments that will produce returns some
TABLE 2 U.S. Savings and Investment (Percent of GDP)
|
Net Pers. Sav. |
Plus: Corp. Sav. |
Plus: Govt. Sav. |
Equals Net Nat’l Sav. |
Plus: Forgn. Sav. |
Plus Statist. Descrip. |
Equals: Net Domes. Invest. |
Plus Deprec. |
Equals: Gross Domes. Invest.a |
Of Which Plant & Equip. Was |
|
|
1960-1964 |
4.4 |
3.4 |
(0.1) |
7.8 |
(0.8) |
(0.3) |
6.6 |
8.6 |
15.2 |
9.3 |
|
1965-1969 |
4.9 |
3.6 |
(0.2) |
8.3 |
(0.4) |
0.0 |
7.9 |
8.2 |
16.1 |
10.5 |
|
1970-1974 |
5.9 |
2.3 |
(0.5) |
7.7 |
(0.3) |
0.1 |
7.5 |
9.0 |
16.5 |
10.7 |
|
1975-1979 |
5.0 |
2.8 |
(1.1) |
6.8 |
(0.1) |
0.5 |
7.1 |
10.4 |
17.6 |
11.6 |
|
1980-1984 |
5.8 |
1.4 |
(2.6) |
4.6 |
0.7 |
0.1 |
5.3 |
11.9 |
17.2 |
12.6 |
|
1985-1989 |
3.6 |
1.9 |
(2.4) |
3.0 |
2.7 |
(0.3) |
5.5 |
11.1 |
16.5 |
11.3 |
|
1990 |
3.2 |
1.4 |
(2.5) |
2.1 |
1.4 |
0.1 |
3.6 |
10.9 |
14.5 |
10.5 |
|
1991 |
3.5 |
1.3 |
(3.4) |
1.4 |
(0.2) |
0.4 |
1.7 |
11.0 |
12.7 |
9.5 |
|
1992 |
3.6 |
1.8 |
(4.7) |
0.7 |
0.8 |
0.6 |
2.1 |
11.0 |
13.1 |
9.2 |
|
1993 |
3.0 |
1.9 |
(3.5) |
1.4 |
1.5 |
0.2 |
3.1 |
10.9 |
14.0 |
9.8 |
|
aGross domestic investment includes investment in residential structures, changes in inventories, and plant and equipment investment. |
||||||||||
|
SOURCE: Bureau of Economic Analysis, U.S. Department of Commerce.Data for 1992 and 1993 are from the March 1994 Survey of Current Business. |
||||||||||
TABLE 3 Net National Savings (Percent of GDP)
|
United Statesa |
Japan |
Germany |
France |
United Kingdom |
|
|
1960-1964 |
9.6 |
21.7 |
19.2 |
17.0 |
9.3 |
|
1965-1969 |
10.4 |
22.1 |
16.9 |
18.3 |
10.7 |
|
1970-1974 |
8.9 |
24.9 |
16.2 |
17.6 |
9.1 |
|
1975-1979 |
7.4 |
19.7 |
10.8 |
13.0 |
5.8 |
|
1980-1984 |
5.2 |
17.4 |
8.4 |
7.9 |
4.9 |
|
1985-1989 |
3.8 |
18.9 |
11.2 |
7.8 |
4.7 |
|
1990 |
3.0 |
19.8 |
12.5 |
8.6 |
3.6 |
|
1991 |
2.3 |
20.0 |
10.4 |
7.6 |
2.4 |
|
1992 |
1.2 |
19.5 |
9.8 |
6.5 |
2.0 |
|
aSavings rates shown for the United States differ from those shown in Table 2 because in the OECD accounting, which disaggregates government capital and current expenditure, there is a contribution of the government sector to national savings. In the U.S. national income accounts, all government spending is treated as current expenditure and, therefore, does not contribute to national savings. |
|||||
years into the future, if at all.4 However, deducting certain investments in intangible assets reduces the corporation’s tax liability in the year that the expenses are incurred. In that sense, these investments are favored relative to plant and equipment purchases, which generally must be deducted over time. It is difficult to tell whether in our capital allocation system the favorable tax treatment is or is not outweighed by the negative effect of the downward pressure on reported earnings.
In the early to mid-1980s, the nation’s savings continued to decline whereas gross private domestic investment picked up, producing a large savings gap (Figure 1). The only way this differential has been sustained is by financing from foreign sources, or “foreign saving.” Dependence on foreign capital to maintain U.S. private investment gave rise to several concerns. First, in a simple accounting sense, there is a key difference between domestic and foreign ownership of physical capital. When U.S. investors own assets, the returns from those assets raise the U.S. standard of living. When foreigners own U.S. assets, however, the returns to these
|
4 |
The stock market understands that for a new technology-based company large R&D outlays are needed for future high returns. Later, especially when the firm goes public, analysts shift to more standardized performance measures, such as price-earning ratios. Undertaking a new project may have an adverse effect on analysts’ evaluation, especially if the expenditures are not smooth. This is when the disincentives are a problem. Company balance sheets show no assets to offset R&D expenses, nor can the investors tell the depreciation rate for these. |
TABLE 4 Nonresidential Fixed Investment Including Government Capital Expenditures (Percent of GDP)
|
United States |
Japan |
Germany |
France |
Canada |
United Kingdom |
|
|
1970-1974 |
13.8 |
27.9 |
17.2 |
16.7 |
16.4 |
15.4 |
|
1975-1979 |
14.2 |
24.2 |
14.7 |
15.5 |
16.8 |
15.0 |
|
1980-1984 |
15.1 |
24.0 |
14.6 |
14.6 |
16.5 |
13.2 |
|
1985-1989 |
13.8 |
23.5 |
14.3 |
14.8 |
14.5 |
14.4 |
|
1990 |
12.9 |
26.3 |
15.4 |
16.2 |
14.6 |
15.7 |
|
1991 |
12.0 |
26.4 |
15.7 |
15.7 |
13.8 |
13.9 |
|
1992 |
11.6 |
25.7 |
15.1 |
14.9 |
12.6 |
12.7 |
|
SOURCE: OECD, Annual and Quarterly National Accounts. |
||||||
assets flow abroad and raise the earnings of foreign firms. Just as returns to U.S. companies’ historical investments abroad have contributed to earnings during the last decade, returns from investments in the United States will add to foreign firms’ cash flows in the future.
Second, the U.S. savings shortfall is causing a drain on the worldwide supply of funds at a time when substantial investment is required in many parts of the world, including the countries formerly in the Soviet Union and the countries of Central Europe. The fact that the United States is a large net borrower at this time has been the source of some international friction, primarily in bilateral dealings with Japan but also in the recent General Agreement on Tariffs and Trade negotiations.
Third, until full integration of international financial markets has been achieved—and it is generally agreed that integration has not been achieved with respect to equity capital—a low saving rate relative to the demand for investment funds in the United States will elevate the domestic cost of funds and hence the domestic cost of capital and will retard domestic investment relative to international standards.
Finally, the United States may not always be able to rely on a continued inflow of foreign capital to finance domestic investment. A decade ago, foreigners bailed the United States out of its savings crunch by enabling investment to continue at close to historical levels. The very recent sharp decline in the flow of foreign direct investment into the United States (see Figure 2) relieved some of the concerns described above but emphasized that in the most recent period the U.S. private sector has
TABLE 5 Business Enterprise Research and Development Expenditures (BERD) (Funds Supplied by Enterprises Exclusive of Government Support) (Percent of GDP)
|
United Statesa |
France |
Germany |
Japanb |
United Kingdom |
Canada |
European Union (12)c |
|
|
1981 |
1.17 |
0.79 |
1.39 |
1.38 |
0.91 |
0.49 |
0.52 |
|
1982 |
1.27 |
0.85 |
1.44d |
1.46 |
n.a. |
0.51 |
0.66 |
|
1983 |
1.31 |
0.88 |
1.48 |
1.59 |
0.86 |
0.46 |
0.70 |
|
1984 |
1.37 |
0.90 |
1.50d |
1.68 |
n.a. |
0.48 |
0.74 |
|
1985 |
1.42 |
0.92 |
1.65 |
1.82 |
0.95 |
0.56e |
0.81 |
|
1986 |
1.42 |
0.91 |
1.69d |
1.79 |
1.00e |
0.60 |
0.85 |
|
1987 |
1.37 |
0.92 |
1.80 |
1.83 |
1.02 |
0.56 |
0.89 |
|
1988 |
1.36 |
0.95 |
1.79d |
1.91 |
1.05 |
0.54 |
0.91 |
|
1989 |
1.35 |
0.98 |
1.78 |
2.05 |
1.03 |
0.54 |
0.93 |
|
1990 |
1.35 |
1.01 |
1.68 |
2.15 |
1.00 |
0.58 |
0.94 |
|
1991 |
1.36d |
0.98 |
1.57d |
2.13 |
0.94 |
0.58 |
n.a. |
|
1992 |
n.a. |
2.03 |
0.95 |
0.58 |
n.a. |
||
|
1993 |
n.a. |
n.a. |
n.a. |
n.a. |
n.a. |
||
|
aExcludes most or all capital expenditures. bOverestimated or based on overestimated data. cSecretariate estimate or projection based on national sources. dNational estimate or projection adjusted, if necessary, by the Secretariat to meet OECD norms. eBreak in series with previous year for which data are available. fProvisional. SOURCE: Organization for Economic Cooperation and Development/EAS(STIU Data Base), May 1994. |
|||||||
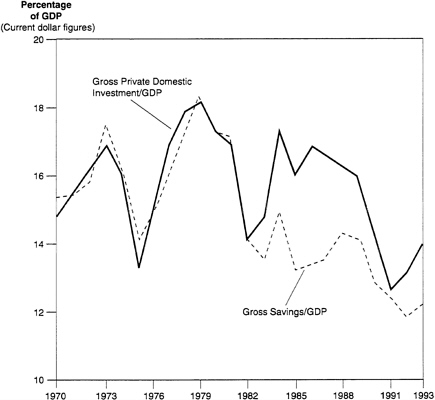
FIGURE 1 The savings gap. SOURCE: Survey of Current usiness, U.S. Department of Commerce.
almost ceased investing more than depreciation. Dependence on foreign capital could again be a problem if in the future new investment increases and the domestic saving rate does not follow. The deficits have been financed by “hot money” flows and government intervention. In addition, U.S. investors have invested large sums in foreign equities and bonds, so that the total external financing needs of the United States were as large as $200 billion in 1993. Such methods of financing are probably not sustainable for such large sums (International Bank Credit Analyst, 1994).5
|
5 |
This is composed of the current account imbalance (approximately $109 billion in 1993) and gross portfolio outflows of the order of $80 billion. |


