
4
LIKELY FUTURE POSITION
Assessment of the publication impact of immunologists and the results of the reputation survey clearly indicate that the United States is in a leadership position in the world in essentially all subfields of immunology. Given current trends, it seems likely that this position will be maintained for the next 5-10 years. However, several factors can adversely affect this position. There are four potential threats to US leadership in immunology:
-
Funding and resource limitations.
-
Increased competition from Europe and other countries.
-
Clinical immunology and the shift toward HMOs.
-
Training of US Students.
Each potential threat is discussed below.
4.1 Funding and Resource Limitations
Current optimism as to the sustained US leadership in immunology is based in large part on a positive attitude toward NIH in the US Congress. That attitude is indicated by the proposals in the last year to double the NIH budget in the next 5-10 years. It must be recognized, however, that this could change. A return to the funding situation of the late 1980s and early 1990s, with low pay grades and administrative cuts in funded-grant applications, could possibly harm the US leadership position by driving investigators and students away from biomedical research in general. It must be recognized that, despite important contributions from the biotechnology and pharmaceutical industries, NIH remains the engine that drives immunology.
The current practice of protecting intellectual property has the potential to restrict the two-way flow of information between academic institutions and the biotechnology industry in the life sciences, including immunology. That applies to reduction in sharing both research materials and information. If the situation occurs on a broad scale, opportunities to explore promising research projects might be restricted.
The growth in the number of material transfer agreements (MTA) that are often overlegalistic and protective of the broadest possible outcomes of the use of potentially proprietary materials has spawned technology-office bureaucracies in industry and in academic institutions; these offices can delay material transfer for months. It would be of great use if a simple, direct, legally binding, universal MTA for both industry and academe could be created and ratified by agreement or use.
The increasing cost of maintaining mouse facilities has raised serious concern among academic researchers. Although the cost of the mice is reasonable, as is the cost of the component of their care that includes husbandry, housing, feeding, and cleaning, as long as the charges match the costs on a species-specific basis, very large increases in charges often result
for the following reasons: specialized veterinary care, which for all species is usually distributed in a species-nonspecific fashion, as are administrative and staff costs; the increased personnel efforts that are required to meet regulatory-compliance needs; and Office of Management and Budget (OMB) indirect-cost allotments.
For example, one US biomedical institution switched from non-species-specific allocation of costs to species-specific allocations (using an independent accounting firm) and lowered mouse charges by 30-40% (Stanford Medical School, 1998). Its former assessed charges exceeded by a factor of 2-5 the actual costs at institutions that use only mice for their research. The high mouse charges are common in the United States, but most laboratories in Europe and Japan are costed more directly or are subsidized. If this trend continues, many US researchers will have great difficulty in financially supporting mouse facilities.
Actions by major funding agencies could relieve much of the burden: First, all costs and resulting charges could be strictly species-specific. Second, cost-accounting for simple husbandry could be separated from that for veterinary-intensive care. Third, efforts to simplify (and, when appropriate, eliminate) regulatory-compliance requirements could be undertaken. Fourth, the A-21 set of guidelines from OMB regarding indirect cost charges for federally-funded research could be reevaluated as to whether animal facilities can be removed from the special-services category, so that indirect costs could be lowered.
4.2 Increased Competition from Europe and Other Countries
In many countries, there appears to be a trend away from the customary hierarchical systems of funding, research, and employment of scientists toward the US system of competitive peer review. There also appears to be a trend toward better funding from government and private agencies and an increasing emergence of the biotechnology industry in many European countries. Together, those factors will enhance the quality of non-US immunology and make it more competitive.
4.3 Clinical Immunology and the Shift Toward HMOs
The clinical impact of immunology has long been limited by clinical subspecialization. For example, although the clinical practice of allergy is separate from other aspects of clinical immunology (such as rheumatology), basic and clinical research in the two fields overlap extensively. Until recently, clinical immunology barely existed as a definable field. Although the situation had shown signs of improving, reports (May et al. 1997; Campbell et al. 1997) indicate that the increasing dominance of HMOs in funding medical care in the United States potentially has an increasingly adverse effect on clinical research in general and clinical immunology in particular. This are several reasons. For example, HMOs compete for patients with academic clinicians, and this means that fewer patients are available for academic clinical trials; this poses a loss of a source of income that has traditionally been a source of funding for academic clinical research and a concurrent loss of jobs and opportunities for training of clinical immunologists.
Figure 4.1 shows the number of US citizens and permanent resident PhD students in immunology, and Table 4.1 and Figure 4.2 show the degree to which they are supported by NIH. As shown in Figure 4.1, the number of PhD students in immunology research has roughly doubled over the last 20 years. The percentage of these students supported by NIH
has varied between 30 and 40% according to Table 4.1 and Figure 4.2 2 . Foreign students are not eligible to receive NIH training grants. The panel believes that this level of funding combined with the increasing time to degree and low wages influenced the quality of US students who entered immunology programs.
4.4 Training of US Students
Panel members perceive the quality of US graduate students and postdoctoral fellows in immunology to be declining. Several factors might contribute to a decline in quality. The trend toward department structures in which students are admitted into a large multidisciplinary program before choosing a specialty offers more varied opportunities for students. Because immunology is often, although inaccurately, viewed as too specialized and less interdisciplinary than other fields, students might be choosing other fields that are considered more general. Graduate study (of 5-7 years) followed by 3-5 years of postdoctoral training at salaries less than those of technicians might lead many talented young US citizens to choose other fields of endeavor. There is also a loss of MD talent in the field because of the cost of education and the salary differentials after completion of degree work.
In the United States, while there has been a downward trend in the number of PhD immunologists in academic positions, there has been a steady increase in the number of non-tenure-track appointments as shown in Table 4.2. In the early 1980s, 50% of immunologists with academic appointments had tenure or were in a tenure-track. In 1995, the proportioned had decreased to about 40%. In the last 15 years, there has been an even more rapid increase in immunologists in industrial careers. Only about 10% of PhD immunologists went into industrial positions after completing their training in 1981, and almost 25% in 1995. The unemployment rate has remained very low 3 . Data for comparisons with other countries were unavailable.
|
2 |
Data in this paragraph from special analysis by NRC Office of Scientific and Engineering Personnel of data from the survey of Doctorate Recipients and the Survey of Earned Doctorates for this study. |
|
3 |
Data in this paragraph from special analysis by NRC Office of Scientific and Engineering Personnel of data from the Survey of Doctorate Recipients for this study. |
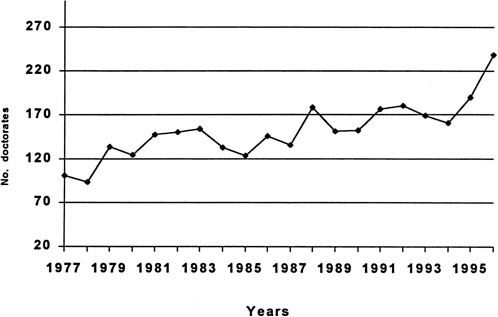
Table 4.1 NIH Trainee and Fellowship Support in Immunology
|
Year |
No. of Doctorates |
No. of Citizens or Permanent-Resident Doctorates |
No. of Doctorates Supported by NIH |
No. of Citizens or Permanent-Resident Supported by NIH |
Fraction of Citizen or Permanent-Resident Doctorates Supported By NIH |
|
1977 |
101 |
90 |
39 |
39 |
43% |
|
1978 |
94 |
86 |
43 |
43 |
50% |
|
1979 |
134 |
131 |
56 |
55 |
42% |
|
1980 |
125 |
119 |
49 |
49 |
41% |
|
1981 |
148 |
141 |
61 |
60 |
43% |
|
1982 |
151 |
136 |
66 |
66 |
49% |
|
1983 |
154 |
137 |
58 |
58 |
42% |
|
1984 |
133 |
121 |
43 |
42 |
35% |
|
1985 |
124 |
113 |
42 |
42 |
37% |
|
1986 |
146 |
129 |
54 |
53 |
41% |
|
1987 |
136 |
113 |
45 |
44 |
39% |
|
1988 |
179 |
164 |
43 |
43 |
26% |
|
1989 |
152 |
136 |
49 |
49 |
36% |
|
1990 |
153 |
129 |
46 |
46 |
36% |
|
1991 |
177 |
140 |
47 |
46 |
33% |
|
1992 |
181 |
155 |
60 |
60 |
39% |
|
1993 |
169 |
131 |
47 |
46 |
35% |
|
1994 |
161 |
143 |
51 |
51 |
36% |
|
1995 |
190 |
171 |
62 |
62 |
36% |
|
1996 |
238 |
198 |
81 |
80 |
40% |
|
Source: Analysis conducted by National Research Council's Office of Scientific and Engineering Personnel of Survey of EarnedDoctorates for this study. |
|||||
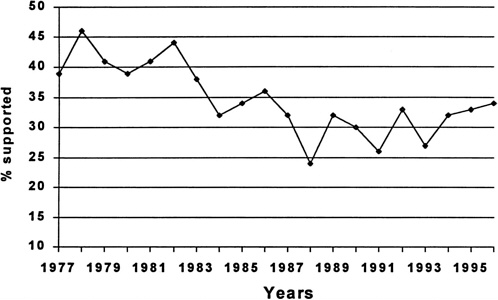
Table 4.2 Employment Status of Doctorates in Immunology
|
1973 |
1975 |
1977 |
1979 |
1981 |
1983 |
1985 |
1987 |
1989 |
1991 |
1993 |
1995 |
|
|
Tenured and Tenure Track Faculty |
0 |
6 |
22 |
146 |
146 |
195 |
166 |
209 |
181 |
306 |
458 |
423 |
|
Tenured Faculty |
0 |
0 |
0 |
1 |
1 |
40 |
101 |
118 |
100 |
137 |
181 |
180 |
|
Tenured Track Faculty |
0 |
6 |
22 |
145 |
145 |
155 |
65 |
91 |
81 |
169 |
277 |
243 |
|
Other Academic Position |
4 |
9 |
21 |
44 |
105 |
167 |
154 |
260 |
385 |
357 |
430 |
445 |
|
Postdoc Appointments-Academic |
0 |
10 |
92 |
131 |
40 |
141 |
172 |
173 |
276 |
305 |
251 |
211 |
|
2 Year College Faculty |
0 |
0 |
24 |
0 |
0 |
12 |
10 |
2 |
0 |
0 |
0 |
18 |
|
Industry |
0 |
22 |
0 |
15 |
48 |
82 |
238 |
255 |
316 |
260 |
419 |
556 |
|
Federal and Other Government Positions |
0 |
0 |
11 |
0 |
39 |
24 |
29 |
56 |
97 |
91 |
128 |
161 |
|
Self Employed and Others |
0 |
7 |
48 |
58 |
106 |
126 |
63 |
97 |
93 |
293 |
97 |
311 |
|
Postdoc Appointments-Other |
9 |
2 |
11 |
20 |
15 |
59 |
114 |
34 |
89 |
89 |
152 |
155 |
|
Unemployed and Seeking |
0 |
5 |
0 |
0 |
34 |
1 |
2 |
0 |
12 |
0 |
42 |
10 |
|
Elementary and High School Teachers |
0 |
0 |
0 |
0 |
0 |
0 |
0 |
0 |
0 |
0 |
30 |
18 |
|
Total |
13 |
61 |
229 |
414 |
533 |
807 |
948 |
1086 |
1449 |
1701 |
2007 |
2308 |
|
Tenured and Tenure Track Faculty |
0.0% |
9.8% |
9.6% |
35.3% |
27.4% |
24.2% |
17.5% |
19.2% |
12.5% |
18.0% |
22.8% |
18.3% |
|
Tenured Faculty |
0.0% |
0.0% |
0.0% |
0.2% |
0.2% |
5.0% |
10.7% |
10.9% |
6.9% |
8.1% |
9.0% |
7.8% |
|
Tenured Track Faculty |
0.0% |
9.8% |
9.6% |
35.0% |
27.2% |
19.2% |
6.9% |
8.4% |
5.6% |
9.9% |
13.8% |
10.5% |
|
Other Academic Position |
30.8% |
14.8% |
9.2% |
10.6% |
19.7% |
20.7% |
16.2% |
23.9% |
26.6% |
21.0% |
21.4% |
19.3% |
|
Postdoc Appointments-Academic |
0.0% |
16.4% |
40.2% |
31.6% |
7.5% |
17.5% |
18.1% |
15.9% |
19.0% |
17.9% |
12.5% |
9.1% |
|
2 Year College Faculty |
0.0% |
0.0% |
10.5% |
0.0% |
0.0% |
1.5% |
1.1% |
0.2% |
0.0% |
0.0% |
0.0% |
0.8% |
|
Industry |
0.0% |
36.1% |
0.0% |
3.6% |
9.0% |
10.2% |
25.1% |
23.5% |
21.8% |
15.3% |
20.9% |
24.1% |
|
Federal and Other Government Positions |
0.0% |
0.0% |
4.8% |
0.0% |
7.3% |
3.0% |
3.1% |
5.2% |
6.7% |
5.3% |
6.4% |
7.0% |
|
Self Employed and Others |
0.0% |
11.5% |
21.0% |
14.0% |
19.9% |
15.6% |
6.6% |
8.9% |
6.4% |
17.2% |
4.8% |
13.5% |
|
Postdoc Appointments-Other |
69.2% |
3.3% |
4.8% |
4.8% |
2.8% |
7.3% |
12.0% |
3.1% |
6.1% |
5.2% |
7.6% |
6.7% |
|
Unemployed and Seeking |
0.0% |
8.2% |
0.0% |
0.0% |
6.4% |
0.1% |
0.2% |
0.0% |
0.8% |
0.0% |
2.1% |
0.4% |
|
Elementary and High School Teachers |
0.0% |
0.0% |
0.0% |
0.0% |
0.0% |
0.0% |
0.0% |
0.0% |
0.0% |
0.0% |
1.5% |
0.8% |
|
Source: Analysis conducted by the National Research Council's Office of Scientic and Engineering Personnel of Survey of DoctorateRecipients for this study. Note that this is a sample study. |
||||||||||||


